marketline industry profile global beermarketline.com/wp-content/uploads/global-beer.pdf ·...
TRANSCRIPT

Global - Beer 0199 - 0744 - 2013
© MARKETLINE THIS PROFILE IS A LICENSED PRODUCT AND IS NOT TO BE PHOTOCOPIED Page | 1
MarketLine Industry Profile
Global Beer August 2014
Reference Code: 0199-0744
Publication Date: August 2014
WWW.MARKETLINE.COM
MARKETLINE. THIS PROFILE IS A LICENSED PRODUCT AND IS NOT TO BE PHOTOCOPIED

Global - Beer 0199 - 0744 - 2013
© MARKETLINE THIS PROFILE IS A LICENSED PRODUCT AND IS NOT TO BE PHOTOCOPIED Page | 2
EXECUTIVE SUMMARY
Market value The global beer market grew by 2.9% in 2013 to reach a value of $514,554.7 million.
Market value forecast In 2018, the global beer market is forecast to have a value of $607,830.5 million, an increase of 18.1% since 2 013.
Market volume The global beer market grew by 2.3% in 2013 to reach a volume of 172,845.4 million liters.
Market volume forecast In 2018, the global beer market is forecast to have a volume of 203,570.4 million liters, an increase of 17.8% since 2013.
Category segmentation Standard lager is the largest segment of the global beer market, accounting for 58% of the market's total value.
Geography segmentation Europe accounts for 37.4% of the global beer market value.
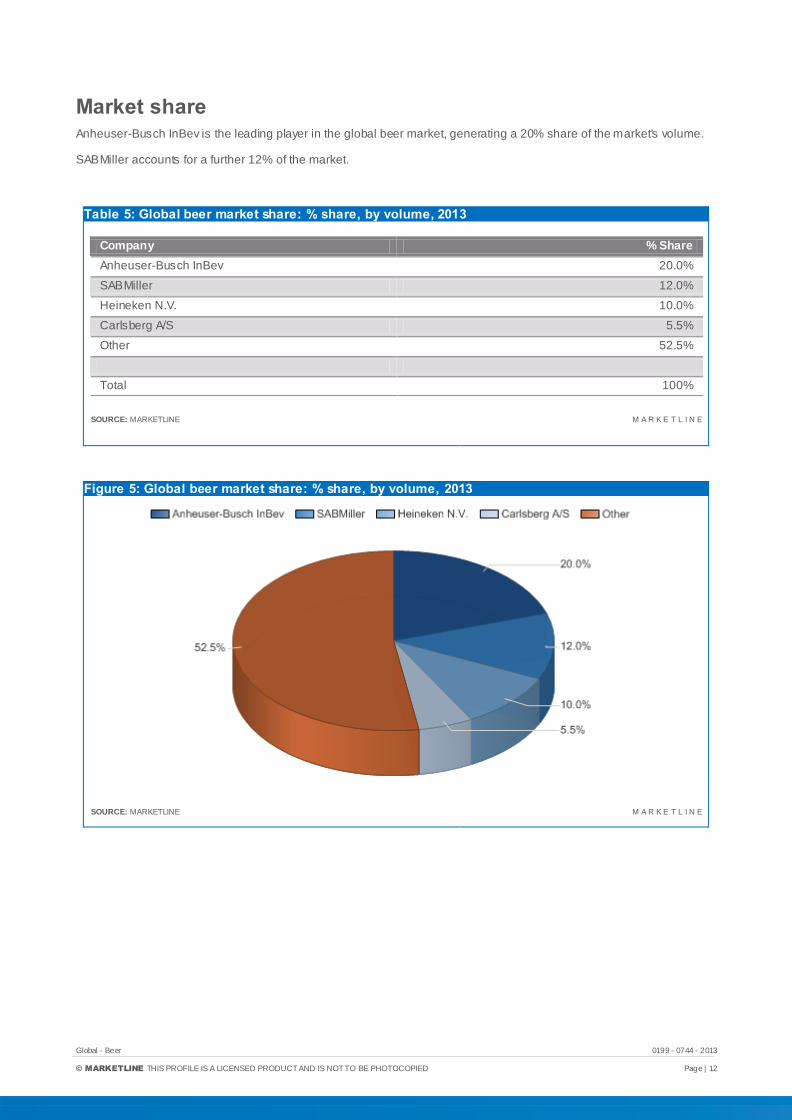
Market share Anheuser-Busch InBev is the leading player in the global beer market, generating a 20% share of the market's volume.
Market rivalry Hefty fixed costs and a highly consolidated market work to drive up rivalry, although moderate market growth has served
to alleviate this somewhat.

Global - Beer 0199 - 0744 - 2013
© MARKETLINE THIS PROFILE IS A LICENSED PRODUCT AND IS NOT TO BE PHOTOCOPIED Page | 3
TABLE OF CONTENTS
Executive Summary..........................................................................................................................................................................2
Market value ..................................................................................................................................................................................2
Market value forecast...................................................................................................................................................................2
Market volume...............................................................................................................................................................................2
Market volume forecast ...............................................................................................................................................................2
Category segmentation................................................................................................................................................................2
Geography segmentation ............................................................................................................................................................2
Market share..................................................................................................................................................................................2
Market rivalry .................................................................................................................................................................................2
Market Overview ...............................................................................................................................................................................7
Market definition............................................................................................................................................................................7
Market analysis .............................................................................................................................................................................7
Market Data........................................................................................................................................................................................8
Market value ..................................................................................................................................................................................8
Market volume...............................................................................................................................................................................9
Market Segmentation .....................................................................................................................................................................10
Category segmentation..............................................................................................................................................................10
Geography segmentation ..........................................................................................................................................................11
Market share................................................................................................................................................................................12
Market distribution ......................................................................................................................................................................13
Market Outlook ................................................................................................................................................................................14
Market value forecast.................................................................................................................................................................14
Market volume forecast .............................................................................................................................................................15
Five Forces Analysis ......................................................................................................................................................................16
Summary ......................................................................................................................................................................................16
Buyer power.................................................................................................................................................................................17
Supplier power ............................................................................................................................................................................18
New entrants ...............................................................................................................................................................................19
Threat of substitutes...................................................................................................................................................................20
Degree of rivalry..........................................................................................................................................................................21
Leading Companies........................................................................................................................................................................22

Global - Beer 0199 - 0744 - 2013
© MARKETLINE THIS PROFILE IS A LICENSED PRODUCT AND IS NOT TO BE PHOTOCOPIED Page | 4
Anheuser-Busch InBev SA/NV .................................................................................................................................................22
Carlsberg A/S ..............................................................................................................................................................................26
Heineken Holding NV.................................................................................................................................................................29
SABMiller plc ...............................................................................................................................................................................33
Appendix...........................................................................................................................................................................................36
Methodology ................................................................................................................................................................................36
Industry associations..................................................................................................................................................................37
Related MarketLine research....................................................................................................................................................37

Global - Beer 0199 - 0744 - 2013
© MARKETLINE THIS PROFILE IS A LICENSED PRODUCT AND IS NOT TO BE PHOTOCOPIED Page | 5
LIST OF TABLES
Table 1: Global beer market value: $ million, 2009–13 ..............................................................................................................8
Table 2: Global beer market volume: million liters, 2009–13.....................................................................................................9
Table 3: Global beer market category segmentation: $ million, 2013 ....................................................................................10
Table 4: Global beer market geography segmentation: $ million, 2013.................................................................................11
Table 5: Global beer market share: % share, by volume, 2013 ..............................................................................................12
Table 6: Global beer market distribution: % share, by value, 2013 ........................................................................................13
Table 7: Global beer market value forecast: $ million, 2013–18 .............................................................................................14
Table 8: Global beer market volume forecast: million liters, 2013–18 ...................................................................................15
Table 9: Anheuser-Busch InBev SA/NV: key facts ....................................................................................................................22
Table 10: Anheuser-Busch InBev SA/NV: key financials ($) ...................................................................................................23
Table 11: Anheuser-Busch InBev SA/NV: key financial ratios ................................................................................................24
Table 12: Carlsberg A/S: key facts ...............................................................................................................................................26
Table 13: Carlsberg A/S: key financials ($) ................................................................................................................................27
Table 14: Carlsberg A/S: key financials (DKK) ..........................................................................................................................27
Table 15: Carlsberg A/S: key financial ratios .............................................................................................................................27
Table 16: Heineken Holding NV: key facts .................................................................................................................................29
Table 17: Heineken Holding NV: key financials ($) ...................................................................................................................30
Table 18: Heineken Holding NV: key financials (€) ...................................................................................................................30
Table 19: Heineken Holding NV: key financial ratios ................................................................................................................31
Table 20: SABMiller plc: key facts ................................................................................................................................................33
Table 21: SABMiller plc: key financials ($) .................................................................................................................................34
Table 22: SABMiller plc: key financial ratios...............................................................................................................................34

Global - Beer 0199 - 0744 - 2013
© MARKETLINE THIS PROFILE IS A LICENSED PRODUCT AND IS NOT TO BE PHOTOCOPIED Page | 6
LIST OF FIGURES
Figure 1: Global beer market value: $ million, 2009–13 .............................................................................................................8
Figure 2: Global beer market volume: million liters, 2009–13 ...................................................................................................9
Figure 3: Global beer market category segmentation: % share, by value, 2013..................................................................10
Figure 4: Global beer market geography segmentation: % share, by value, 2013 ..............................................................11
Figure 5: Global beer market share: % share, by volume, 2013.............................................................................................12
Figure 6: Global beer market distribution: % share, by value, 2013.......................................................................................13
Figure 7: Global beer market value forecast: $ million, 2013–18............................................................................................14
Figure 8: Global beer market volume forecast: million liters, 2013–18 ..................................................................................15
Figure 9: Forces driving competition in the global beer market, 2013 ...................................................................................16
Figure 10: Drivers of buyer power in the global beer market, 2013........................................................................................17
Figure 11: Drivers of supplier power in the global beer market, 2013....................................................................................18
Figure 12: Factors influencing the likelihood of new entrants in the global beer market, 2013 .........................................19
Figure 13: Factors influencing the threat of substitutes in the global beer market, 2013....................................................20
Figure 14: Drivers of degree of rivalry in the global beer market, 2013 .................................................................................21
Figure 15: Anheuser-Busch InBev SA/NV: revenues & profitability .......................................................................................24
Figure 16: Anheuser-Busch InBev SA/NV: assets & liabilities ................................................................................................25
Figure 17: Carlsberg A/S: revenues & profitability.....................................................................................................................28
Figure 18: Carlsberg A/S: assets & liabilities .............................................................................................................................28
Figure 19: Heineken Holding NV: revenues & profitability .......................................................................................................31
Figure 20: Heineken Holding NV: assets & liabilities ................................................................................................................32
Figure 21: SABMiller plc: revenues & profitability......................................................................................................................35
Figure 22: SABMiller plc: assets & liabilities...............................................................................................................................35

Global - Beer 0199 - 0744 - 2013
© MARKETLINE THIS PROFILE IS A LICENSED PRODUCT AND IS NOT TO BE PHOTOCOPIED Page | 7
MARKET OVERVIEW
Market definition The beer market consists of retail sales of ales, stouts & bitters, low/no alcohol beers, premium lager, specialty beers
and standard lager. The market is valued according to retail selling price (RSP) and includes any applicable taxes. Any
currency conversions used in the creation of this report have been calculated using constant 2013 annual average
exchange rates.
For the purposes of this report, the global market consists of North America, South America, Western Europe, Eastern
Europe, MEA, and Asia-Pacific.
North America consists of Canada, Mexico, and the United States.
South America comprises Argentina, Brazil, Colombia, and Venezuela.
Western Europe comprises Austria, Belgium, Denmark, France, Finland, Germany, Greece, Italy, Ireland, the
Netherlands, Norway, Portugal, Spain, Sweden, Switzerland, and the United Kingdom.
Eastern Europe comprises the Czech Republic, Hungary, Poland, Romania, Russia, and Turkey.
Asia-Pacific comprises Australia, China, Hong Kong, India, Indonesia, Japan, Malaysia, New Zealand, Philippines,
Singapore, South Korea, Taiwan, Thailand, and Vietnam.
Middle East-Africa (MEA) comprises Nigeria, Saudi Arabia, South Africa, and United Arab Emirates.
Market analysis The global beer market saw a moderate rate of value growth through the years 2009 -2013. Over the forecast period
2013-2018, this growth is expected to accelerate slightly, while remaining moderate overall.
The global beer market had total revenues of $514.6bn in 2013, representing a compound annual growth rate (CAGR) of
2.7% between 2009 and 2013. In comparison, the European and Asia-Pacific markets grew with CAGRs of 1.7% and
4.6% respectively, over the same period, to reach respective values of $192.6bn and $169.2bn in 2013.
Market volume increased with a CAGR of 2.1% between 2009 and 2013, to reach a total of 172.8 billion liters in 2013.
The market's volume is expected to rise to 203.6 billion liters by the end of 2018, representing a CAGR of 3.3% for the
2013-2018 period.
The standard lager segment was the market's most lucrative in 2013, with total revenues of $298,301.7m, equivalent to
58% of the market's overall value. The premium lager segment contributed revenues of $132,988.7m in 2013, equating
to 25.8% of the market's aggregate value.
The performance of the market is forecast to accelerate, with an anticipated CAGR of 3.4% for the five -year period 2013
- 2018, which is expected to drive the market to a value of $607.8bn by the end of 2018. Comparatively, the European
and Asia-Pacific markets will grow with CAGRs of 2.4% and 5.5% respectively, over the same period, to reach
respective values of $216.8bn and $221.3bn in 2018.

Global - Beer 0199 - 0744 - 2013
© MARKETLINE THIS PROFILE IS A LICENSED PRODUCT AND IS NOT TO BE PHOTOCOPIED Page | 8
MARKET DATA
Market value The global beer market grew by 2.9% in 2013 to reach a value of $514,554.7 million.
The compound annual growth rate of the market in the period 2009–13 was 2.7%.
Table 1: Global beer market value: $ million, 2009–13
Year $ million € million % Growth
2009 462,235.3 348,042.5
2010 472,427.6 355,716.9 2.2%
2011 486,214.6 366,097.9 2.9%
2012 499,990.3 376,470.4 2.8%
2013 514,554.7 387,436.7 2.9%
CAGR: 2009–13 2.7%
SOURCE: MARKETLINE M A R K E T L I N E
Figure 1: Global beer market value: $ million, 2009–13
SOURCE: MARKETLINE M A R K E T L I N E

Global - Beer 0199 - 0744 - 2013
© MARKETLINE THIS PROFILE IS A LICENSED PRODUCT AND IS NOT TO BE PHOTOCOPIED Page | 9
Market volume The global beer market grew by 2.3% in 2013 to reach a volume of 172,845.4 million li ters.
The compound annual growth rate of the market in the period 2009–13 was 2.1%.
Table 2: Global beer market volume: million liters, 2009–13
Year million liters % Growth
2009 159,048.1
2010 161,629.6 1.6%
2011 165,084.9 2.1%
2012 168,992.4 2.4%
2013 172,845.4 2.3%
CAGR: 2009–13 2.1%
SOURCE: MARKETLINE M A R K E T L I N E
Figure 2: Global beer market volume: million liters, 2009–13
SOURCE: MARKETLINE M A R K E T L I N E

Global - Beer 0199 - 0744 - 2013
© MARKETLINE THIS PROFILE IS A LICENSED PRODUCT AND IS NOT TO BE PHOTOCOPIED Page | 10
MARKET SEGMENTATION
Category segmentation Standard lager is the largest segment of the global beer market, accounting for 58% of the market's total value.
The Premium lager segment accounts for a further 25.8% of the market.
Table 3: Global beer market category segmentation: $ million, 2013
Category 2013 %
Standard lager 298,301.7 58.0%
Premium lager 132,988.7 25.8%
Specialty beer 45,310.4 8.8%
Ales, stouts & bitters 22,077.5 4.3%
Low/no alcohol 15,876.4 3.1%
Total 514,554.7 100%
SOURCE: MARKETLINE M A R K E T L I N E
Figure 3: Global beer market category segmentation: % share, by value, 2013
SOURCE: MARKETLINE M A R K E T L I N E

Global - Beer 0199 - 0744 - 2013
© MARKETLINE THIS PROFILE IS A LICENSED PRODUCT AND IS NOT TO BE PHOTOCOPIED Page | 11
Geography segmentation Europe accounts for 37.4% of the global beer market value.
Asia-Pacific accounts for a further 32.9% of the global market.
Table 4: Global beer market geography segmentation: $ million, 2013
Geography 2013 %
Europe 192,639.0 37.4
Asia-Pacific 169,154.8 32.9
Americas 143,640.2 27.9
Middle East & Africa 9,120.7 1.8
Total 514,554.7 100%
SOURCE: MARKETLINE M A R K E T L I N E
Figure 4: Global beer market geography segmentation: % share, by value, 2013
SOURCE: MARKETLINE M A R K E T L I N E
Global - Beer 0199 - 0744 - 2013
© MARKETLINE THIS PROFILE IS A LICENSED PRODUCT AND IS NOT TO BE PHOTOCOPIED Page | 12
Market share Anheuser-Busch InBev is the leading player in the global beer market, generating a 20% share of the market's volume.
SABMiller accounts for a further 12% of the market.
Table 5: Global beer market share: % share, by volume, 2013
Company % Share
Anheuser-Busch InBev 20.0%
SABMiller 12.0%
Heineken N.V. 10.0%
Carlsberg A/S 5.5%
Other 52.5%
Total 100%
SOURCE: MARKETLINE M A R K E T L I N E
Figure 5: Global beer market share: % share, by volume, 2013
SOURCE: MARKETLINE M A R K E T L I N E

Global - Beer 0199 - 0744 - 2013
© MARKETLINE THIS PROFILE IS A LICENSED PRODUCT AND IS NOT TO BE PHOTOCOPIED Page | 13
Market distribution Supermarkets / hypermarkets form the leading distribution channel in the global beer market, accounting for a 44.8%
share of the total market's value.
On-trade accounts for a further 32.9% of the market.
Table 6: Global beer market distribution: % share, by value, 2013
Channel % Share
Supermarkets / hypermarkets 44.8%
On-trade 32.9%
Specialist Retailers 11.4%
Convenience Stores 3.4%
Other 7.5%
Total 100%
SOURCE: MARKETLINE M A R K E T L I N E
Figure 6: Global beer market distribution: % share, by value, 2013
SOURCE: MARKETLINE M A R K E T L I N E

Global - Beer 0199 - 0744 - 2013
© MARKETLINE THIS PROFILE IS A LICENSED PRODUCT AND IS NOT TO BE PHOTOCOPIED Page | 14
MARKET OUTLOOK
Market value forecast In 2018, the global beer market is forecast to have a value of $607,830.5 million, an increase of 18.1% since 2013.
The compound annual growth rate of the market in the period 2013–18 is predicted to be 3.4%.
Table 7: Global beer market value forecast: $ million, 2013–18
Year $ million € million % Growth
2013 514,554.7 387,436.7 2.9%
2014 530,976.3 399,801.5 3.2%
2015 548,636.5 413,098.8 3.3%
2016 568,529.8 428,077.6 3.6%
2017 588,001.4 442,738.8 3.4%
2018 607,830.5 457,669.2 3.4%
CAGR: 2013–18 3.4%
SOURCE: MARKETLINE M A R K E T L I N E
Figure 7: Global beer market value forecast: $ million, 2013–18
SOURCE: MARKETLINE M A R K E T L I N E

Global - Beer 0199 - 0744 - 2013
© MARKETLINE THIS PROFILE IS A LICENSED PRODUCT AND IS NOT TO BE PHOTOCOPIED Page | 15
Market volume forecast In 2018, the global beer market is forecast to have a volume of 203,570.4 million liters, an increase of 17.8% since 2013.
The compound annual growth rate of the market in the period 2013–18 is predicted to be 3.3%.
Table 8: Global beer market volume forecast: million liters, 2013–18
Year million liters % Growth
2013 172,845.4 2.3%
2014 178,043.4 3.0%
2015 183,958.2 3.3%
2016 190,303.8 3.4%
2017 196,844.2 3.4%
2018 203,570.4 3.4%
CAGR: 2013–18 3.3%
SOURCE: MARKETLINE M A R K E T L I N E
Figure 8: Global beer market volume forecast: million liters, 2013–18
SOURCE: MARKETLINE M A R K E T L I N E

Global - Beer 0199 - 0744 - 2013
© MARKETLINE THIS PROFILE IS A LICENSED PRODUCT AND IS NOT TO BE PHOTOCOPIED Page | 16
FIVE FORCES ANALYSIS
The beer market will be analyzed taking manufacturers of beer as players. The key buyers will be taken as retail and on -
trade companies, and producers of malted grain, hops and bottles or barrels as the key suppliers.
Summary
Figure 9: Forces driving competition in the global beer market, 2013
SOURCE: MARKETLINE M A R K E T L I N E
Hefty fixed costs and a highly consolidated market work to drive up rivalry, although moderate market growth has served
to alleviate this somewhat.
Buyer power in this market is driven up by low switching costs and the large size of many buyers, but tempered by
buyers' need to stock a wide variety of beers in order to remain competitive.
Many suppliers in this market, particularly hop growers, are small and numerous, limiting their ability to influence market
players. Larger breweries are usually also capable of some degree of vertical integration, weakening suppliers' positions
further. Raw materials are important to this industry though, and not all suppliers depend on the beer industry primarily;
both of these factors strengthen supplier power.
For new entrants, the heavy investment required in production capacity constitutes one barrier, and government
regulation another. Higher-end beers can command higher prices, however, which can allow smaller players an initial
foothold in the market as a microbrewery.
Switching costs in this market are fairly low which increases the risk of substitutes, and alternatives such as wines or
spirits are often cheaper and easier to store and transport. On the other hand, most buyers will need to stock a range of
alcoholic and non-alcoholic beverages, making it difficult to forego beer completely.

Global - Beer 0199 - 0744 - 2013
© MARKETLINE THIS PROFILE IS A LICENSED PRODUCT AND IS NOT TO BE PHOTOCOPIED Page | 17
Buyer power
Figure 10: Drivers of buyer power in the global beer market, 2013
SOURCE: MARKETLINE M A R K E T L I N E
Supermarkets and hypermarkets are the major buyers in the global beer market, accounting for 44.8% of sales. Within
individual countries, especially in Western Europe, supermarket chains may be highly concentrated in the food and
beverage retail market. Such buyers are often able to negotiate favorable terms on price with b eer producers; this
increases buyer power significantly.
Switching costs for buyers are low, which increases buyer power in all markets.
Beer producers can differentiate their products quite strongly in a variety of ways, not only by the overall segment (lager
or bitter, for example) but also by brand, strength, ingredients, and style, among other options.
Major buyers generally need to offer a wide range of beers to accommodate consumer preferences. This undermines
buyer power. Furthermore, producers and retailers operate in distinct businesses, with very little likelihood of forward or
backward integration. Overall, buyer power is assessed as moderate.

Global - Beer 0199 - 0744 - 2013
© MARKETLINE THIS PROFILE IS A LICENSED PRODUCT AND IS NOT TO BE PHOTOCOPIED Page | 18
Supplier power
Figure 11: Drivers of supplier power in the global beer market, 2013
SOURCE: MARKETLINE M A R K E T L I N E
The main inputs for beer producers are malted grain, hops and bottles or barrels. Traditionally, beer makers operated
non-vertically integrated businesses: buying hops from independent producers along with either barley from farmers for
processing at the brewery’s own malting house, or malted barley from third -party producers. Beer would then be
packaged on site. However, the scale of the dominant multinational players in the market means that some breweries
now incorporate some degree of vertical integration, weakening supplier power. Independent hop growers are numerous,
and include some fairly small operations, which further weakens supplier power. Independent barley growers can find
alternative markets, reducing their dependency on the beer market. For example, barley can be sold for animal feed and
malted barley for distillation in the production of spirits, and it is also possible to integrate forwards into beer -making.
These factors augment supplier power. Raw material quality is highly important in this business: the end product is
strongly influenced by the nature of the ingredients used. Overall, there is a moderate degree of supplier power.

Global - Beer 0199 - 0744 - 2013
© MARKETLINE THIS PROFILE IS A LICENSED PRODUCT AND IS NOT TO BE PHOTOCOPIED Page | 19
New entrants
Figure 12: Factors influencing the likelihood of new entrants in the global beer market, 2013
SOURCE: MARKETLINE M A R K E T L I N E
Heavy investment in production equipment is required before entry in to this market, but this can be recovered by adding
a good margin to the price of the end-product. Since high quality beers can command premium prices, it is possible to
enter the market on a small scale, as a 'microbrewery'.
Larger companies, however, tend to rely on the mass -market production of internationally palatable lagers; here, margins
may be much lower.
Producers need to distribute their products widely, so often depend heavily upon retail channels such as supermarkets.
Despite the presence of company-owned on-trade outlets, these retail chains often have considerable buyer power,
which can force down the prices that beer producers are able to obtain. In such a market, economies of scale become
much more important. As a result, barriers to entry, such as the capital outlay on large scale production equipment, and
the need to establish reliable supply chains from multiple third-party hop and barley growers, become much higher as
players approach the mass market.
Government regulation of beer and other alcoholic beverages is stringent in many countries, which may also impact on
the ease of market entry.
Overall, the threat of new entrants to this market is assessed as moderate.

Global - Beer 0199 - 0744 - 2013
© MARKETLINE THIS PROFILE IS A LICENSED PRODUCT AND IS NOT TO BE PHOTOCOPIED Page | 20
Threat of substitutes
Figure 13: Factors influencing the threat of substitutes in the global beer market, 2013
SOURCE: MARKETLINE M A R K E T L I N E
The main substitutes for beer are other alcoholic beverages such as spirits, cider and wine, and in some cases non -
alcoholic beverages such as functional drinks. Switching costs are not high, and per-unit-volume prices are higher for
beer than for spirits or wine, for both consumers and distributers.
The potential benefits and drawbacks of alternatives to beer are rather difficult to pin down. Most retailers and
distributors will find they need to stock a combination of beer and its potential substitutes in order to please the widest
possible range of customers, but some restaurants for example may feel as though their wines make up a much more
important part of their menu. Conversely, for many pubs, beer is indispensable, while wines and spirits seem of
secondary importance. On a practical level, alternatives such as wines and spirits may seem more attractive: beer is
comparatively heavy, bulky, and might need refrigerating before sale. This drives up distribution and stora ge costs.
Overall, there is a moderate threat from substitutes.

Global - Beer 0199 - 0744 - 2013
© MARKETLINE THIS PROFILE IS A LICENSED PRODUCT AND IS NOT TO BE PHOTOCOPIED Page | 21
Degree of rivalry
Figure 14: Drivers of degree of rivalry in the global beer market, 2013
SOURCE: MARKETLINE M A R K E T L I N E
The global beer market is fairly consolidated, with the top four players controlling 47.5% of the market.
Some large beer producers have begun to employ brand management strategies in order to ensure their brand is
identifiable to the public. This is especially important because purchasers have a wide variety of beers to choose from,
and incur only low switching costs when changing brands. Major players may offer premium beers, but much of their
business involves mass-market products; this means large breweries are required, and therefore that players in this
market endure high fixed costs. At the same time, beer prices are subject to heavy downward pressure by large chain
retailers, which are often able to exert strong bargaining power.
Overall, rivalry is assessed as strong.

Global - Beer 0199 - 0744 - 2013
© MARKETLINE THIS PROFILE IS A LICENSED PRODUCT AND IS NOT TO BE PHOTOCOPIED Page | 22
LEADING COMPANIES
Anheuser-Busch InBev SA/NV
Table 9: Anheuser-Busch InBev SA/NV: key facts
Head office: Brouwerijplein 1, 3000 Leuven, BEL
Telephone: 32 16 27 61 11
Fax: 32 16 50 61 11
Website: www.ab-inbev.com
Financial year-end: December
Ticker: ABI
Stock exchange: Euronext Brussels
SOURCE: COMPANY WEBSITE M A R K E T L I N E
AB InBev is engaged in the production, distribution and sale of beer and soft drinks. The company has operations in 23
countries across the world.
The company offers a portfolio of over 200 brands, including global flagship brands Budweiser, Stella Artois and Beck's
and multi-country brands Leffe and Hoegaarden. In addition, the company offers local brands including Bud Light,
Michelob Ultra, Skol, Brahma, Antarctica, Quilmes, Jupiler, Hasseroder, Klinskoye, Sibirskaya Korona, Chernigivske,
Harbin and Sedrin. The company also produces and distributes soft drinks, particularly in Latin America. AB InBev
operates through seven business segments: North America, Latin America North, Western Europe, Latin America South,
Asia Pacific, Central and Eastern Europe, and global export and holding companies.
The North American segment includes the Anheuser-Busch Companies in the US and the Labatt Breweries (Labatt) in
Canada. Some of the key global brands sold in this zone include Budweiser, Stella Artois and Beck's. Additionally, the
company sells several local brands such as Bass, Bud Light, Busch, Michelob, Goose Island, Shock Top and Natural
Light in the US and Alexander Keith's, Bass, Bud Light, Kokanee, Labatt, Lucky, Lakeport and Oland in Canada. The
company operates 19 beverage manufacturing plants through this segment. AB InBev also imports and distributes
Budweiser, Bud Light and O'Doul's brands in Mexico through its wholly-owned subsidiary, Grupo Modelo, a brewer and
owner of Corona-branded beer.
The Latin America North segment encompasses the company's operations in Brazil, the Dominican Republic, Ecuador,
Guatemala and Peru. In Brazil, the company operates through i ts subsidiary, Companhia de Bebidas das Americas -
AmBev (AmBev), which sells local beer brands such as Antarctica, Bohemia, Brahma and Skol, amongst other
international brands. The segment is also engaged in the manufacture and sale of several soft drinks b rands including
Pepsi, 7UP and Red Rock among others, under licenses in the region. The segment operates 36 manufacturing plants
across the region.
The Western Europe segment includes the company's operations in Belgium, France, Germany, Luxembourg, the
Netherlands, the UK and Italy. InBev Belgium and AB InBev UK are the operating subsidiaries of the company in the
respective countries, while the company operates through Anheuser-Busch InBev Deutschland in Germany. The
segment has 16 beer manufacturing plants operating in the region that produce international brands such as Budweiser,
Stella Artois and Beck's. The segment also sells several local brands in the region, including Belle -Vue, Jupiler, Vieux
Temps, Diebels, Franziskaner, Haake-Beck, Boddington's, Brahma, Whitbread and Mackeson.

Global - Beer 0199 - 0744 - 2013
© MARKETLINE THIS PROFILE IS A LICENSED PRODUCT AND IS NOT TO BE PHOTOCOPIED Page | 23
The Latin America South segment includes operations in Argentina, Bolivia, Chile, Paraguay and Uruguay. In Argentina,
AB InBev operates through its subsidiary Cerveceria y Malteria Quilmes. The segment is also engaged in th e
manufacture and sale of soft drinks under licensed brand names (Pepsi, H2OH! and 7UP) in Argentina, Bolivia and
Uruguay. The segment operates 23 beverage manufacturing units across the region which produce and sell international
brands such as Hoegaarden and Leffe. The company also sells several local brands in the region, including Andes,
Brahma, Norte, Patagonia, Quilmes and Antarctica, Bohemia and Skol.
The Asia-Pacific segment primarily consists of the company's operations in China through the Anheuse r-Busch InBev
China subsidiary. The company has 36 beer manufacturing facilities across China that manufacture and sell several
international, multi-country and local brands including Budweiser, Stella Artois, Beck's, Hoegaarden, Leffe, Double Deer,
Harbin, Jinling, Jinlongquan, KK, Sedrin and Shiliang.
The Central and Eastern Europe segment primarily comprises the company's operations in Russia and Ukraine through
SUN InBev Russia and SUN InBev Ukraine subsidiaries, respectively. Besides the international brands, the segment
manufactures and sells beers under several local brands such as Bagbier, Brahma, Klinskoye, Lowenbrau, Sibirskaya
Korona, T and Tolstiak in Russia. Additionally, the Ukrainian subsidiary manufactures and sells local brands of beer such
as Chernigivske, Rogan and Yantar in the country. The segment operates 11 beverage manufacturing plants in Russia
and Ukraine.
The global export and holding companies segment includes the export sales as well as the intra -group transactions.
Key Metrics
The company recorded revenues of $43,195m in the fiscal year ending December 2013, an increase of 8.6% compared
to fiscal 2012. Its net income was $14,394m in fiscal 2013, compared to a net income of $7,243m in the preceding year.
Table 10: Anheuser-Busch InBev SA/NV: key financials ($)
$ million 2009 2010 2011 2012 2013
Revenues 36,758.0 36,297.0 39,046.0 39,758.0 43,195.0
Net income (loss) 4,613.0 4,026.0 5,885.0 7,243.0 14,394.0
Total assets 112,525.0 114,342.0 112,427.0 122,621.0 141,666.0
Total liabilities 79,354.0 75,543.0 71,383.0 77,180.0 86,358.0
Employees 116,000 114,000 116,000 116,278 117,632
SOURCE: COMPANY FILINGS M A R K E T L I N E

Global - Beer 0199 - 0744 - 2013
© MARKETLINE THIS PROFILE IS A LICENSED PRODUCT AND IS NOT TO BE PHOTOCOPIED Page | 24
Table 11: Anheuser-Busch InBev SA/NV: key financial ratios
Ratio 2009 2010 2011 2012 2013
Profit margin 12.5% 11.1% 15.1% 18.2% 33.3%
Revenue growth 56.4% (1.3%) 7.6% 1.8% 8.6%
Asset growth (0.6%) 1.6% (1.7%) 9.1% 15.5%
Liabilities growth (11.2%) (4.8%) (5.5%) 8.1% 11.9%
Debt/asset ratio 70.5% 66.1% 63.5% 62.9% 61.0%
Return on assets 4.1% 3.5% 5.2% 6.2% 10.9%
Revenue per employee $316,879 $318,395 $336,603 $341,922 $367,205
Profit per employee $39,767 $35,316 $50,733 $62,290 $122,365
SOURCE: COMPANY FILINGS M A R K E T L I N E
Figure 15: Anheuser-Busch InBev SA/NV: revenues & profi tability
SOURCE: COMPANY FILINGS M A R K E T L I N E

Global - Beer 0199 - 0744 - 2013
© MARKETLINE THIS PROFILE IS A LICENSED PRODUCT AND IS NOT TO BE PHOTOCOPIED Page | 25
Figure 16: Anheuser-Busch InBev SA/NV: assets & liabilities
SOURCE: COMPANY FILINGS M A R K E T L I N E

Global - Beer 0199 - 0744 - 2013
© MARKETLINE THIS PROFILE IS A LICENSED PRODUCT AND IS NOT TO BE PHOTOCOPIED Page | 26
Carlsberg A/S
Table 12: Carlsberg A/S: key facts
Head office: 100 Ny Carlsberg Vej, 1799 Copenhagen V, DNK
Telephone: 45 3327 3300
Fax: 45 3327 4701
Website: www.carlsberggroup.com
Financial year-end: December
Ticker: CARL
Stock exchange: Copenhagen
SOURCE: COMPANY WEBSITE M A R K E T L I N E
Carlsberg is one of the leading brewing companies in the world. It is engaged in the production, marketing and sale of
beer under more than 500 brands. Carlsberg's beer range comprises pilsner, strong pilsner, non-alcoholic beer, seasonal
brews, wheat beer, ale, stout, Vienna, Munich, Blonde Ale, light pilsner, bock and barley wine. The brand portfolio
includes well-known international premium brands such as Carlsberg, Tuborg, Baltika and Kronenbou rg 1664, and
strong local brands such as Ringnes (sold in Norway), Feldschlosschen (Switzerland), Lav (Serbia) and Wusu (Western
China).
Apart from beer, the company also produces soft drinks, energy drinks and bottled water. Carlsberg has presence in
more than 150 countries across the world.
In accordance with the company's management and reporting structure, beverage activities are segmented according to
the geographical regions where production takes place. The company operates through three geographic s egments:
Northern and Western Europe, Eastern Europe and Asia.
In the Northern and Western Europe segment, Carlsberg has a strong presence in Denmark, Sweden, Norway, Finland
and the three Baltic States. Other significant markets of Carlsberg within Western Europe include the UK, Germany,
France, Switzerland and Poland, among others. In the region, the company operates across 18 countries through a
network of 25 breweries spread across the region.
The Eastern Europe segment has a significant presence in the growth markets of Russia and the Ukraine. The company
also has a presence in the emerging beer markets of this region, including Kazakhstan, Uzbekistan, Belarus and
Azerbaijan. The company operates 17 breweries across six countries in this region, including 10 in Russia alone.
The Asia segment comprises the company's operations across Hong Kong, Malaysia, Singapore, China, Vietnam and
India. Other markets included in the Asia segment are Cambodia, Laos, Malawi, Sri Lanka and Nepal. Carlsberg
operates through a network of 57 breweries spread across 11 countries in Asia, with 41 of them in China alone.
Additionally, Carlsberg exports its various products to more than 100 markets and has license agreements in 26
countries around the world. Carlsberg Export License and Duty Free (ExLiD) is responsible for the group's export and
license business in markets where Carlsberg does not have its own breweries. Through ExLiD, Carlsberg's international
portfolio of beer brands (including Carlsberg, Tuborg, Kronenbourg 1664, and Holsten) is available in more than 100
markets around the world. Furthermore, ExLiD is in charge of duty free sales to airports, airlines, ferry lines, and border
trade.
Key Metrics
The company recorded revenues of $11,846m in the fiscal year ending December 2013, a decrease of 1.0% compared
to fiscal 2012. Its net income was $974m in fiscal 2013, compared to a net income of $998m in the preceding year.

Global - Beer 0199 - 0744 - 2013
© MARKETLINE THIS PROFILE IS A LICENSED PRODUCT AND IS NOT TO BE PHOTOCOPIED Page | 27
Table 13: Carlsberg A/S: key financials ($)
$ million 2009 2010 2011 2012 2013
Revenues 10,569.8 10,689.4 11,313.6 11,961.5 11,846.0
Net income (loss) 741.7 1,060.9 1,013.2 998.0 973.8
Total assets 23,943.1 25,675.9 26,292.5 27,405.2 26,902.0
Total liabilities 14,183.8 14,240.0 16,547.2 14,295.8 14,175.4
Employees 45,505 41,402 42,670 41,708 40,435
SOURCE: COMPANY FILINGS M A R K E T L I N E
Table 14: Carlsberg A/S: key financials (DKK)
DKK million 2009 2010 2011 2012 2013
Revenues 59,382.0 60,054.0 63,561.0 67,201.0 66,552.0
Net income (loss) 4,167.0 5,960.0 5,692.0 5,607.0 5,471.0
Total assets 134,515.0 144,250.0 147,714.0 153,965.0 151,138.0
Total liabilities 79,686.0 80,002.0 92,964.0 80,315.0 79,639.0
SOURCE: COMPANY FILINGS M A R K E T L I N E
Table 15: Carlsberg A/S: key financial ratios
Ratio 2009 2010 2011 2012 2013
Profit margin 7.0% 9.9% 9.0% 8.3% 8.2%
Revenue growth (0.9%) 1.1% 5.8% 5.7% (1.0%)
Asset growth (5.7%) 7.2% 2.4% 4.2% (1.8%)
Liabilities growth (9.3%) 0.4% 16.2% (13.6%) (0.8%)
Debt/asset ratio 59.2% 55.5% 62.9% 52.2% 52.7%
Return on assets 3.0% 4.3% 3.9% 3.7% 3.6%
Revenue per employee $232,277 $258,185 $265,142 $286,792 $292,964
Profit per employee $16,300 $25,623 $23,744 $23,929 $24,084
SOURCE: COMPANY FILINGS M A R K E T L I N E

Global - Beer 0199 - 0744 - 2013
© MARKETLINE THIS PROFILE IS A LICENSED PRODUCT AND IS NOT TO BE PHOTOCOPIED Page | 28
Figure 17: Carlsberg A/S: revenues & profi tability
SOURCE: COMPANY FILINGS M A R K E T L I N E
Figure 18: Carlsberg A/S: assets & liabilities
SOURCE: COMPANY FILINGS M A R K E T L I N E

Global - Beer 0199 - 0744 - 2013
© MARKETLINE THIS PROFILE IS A LICENSED PRODUCT AND IS NOT TO BE PHOTOCOPIED Page | 29
Heineken Holding NV
Table 16: Heineken Holding NV: key facts
Head office: Tweede Weteringplantsoen 5, 1017 ZD Amsterdam, NLD
Telephone: 31 20 523 92 39
Fax: 31 20 626 35 03
Website: www.heinekeninternational.com
Financial year-end: December
Ticker: HEIA
Stock exchange: Amsterdam
SOURCE: COMPANY WEBSITE M A R K E T L I N E
Heineken is a large brewing company, with a wide international presence through a global network of distributors and
breweries. The company owns, markets and sells more than 250 varieties of beers including international premiums,
regional, local and specialty beers. Its principal brands are Heineken, Amstel, Anchor, Birra Moretti, Cruzcampo,
Desperados, Dos Equis, Foster's, Newcastle Brown Ale, Ochota, Primus, Sagres, Sol, Star, Tecate, Tiger, Zlaty Bazant,
and Zywiec. Additionally, the company markets several brands through joint ventures, which include Cristal and
Kingfisher. In addition to its global beer portfolio, Heineken is a large global player in the cider market, with brands such
as Strongbow Gold and Bulmer's.
The company's brands are sold in about 178 countries, while it has operations in more than 70 countries across Western
Europe, Central and Eastern Europe, Africa and the Middle East, the Americas, and the As ia Pacific region. The
breweries are either owned by the company or are joint ventures in different countries.
The company operates in five segments, defined based on geographic presence: Western Europe, the Americas,
Central and Eastern Europe, Africa and the Middle East, and Asia Pacific.
Western Europe is Heineken's largest segment. In Western Europe, the company has operations in 10 countries,
including the UK, France, Italy, the Netherlands, Belgium, Finland, Ireland, Portugal, Spain and Switzerland. In these
regions, the company operates through subsidiaries, joint ventures and licenses. The company also operates one export
and duty-free business in Western Europe. In this region, Heineken owns and operates 31 production facilities.
In the Americas, the company acquired the beer operations of Fomento Economico Mexicano (FEMSA) in 2010, through
which it gained access to a large market in Mexico and Brazil. The company also has significant interests in Compania
Cervecerias Unidas (CCU), which primarily operates in Chile and Argentina, and Cerveceria Costa Rica (CCR). In
addition, the Heineken brand is brewed under license in a number of markets, mostly in Canada. In all, the company has
about 20 majority-owned breweries and seven joint venture breweries in the region. The company also produces soft
drinks in certain markets in this region.
For Central and Eastern European market, Heineken licenses its breweries or imports beers from other breweries under
the Heineken and Amstel brands. In this region, the company owns more than 50 breweries and has operating
companies in 14 countries, including Austria, Belarus, Bulgaria, the Czech Republic, Croatia, Germany, Greece,
Hungary, Macedonia, Poland, Romania, Kazakhstan, Russia, Serbia and Slovakia. Furthermore, H eineken operates
through a portfolio of more than 180 brands in this region.
In Africa and the Middle East, Heineken operates through owned breweries. The company manufactures Heineken and
Amstel for local distribution and export, besides distributing several local brands like Fayrouz, Laziza and Harar. In this
region, Heineken's operations are spread across 20 countries.

Global - Beer 0199 - 0744 - 2013
© MARKETLINE THIS PROFILE IS A LICENSED PRODUCT AND IS NOT TO BE PHOTOCOPIED Page | 30
Heineken operates in the Asia-Pacific region through Asia Pacific Breweries (APB), a Singapore-based beverage
company. Currently, Heineken holds a 98.7% stake in APB. The company also holds a 37.4% stake in United Breweries
Limited (UBL) for Indian operations. APB has 25 breweries in 19 countries across Asia, while UBL owns 18 breweries in
India. The company also imports the Heineken brand for sale in the Asia Pacific region. Heineken through APB operates
breweries in Singapore, Laos, Mongolia, Thailand, Vietnam, Cambodia, China, New Zealand, Papua New Guinea, Sri
Lanka, and New Caledonia.
The company's beer production and manufacturing operations in the above segments are managed by several
subsidiaries, including Heineken Brouwerijen, the Netherlands; Heineken UK; Mouterij Albert, Belgium; Brau Union,
Austria; Heineken France; Heineken Hungaria Sorgyarak, Hungary; Heineken Ireland; Heineken Slovensko; Heineken
Switzerland; Heineken USA and others. In addition, the company operates in the African market through Brandhouse, a
joint venture with Diageo and Namibia Breweries, and a minority interest in Namibia Breweries.
Key Metrics
The company recorded revenues of $25,491m in the fiscal year ending December 2013, an increase of 4.5% compared
to fiscal 2012. Its net income was $1,811m in fiscal 2013, compared to a net income of $3,915m in the preceding year.
Table 17: Heineken Holding NV: key financials ($)
$ million 2009 2010 2011 2012 2013
Revenues 19,514.9 21,415.9 22,730.0 24,402.6 25,491.2
Net income (loss) 1,351.4 1,920.8 1,898.3 3,914.7 1,810.7
Total assets 26,788.1 35,392.7 36,009.9 47,760.6 44,253.4
Total liabilities 19,684.9 21,826.1 22,613.2 30,819.6 27,851.4
Employees 55,301 65,730 64,252 76,191 80,933
SOURCE: COMPANY FILINGS M A R K E T L I N E
Table 18: Heineken Holding NV: key financials (€)
€ million 2009 2010 2011 2012 2013
Revenues 14,701.0 16,133.0 17,123.0 18,383.0 19,203.0
Net income (loss) 1,018.0 1,447.0 1,430.0 2,949.0 1,364.0
Total assets 20,180.0 26,662.0 27,127.0 35,979.0 33,337.0
Total liabilities 14,829.0 16,442.0 17,035.0 23,217.0 20,981.0
SOURCE: COMPANY FILINGS M A R K E T L I N E

Global - Beer 0199 - 0744 - 2013
© MARKETLINE THIS PROFILE IS A LICENSED PRODUCT AND IS NOT TO BE PHOTOCOPIED Page | 31
Table 19: Heineken Holding NV: key financial ratios
Ratio 2009 2010 2011 2012 2013
Profit margin 6.9% 9.0% 8.4% 16.0% 7.1%
Revenue growth 2.7% 9.7% 6.1% 7.4% 4.5%
Asset growth (1.9%) 32.1% 1.7% 32.6% (7.3%)
Liabilities growth (7.8%) 10.9% 3.6% 36.3% (9.6%)
Debt/asset ratio 73.5% 61.7% 62.8% 64.5% 62.9%
Return on assets 5.0% 6.2% 5.3% 9.3% 3.9%
Revenue per employee $352,886 $325,816 $353,764 $320,283 $314,966
Profit per employee $24,436 $29,223 $29,544 $51,380 $22,372
SOURCE: COMPANY FILINGS M A R K E T L I N E
Figure 19: Heineken Holding NV: revenues & profitability
SOURCE: COMPANY FILINGS M A R K E T L I N E

Global - Beer 0199 - 0744 - 2013
© MARKETLINE THIS PROFILE IS A LICENSED PRODUCT AND IS NOT TO BE PHOTOCOPIED Page | 32
Figure 20: Heineken Holding NV: asse ts & liabilities
SOURCE: COMPANY FILINGS M A R K E T L I N E

Global - Beer 0199 - 0744 - 2013
© MARKETLINE THIS PROFILE IS A LICENSED PRODUCT AND IS NOT TO BE PHOTOCOPIED Page | 33
SABMiller plc
Table 20: SABMiller plc: key facts
Head office: One Stanhope Gate, London W1K 1AF, GBR
Telephone: 44 1483 264000
Fax: 44 1483 264117
Website: www.sabmiller.com
Financial year-end: March
Ticker: SAB
Stock exchange: London, Johannesburg
SOURCE: COMPANY WEBSITE M A R K E T L I N E
SABMiller is one of the world's largest brewers with brewing interests and distribution agreements across six continen ts.
The company markets over 200 brands across 75 countries.
The company's operations are primarily divided across beer manufacturing and soft drinks businesses. In the premium
beers category, SABMiller offers brands such as Pilsner Urquell, Peroni Nastro Azzurro, Miller Genuine Draft and
Grolsch. It also markets a range of local brands such as Aguila, Castle, Miller Lite, Snow, Victoria Bitter, and Tyskie.
Additionally, the company is engaged in the bottling business, and is one of the largest bottlers of Coca-Cola products.
SABMiller operates through six business segments, classified based on geographical presence: Latin America, South
Africa, Europe, Asia Pacific, Africa, and North America.
The Latin America segment covers SABMiller's primary brewing and beverage operations in Colombia, Ecuador, El
Salvador, Honduras, Panama and Peru. The segment also bottles soft drinks for The Coca -Cola Company (Coca-Cola)
in El Salvador and Honduras, and for PepsiCo International in Panama. In Latin America, the company operates 17
breweries and 15 bottling plants. The key brands offered in Latin America include Arequipena, Aguila, Atlas, Balboa,
Barena, Club Colombia, Costena, Cristal, Cusquena, Daroda, Imperial, Pilsen, Pilsener, Pilsen Callao, Pilsen Trujillo,
Poker, Port Royal and Salva Vida among others.
SABMiller operates in South Africa through South African Breweries (Pty) Ltd. (SABL). SABL operates seven breweries
and six bottling plants in the country. The segment also exports its key brands for distribution in Namibia. The segment's
soft drinks division is South Africa's leading bottler of products for Coca-Cola. Additionally, the company is engaged in
the hotel and gaming business through Tsogo Sun Holdings in South Africa. The key brands marketed in the countr y
include Appletiser, Brutal Fruit, Castle Lite, Castle Milk Stout, Hansa Marzen Gold, Redd's, Sarita, and Skelter's Straight
among others.
The Europe segment operates 17 breweries in eight countries, including the Czech Republic, Hungary, Italy, Poland,
Romania, Slovakia, Spain (Canary Islands) and the Netherlands. The company also exports to a further seven European
markets, including the UK and Germany. SABMiller's key brands in this segment include Azuga, Dorada, Gambrinus,
Grolsch, Kozel, Lech, Peroni, Peroni Nastro Azzurro, Pilsner Urquell, Radegast Original, Birell, Timisoreana, Topvar,
Tropical, Tyskie, Ursus, and Zubr among others.
SABMiller operates in Asia Pacific through China Resources Snow Breweries (CR Snow), a partnership with China
Resources Enterprise (CRE). The company also operates in Vietnam, Australia and India. It also exports significant
volumes to South Korea and Singapore. The Asia Pacific segment operates 107 breweries and one bottling plant. It
markets key brands such as Snow, Haywards 5000 and Victoria Bitter.

Global - Beer 0199 - 0744 - 2013
© MARKETLINE THIS PROFILE IS A LICENSED PRODUCT AND IS NOT TO BE PHOTOCOPIED Page | 34
The company has presence across 15 countries in Africa. It operates in 21 other African countries through a strategic
alliance with the Castel group. The company also has an associated undertaking in Zimbabwe. Overall, SABMil ler
operates 19 lager breweries, 19 sorghum beer breweries and 17 bottling plants in Africa. SABMiller bottles soft drinks for
Coca-Cola in 20 of its African markets (in alliance with Castel in 14 of these markets). The key brands marketed in Africa
include Castle Lager, St Louis, Kilimanjaro and Eagle among others.
SABMiller's operates in North America through MillerCoors, a joint venture with Molson Coors Brewing Company. The
company exports its brands to Canada and Mexico and throughout the Americas through its wholly-owned Miller Brewing
International business, based in Milwaukee, the US. The company operates eight breweries in North America and its key
brands include Coors, Coors Light, Keystone Light, Icehouse, Milwaukee's Best Light, Mickey's and Old English among
others.
Key Metrics
The company recorded revenues of $22,311m in the fiscal year ending March 2014, a decrease of 3.9% compared to
fiscal 2013. Its net income was $3,650m in fiscal 2014, compared to a net income of $3,511m in the preceding ye ar.
Table 21: SABMiller plc: key financials ($)
$ million 2010 2011 2012 2013 2014
Revenues 18,020.0 19,408.0 21,760.0 23,213.0 22,311.0
Net income (loss) 2,081.0 2,557.0 4,477.0 3,511.0 3,650.0
Total assets 37,499.0 39,114.0 55,651.0 56,294.0 53,751.0
Total liabilities 16,906.0 16,355.0 29,638.0 28,834.0 26,269.0
Employees 70,131 69,212 71,144 70,486 69,947
SOURCE: COMPANY FILINGS M A R K E T L I N E
Table 22: SABMiller plc: key financial ratios
Ratio 2010 2011 2012 2013 2014
Profit margin 11.5% 13.2% 20.6% 15.1% 16.4%
Revenue growth (3.7%) 7.7% 12.1% 6.7% (3.9%)
Asset growth 18.6% 4.3% 42.3% 1.2% (4.5%)
Liabilities growth 9.0% (3.3%) 81.2% (2.7%) (8.9%)
Debt/asset ratio 45.1% 41.8% 53.3% 51.2% 48.9%
Return on assets 6.0% 6.7% 9.4% 6.3% 6.6%
Revenue per employee $256,948 $280,414 $305,859 $329,328 $318,970
Profit per employee $29,673 $36,944 $62,929 $49,811 $52,182
SOURCE: COMPANY FILINGS M A R K E T L I N E

Global - Beer 0199 - 0744 - 2013
© MARKETLINE THIS PROFILE IS A LICENSED PRODUCT AND IS NOT TO BE PHOTOCOPIED Page | 35
Figure 21: SABMiller plc: revenues & profitability
SOURCE: COMPANY FILINGS M A R K E T L I N E
Figure 22: SABMiller plc: assets & liabilities
SOURCE: COMPANY FILINGS M A R K E T L I N E

Global - Beer 0199 - 0744 - 2013
© MARKETLINE THIS PROFILE IS A LICENSED PRODUCT AND IS NOT TO BE PHOTOCOPIED Page | 36
APPENDIX
Methodology MarketLine Industry Profiles draw on extensive primary and secondary research, all aggregated, analyzed, cross -
checked and presented in a consistent and accessible style.
Review of in-house databases – Created using 250,000+ industry interviews and consumer surveys and supported by
analysis from industry experts using highly complex modeling & forecasting tools, MarketLine’s in -house databases
provide the foundation for all related industry profiles
Preparatory research – We also maintain extensive in-house databases of news, analyst commentary, company
profiles and macroeconomic & demographic information, which enable our researchers to build an accurate market
overview
Definitions – Market definitions are standardized to allow comparison from country to country. The parameters of each
definition are carefully reviewed at the start of the research process to ensure they match the requirements of both the
market and our clients
Extensive secondary research activities ensure we are always fully up-to-date with the latest industry events and
trends
MarketLine aggregates and analyzes a number of secondary information sources, including:
- National/Governmental statistics
- International data (official international sources)
- National and International trade associations
- Broker and analyst reports
- Company Annual Reports
- Business information libraries and databases
Modeling & forecasting tools – MarketLine has developed powerful tools that allow quantitative and qualitative data to
be combined with related macroeconomic and demographic drivers to create market models and forecasts, which can
then be refined according to specific competitive, regulatory and demand-related factors
Continuous quality control ensures that our processes and profiles remain focused, accurate and up-to-date

Global - Beer 0199 - 0744 - 2013
© MARKETLINE THIS PROFILE IS A LICENSED PRODUCT AND IS NOT TO BE PHOTOCOPIED Page | 37
Industry associations
International Federation of Wines and Spirits
18, rue d'Aguesseau, F-75008 - Paris, FRA
Tel.: 33 1 4268 8248
Fax: 33 1 4006 0698
www.fivs.org
Related MarketLine research
Industry Profile
Beer in Europe
Beer in Asia-Pacific
Beer in the United States
Beer in Germany
Beer in Japan

MARKETLINE | 119 FARRINGDON ROAD | LONDON,
UNITED KINGDOM, EC1R 3DA
T: +44 161 238 4040 | F: +44 870 134 4371
df