marketing performance and marketing profitability chapter two m arket-based management, 4 th edition
TRANSCRIPT

Marketing Performance and
Marketing ProfitabilityChapter TwoChapter Two
MMarket-Basedarket-Based ManagementManagement, 4, 4thth editionedition

2-2
Marketing Performance and Marketing Performance and Marketing ProfitabilityMarketing Profitability
Chapter Two
– Financial vs. Market-Based Performance
– Marketing Performance Metrics
– Marketing Profitability
– Strategies to Increase Marketing Profitability
– Marketing Profitability Metrics
2-3
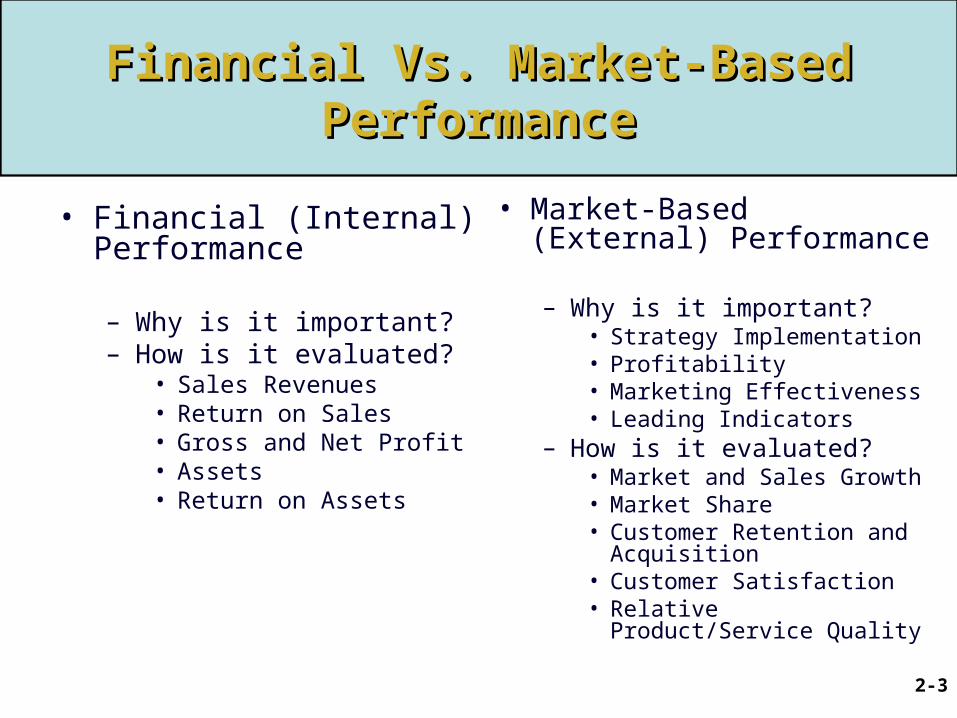
Financial Vs. Market-Based Financial Vs. Market-Based PerformancePerformance
• Financial (Internal) Performance
– Why is it important?– How is it evaluated?
• Sales Revenues• Return on Sales• Gross and Net Profit• Assets• Return on Assets
• Market-Based (External) Performance
– Why is it important?• Strategy Implementation• Profitability• Marketing Effectiveness• Leading Indicators
– How is it evaluated? • Market and Sales Growth• Market Share• Customer Retention and
Acquisition• Customer Satisfaction• Relative Product/Service
Quality

2-4
Financial Vs. Market-Based Financial Vs. Market-Based Performance MetricsPerformance Metrics

2-5
In-Process vs. End-Result In-Process vs. End-Result Performance MetricsPerformance Metrics

2-6
Marketing ProfitabilityMarketing Profitability
• What is marketing profitability?– Net Marketing Contribution
(NMC)
• How is it measured? – Gross Profit – M&S Expenses – Sales Revenue X % Gross
Margin – M&S Expense
• Product vs. Customer focus
Hypothetical Financials
Sales Revenues $10 Million
COGS $8 Million
Gross Profit$2 Million
Marketing and Sales Expenses
$1 Million
NMC $1 Million
Operating Expenses
$2 Million
Net Profit ($1Million)

2-7
[ ( )]
Marketing ProfitabilityMarketing ProfitabilityProduct FocusProduct Focus
NMC Market Market Price Variable Cost Marketing
(P1) Demand Share per Unit per Unit Expenses = X X - -
﹣﹣

2-8
Marketing ProfitabilityMarketing ProfitabilityCustomer FocusCustomer Focus
$55.1$55.1
210,000210,000
$37.8$37.8
6.23%6.23%
1,302,0001,302,000
$95.31$95.31
$124.7$124.7
$60.75$60.75
$34.56$34.56

2-9
[ ( )] NMC Market Market Rev per VC per Marketing
(P1) Demand Share Customer Customer Expenses = X X - -
Strategies to increase Market
Efficiency
Marketing Strategies and Marketing Strategies and Marketing ProfitabilityMarketing Profitability
Strategies to Grow Market
Demand
Strategies to Increase
Market Size
Strategies to Increase
Purchases
Strategies to Enter or Exit
Markets
Strategies to lower VC per
Customer

2-10
Marketing Profitability MetricsMarketing Profitability Metrics
• Marketing ROS– Why is it important?
• Benchmarking
– How is it measured?• NMC/Sales Revenues
• Marketing ROI– Why is it important?
• Assess marketing productivity of investment
– How is it measured?• NMC/M&S Expenses

2-11
Return on Capital and Return on Capital and Marketing ProductivityMarketing Productivity

2-12
TakeawaysTakeaways//ReviewReview
• Financial and Market-Based Performance Evaluation
• Marketing Profitability and Measurement
• Impact of Basic Marketing Strategies
• Marketing Productivity Metrics
• Exercises– Marketing Performance Tools

2-13
Marketing Performance ToolsMarketing Performance Tools
Marketing Profitability: A Product Focus
Product Name: Casual Shorts Casual Shorts Casual Shorts
Area of Performance Current Performance Alternative Strategy Difference
Market Demand 20,000,000 20,000,000 0
Market Share 2.0% 2.0% 0.0%
Unit Volume 400000 400000 0
Price per unit $25.00 $25.00 0.00
Sales Revenues $10,000,000 $10,000,000 0
Cost per unit $20.00 $20.00 0.00
Margin per unit $5.00 $5.00 0.00
Gross Profit $2,000,000 $2,000,000 0
Marketing & Sales Expenses $1,000,000 $1,000,000 0
Mktg & Sales Expenses (% Sales) 10.0% 10.0% 0.0%
Net Marketing Contribution $1,000,000 $1,000,000 0
Marketing ROS 10.0% 10.0% 0.0%
Marketing ROI 100% 100% 0.0%

2-14
Marketing Performance ToolsMarketing Performance Tools
Marketing Profitability: A Customer Focus
Market Segment: Casual Shorts Casual Shorts Trend Setters
Area of Performance Current Performance Alternative Strategy Difference
Market Demand (customers) 8,000,000 8,000,000 0
Market Share 6.0% 6.00% 0.0%
Unit Volume 480000 480000 0
Revenue per Customer $65.00 $65.00 0.00
Sales Revenues $31,200,000 $31,200,000 0
Average Cost per Customer $40.00 $40.00 0.00
Margin per unit $25.00 $25.00 0.00
Gross Profit $12,000,000 $12,000,000 0
Marketing & Sales Expenses $4,500,000 $4,500,000 0
Mktg & Sales Expenses (% Sales) 14.4% 14.4% 0.0%
Net Marketing Contribution $7,500,000 $7,500,000 0
Marketing ROS 24.0% 24.0% 0.0%
Marketing ROI 167% 167% 0.0%