marketing infrastructure, distribution channels and trade pattern of
TRANSCRIPT
Marketing Infrastructure,
Distribution Channels and
Trade Pattern of Inland Fisheries
Resources Cambodia:
An Exploratory Study
Mohammed A. RabHap Navy
Seng LeangMahfuzuddin Ahmed
Katherine Viner
The WorldFish CenterBatu Maung, Penang
Malaysia
WorldFishC E N T E R
ContentsContents
1. 2. 3.
4.
5.
6.
7. 8.
9. 10.
Executive Summary ....................................................................................................................................Introduction .................................................................................................................................................Objectives ...................................................................................................................................................Research Methods ....................................................................................................................................... 3.1. Study Area .................................................................................................................................... 3.2. Sample Selection and Data Collection .........................................................................................Market Infrastructure .................................................................................................................................. 4.1. Description of Landing Sites ........................................................................................................ 4.2. Quantity and Price of Fish at Landing Sites ................................................................................. 4.3. Observations of Retail Markets ....................................................................................................Supply Chain of Inland Fisheries Products ................................................................................................ 5.1. Stakeholders in the Supply Chain ................................................................................................ 5.2. Overview of the Supply Chain .....................................................................................................Fish Processing ........................................................................................................................................... 6.1. Traditional Fish Processing .................................................................................................. 6.2. Modern or Industrial Fish Processing ................................................................................... 6.3. Survey of Fish Processors ............................................................................................................Export Markets ...........................................................................................................................................Summary of Results ................................................................................................................................... 8.1. Landing Sites ................................................................................................................................. 8.2. Observations of Retail Markets ..................................................................................................... 8.3. Stakeholders in the Supply Chain .................................................................................................. 8.4. Fish Processing .............................................................................................................................. 8.5. Fish Export ....................................................................................................................................Conclusion and Recommendations ............................................................................................................References ..................................................................................................................................................Appendices .................................................................................................................................................. A. Tables
458999
111113152424272828292931383839404040414344
Figures
Appendix Tables
3.1. Sample breakdown type of interview/observation and province. ............................................................4.1. Daily quantity and average price of fish at sample landing sites by grade during closed season, (August 2003). ..........................................................................................................................................4.2. Important fish species in terms of volume in selected landing sites in Tonle Sap area, 2004. ................. 4.3. Important species in terms of price in all the landing sites in Tonle Sap area. .........................................4.4. Average number of fish sellers in the sample markets by location of markets. .......................................4.5. Type and condition of market by location. ...............................................................................................4.6. Average number of years in business and number of persons involved in retail fish shops. ..................4.7. Main sources of fish sold in retail markets in study areas. .......................................................................4.8. Important species in terms of volume sold in the sample retail markets during open season, 2004. .......4.9. Important species in terms of price in the sample retail markets during open season, 2004. ..................4.10. Average quantity, price, cost of transport, and taxes and fees in retail fresh fish shops. ..........................4.11. Average number of years in business and number of workers in each retail processed fish shop. ..........4.12. Average transport costs, taxes and fees by market location for each retail processed fish shop. .............4.13. Average quantity and price by product type and market location of processed fish products. .................6.1. Marketing of processed fish produced in 2003. ........................................................................................7.1. Exports of inland and marine fisheries products by each province in Cambodia, 1992-2002. ................7.2. Imports of fisheries products from Cambodia to selected markets, 1998-1999. ......................................7.3. Important species for export in terms of volume by all the sample traders in Phnom Penh, Kampong Chhnang and Siem Reap Provinces in closed season, 2003. ..................................................7.4. Important species for export in terms of price in Phnom Penh, Kampong Chhnang, and Siem Reap provinces in closed season 2003. ...........................................................................................7.5. Importance of species by quantity export by all sample traders (open season, 2004). ............................7.6. Importance of species by prices of export by all the sample traders (open season 2004). .......................
4.1. Map showing landing sites and fish distribution chain in Phnom Penh City and Kandal Province. .......4.2. Map showing landing sites and fish distribution routes in Kg. Chhnang Province. ................................4.3. Map showing landing sites and fish distribution routes in Siem Reap Province......................................5.1. The supply chain of inland fisheries products in fish marketing system in Cambodia. ...........................6.1. Number of hired labor used for processing activities per plant. ..............................................................7.1. Map showing export routes for inland fisheries products in Cambodia. ..................................................
1. Important fish species in terms of quantity landed around Phnom Penh City. .........................................2. Important fish species in terms of price landed in Phnom Penh City. ......................................................3. Important fish species in terms of quantity landed in Kampong Chhnang Province.................................4. Important fish species in terms of quantity landed in Kampong Chhnang Province.................................5. Important fish species in terms of quantity landed in Siem Reap Province...............................................6. Important fish species in terms of price landed in Siem Reap Province...................................................7. Top 20 important fish species in terms of quantity and price of the retail markets in Phnom Penh City. ..................................................................................................................................................8. Top 20 important fish species in terms of quantity and price of the retail markets in Kampong Chhnang Province. ....................................................................................................................................9. Top 20 important fish species in terms of quantity and price of the retail markets in Siem Reap Province. ....................................................................................................................................................10. Top 20 important fish species in terms of quantity and price of the retail markets in Kandal Province. ....................................................................................................................................................11. Top 20 important fish species in terms of quantity and price of the retail markets in all sample provinces. ..................................................................................................................................................
10
16171819191920202122222323303233
34
343536
121415273037
444445454647
47
48
49
49
50
List of Tables and FiguresList of Tables and Figures
Tables
Note: In this book, unless otherwise stated, all $ refers to US$. The conversion rate applied was $1 = 4000 riels, as of May 2004.

EXECUTIVE SUMMARYEXECUTIVE SUMMARY
ambodia is the single most important supplier of fresh water fish to its neighboring countries in Asia, and to a limited extent in Australia, and USA. Over the past few years, fish exports from the country have been diversified to include freshwater fish, processed fish, other aquatic animals such as crocodiles and snakes along with marine fish. Despite the growing importance of fish trade in Cambodia, very little information is available on the fish marketing status, and on challenges and opportunities. This report explores the status and needs to develop market infrastructure from fishing ground to retail markets and export points, constraints to fish marketing and trade, status of fish handling and quality processing, species important for both export and domestic markets, price information and trade margins, and the over all supply chains to stimulate further in-depth study.
The study is based on observation and field survey. The study design takes into account stakeholders at different levels in the supply chain. Given its focus in the Great Lake-Tonle Sap and Mekong-Bassac areas, the study purposively selected three provinces of Kandal (Mekong-Bassac), Kampong Chhnang, Siem Reap (Great Lake-Tonle Sap), and Phnom Penh to cover key fishing grounds and landing sites from where most of the fish are channeled to key cities and export points. Out of the total 19 fish markets in Phnom Penh, the study selected 10 markets following proportionate random sampling procedure. In each province, the provincial town market and two rural village markets for fresh and processed fish were also surveyed. Sixty-one retailers of fresh and processed fish were interviewed. Important landing sites around the Phnom Penh and in the selected provinces were also
Results indicate that the marketing of fresh and processed fish in Cambodia has a complex network of stakeholders and beneficiaries, which include middlepersons, traders, wholesalers and transporters as well as fishers, processors, retailers and exporters. Fish marketing therefore supports a very wide range of different livelihoods for a great number of rural and urban households, who are consequently very dependent on fisheries resources. The existing infrastructure for marketing and trade of inland fisheries products is still very poor in terms of landing, storage, preserving, and transport and retail facilities. This limits market opportunities and prevents competitive advantage of the exporters. Inadequate facilities for hygienically handling, sorting, weighing and packing fish, and lack of storage facilities and preservation equipment or materials (e.g., ice, ice-crushing machines, ice boxes, freezers, salt) at landing sites are the major constraints for both domestic and export markets. Small and medium-scale fish processing operations are unable to adopt quality control measures and hygiene standards due to lack of modern equipment or production methods. On the other hand, big fish processing plants who have modern equipments suffer from excess capacity due to lack of supply
While the domestic market for freshwater fish in Cambodia is relatively well established, despite constraints to distribution and infrastructure, the export market is still developing. Currently, fish exports consist mainly of processed fish products from industrial-scale processing plants and high-value species as fresh fish to neighboring countries such as Vietnam and Thailand. Two low-value fish ($1.1-1.2/kg) species, raws and chdaur, make up 38% of fish sold in domestic markets by volume while high-value fish species such as damrey ($7-19/kg), khya ($10.25/kg) and kanchos thmor ($7/kg)
The fish export market is relatively small but there seems to be good potential for continued growth, for both fresh and processed forms. However, international food safety and quality standards are becoming increasingly stringent, meeting them will require modernization, and improvement at all points of the fish marketing chain. Fish processing and trade are often conducted in addition to fishing and/or farming, and therefore provide an additional source of income for many households. Fish marketing and trade provide one of the few opportunities for women and poor households who live in and near the Tonle Sap Lake areas to increase household income.
C
observed and monitored.
of adequate fish to run the plant.
are most important for export.
4

C ambodia has a vast freshwater ecosystem that includes rivers and lakes, flooded forests, ricefields, grasslands and swamps that have made it the world's fourth largest freshwater fish producing country (Degen et al. 2000). The Tonle Sap Lake (the biggest in South Asia) and the lower tributary of the Mekong River system are supported by monsoon rains, floods and wetland vegetation, and nutrient-rich soil. These conditions have created the ecosystem that allows fish and other aquatic animals' access to abundant nutrition and food resources. Traditionally, the Great Lake is the spawning ground for many fish habitats that migrate through the Tonle Sap River when the lake expands with floodwaters usually by four to six times its dry
2season size. In the dry season, the surface area of the lake shrinks to 2,500-3,000 km from its 2
wetland size of about 10,000-15,000 km during monsoon months of June-October (NEDECO 1998; McKenney and Tola 2002). The Great Lake, which is thought to be the most productive inland fisheries of the world, contributes about 60% of the country's commercial fisheries
Although inland fisheries provide foreign exchange to the government and nutrition, livelihoods and food security to the millions living in rural areas, the country lacks a precise estimate of the total fish production from this source. Many observers believe that the official estimates of the Department of Fisheries (DOF) are grossly underestimated because of its weak and improper data collection methods. The natural weakness of the data collection system is its incentive to the commercial fisheries to underreport catch. The DOF statistics are mostly based on licensing and easing systems that cover mostly commercial fisheries in 13 provinces (McKenney and Tola 2002) only, and there has been no effort to collect data from the remaining 11 provinces (Ahmed et al. 1998). Catches from ricefield fisheries and small-scale indigenous fisheries are almost ignored in the data collection efforts of the DOF. However, the official estimate of the DOF jumped by 300%, from 76,000 t in 1988 to 228,000 t in 1999, due to the inclusion of small-scale catch into the national annual production figure of inland fisheries. Nevertheless, there still remains a sharp contrast between the official inland fish production figure and the estimates
van Zalinge et al. (2002) made a comprehensive effort to obtain a reliable estimate by combining data from different sources. This estimate provides a range of total fish production/catch of 290-430,000 t. Currently, this figure is widely used by researchers and policymakers although the estimate still remains indicative only. Much effort is still needed to reach a conclusive figure in order to assess sustainability of inland fisheries. If it is true that the current catch of fish is higher than that of the previous decades, this is likely to be due to an increase in the population dependent on fishing and increased fishing effort in the form of destructive and illegal fishing.
Like fish catch statistics, there is no reliable information on the quantity of inland fisheries products traded domestically and internationally, although the sector has a significant
1. INTRODUCTION1. INTRODUCTION
The depth of the lake rises from 1-2 m in the dry season to 8-10 m during monsoon (McKenney and Tola 2002).The DOF estimates of total inland fish production during 1981-1995 fell in the range of 50,000-75,000 t/year
The estimate combined data from a number of studies (Gregory et al. 1996, Ahmed et al. 1998, and Gregory and Guttman 2002) of fish consumption and production that covered commercial and small-scale indigenous fisheries including ricefield fisheries.
1
2
3
(McKenney and Tola 2002).
production (Ahmed et al. 1998).
based on catch assessment and related studies by van Zalinge et al. (2002).
1
2
3
5
actively involved in international trade of fish.
made to get a more reliable estimate until now.
contribution to the country's foreign exchange earning. Information on export of fisheries products is available from two official sources the Ministry of Commerce (MOC) and the DOF. According to the MOC, the country exported only 517 t of fish and fisheries products, valued at $4.34 million in 1998. In contrast, the DOF estimated 40.2 thousand t for the same year and 44.6 thousand t for the following year, which seemed closer to reality. However, many observers believe that the actual exports are much higher than the DOF estimates, as over the last decade, along with the state-owned Kampuchea Fisheries Export and Import (KAMFIMEX) Company, private exporting companies have been involved in international trade of fish and fisheries products. During the same period, the government of Cambodia has relaxed the monopoly statusof the KAMFIMEX to encourage private initiative in fisheries exports. Recently, many private export houses, including four big companies which have modern processing facilities, are
Given the private sector initiatives, export markets have been expanding from neighboring countries like Thailand and Vietnam to other countries in Asia, Australia and the USA over the last ten years. The export markets have been diversified to include freshwater fish, processed fish, other aquatic animals such as crocodiles and snakes along with marine fish. The demand for exports of both freshwater and marine fish products has also been significantly increased since 1993 in Thailand and Vietnam (Tana and Seang 2002). Therefore, one can reasonably be skeptical about the current official estimates of exports of fisheries products, given the expansion and intensification of fish exports over the past years. The official estimate of export data may not be reliable as it is principally based on statistics provided by the customs officials, which according to many observers are under-reported due to illegal practices (Tana and Seang 2002). Despite these weaknesses in the data collection methods of the DOF, no independent attempt has been
In addition, there are many constraints to fish marketing and trade, some of which are sparsely mentioned elsewhere at a very rudimentary level. Available information on both domestic and international trades of fisheries products suggests that the entire supply chain from the fishing grounds to retail market and border points is traditional and subject to loss of value in terms of spoilage and weight loss due to improper handling and preservation techniques. A recent study by Chea and McKenney (2003) observed two exporters from the landing site to the border points that provided a grave story about the constraints and challenges faced by the exporters in terms of fee payments at different checkpoints of the export route to Poipet. Nevertheless, traders and exporters face many other constraints that need to be addressed. This will help develop a class of
1
2
One of these processing plants located in Phnom Penh specializes in processing freshwater fish and the remaining three, located in the port city of Sihanoukville, specialize in processing and exporting shrimp, squid and marine finfish. One trading company manages two processing plants one in Phnom Penh and another in Sihanoukville. Other Asian markets, such as Singapore, Malaysia, Taiwan, Japan, Hong Kong and mainland China, import high-value fish (live sand goby, crocodiles, snakes, shrimp, squid, etc.) as reported by Tana and Seang (2002).Illegal practices are in the form of under-reporting actual volume to evade taxes and customs duties and border crossing through illegal checkpoints to avoid customs officials, among others.The study observed that the exporters paid fees 28 times (including 3 payments in the Thai side) of which 8 times were to economic police, 3 times to provincial fisheries, 2 times to military police and other stakeholders with or without legal basis. Among these, payment to Thai customs (no legal basis) was the highest, which is more than double the official tax paid to the Cambodian customs. Other major fee payments went to KAMFIMEX, an investment company, as road fee and to authorities of the DOF and the provincial fisheries office at Poipet. All these fee payments took 33% of their gross margin while 52% was for expenses on transport, labor and other management aspects, and the remaining 15% was credited to their net profit.
3
4
4
5
6
7
6
efficient and competitive entrepreneurs who will be able to overcome new challenges of globalization and health safety barriers in the form of sanitary and phyto-sanitatry (SPS) and
Given the importance of fish trade to the developing countries in the world market, Cambodia has to revisit its fish import and export policy, constraints and prospects of fish exports, and existing infrastructure of fish handling, processing and distribution channels. The world has experienced a significant shift in fish trade since the early 1990s, as many of the traditiona fish-exporting developed countries have become net importers (Delgado and Courbois 1997; Ahmed et al. 2003). Simultaneously, developing countries, especially those in Southeast Asia and South Asia, have become the main suppliers of exports of fish and fish products. Developing Asian countries have been competing with each other for the increasing export market, and the
In the face of globalization and increasing pressure of implementing SPS and HACCP procedures from the developed, fish-importing countries, survival in the competition will increasingly depend on efficiency and quality in health safety measures of these countries. Cambodia is falling far behind its Asian competitors not only in terms of volume of export, but also in its ability to export quality products. Currently, most of its exports are fresh and semi-processed fish to Thailand, Laos and Vietnam, with little value additions from processing. It is believed that Thailand and Vietnam re-export products with added value through industrial processing. Therefore, comprehensive studies on the need to develop market infrastructure from fishing ground to export points and retail markets, constraints to fish marketing and trade, status of fish handling and quality processing, species important for export and domestic markets, price formation and trade margins, and the overall supply chain of freshwater fisheries, etc., are needed for the development of efficient and competitive markets for both domestic and external trade. This study will address these issues in an exploratory manner based on observation and field survey, which will generate interests for further in-depth studies on these topics.
hazard analysis critical control point (HACCP) processes.
Competition is likely to increase in the near future.
7
1. identify major stakeholders and beneficiaries of fish processing, marketing and trade;2. explore existing marketing and trade infrastructure and conditions of fish handling and means of transportation;3. identify important species for export and domestic consumption; 4. identify constraints to marketing and trade of fish and fish products; and5. provide recommendations based on the results and findings.
8
here exist numerous reports and seminar and symposia papers focusing on socioeconomics, livelihoods, and marketing and trade on inland fisheries sector, but few of them are based on primary information. Specifically, studies based on primary data collection are almost absent. The study by Chea and McKenney (2003), as mentioned above, is the only study that exploredconstraints of fish exports. The pioneering report by Ahmed et al. (1998) is the onlyavailable study that was based on household survey of fishing communities and covered fish production, consumption, livelihoods in the fishing communities, and fish marketing pattern at the producer and consumer levels. However, providing a broader picture of fish marketing and trade constraints was out of the scope of the study. Tana and Seang (2002) provided comprehensive information on the fishery sector as a whole, largely based on official andunofficial secondary information. The authors also provided some interesting information on fishmarketing, trade and fish processing from their experiences and observations. However, the report lacked scientific basis to be generalized for policy purposes, although it generated many
In the light of paucity of information and lack of in-depth analysis on marketing and trade of fish and fisheries products, the broad objectives of this study are to generate meaningful primary information on marketing infrastructure and distribution channels of fish and fish products in
2. OBJECTIVES2. OBJECTIVES
T
interesting questions regarding proper working of the system as a whole.
Cambodia and provide input for new policy development.
The specific objectives of the study are to:
Given the complexities of interactions across agents and stakeholders in market exchanges, research methods that measure market attributes from a single agent are unlikely to provide a clear picture about the inherent dynamics of fish marketing in the country. For instance, marketing of fish begins from fishing grounds up to middlepersons, landing sites, wholesalers, exporters, retailers and finally to consumers. Therefore, research methods in market analysis should take approaches that will vertically integrate all the agents and stakeholders where exchanges take place. The study used secondary information from government and other sources
The study design is detailed and comprehensive in that it takes into account stakeholders at different levels in the supply chain. Given its focus in the Great Lake-Tonle Sap and Mekong-Bassac areas, the study purposively selected the three provinces of Kandal (Mekong-Bassac), Kampong Chhnang, Siem Reap (Great Lake-Tonle Sap), and Phnom Penh in the first-round data collection to cover key fishing grounds and landing sites from where most of the fish are channeled to key cities and export points. Moreover, in the second-round data collection, the study included Pursat Province since it is one of important landing sites of fish from the Great
Out of the total 19 fish markets in Phnom Penh, the study selected 10 markets (2 big, 3 medium and 5 small) following proportionate random sampling procedure. In each province, the provincial town market and two rural village markets for fresh and processed fish were also surveyed. Sixty-one retailers of fresh and processed fish were interviewed during the first-round
Important landing sites around the Phnom Penh and in the selected provinces were also observed and monitored. The observation and monitoring focused on fish handling and storage facilities, quantity, quality and prices of fish by species, and sources of fish. Overall, two landing sites in Phnom Penh, one in Kandal, two in Kampong Chhnang, two in Siem Reap and one in Pursat were
The study also interviewed fish exporters in Phnom Penh, Kandal, Kampong Chhnang, Siem Reap, Kratie and Stung Treng Provinces, following snowball-sampling procedure. Following this method, four freshfish exporters in Phnom Penh, two in Kampong Chhnang and two in Siem Reap were identified and interviewed. In addition, case studies of two big exporters in Phnom Penh and Stung Treng were conducted. The big exporting company in Phnom Penh owns two fish processing plants/units in Phnom Penh and Sihanoukville and exports fresh and processed fish to mainland China, Hong Kong, USA, Japan and other neighboring countries. The big fish export company in Stung Treng mainly exports fish caught from the upstream Mekong River to Lao PDR and Thailand through the Lao-Thailand border.
3. RESEARCH METHODS
3. RESEARCH METHODS
to complement primary data and observations.
Lake-Tonle Sap to markets.
Market Observations
data collection in closed season.
Landing Site Observations
3.1. Study Area
3.2. Sample Selection and Data Collection
surveyed.
Fish Exporters
8
9
The study also interviewed provincial fisheries officials about fish catch, exports of fish and
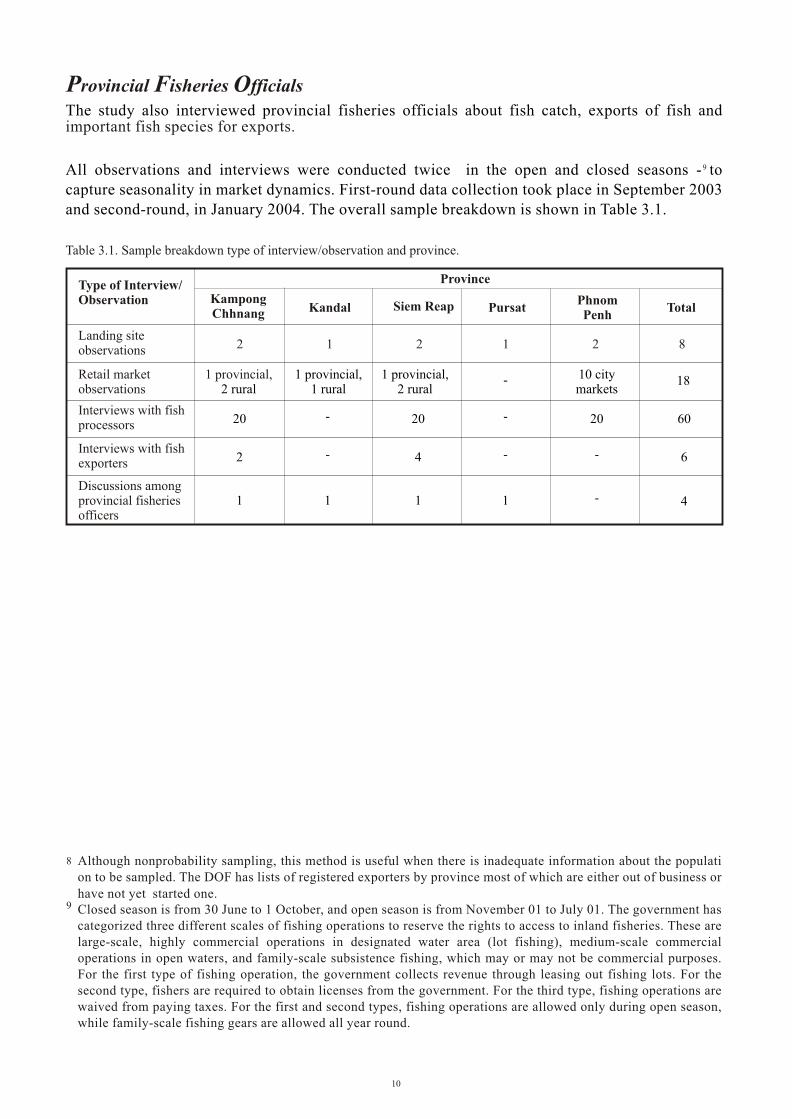
All observations and interviews were conducted twice in the open and closed seasons - to capture seasonality in market dynamics. First-round data collection took place in September 2003 and second-round, in January 2004. The overall sample breakdown is shown in Table 3.1.
Provincial Fisheries Officials
important fish species for exports.
Table 3.1. Sample breakdown type of interview/observation and province.
9
Although nonprobability sampling, this method is useful when there is inadequate information about the population to be sampled. The DOF has lists of registered exporters by province most of which are either out of business or
Closed season is from 30 June to 1 October, and open season is from November 01 to July 01. The government has categorized three different scales of fishing operations to reserve the rights to access to inland fisheries. These are large-scale, highly commercial operations in designated water area (lot fishing), medium-scale commercial operations in open waters, and family-scale subsistence fishing, which may or may not be commercial purposes. For the first type of fishing operation, the government collects revenue through leasing out fishing lots. For the second type, fishers are required to obtain licenses from the government. For the third type, fishing operations are waived from paying taxes. For the first and second types, fishing operations are allowed only during open season, while family-scale fishing gears are allowed all year round.
4
Type of Interview/ Observation
Province
Kampong Chhnang Kandal Siem Reap Pursat
Phnom Penh
Total
Landing site observations
Retail market observations
Interviews with fish processors
Interviews with fish exporters
Discussions among provincial fisheries officers
2 1 2 1 2 8
1 provincial,2 rural
1 provincial, 1 rural
1 provincial, 2 rural
- 10 city markets
18
20 20 20 60--
2 - 4 - - 6
1 1 1 1 -
8
9have not yet started one.
10
ishing communities in the Great Lake-Tonle Sap area are composed mostly of small-scale fishers using labor-intensive traditional gears for subsistence and whose level of income is low and supplemented by other nonfishing activities. The fishers' productivity per unit of time and effort is low, and their catch is sold at the fishing ground and scattered landing points at unfavorable prices to middlepersons or traders who often possess the market power. Small-scale fishers are unable to generate surplus income for reinvestment to acquire sophisticated gears and techniques that could provide them with income, employment, and social and political mobility. The Fisheries Reform of 2000 provided increased access to small-scale fisheries by reducing the operational area of industrial (lot) fisheries. Small-scale fisheries in the Tonle Sap area play an important role as they are the major source of income, employment and animal protein for
Given the dominance of small-scale fishing communities in the lake area, it is not unexpected that the marketing system should be traditional with scattered and undeveloped landing sites. To understand the fish marketing system and its importance to the lives of small-scale fishing communities, the study observed and monitored landing sites and retail markets in selected provinces. This section provides information on fish market infrastructures and fish handling methods.
4. MARKET INFRASTRUCTURE4. MARKET INFRASTRUCTURE
millions who live in and around the lake.
Eight landing sites of freshwater fisheries were observed; two around Phnom Penh, and six other big and small landing sites in Kandal, Kampong Chhnang, Pursat and Siem Reap Provinces.
4.1.Description of Landing Sites
F
11
trucks, cars and motors are also used.
and longer edge of the riverbank.
12
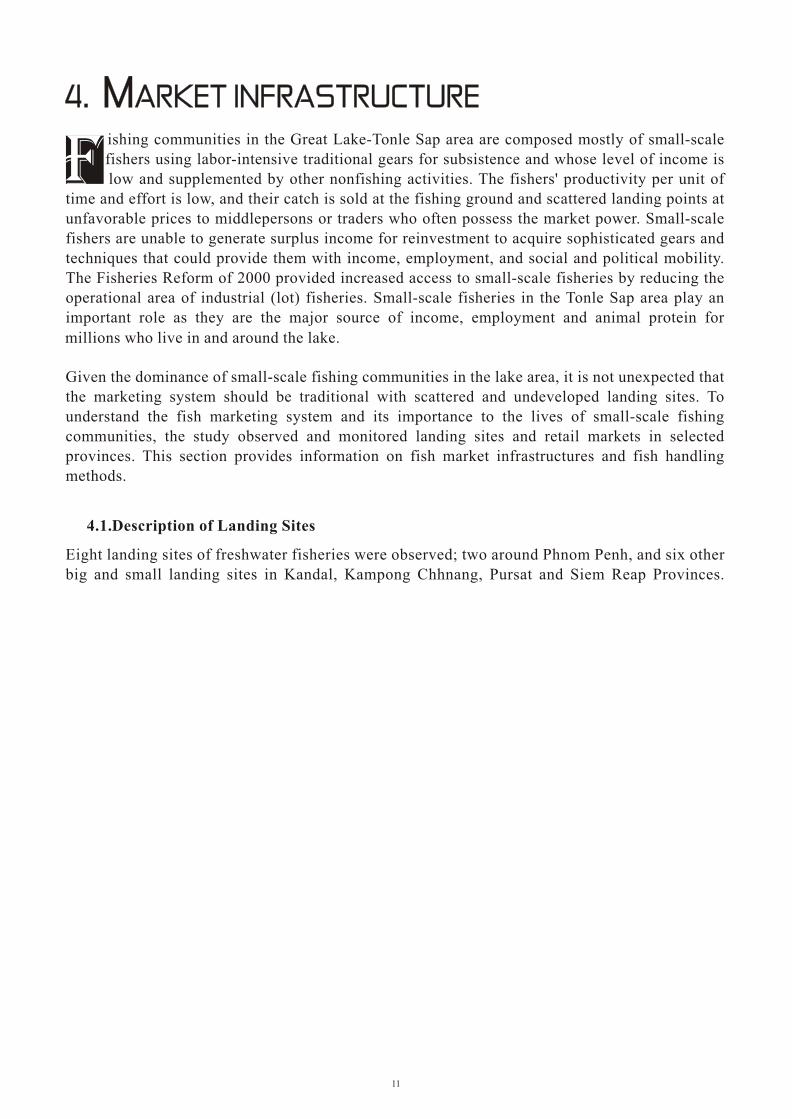
9Figure 4.1. Map showing landing sites and fish distribution chain in Phnom Penh and Kandal Province.
Phnom Penh and Kandal Landing Sites
The locations of the Phnom Penh landing sites, Chrang Chamress (KM no. 9) and Prek Phneou (KM no. 11), and Pomung Kul in Kandal Province and the distribution chain for fish landed at them
The two landing sites around Phnom Penh are big and busy during both seasons, as fish from different fishing grounds in the lake area and the Mekong River are landed here. Most of the traders come with a large amount of fish, collected from fishing grounds, cage farmers, middle-scale fishers and lot owners. In some instances, agents/employees of the commercial operators, who have bulk of production, come to sell their excess products.
Traders/wholesalers and exporters from the city markets and export houses buy fish from these landing sites. Significant shares of fish are also destined for distant provinces like Sihanoukville, Kandal, Kampong Speu and Kampot from these city-landing sites. The Prek Phneou (KM no. 11)landing site is specialized for live fish landing and has provision for stocking in cages in the Tonle Sap River on rental basis. The Chrang Chamress (KM no. 9) is used for landing fresh and chilled fish. The Pomung Kul landing site is small, basically for fish landing from small and middle-scale fishers in the Mekong River area. The dominant means of transportation to these landingsites are powerboats and engine boats with cage. In a few instances, land transports such as mini
Both landing sites in Phnom Penh are managed by private leaseholders. There are concrete floors and structures with space for 19 stores in Chrang Chamress landing site and 23 stores in Prek Phneou landing site. Both are located north of the Phnom Penh on the bank of Tonle Sap River and are accessible by national road no. 5. Although both landing sites are suitably located in terms of transportation and market access, they are very inconvenient for unloading from boats due to steeper
them are shown in Figure 4.1.

Usually, fish landing starts at around 2 a.m., and brokers who help to sell products on commission basis open the boxes for sorting, beheading and repacking, so that they can charge higher prices for better quality products. Brokers do their business in the open spacealthough there is plenty of room inside. Wholesalers, exporters and retailers from the city markets and distant provinces such as Kampot, Kampong Speu and Sihanoukville arrive to buy fish from these landing sites. A significant share of the fish is destined for city markets either through retailers or wholesalers. A few varieties of fish such as white fish and snakeheads also go to fish
Supplies of fish to Phnom Penh landing sites generally come from provinces such as Kampong Chhnang, Kampong Cham, Kampong Thom, Siem Reap, Pursat, Battambang and Kandal surrounding the Great Lake-Tonle Sap and Mekong-Bassac River, either from cage culture or fishing grounds during closed season, and both fishing grounds and lots during open season.
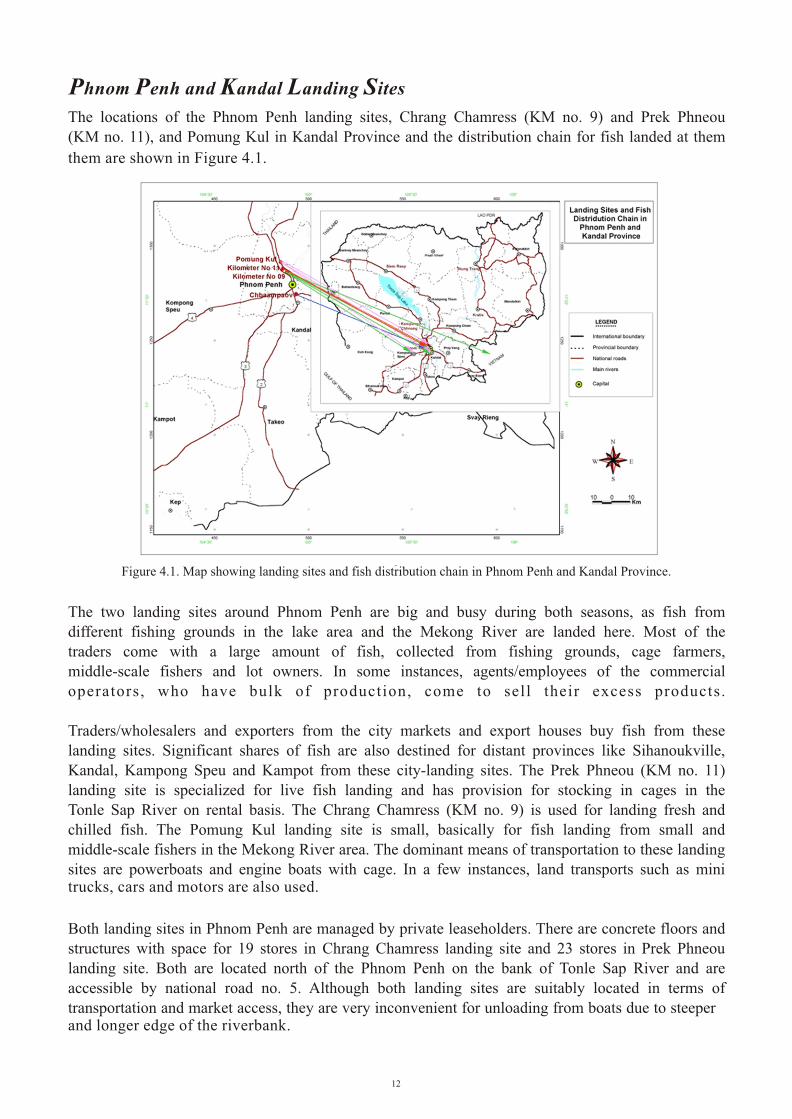
There are also two landing sites in Kampong Chhnang Province one in the periphery of the provincial capital and another in Chnok Tru which is over 50 km away from the provincial capital. The locations of these landing sites are shown in Figure 4.2, together with
The landing site located in the provincial capital has no permanent structure, although the government collects revenues by leasing it out to a private operator based on competitive bidding. The leaseholder of the site charges sellers 50 riel/kg. The site has a small jetty that can provide space for 10-12 boats at a time. During peak period, there is always a long queue of boats waiting for fish landing. Sorting and beheading are done on the floor of the jetty and on the beach of the river. There are 10-15 brokers who facilitate selling of the products to retailers and wholesalers from local and distant markets. At this site, fish landing starts at 1 a.m. and lasts until 5 a.m. Most of the fish landed at this site are live and are transported in boats with 2-5 t
At the Kampong Chhnang landing site, almost 90% of the total supplies of fish come from Phat Sandai (Kampong Thom) and Chnok Tru (Kampong Chhnang) fishing grounds and cage culture, and the remaining 10% come from other communes of Kampong Chhnang Province. Most of the high-value fish such as snakeheads and pangasius go to Phnom Penh and other wholesale markets in Kampong Chhnang. Some of the high-value fish and most of the white fish go to the local retail markets and medium-scale fish processors. Women and children be-head and separate eggs of giant snakeheads at the landing site. By doing so, they add value to their products, and charge different prices for the head, body and eggs. The average prices per kilogram of the body, head and eggs of the snakehead are $1.2, 0.5 and 6.25, respectively; while the average price of the whole fish is $1 or less. The body of the giant snakehead goes to Phnom Penh for processing, the head goes to local markets for further processing as animal feed, and the eggs go to city markets;
The Chnok Tru landing site is a prominent place due to its proximity to major fishing grounds of the lake, small- and medium-scale fish processing zones and wet market and the presence of fish exporters. However, a casual visitor will hardly find any characteristics that can label it as a landing site. There is no fixed landing space or beach. Transactions involving exporters, fish processors and fish collectors are usually made in the wet markets or from boat
processors from one of the landing sites.
distribuiton routes for fish within and out of the province.
capacity.
also some of the eggs are sold fresh and are preserved for future sale.
Kampong Chhnang Landing Sites
13
to boat. Due to bad road transportation links to the provincial capital and other important provincial markets, and a toll charge for fresh and processed fish at the rate of 15 and 40 riel per kg, respectively, fish producers and traders send their products by river transport to other important landing sites and wholesale markets. A few retailers use motor-taxi to carry fish to nearby retail markets. Most of such transactions occur at the river stream that connects the road
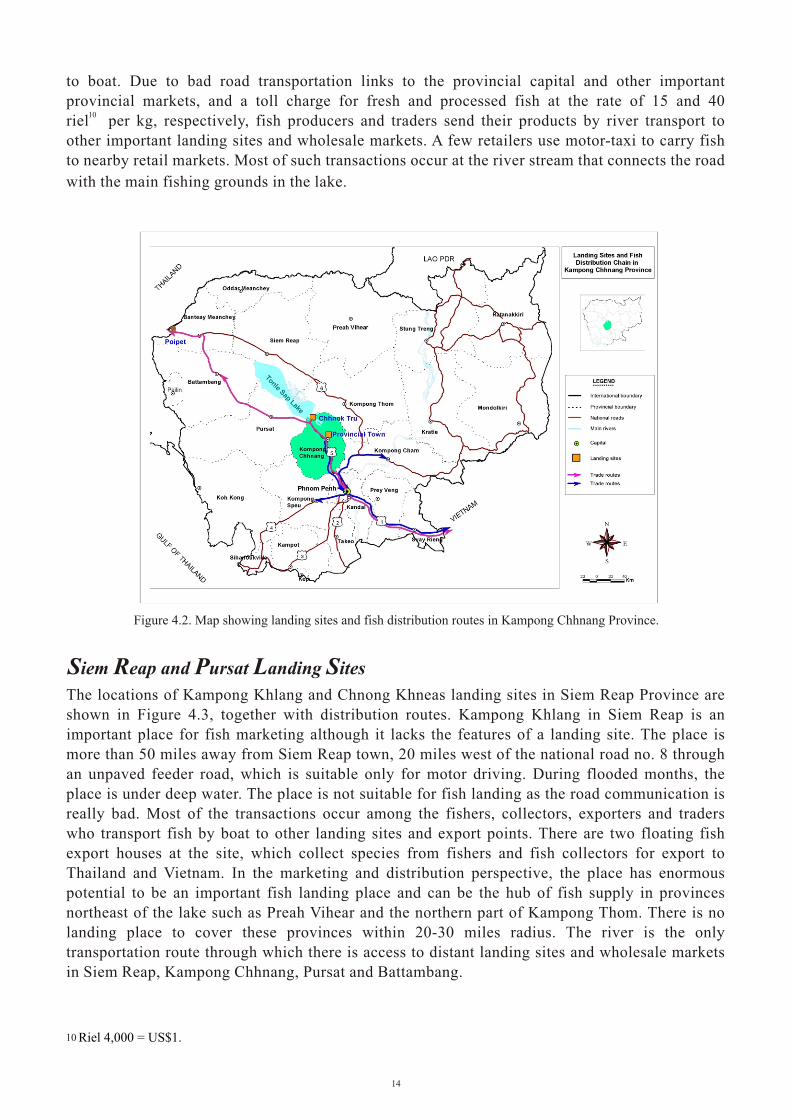
The locations of Kampong Khlang and Chnong Khneas landing sites in Siem Reap Province are shown in Figure 4.3, together with distribution routes. Kampong Khlang in Siem Reap is an important place for fish marketing although it lacks the features of a landing site. The place is more than 50 miles away from Siem Reap town, 20 miles west of the national road no. 8 through an unpaved feeder road, which is suitable only for motor driving. During flooded months, the place is under deep water. The place is not suitable for fish landing as the road communication is really bad. Most of the transactions occur among the fishers, collectors, exporters and traders who transport fish by boat to other landing sites and export points. There are two floating fish export houses at the site, which collect species from fishers and fish collectors for export to Thailand and Vietnam. In the marketing and distribution perspective, the place has enormous potential to be an important fish landing place and can be the hub of fish supply in provinces northeast of the lake such as Preah Vihear and the northern part of Kampong Thom. There is no landing place to cover these provinces within 20-30 miles radius. The river is the only transportation route through which there is access to distant landing sites and wholesale markets in Siem Reap, Kampong Chhnang, Pursat and Battambang.
10
Figure 4.2. Map showing landing sites and fish distribution routes in Kampong Chhnang Province.
Riel 4,000 = US$1.
Siem Reap and Pursat Landing Sites
10
14
with the main fishing grounds in the lake.
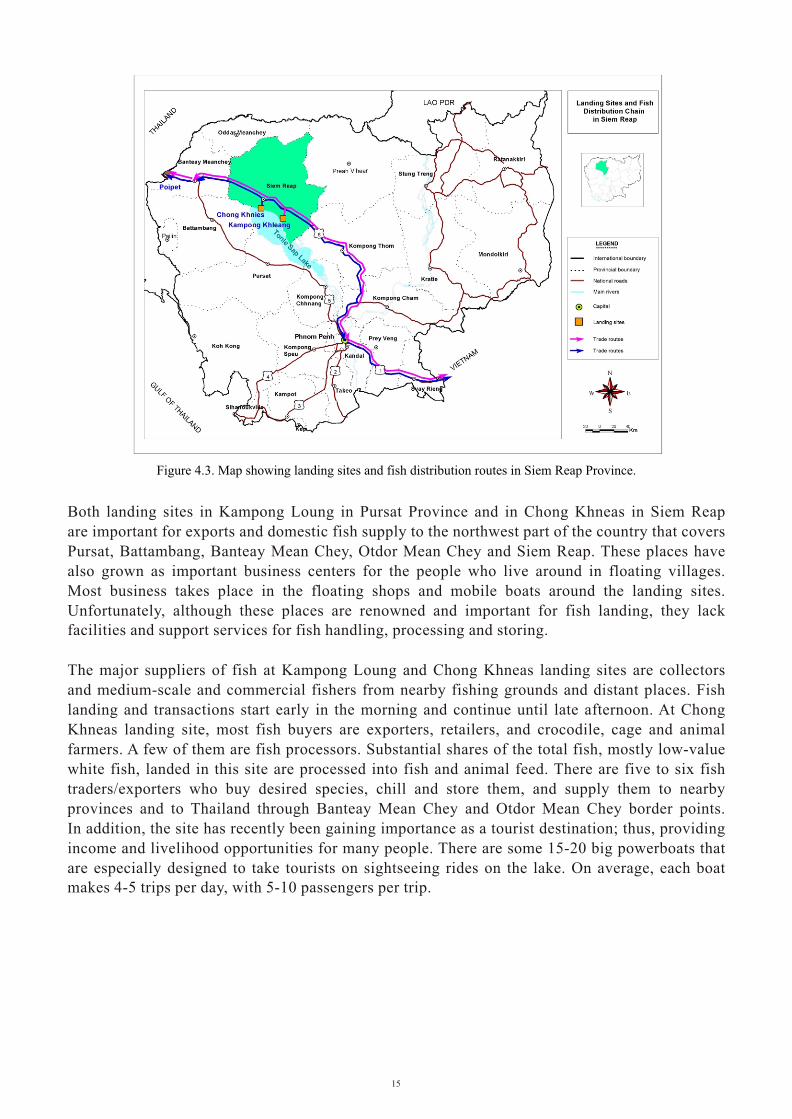
Figure 4.3. Map showing landing sites and fish distribution routes in Siem Reap Province.
Both landing sites in Kampong Loung in Pursat Province and in Chong Khneas in Siem Reap are important for exports and domestic fish supply to the northwest part of the country that covers Pursat, Battambang, Banteay Mean Chey, Otdor Mean Chey and Siem Reap. These places have also grown as important business centers for the people who live around in floating villages. Most business takes place in the floating shops and mobile boats around the landing sites. Unfortunately, although these places are renowned and important for fish landing, they lack
The major suppliers of fish at Kampong Loung and Chong Khneas landing sites are collectors and medium-scale and commercial fishers from nearby fishing grounds and distant places. Fish landing and transactions start early in the morning and continue until late afternoon. At Chong Khneas landing site, most fish buyers are exporters, retailers, and crocodile, cage and animal farmers. A few of them are fish processors. Substantial shares of the total fish, mostly low-value white fish, landed in this site are processed into fish and animal feed. There are five to six fish traders/exporters who buy desired species, chill and store them, and supply them to nearby provinces and to Thailand through Banteay Mean Chey and Otdor Mean Chey border points. In addition, the site has recently been gaining importance as a tourist destination; thus, providing income and livelihood opportunities for many people. There are some 15-20 big powerboats that are especially designed to take tourists on sightseeing rides on the lake. On average, each boat
facilities and support services for fish handling, processing and storing.
makes 4-5 trips per day, with 5-10 passengers per trip.
15

The observation of landing sites suggests that even though fish has become an important commodity due to its increased value both in the domestic and export markets over the past decade, physical facilities and support services at the landing sites still remain basic and traditional. In fact, as per the modern definition of landing sites, these places can in no way be labeled as standard landing place. As per the Food and Agriculture Organization (FAO) manual for fish landing and marketing facilities, fish landing sites should provide basic infrastructure and services so that freshness and quality of fish can be maintained and cross-contamination can be avoided (Pizzali and Medina1988). The most important constraint to developing fixed structures and other landing facilities at these sites is that their locations shift with the changing water level during wet and dry seasons, within the range of 5-10 miles.
The quantity of fish landed at the sample landing sites in one day in the closed season is shown in Table 4.1. Fish were graded according to quality (e.g., size, species, condition) and priced accordingly. There were no data at the landing sites in Kandal Province during that time because it was closed season, and the province was not included in the first-round data collection.
The most important species landed, based on the average for all sample landing sites, are shown in Table 4.2. Overall, three species (kanchak sla, chdaur and chhkok) made up over 40% of fish sold at landing sites, by quantity. Table 4.3 shows the most important species sold by value. The most valuable species were kbork ($5.8/kg), krormorm ($5.0/kg), kanchos thmor ($4.84/kg) and kchoeung ($4.76/kg) although these species made up less than 0.5% of the total quantity sold by volume. These prices were particularly high, reflecting the rarity of the species compared to others. The high prices might have also reflected very high quality and large size, which
4.2. Quantity and Price of Fish at Landing Sites
Table 4.1. Daily quantity and average price of fish at sample landing sites by grade during closed season, August 2003.
Quantity sold/day (kg)
Grade 1
Grade 2
Grade 3
Total
Average price ($/kg)
Grade 1
Grade 2
Grade 3
All
Phnom Penh
7,352.30
8,794.30
3,685.00
19,831.60
3.48
2.50
1.92
2.46
Kampong Chhnang
4,262.00
4,806.00
2,826.00
11,894.00
5.83
3.20
1.81
2.77
Siem Reap
4,778.70
485.40
1,059.80
6,323.90
0.74
0.51
0.48
0.54
Grand Total
16,393.00
14,085.70
7,570.80
38,049.50
3.29
2.47
1.55
2.16
probably qualified the fish for export market.
16
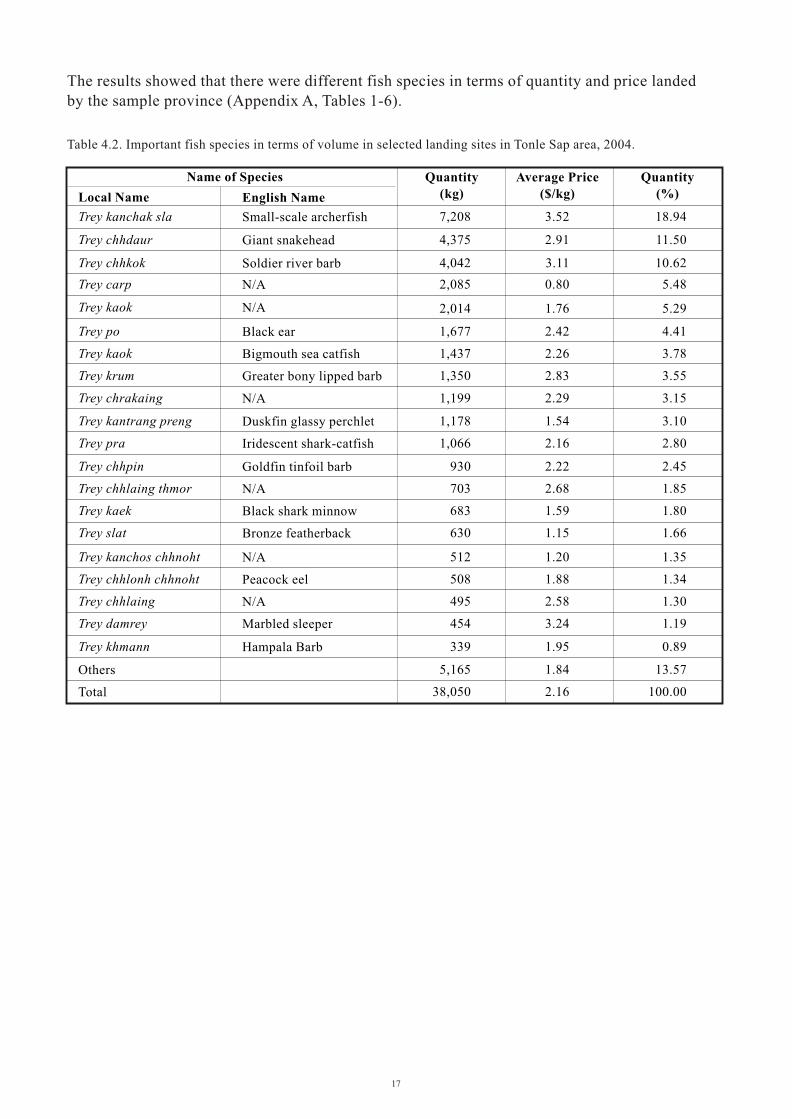
Table 4.2. Important fish species in terms of volume in selected landing sites in Tonle Sap area, 2004.
Local Name
Trey kanchak sla
Trey chhdaur
Trey chhkok
Trey carp
Trey kaok
Trey po
Trey kaok
Trey krum
Trey chrakaing
Trey kantrang preng
Trey pra
Trey chhpin
Trey chhlaing thmor
Trey kaek
Trey slat
Trey kanchos chhnoht
Trey chhlonh chhnoht
Trey chhlaing
Trey damrey
Trey khmann
Others
Total
7,208
4,375
4,042
2,085
2,014
1,350
1,199
1,178
1,066
930
703
683
630
512
508
495
454
339
5,165
38,050
1,677
1,437
3.52
2.91
3.11
0.80
1.76
2.83
2.29
1.54
2.16
2.22
2.68
1.59
1.15
1.20
1.88
2.58
3.24
1.95
1.84
2.16
2.42
2.26
18.94
11.50
10.62
5.48
5.29
4.41
3.78
3.55
3.15
3.10
2.80
2.45
1.85
1.80
1.66
1.35
1.34
1.30
1.19
0.89
13.57
100.00
English Name
Small-scale archerfish
Giant snakehead
Soldier river barb
N/A
N/A
Black ear
Bigmouth sea catfish
Greater bony lipped barb
N/A
Duskfin glassy perchlet
Iridescent shark-catfish
Goldfin tinfoil barb
N/A
Black shark minnow
Bronze featherback
N/A
Peacock eel
N/A
Marbled sleeper
Hampala Barb
Name of Species Quantity(kg)
Average Price($/kg)
Quantity(%)
17
The results showed that there were different fish species in terms of quantity and price landed by the sample province (Appendix A, Tables 1-6).

Table 4.3. Important species in terms of price in all the landing sites in Tonle Sap area.
Local Name English Name
Name of Species Quantity(kg)
Average Price($/kg)
Quantity(%)
Trey kbork
Trey krormorm
Trey kanchos thmor
Trey kchoeung
Trey klaing hay
Trey kanh chorn chey
Trey kanchak sla
Trey sanday
Trey tilapia chhnoht
Trey damrey
Trey chhkok
Trey ka port
Trey promah
Antung
Trey proul
Trey chhdaur
Trey kampliev
Trey krum
Trey kahe
Trey kaok
Trey chhlaing thmor
Trey chhlaing
Trey chhlaing
Trey stuak
Trey prorlung
Trey po
Trey chrakaing
Trey kaok
Trey dangkteng
Others
Total
Laotian shad
N/A
Asian bumblebee catfish
Freckle fin eel
Twisted jaw sheatfish
N/A
Small-scale archerfish
Great white sheatfish
Nile tilapia
Marbled sleeper
Soldier river barb
Malayan bony tongue
Small-scale croaker
Swamp eel or freshwater eel
Small-scale mud carp
Giant snakehead
N/A
Greater bony lipped barb
Redtail tinfoil barb
Spotted sea catfish
N/A
Yellow mystus
N/A
N/A
Mad barb
Black ear
N/A
Bigmouth sea catfish
N/A
11
72
72
22
158
109
7,208
203
33
454
4,042
47
51
20
273
4,375
10
1,350
8
6
703
202
495
63
103
1,677
1,199
1,437
86
13,562
38,050
5.80
5.00
4.84
4.76
4.39
4.30
3.52
3.52
3.33
3.24
3.11
3.10
3.00
3.00
2.94
2.91
2.90
2.83
2.81
2.70
2.68
2.64
2.58
2.52
2.43
2.42
2.29
2.26
2.23
1.18
2.16
0.03
0.19
0.19
0.06
0.42
0.29
18.94
0.53
0.09
1.19
10.62
0.12
0.13
0.05
0.72
11.50
0.03
3.55
0.02
0.02
1.85
0.53
1.30
0.17
0.27
4.41
3.15
3.78
0.23
35.65
100.00
Fresh and processed fish were commonly sold in provincial and local markets. As Table 4.4 shows, a great many individual traders sold fish at city and rural markets, both at covered “indoor” shops and uncovered market stalls. On average, there were 25-107 fresh fish shops and 25-54 processed fish shops per retail market, based on the sample markets. Fish shops/stalls in city markets are generally covered, while provincial and particularly rural markets are more likely to have open stalls selling fish. Overall, processed fish shops/stalls are more commonly covered than fresh fish shops/stalls. This reflects the overall condition of provincial and rural markets (Table 4.5); city and provincial markets are generally covered or partially covered, while rural markets are more likely to be open.
4.3.Observations of Retail Markets
18
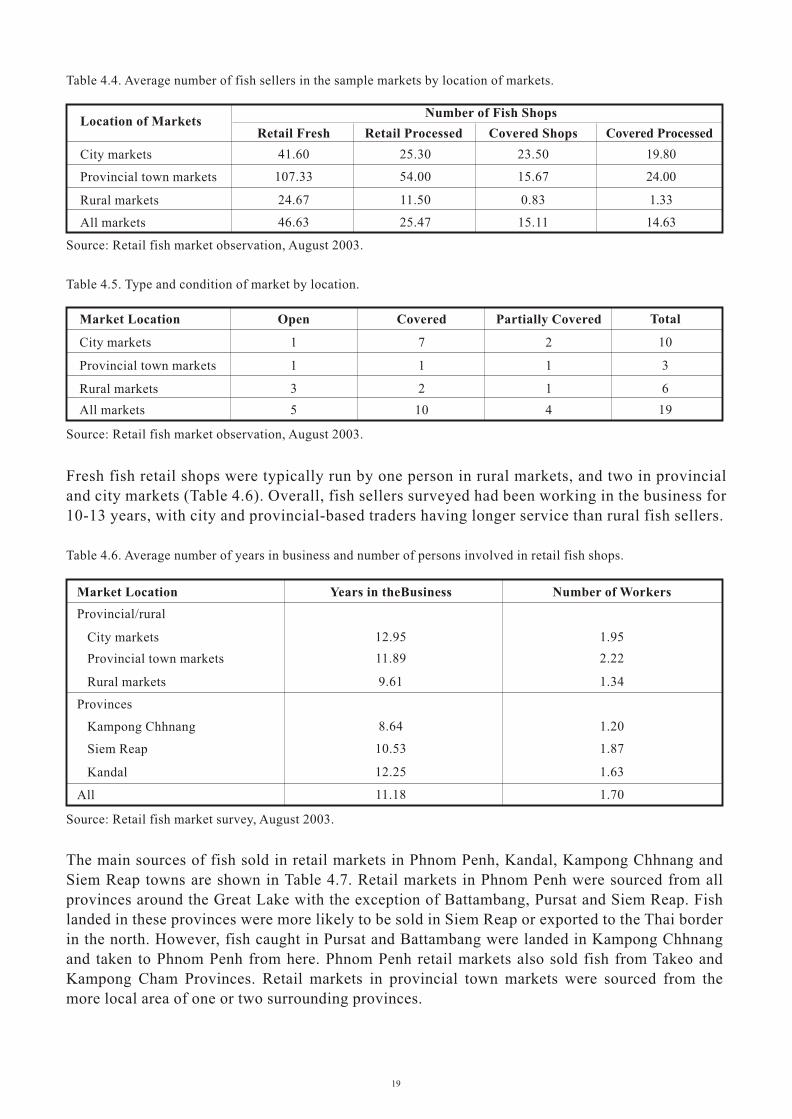
Table 4.4. Average number of fish sellers in the sample markets by location of markets.
Covered Processed
19.80
24.00
1.33
14.63
Source: Retail fish market observation, August 2003.
Table 4.5. Type and condition of market by location.
Source: Retail fish market observation, August 2003.
Fresh fish retail shops were typically run by one person in rural markets, and two in provincial and city markets (Table 4.6). Overall, fish sellers surveyed had been working in the business for 10-13 years, with city and provincial-based traders having longer service than rural fish sellers.
Table 4.6. Average number of years in business and number of persons involved in retail fish shops.
Source: Retail fish market survey, August 2003.
The main sources of fish sold in retail markets in Phnom Penh, Kandal, Kampong Chhnang and Siem Reap towns are shown in Table 4.7. Retail markets in Phnom Penh were sourced from all provinces around the Great Lake with the exception of Battambang, Pursat and Siem Reap. Fish landed in these provinces were more likely to be sold in Siem Reap or exported to the Thai border in the north. However, fish caught in Pursat and Battambang were landed in Kampong Chhnang and taken to Phnom Penh from here. Phnom Penh retail markets also sold fish from Takeo and Kampong Cham Provinces. Retail markets in provincial town markets were sourced from the more local area of one or two surrounding provinces.
Location of Markets
City markets
Provincial town markets
Rural markets
All markets
Number of Fish Shops
Retail Fresh
41.60
107.33
24.67
46.63
Retail Processed
25.30
54.00
11.50
25.47
Covered Shops
23.50
15.67
0.83
15.11
Market Location
City markets
Provincial town markets
Rural markets
All markets
Open
1
1
3
5
Covered
7
1
2
10
Partially Covered
2
1
1
4
Total
10
3
6
19
Market Location
Provincial/rural
City markets
Provincial town markets
Rural markets
Provinces
Kampong Chhnang
Siem Reap
Kandal
All
Years in theBusiness
12.95
11.89
9.61
8.64
10.53
12.25
11.18
1.95
2.22
1.34
1.20
1.87
1.63
1.70
Number of Workers
19
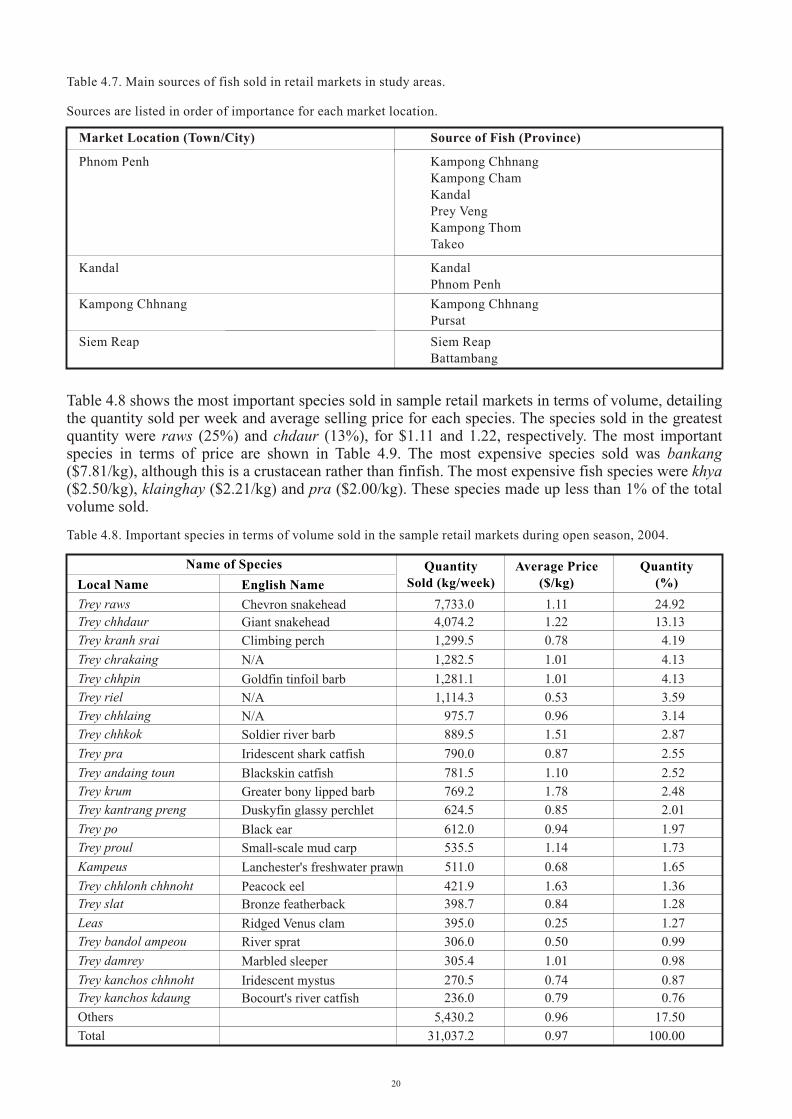
Table 4.7. Main sources of fish sold in retail markets in study areas.
Sources are listed in order of importance for each market location.
Table 4.8 shows the most important species sold in sample retail markets in terms of volume, detailing the quantity sold per week and average selling price for each species. The species sold in the greatest quantity were raws (25%) and chdaur (13%), for $1.11 and 1.22, respectively. The most important species in terms of price are shown in Table 4.9. The most expensive species sold was bankang ($7.81/kg), although this is a crustacean rather than finfish. The most expensive fish species were khya ($2.50/kg), klainghay ($2.21/kg) and pra ($2.00/kg). These species made up less than 1% of the total volume sold.
Table 4.8. Important species in terms of volume sold in the sample retail markets during open season, 2004.
Trey raws
Trey chhdaur
Trey kranh srai
Trey chrakaing
Trey chhpin
Trey riel
Trey chhlaing
Trey chhkok
Trey pra
Trey andaing toun
Trey krum
Trey kantrang preng
Trey po
Trey proul
Kampeus
Trey chhlonh chhnoht
Trey slat
Leas
Trey bandol ampeou
Trey damrey
Trey kanchos chhnoht
Trey kanchos kdaung
Others
Total
Chevron snakehead
Giant snakehead
Climbing perch
N/A
Goldfin tinfoil barb
N/A
N/A
Soldier river barb
Iridescent shark catfish
Blackskin catfish
Greater bony lipped barb
Duskyfin glassy perchlet
Black ear
Small-scale mud carp
Lanchester's freshwater prawn
Peacock eel
Bronze featherback
Ridged Venus clam
River sprat
Marbled sleeper
Iridescent mystus
Bocourt's river catfish
7,733.0
4,074.2
1,299.5
1,282.5
1,281.1
1,114.3
975.7
889.5
790.0
781.5
769.2
624.5
612.0
535.5
511.0
421.9
398.7
395.0
306.0
305.4
270.5
236.0
5,430.2
31,037.2
1.11
1.22
0.78
1.01
1.01
0.53
0.96
1.51
0.87
1.10
1.78
0.85
0.94
1.14
0.68
1.63
0.84
0.25
0.50
1.01
0.74
0.79
0.96
0.97
24.92
13.13
4.19
4.13
4.13
3.59
3.14
2.87
2.55
2.52
2.48
2.01
1.97
1.73
1.65
1.36
1.28
1.27
0.99
0.98
0.87
0.76
17.50
100.00
Local Name English Name
Name of Species QuantitySold (kg/week)
Average Price($/kg)
Quantity(%)
Kampong Chhnang Kampong ChhnangPursat
Market Location (Town/City)
Phnom Penh
Source of Fish (Province)
Kampong ChhnangKampong ChamKandalPrey VengKampong ThomTakeo
Kandal KandalPhnom Penh
Siem Reap Siem ReapBattambang
20

The overall average amounts and prices of fresh fish sold in retail markets, together with average travel costs and market fees and taxes are shown in Table 4.10. On average, fresh fish sellers in city and provincial markets sold more fish for a higher price than rural fish sellers (79-83 kg/day at $1.14-1.60/kg compared to 42 kg/day at $0.66/kg). However, fish sellers in provincial and city markets paid much higher taxes and fees than rural market sellers ($106-130/month compared to $31/month). The average transport costs were highest for fish sellers in city markets ($23.33/day) and lowest for provincial markets ($0.83/day). Fish sellers at rural markets paid an average of $5.05/day for transport costs. Fish sellers at provincial and city markets were able to recoup the higher transport costs and taxes by charging higher prices for fish. Fish sellers in rural and city markets expended 22% of the daily takings on transport costs and taxes. In contrast, fish sellers at provincial markets paid only 5% of the daily takings on fees and taxes. Moreover, the amount and price of fish sold in the selected retail markets were for different fish species by province (Appendix A, Tables 7-11).
Bankang
Trey khya
Trey klaing hay
Trey pra, Trey bong lao
Trey krum
Trey sanday
Trey pawa muk py
Trey kray
Trey kbork
Trey chhlonh chhnoht
Trey chhkok
Trey kanchos thmor
Trey kaok
Trey kes
Trey ka port
Trey kchoeung
Antung
Trey pream, Trey kam pream
Trey pra kandor
Trey krormorm
Trey chhdaur
Others
Total
Giant freshwater shrimp
N/A
Twisted jaw sheatfish
N/A
Greater bony lipped barb
Great white sheatfish
N/A
Royal featherback
Loatian shad
Peacock eel
Soldier river barb
Asian bumblebee catfish
Soldier catfish
Common sheatfish
Malayan bony tongue
Spiny Eel
Swamp eel or freshwater eel
Fringed threadfin
N/A
N/A
Giant snakehead
98.0
1.5
96.5
6.5
769.2
128.0
1.5
26.5
2.0
421.9
889.5
46.5
6.0
215.0
38.0
39.8
53.5
7.5
2.7
121.0
4,074.2
23,991.9
31,037.2
7.81
2.50
2.21
2.00
1.78
1.76
1.75
1.71
1.69
1.63
1.51
1.50
1.50
1.46
1.36
1.36
1.27
1.25
1.23
1.23
1.22
0.75
1.84
0.32
0.01
0.31
0.02
2.48
0.41
0.01
0.09
0.01
1.36
2.87
0.15
0.02
0.69
0.12
0.13
0.17
0.02
0.01
0.39
13.13
77.30
100.00
Local Name English Name
Name of Species Quantity(kg)
Average Price($/kg)
Quantity(%)
Table 4.9. Important species in terms of price in the sample retail markets during open season, 2004.
21
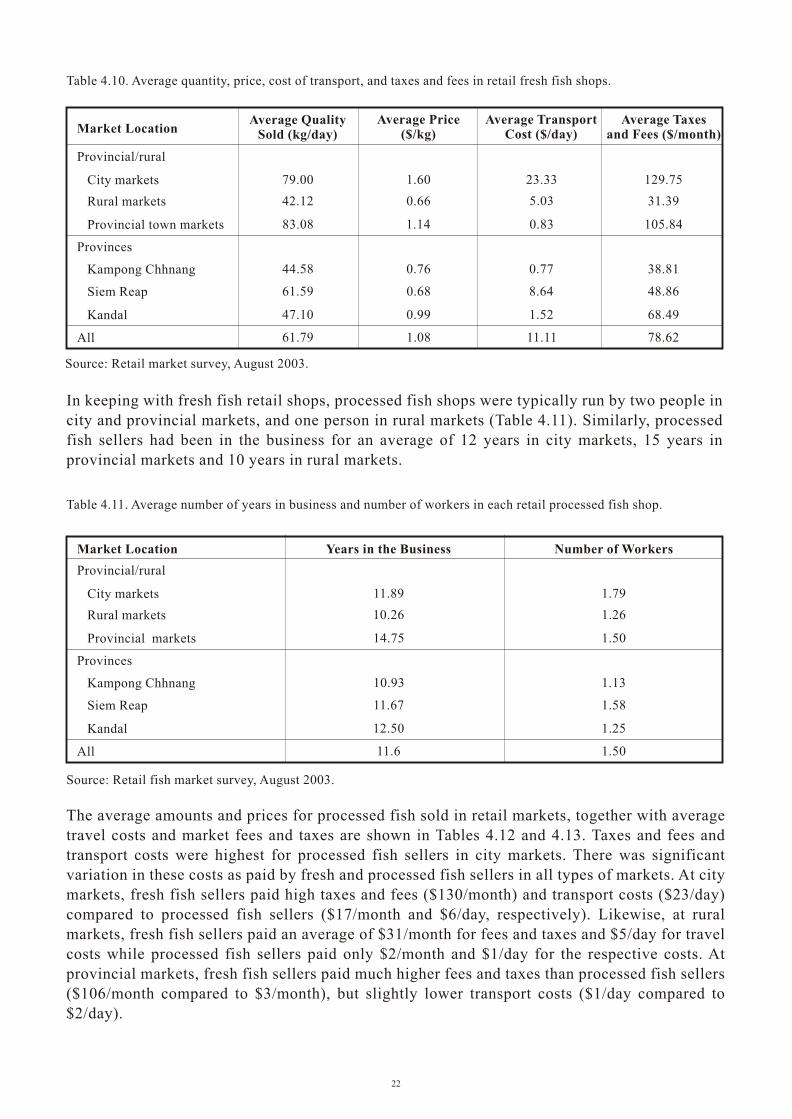
Table 4.10. Average quantity, price, cost of transport, and taxes and fees in retail fresh fish shops.
Market Location
Provincial/rural
City markets
Provincial markets
Rural markets
Provinces
Kampong Chhnang
Siem Reap
Kandal
All
Years in the Business
11.89
10.26
14.75
10.93
11.67
12.50
11.6
1.79
1.26
1.50
1.13
1.58
1.25
1.50
Number of Workers
Source: Retail market survey, August 2003.
In keeping with fresh fish retail shops, processed fish shops were typically run by two people in city and provincial markets, and one person in rural markets (Table 4.11). Similarly, processed fish sellers had been in the business for an average of 12 years in city markets, 15 years in provincial markets and 10 years in rural markets.
Table 4.11. Average number of years in business and number of workers in each retail processed fish shop.
Source: Retail fish market survey, August 2003.
The average amounts and prices for processed fish sold in retail markets, together with average travel costs and market fees and taxes are shown in Tables 4.12 and 4.13. Taxes and fees and transport costs were highest for processed fish sellers in city markets. There was significant variation in these costs as paid by fresh and processed fish sellers in all types of markets. At city markets, fresh fish sellers paid high taxes and fees ($130/month) and transport costs ($23/day) compared to processed fish sellers ($17/month and $6/day, respectively). Likewise, at rural markets, fresh fish sellers paid an average of $31/month for fees and taxes and $5/day for travel costs while processed fish sellers paid only $2/month and $1/day for the respective costs. At provincial markets, fresh fish sellers paid much higher fees and taxes than processed fish sellers ($106/month compared to $3/month), but slightly lower transport costs ($1/day compared to $2/day).
Market Location
Provincial/rural
City markets
Provincial town markets
Rural markets
Provinces
Kampong Chhnang
Siem Reap
Kandal
All
Average QualitySold (kg/day)
79.00
42.12
83.08
44.58
61.59
47.10
61.79
1.60
0.66
1.14
0.76
0.68
0.99
1.08
Average Price($/kg)
Average Taxes and Fees ($/month)
129.75
31.39
105.84
38.81
48.86
68.49
78.62
23.33
5.03
0.83
0.77
8.64
1.52
11.11
Average TransportCost ($/day)
22
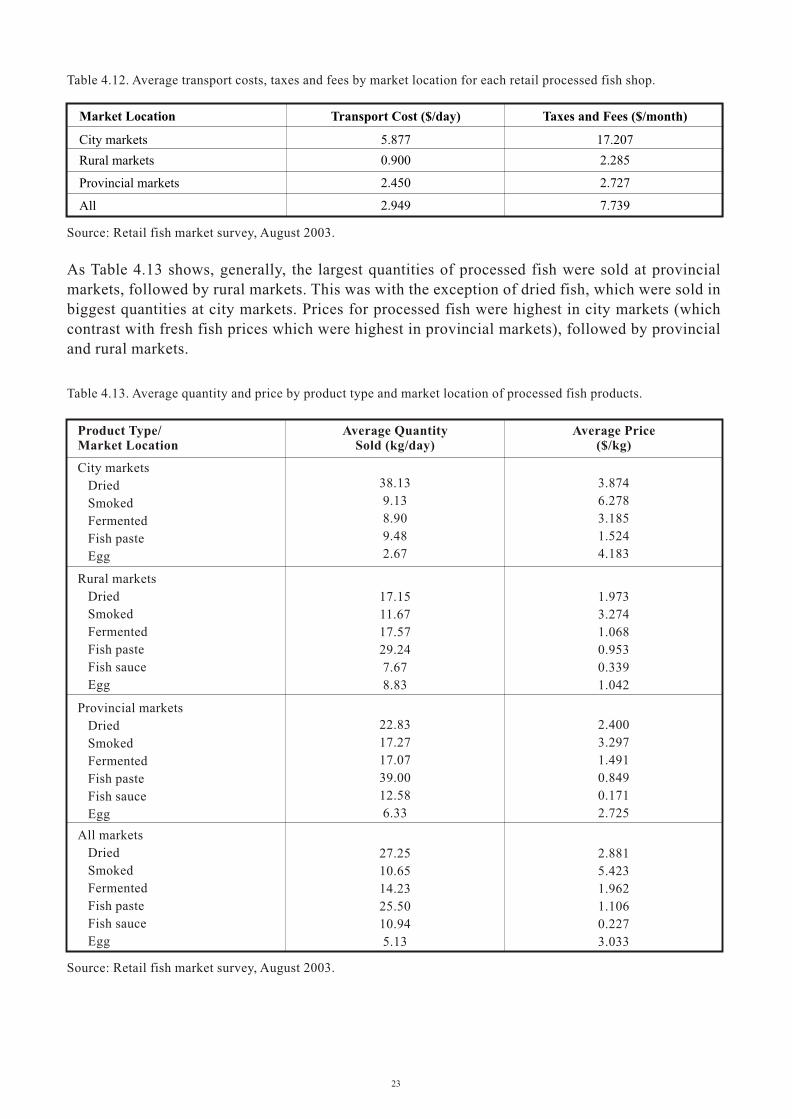
Table 4.12. Average transport costs, taxes and fees by market location for each retail processed fish shop.
Source: Retail fish market survey, August 2003.
As Table 4.13 shows, generally, the largest quantities of processed fish were sold at provincial markets, followed by rural markets. This was with the exception of dried fish, which were sold in biggest quantities at city markets. Prices for processed fish were highest in city markets (which contrast with fresh fish prices which were highest in provincial markets), followed by provincial and rural markets.
Table 4.13. Average quantity and price by product type and market location of processed fish products.
Source: Retail fish market survey, August 2003.
Market Location
City markets
Rural markets
Provincial markets
All
Transport Cost ($/day)
5.877
0.900
2.450
2.949
Taxes and Fees ($/month)
17.207
2.285
2.727
7.739
City markets
Dried
Smoked
Fermented
Fish paste
Egg
38.13
9.13
8.90
9.48
2.67
3.874
6.278
3.185
1.524
4.183
Product Type/Market Location
Average Quantity Sold (kg/day)
Average Price ($/kg)
Rural markets
Dried
Smoked
Fermented
Fish paste
Fish sauce
Egg
17.15
11.67
17.57
29.24
7.67
8.83
1.973
3.274
1.068
0.953
0.339
1.042
Provincial markets
Dried
Smoked
Fermented
Fish paste
Fish sauce
Egg
All markets
Dried
Smoked
Fermented
Fish paste
Fish sauce
Egg
22.83
17.27
17.07
39.00
12.58
6.33
27.25
10.65
14.23
25.50
10.94
5.13
2.881
5.423
1.962
1.106
0.227
3.033
2.400
3.297
1.491
0.849
0.171
2.725
23
5.1. Stakeholders in the Supply Chain
The most complicated component of the fish marketing system in Cambodia is the supply chain and distribution channels in which numerous transactions take place before fish and fish products reach the consumer or export markets. There are many middlepersons (often women) who, in all their guises, are essential for the fisheries trade. The trading system would not function without
The fish distribution networks are relatively well-managed in inland fisheries. There are two types of fish trader in inland fisheries, i.e., small- and medium-scale. In general, the small traders collect fish directly from fishers at the fishing ground and sell these to wholesalers or fish traders who distribute them to different markets (i.e., local and outside of the province). There is high domestic demand for fish and fish products, ranging from live to processed forms, such as fish paste, fermented fish, dry salted fish, steamed fish, smoked fish, fish-sauce, etc. High-value species are usually sold to traders for marketing in Phnom Penh or for exporting.
The main players of the supply chain of fisheries products system are the fishing lot owner, fisher, fish collector, wholesaler/trader/middleperson and retailer. Following is a description of each of
Lot owners control the fish product and function as fish suppliers to wholesalers/traders, fish processors, fish collectors and exporters at fishing lot or landing site. Lot owners never export fish to Thailand directly by themselves, but generally stock fish in pen cage for selling to Phnom Penh market during closed season. Fishing lot owners market their fish in fresh and processed forms. Some of them bring their fish by cage to Phnom Penh's central or regional markets. Some lot owners are reportedly financed by larger exporters, traders or government officials, and are
Fishers are classified as small-, medium- and large-scale, depending on the size of catch potential and type of fishing gear. Small-scale (family-scale) fishers consist of 1-3 persons who fish primarily for family subsistence and income. The number of small-scale fishers is increasing annually as the population grows and as alternative livelihoods become scarce. Medium-scale fishers are extended families and village level partnerships (3-6 persons) who catch fish for family income and processing. These kinds of fishers sell to fish collectors and sometimes
Fishing Lot Owners
these entrepreneurial individuals and their enterprises.
these stakeholders in the supply chain.
subsequently required to sell their catch to these financiers.
directly to consumers.
Fishers
24
5. SUPPLY CHAIN OF INLAND
FISHERIES PRODUCTS
5. SUPPLY CHAIN OF INLAND
FISHERIES PRODUCTS

Fish collectors collect fish directly from fishers at the fishing ground. Generally, they have one or several boats which contain several ice boxes for fish storage during the fish collection period. Fish collectors are specialized operators who proceed with fish buying throughout the year, buying fish from fishers and bringing these to the landing site. They set prices withfishers, depending on fish quality, supply situation and daily fish market demand. Most fish collectors have capital for immediate cash payment to fishers, although they also often provide credit in cash and in kind (e.g., fishing gear). In practice, some collectors also get loans from wholesalers, middlepersons and exporters to whom they sell fish at the landing site.
Wholesalers/traders represent an important part of the fish marketing chain in that often, major quantities of fish are channeled through them. In Cambodia, they are best compared to fish distributors who have a permanent fish stall at a fish landing site, floating village or distribution center. They usually buy fish from fishers, lot owners, collectors or middlepersons and sell theseto exporters, retailers and restaurants. This business is very much location-specific, and the scale may depend on whether a wholesaler is based in a provincial town or in the Phnom Penh area.
Defined as semi-wholesalers are those fish traders who have a permanent stall inside/outside a market, whereby fish are brought by middlepersons or wholesalers and sold to them at the market. Semi-wholesalers act sometimes as retailers but they usually have an additional function in distributing fish to small retailers who sell fish at local markets directly to consumers and processors. Most semi-wholesalers are fish traders at the provincial level but some of them also operate in Phnom Penh, or may transport fish from the capital to sell to retailers in fish-deficit
Defined as fish retailers are those who sell fish in markets directly to consumers or restaurants. In many cases, they have a permanent stall inside or outside the market. Generally, in each market (from provincial to local levels) there are many fish retailers selling fish every day. Fish retailerswho sell fish in the market are mostly women but they often have their spouses or relatives who help them buy fish from the landing site or the distribution center. Some fish retailers who work alone (i.e., those who are widow/ers) buy fish from semi-wholesalers in the same market or place
In addition, there are also retailers who are itinerant traders in that they do not have a permanent stall but sell from a basket or another container by moving from place to place.
Fish processors are generally fishers or fish raisers (but not all of them) or businesspersons. The processors, who mainly buy fish from fish lot owners or traders/middlepersons/fish collectors, produce fish paste, salted dried fish, fermented fish, smoked fish, etc. Processed products are usually sold to domestic markets; some are also sold to international markets with specific
Fish Processors
Wholesalers/Traders
Semi-wholesalers
Retailers
provinces.
where they sell fish directly to consumers.
products and species.
25
Fish Collectors
Others Stakeholders
26
Exporters export fisheries products to neighbors and other countries. They generally purchase fish directly from fishing lot owners or traders/middlepersons, store them with ice in containers and
Fish transporters provide only transportation service to fish traders/wholesalers and do not buy or sell fish. They are important in the fish trade channel. The transportation means differfrom one area to another. Fish are usually transported by boat, motorbike, mini truck or pick-up car from fishing ground to landing site, local market and fish distribution center.
Many other stakeholders and beneficiaries who are involved to a lesser degree in fish marketing
Transporters own trucks and boats that transport fish from the fishing ground to the landing site, fish processors and markets in Cambodia and export markets at Thailand and Vietnam. Transporters pay a registration fee to the DOF and also a series of unofficial road taxes from the
Exporters
Transporters
export them by land or air as live fish.
and trade include the following: - fish handlers/workers at landing sites and markets;- fishing equipment producers and sellers;- boatmakers;- money lenders;- ice suppliers;- salt suppliers;- boat and motor-taxi drivers;- fisheries officers;- police and local authorities;- basket producers and sellers;- landing place owners; and - market managers.
landing site to the final destination.
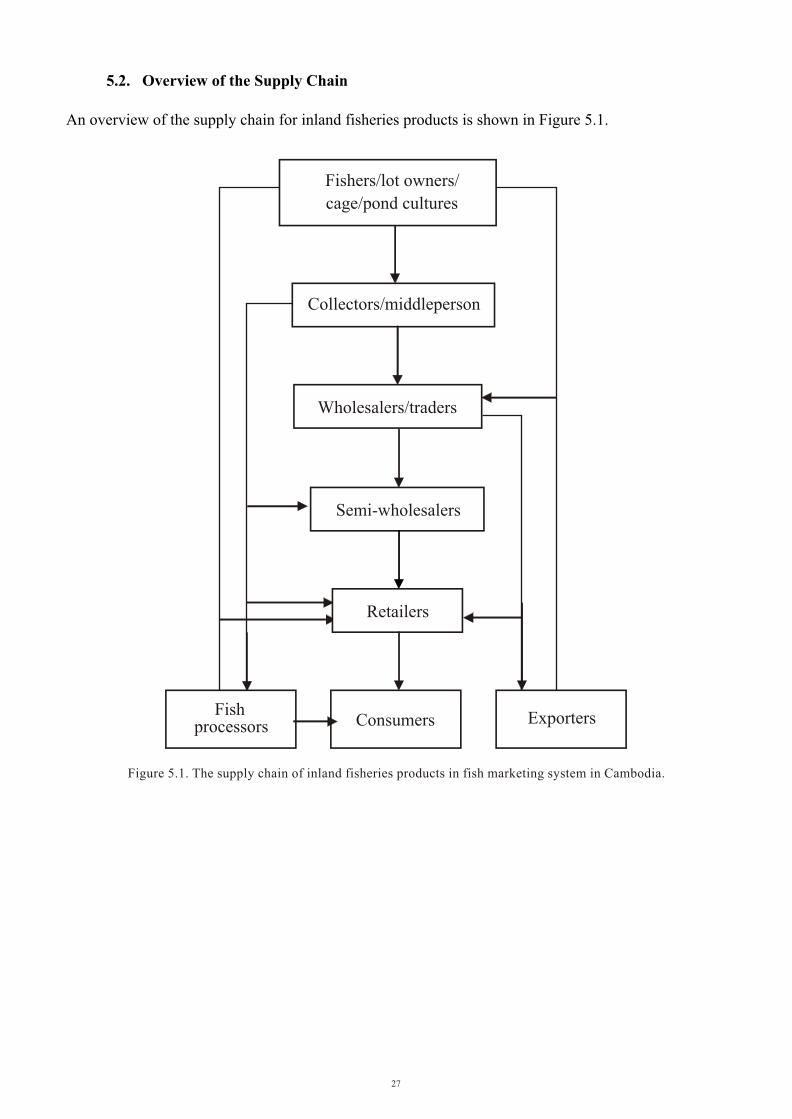
Figure 5.1. The supply chain of inland fisheries products in fish marketing system in Cambodia.
Fishers/lot owners/
cage/pond cultures
Collectors/middleperson
Wholesalers/traders
Semi-wholesalers
Retailers
ExportersConsumersFish
processors
27
5.2. Overview of the Supply Chain
An overview of the supply chain for inland fisheries products is shown in Figure 5.1.
6. Fish Processing 6. Fish Processing
Fish from freshwater capture fisheries are processed using both traditional and modern technologies. The traditional processing of fish can be classified as small-, middle- and large-scale(commercial). Normally, traditionally processed fish products are for domestic consumption, whereas modern processing industries supply both domestic and export markets.
Small-scale (family-scale) processing is a common practice for Cambodians, who are very fond of processed fisheries products like fish paste, fish sauce, dried salted fish, smoked fish, etc. These traditional ways of processing fish are well adapted to the irregularity of the seasonal fish catch. In the very short peak period for inland fish catches, it is necessary to process fish quickly and in a basic way, i.e., by hand within the household. For example, in the production of fish paste and fish sauce, salt is added immediately to conserve fish, which can be kept in this form for the whole year. The salted fish is further processed by the addition of water and other ingredients and left to ferment to make fish sauce. Though the final product is of low value, it is a way of handling the amount of fish during peak period. In general, small-scale fish processing is an activity of households which process for family consumption and to sell in the village and local market. They generally live near the river, fishing lots and
Middle-scale fish processing operations are usually family-run, relying on the members' labor, with the help of relatives and some hired labor during peak periods. An average of 5-10 workers is hired, depending on the fishing season. These operations are usually located near fishing lots, fishing villages or landing sites. Generally, they involve processing fish to produce dried salted fish, smoked fish, fermented fish (pha-ork), and fish paste (pha-ork), etc. The market for sun-dried fish for animal feed has expanded markedly in the last few years, particularly for
Large-scale processing is generally operated by fisheries enterprises and fish-sauce factories. They usually employ about 40-60 workers, 80% of whom are females who are involved in the activities of transforming fish into dried salted fish products, ordinary fish pastes, boneless fish pastes (with high value), fermented fish (pha-ork) and smoked fish (Tana, 1993). Large-scale operations are normally run by private individuals, often fishers or their relatives, and are usually located in fishing villages near fishing lots, especially in the Great Lake and the Tonle Sap River.
6.1. Traditional Fish Processing
lakes and in upland areas.
export to Vietnam.
28
In general, fisheries products obtained from industrial fish processing are mainly destined for export to international market. These enterprises are owned by private companies and foreigners, and are located in Phnom Penh and Sihanoukville. They are operated under supervision of the government, and are represented by the fisheries company KAMFIMEX. There are four freezing processing plants in Cambodia, all of which hold export permits. One plant is in Phnom Penh and three are in Sihanoukville. Two of the facilities are owned by a Cambodian firm, Liang Heng Trading Company. There are also some small freezing facilities which undertake contract processing mainly for traders, including KAMFIMEX, the state-owned trading company. The other one is owned by a foreign firm, SUN WAH enterprise, which has headquarters in Hong
Liang Heng Trading Company in Phnom Penh operates two processing plants: one has 100% Cambodian investment whereas the other has foreign investment from Hong Kong. This company produces freshwater products, such as frozen fish and shrimp, smoked fish and fish fillet, which are exported to the USA, Australia, Singapore and Hong Kong. The second processing plant located in Sihanoukville has been leased out by the government to foreign investors from Hong Kong and Taiwan. All products from this enterprise are exported to two buyers in Hong Kong and
Sun Wah Factory in Sihanoukville was established in August 1996 with 100% foreign investment by the large Hong Kong-based conglomerate Sun Wah. It is a medium-scale operation with a daily capacity to process 10 t of raw materials. All fisheries products are mainly exported to the head quarters in Hong Kong and some of these are then re-exported to other international markets. The headquarters in Hong Kong is responsible for marketing the products. The main
Fish-processing activity is one of the sources of additional income for households who live with or near fisheries resources around the Tonle Sap-Great Lake and Bassac-Mekong River. Moreover, fish processing benefits a huge amount of the labor force, especially women and children, and is therefore of great importance to the local economy. However, the processors, as well as stakeholders involved in fish processing and labor activities, often still live in poverty
6.2. Modern or Industrial Fish Processing
Kong.
Taiwan.
goods for export are shrimps and squids and some finfish.
29
6.3. Survey of Fish Processors
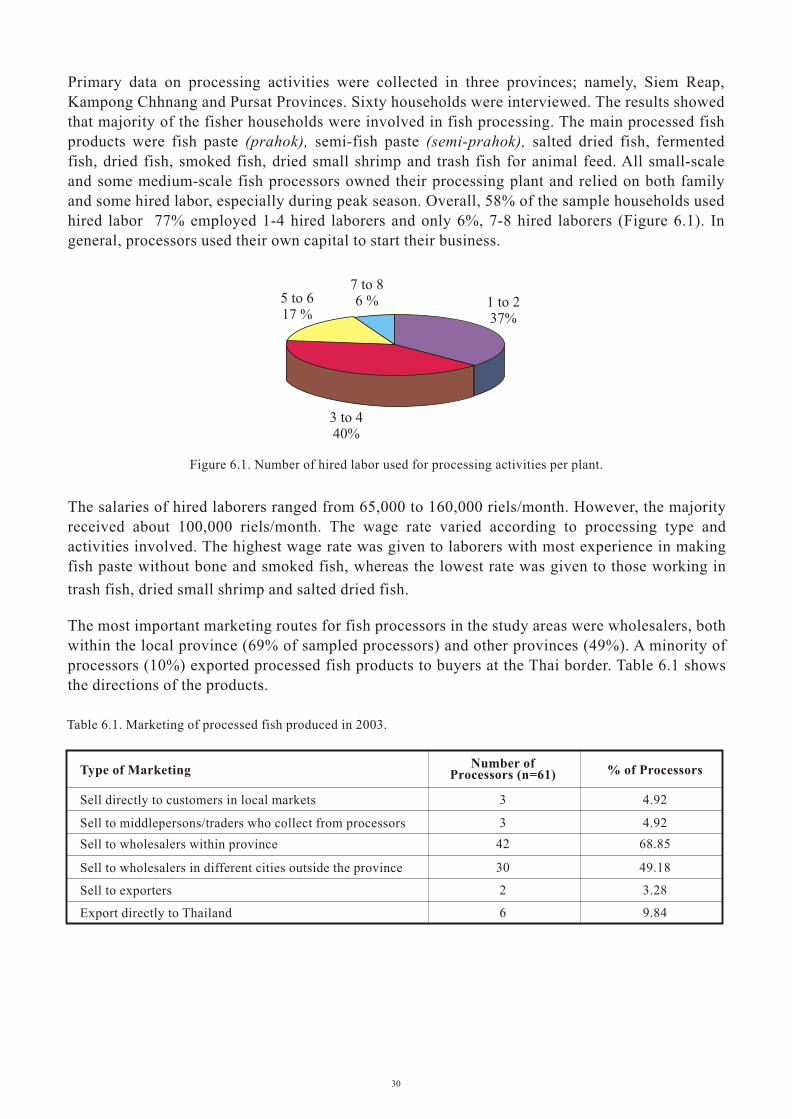
Primary data on processing activities were collected in three provinces; namely, Siem Reap, Kampong Chhnang and Pursat Provinces. Sixty households were interviewed. The results showed that majority of the fisher households were involved in fish processing. The main processed fish products were fish paste (prahok), semi-fish paste (semi-prahok), salted dried fish, fermented fish, dried fish, smoked fish, dried small shrimp and trash fish for animal feed. All small-scale and some medium-scale fish processors owned their processing plant and relied on both family and some hired labor, especially during peak season. Overall, 58% of the sample households used hired labor 77% employed 1-4 hired laborers and only 6%, 7-8 hired laborers (Figure 6.1). In general, processors used their own capital to start their business.
Figure 6.1. Number of hired labor used for processing activities per plant.
The salaries of hired laborers ranged from 65,000 to 160,000 riels/month. However, the majority received about 100,000 riels/month. The wage rate varied according to processing type and activities involved. The highest wage rate was given to laborers with most experience in making fish paste without bone and smoked fish, whereas the lowest rate was given to those working in
The most important marketing routes for fish processors in the study areas were wholesalers, both within the local province (69% of sampled processors) and other provinces (49%). A minority of processors (10%) exported processed fish products to buyers at the Thai border. Table 6.1 shows the directions of the products.
7 to 86 %5 to 6
17 %1 to 237%
3 to 440%
trash fish, dried small shrimp and salted dried fish.
30
Table 6.1. Marketing of processed fish produced in 2003.
Type of Marketing
Sell directly to customers in local markets
Sell to middlepersons/traders who collect from processors
Sell to wholesalers within province
Sell to wholesalers in different cities outside the province
Sell to exporters
Export directly to Thailand
Number of Processors (n=61)
3
3
42
30
2
6
% of Processors
4.92
4.92
68.85
49.18
3.28
9.84
7. Export Markets7. Export Markets
s fisheries products are the most valuable source of animal protein for daily food in Cambodia as well as in the world, the domestic and international demand for fish commodity and fish products is high compared to other animal meat. In Cambodia, the most important fisheries products are derived from inland fisheries. Marketing and distribution networks are well developed for inland fisheries products. There are small and middle-scale fish traders in the fisheries sector. High-value species are usually sold in the international market.
In general, a lack of complete and accurate data at the national level makes it difficult to quantify the fishery exports from Cambodia. Table 7.1 shows the official statistics of inland and marine fish exports from 1992 to 2002 from Cambodia (DoF 2002). The data indicated that the volume
However, the actual exports are much higher than these figures as exporters commonly do not report all exports at land border points, and the main export destinations are Thailand and Vietnam. Live freshwater fish are exported to other Asian markets; namely, Singapore, Malaysia, Hong Kong, and China. Taiwan, Japan, Australia and the USA are markets for frozen fish, fish fillet and ball, and salted dried fish. Until now, Cambodia does not have the European Union (EU) Commission's approval to export fisheries products to the EU markets due mainly to lack of quality control certification. Fish sauce has been exported to Thailand from Battambang, Siem Reap and Kampong Chhnang Provinces, and to Vietnam from Kampong Cham, Kandal, Takeo, Phnom Penh and Prey Veng.
A
of fish exports increased in year 2002 compared to many years ago.
31

Table 7.1. Exports of inland and marine fisheries products by each province in Cambodia, 1992-2002.
2,905
1,065
40
110
96
40
-
-
72
4,510
475
700
5,516
3,066
-
1,580
3,250
8,400
36,870
Source: DOF (2002).
Name of City or Province
Phnom Penh
Kandal
Prey Veng
Takeo
Kompong Cham
Kratie
Stung Treng
Rattanakiri
Kompong Thom
Kompong Chhnang
Pursat
Battambang
Banteay Meanchey
Siem Reap
Kep
Kampot
Sihanoukville
Koh Kong
KAMFIMEX Company
Total
1992
-
1,138
1,020
120
70
-
-
-
1,245
1,332
1,050
1,000
69
1,810
-
1,620
6,100
13,600
4,197
34,371
1993
2,343
835
1,000
60
78
-
-
-
430
705
170
1,417
-
2,885
-
762
4,093
14,200
3,354
32,332
1994
1,540
1,397
920
90
336
85
-
-
365
853
560
595
43
2,296
-
983
4,528
9,585
3,497
27,673
1995
1,631
50
108
223
27
-
-
19
675
498
675
14
5,523
-
2,343
3,845
2,000
6,185
23,816
1996
2,000
570
50
120
120
40
-
-
20
1,420
570
650
110
3,310
-
2,000
3,610
6,000
4,110
24,700
YEAR
Name of City or Province
Phnom Penh
Kandal
Prey Veng
Takeo
Kompong Cham
Kratie
Stung Treng
Rattanakiri
Kompong Thom
Kompong Chhnang
Pursat
Battambang
Banteay Meanchey
Siem Reap
Kep
Kampot
Sihanoukville
Koh Kong
KAMFIMEX Company
Total
1997 1998 1999 2000 2002
YEAR
2001
3,660
1,350
500
78
53
45
12
-
63
4,430
510
495
3,925
3,670
-
1,500
6,582
7,000
40,240
3,990
800
500
272
87
50
10
-
52
11,210
430
403
3,444
2,124
22
1,200
7,006
8,400
43,600
1,655
1,000
450
35
30
40
15
-
50
12,000
430
500
4,130
2,930
15
1,000
7,140
8,820
44,600
2,550
1,000
800
1080
55
50
60
45
110
4,800
2350
160
780
2,630
30
1,120
6,500
12,180
38,100
4,080
5,890
770
720
670
60
65
100
290
6,590
5650
330
1,285
5,600
30
630
7,430
12,310
5,045 6,367 3,6004,360 1,800 -
52,500
32

Table 7.2 shows some trade statistics collected from importing countries. As mentioned earlier, the actual exports of marine and freshwater fisheries products to Thailand are much higher than the figures reported by Thai official sources. Besides the reported imports, a substantial quantity of marine fisheries products, mainly high-value finfish, shrimp and cephalopods, leaves the border unreported. According to the DOF office in Sihanoukville (pers. comm.), only 20% of the exports of marine fishery products take place officially, the remaining 80% are smuggled by sea to Thai traders who supply fuel and ice to Cambodian fishers.
Table 7.2. Imports of fisheries products from Cambodia to selectedmarkets, 1998-1999
Importing Country
Hong Kong (1999)
Malaysia (1998)
Thailand (1999)
USA (1999)
Singapore (1999)
China (1998)
Quantity (t)
648
173
3,342
280
108
15
Value ($)
6,137,820
2,632,849
1,224,989
1,063,464
1,000
24,761
Source: Ferdouse (2000).
There are three types of exports in freshwater fisheries products in Cambodia: (1) export of chilled fish by land using big trucks and cars (to Thailand); (2) export of live freshwater species and catfish fingerlings by waterway using cages with big boats (to Vietnam); and (3) export of
According to the fisheries export company KAMFIMEX, the most lucrative markets for Cambodia's fisheries exports are: first, USA and Australia; second, China, Hong Kong, Singapore
Tables 7.3 and 7.4 show the top 20 important species for export in terms of volume and price from sample traders in Phnom Penh, Kampong Chhnang and Siem Reap Provinces in the closed season. In terms of volume, the highest fish species were chhpin (39%), kanchos thmor (9%), slat (7%) and chhlang (6%). In terms of average export price, the most important species were live damrey ($42/kg, 2.4% of export volume), fresh damrey ($23/kg, 1.4% of export volume), promah and khya ($11/kg) and kanchos thmor ($7/kg). For the rest, the average export price ranged from $1 to 4/kg.
high-value live fish and some fish products by air (to Asian countries).
and Malaysia; and third, Thailand and Vietnam.
33
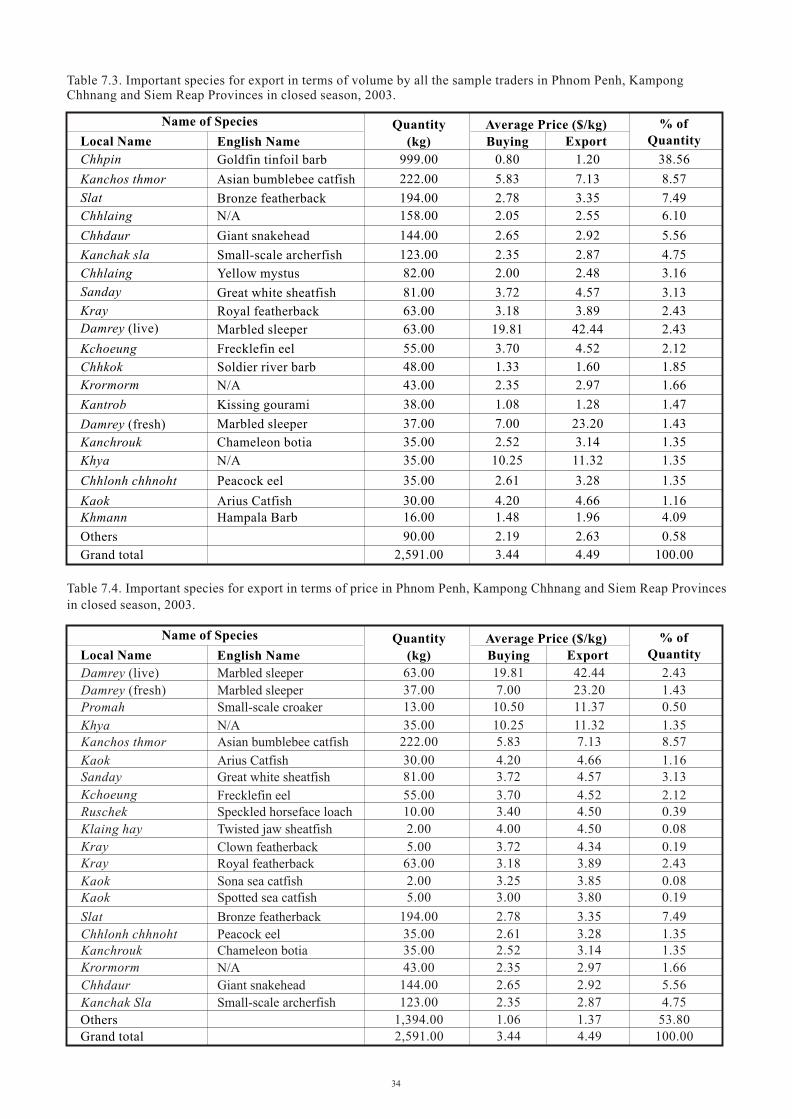
Table 7.3. Important species for export in terms of volume by all the sample traders in Phnom Penh, Kampong Chhnang and Siem Reap Provinces in closed season, 2003.
Table 7.4. Important species for export in terms of price in Phnom Penh, Kampong Chhnang and Siem Reap Provinces in closed season, 2003.
Local Name
Chhpin
Kanchos thmor
Slat
Chhlaing
Chhdaur
Kanchak sla
Chhlaing
Sanday
Kray
Damrey (live)
Kchoeung
Chhkok
Krormorm
Kantrob
Damrey (fresh)
Kanchrouk
Khya
Chhlonh chhnoht
KaokKhmann
Others
Grand total
Name of Species
English Name
Goldfin tinfoil barb
Asian bumblebee catfish
Bronze featherback
N/A
Giant snakehead
Small-scale archerfish
Yellow mystus
Great white sheatfish
Royal featherback
Marbled sleeper
Frecklefin eel
Soldier river barb
N/A
Kissing gourami
Marbled sleeper
Chameleon botia
N/A
Peacock eel
Arius CatfishHampala Barb
Quantity
(kg)
999.00
222.00
194.00
158.00
144.00
123.00
82.00
81.00
63.00
63.00
55.00
48.00
43.00
38.00
37.00
35.00
35.00
35.00
30.0016.00
90.00
2,591.00
Buying
0.80
5.83
2.78
2.05
2.65
2.35
2.00
3.72
3.18
19.81
3.70
1.33
2.35
1.08
7.00
2.52
10.25
2.61
4.201.48
2.19
3.44
Average Price ($/kg)
Export
1.20
7.13
3.35
2.55
2.92
2.87
2.48
4.57
3.89
42.44
4.52
1.60
2.97
1.28
23.20
3.14
11.32
3.28
4.661.96
2.63
4.49
% of Quantity
38.56
8.57
7.49
6.10
5.56
4.75
3.16
3.13
2.43
2.43
2.12
1.85
1.66
1.47
1.43
1.35
1.35
1.35
1.164.09
0.58
100.00
Damrey (live)
Damrey (fresh)
Promah
KhyaKanchos thmor
KaokSanday
Kchoeung
Ruschek
Klaing hay
KrayKray
KaokKaok
Slat
Chhlonh chhnohtKanchrouk
Krormorm
Chhdaur
Kanchak Sla
Marbled sleeper
Marbled sleeper
Small-scale croaker
N/AAsian bumblebee catfish
Arius CatfishGreat white sheatfish
Frecklefin eelSpeckled horseface loach
Twisted jaw sheatfish
Clown featherbackRoyal featherback
Sona sea catfishSpotted sea catfish
Bronze featherback
Peacock eelChameleon botia
N/A
Giant snakehead
Small-scale archerfish
63.00
37.00
13.00
35.00222.00
30.0081.00
55.0010.00
2.00
5.0063.00
2.005.00
194.00
35.0035.00
43.00
144.00
123.00
1,394.00
19.81
7.00
10.50
10.255.83
4.203.72
3.703.40
4.00
3.723.18
3.253.00
2.78
2.612.52
2.35
2.65
2.35
1.06
42.44
23.20
11.37
11.327.13
4.664.57
4.524.50
4.50
4.343.89
3.853.80
3.35
3.283.14
2.97
2.92
2.87
1.37
2.43
1.43
0.50
1.358.57
1.163.13
2.120.39
0.08
0.192.43
0.080.19
7.49
1.351.35
1.66
5.56
4.75
53.80
2,591.00 3.44 4.49 100.00
Local Name
Others
Grand total
Name of Species
English Name
Quantity
(kg) Buying
Average Price ($/kg)
Export
% of Quantity
34
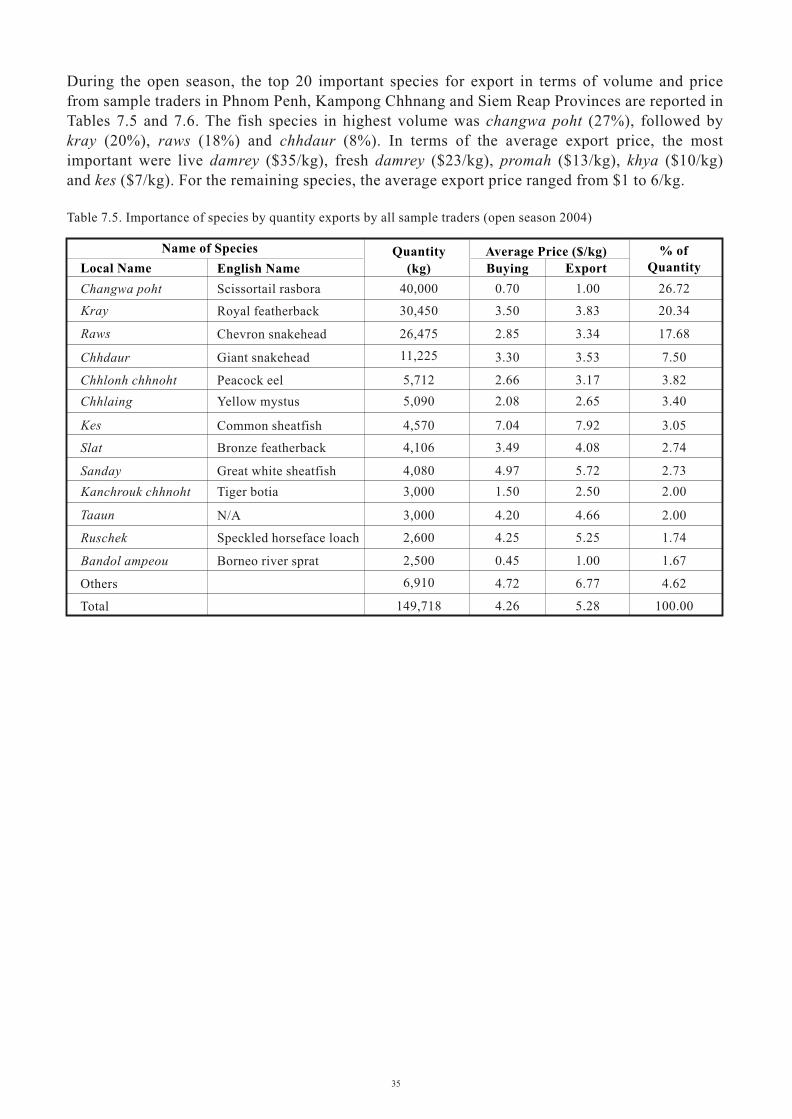
During the open season, the top 20 important species for export in terms of volume and price from sample traders in Phnom Penh, Kampong Chhnang and Siem Reap Provinces are reported in Tables 7.5 and 7.6. The fish species in highest volume was changwa poht (27%), followed by kray (20%), raws (18%) and chhdaur (8%). In terms of the average export price, the most important were live damrey ($35/kg), fresh damrey ($23/kg), promah ($13/kg), khya ($10/kg) and kes ($7/kg). For the remaining species, the average export price ranged from $1 to 6/kg.
Changwa poht
Kray
Raws
Chhdaur
Chhlonh chhnoht
Chhlaing
Kes
Slat
Sanday
Kanchrouk chhnoht
Taaun
Ruschek
Bandol ampeou
Others
Total
Scissortail rasbora
Royal featherback
Chevron snakehead
Giant snakehead
Peacock eel
Yellow mystus
Common sheatfish
Bronze featherback
Great white sheatfish
Tiger botia
N/A
Speckled horseface loach
Borneo river sprat
40,000
30,450
26,475
11,225
5,712
5,090
4,570
4,106
4,080
3,000
3,000
2,600
2,500
6,910
149,718
0.70
3.50
2.85
3.30
2.66
2.08
7.04
3.49
4.97
1.50
4.20
4.25
0.45
4.72
4.26
1.00
3.83
3.34
3.53
3.17
2.65
7.92
4.08
5.72
2.50
4.66
5.25
1.00
6.77
5.28
26.72
20.34
17.68
7.50
3.82
3.40
3.05
2.74
2.73
2.00
2.00
1.74
1.67
4.62
100.00
Local Name
Name of Species
English Name
Quantity
(kg) Buying
Average Price ($/kg)
Export
% of Quantity
35
Table 7.5. Importance of species by quantity exports by all sample traders (open season 2004)
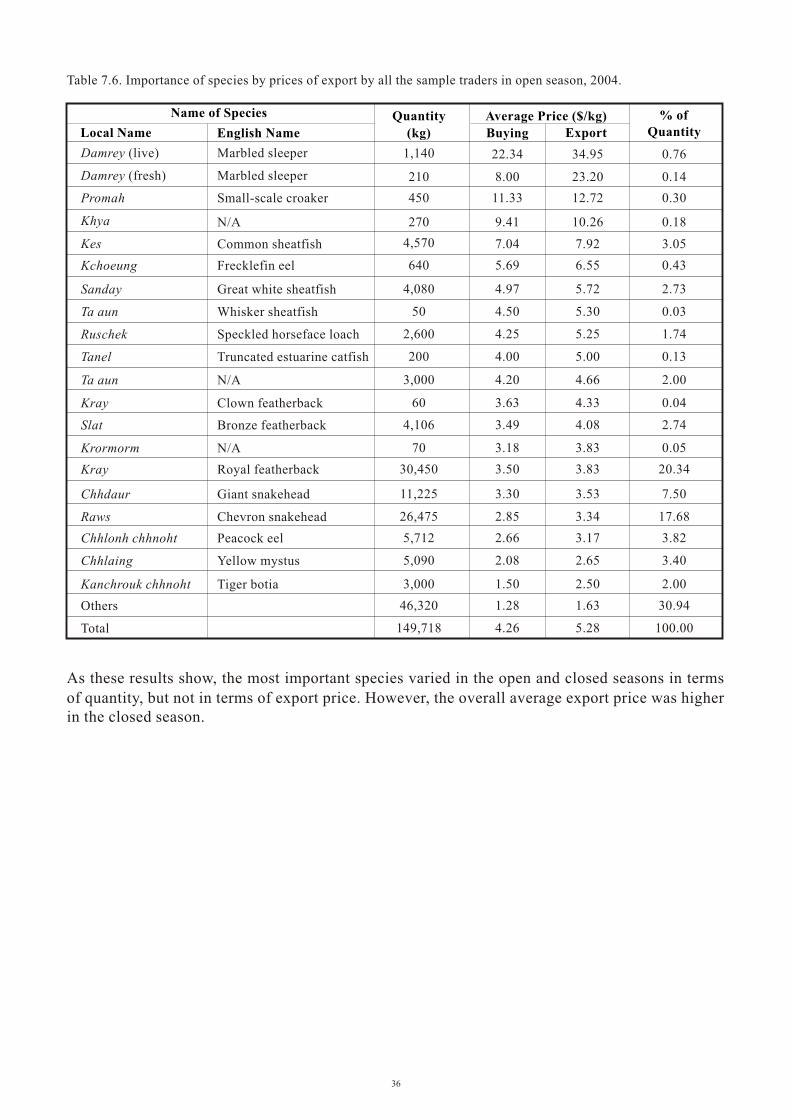
Table 7.6. Importance of species by prices of export by all the sample traders in open season, 2004.
Damrey (live)
Damrey (fresh)
Promah
Khya
Kes
Kchoeung
Sanday
Ta aun
Ruschek
Tanel
Ta aun
Kray
Slat
Krormorm
Kray
Chhdaur
Raws
Chhlonh chhnoht
Chhlaing
Kanchrouk chhnoht
Others
Total
Marbled sleeper
Marbled sleeper
Small-scale croaker
N/A
Common sheatfish
Frecklefin eel
Great white sheatfish
Whisker sheatfish
Speckled horseface loach
Truncated estuarine catfish
N/A
Clown featherback
Bronze featherback
N/A
Royal featherback
Giant snakehead
Chevron snakehead
Peacock eel
Yellow mystus
Tiger botia
1,140
210
450
270
4,570
640
4,080
50
2,600
200
3,000
60
4,106
70
30,450
11,225
26,475
5,712
5,090
3,000
46,320
149,718
22.34
8.00
11.33
9.41
7.04
5.69
4.97
4.50
4.25
4.00
4.20
3.63
3.49
3.18
3.50
3.30
2.85
2.66
2.08
1.50
1.28
4.26
34.95
23.20
12.72
10.26
7.92
6.55
5.72
5.30
5.25
5.00
4.66
4.33
4.08
3.83
3.83
3.53
3.34
3.17
2.65
2.50
1.63
5.28
0.76
0.14
0.30
0.18
3.05
0.43
2.73
0.03
1.74
0.13
2.00
0.04
2.74
0.05
20.34
7.50
17.68
3.82
3.40
2.00
30.94
100.00
As these results show, the most important species varied in the open and closed seasons in terms of quantity, but not in terms of export price. However, the overall average export price was higher
Local Name
Name of Species
English Name
Quantity
(kg) Buying
Average Price ($/kg)
Export
% of Quantity
in the closed season.
36
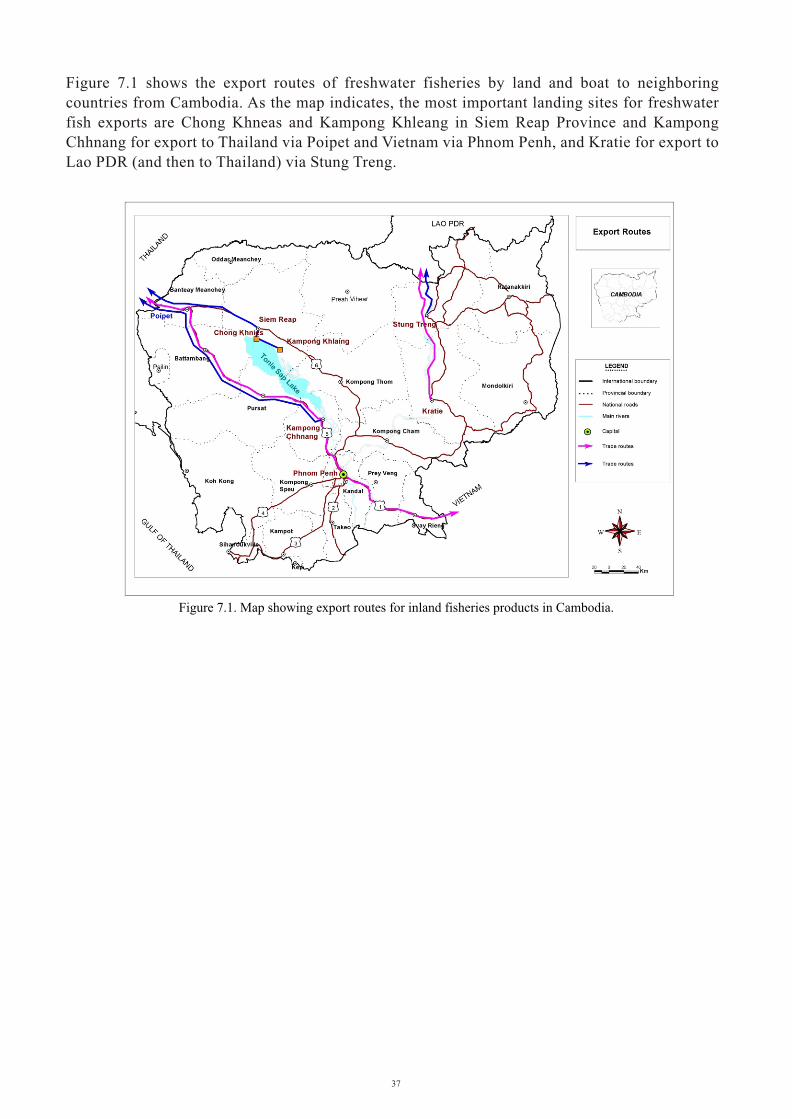
Figure 7.1. Map showing export routes for inland fisheries products in Cambodia.
37
Figure 7.1 shows the export routes of freshwater fisheries by land and boat to neighboring countries from Cambodia. As the map indicates, the most important landing sites for freshwater fish exports are Chong Khneas and Kampong Khleang in Siem Reap Province and Kampong Chhnang for export to Thailand via Poipet and Vietnam via Phnom Penh, and Kratie for export to Lao PDR (and then to Thailand) via Stung Treng.
8. SUMMARY OF RESULTS8. SUMMARY OF RESULTS
8.1. Landing Sites
Phnom Penh landing sites consist of permanent structures on the bank of the Tonle Sap River with concrete floors, covered spaces and storage facilities. One site is specialized for the sale of live fish and has cages in river. The sites are both managed by private leaseholders. Fish are brought to landing sites by powerboat and, occasionally, by truck. There are good road and river links for
The landing sites are used mainly by fish collectors and traders who have collected fish from small and medium-scale fishers, cage farmers and lot owners, from most of the provinces surrounding the lake (Kampong Chhnang, Kampong Thom, Siem Reap, Pursat, Battambang and Kandal). The landing sites are also used by commercial operators to sell surplus catches. Sales are managed by “brokers” who sort and re-package fish (to increase sale price) and sell on commission basis. Fish are sold to market traders, wholesalers and export houses, for export, sale
Kampong Chhnang landing sites consist of a small jetty (10-12 boat spaces) and river beach, but no fixed structure exists. The site is operated by a private leaseholder, who charges fish sellers 50 riels/kg. Fish are transported to and from the landing site by boat. Landed fish are brought by middlepersons, having been collected from fishing grounds, and cage farmers within the province. Sales at the site are facilitated by brokers. Fish are sold to retailers and wholesalers for sale at local and wholesale markets (for snakehead and pangasius), medium-scale fish processing and animal feed processing. Some processing of giant snakeheads (separating fish eggs and heads), which allows for price differentiation and increases the overall sale price, is conducted at
At Chnok Tru, there is no fixed space or beach to form a “landing site”, but boat-to-boat transactions take place in a “wet market” located close to major fishing grounds and fish processing zone. There are poor land transport links and a toll is charged for fresh and processed fish transported on the local road. Fish sold at the site are supplied from fishing grounds and cage farmers within the province. Fish are sold to exporters and processors, and also sent by collectors
Kampong Khlang landing site is the only landing site within 20-30 mile radius, and has no fixed structure. Two floating export houses at the site buy species from fishers and collectors for export to Thailand and Vietnam. The site has very poor land transport links (it can be reached by motorbike during the dry season only, and is flooded during the rainy season), but has good links to other landing sites and wholesale markets via boat across the lake. Fish are supplied from provinces northeast of the lake, brought to the landing site by fishers and collectors. Fish are sold to traders and exporters who transport them to other landing sites and export points by boat.
Phnom Penh Landing Sites
onward transportation and market access.
markets, and processing.
the site by women and children.
and traders to other landing sites and wholesale markets.
Kampong Chhnang Landing Sites (Kampong Chhnang and Chnok Tru)
Siem Reap and Pursat Landing Sites (Kampong Khlang, Chnong Khneas and Kampong Loung)
38
Chong Khneas and Kampong Leung landing sites represent important business centers for the surrounding floating villages on the lake. They have no fixed structures or facilities for fish processing or storage, and most transactions take place in floating boats or shops around the landing sites. Fish are supplied from surrounding fishing grounds and brought to the site by collectors. At Kampong Leung landing site, fish are sold to traders and exporters for northwest domestic markets and export to Thailand. At Chong Khneas landing site, fish are sold to exporters, traders and retailers for export to Thailand and sale in surrounding provinces, and also to crocodile/fish cage farmers and fish processors (particularly low-value white fish for processing to fish and animal feed). The site is also becoming important for tourism, as boat trips
Overall, the most important species in terms of volume are kanchak sla, chdaur and chhkok, which make up 40% of the quantity sold at landing sites. The most valuable species (kbork, kromorn, kanchos thmor and kchoeung), which are destined for export market, make up less than
Fresh and processed fish are sold through separate retail outlets at city (Phnom Penh), provincial and rural markets. Facilities are generally best in city markets, where majority of fresh and processed fish shops are fully or partially covered. Around half of the fish shops in provincial markets are covered, particularly those selling processed fish. In contrast, rural markets are
Fish shops tend to be run by 1-2 people (with fewer people in rural markets), who have typically been in the business for 10-15 years (with longer years of service in city and provincial markets). Overall, fish sellers in city and provincial markets pay higher taxes, fees and transport costs than those operating in rural markets. Additionally, fresh fish sellers pay higher taxes, fees and transport costs than processed fish sellers. City markets sell fish landed in most of the provinces around the lake. In contrast, provincial markets sell fish from one or two surrounding provinces,
The largest quantities of fresh fish are sold per day in provincial markets, followed by city markets. On average, fresh fish are sold for the highest prices at provincial markets, while processed fish cost most in city markets. Overall, the species sold in greatest volume at sample markets are raws (25%) and chdaur (13%), which are sold for $1.11/kg and $1.22/kg, respectively. The most expensive species sold at domestic markets are khya ($5/kg), klainghay
on the lake depart from here.
0.5% of the total quantity landed.
smaller and generally uncovered.
and rural markets are generally sourced from a very local area.
($2.21/kg) and pra ($2/kg).
8.2. Observations of Retail Markets
39

8.4. Fish Processing
Fish processing is conducted at small and middle scales within villages or close to fishing lots and landing sites. The products are for household consumption and sale at local rural/provincial markets. Large-scale fish processing is generally done in factories, and the products are sold in
Most households involved in fish processing also catch fish and conduct processing as an additional occupation. Around half of the sampled operations relied only on household labor while 58% hired laborers for some or all of the year (especially during peak season). The
The most important marketing route is sale to wholesalers within the local province or insurrounding provinces. A minority of processors (10%) sell products directly for export at the
Exports of fish products from Cambodia increased from year to year, from 32,000 t in 1993 to 52,500 t in 2002. However, these figures did not include the additional high numbers of unreported exports at land borders. Fresh and processed fish products were exported to Asia,
The most important species for export vary in open and closed seasons in terms of quantity, but not in terms of export price. In the surveys conducted, the most important species during closed season, were chpin (39%), kanchos thmor (9%), slat (7%) and chhlang (6%). In open season, the most important species were changwa poht (27%), kray (20%), raws (8%) and chdaur (8%). The most important species in terms of price in both seasons were live and fresh chilled damrey ($42/kg and 23/kg, respectively), promah and khya (both $11/kg) and kanchos thmor ($7/kg).
The most important landing sites for freshwater fish exports are Chong Khneas and Kampong Khleang in Siem Reap Province and Kampong Chhnang for export to Thailand via Poipet and Vietnam via Phnom Penh, and Kratie for export to Lao PDR (and then to Thailand) via Stung Treng.
8.5. Fish Export
domestic and international markets.
majority (77%) of operations hired 1-4 laborers.
Thai border.
Australia and the USA.
However, the overall average export price was higher in closed season.
40
8.3. Stakeholders in the Supply Chain
The most important stakeholders in the fisheries supply chain in Cambodia are as follows: · fishers (small/medium-scale) and cage farmers;
· lot owners;
· fish collectors/middlepersons (who supply fish to landing site);
· wholesalers/traders at landing sites;
· semi-wholesalers at city/provincial markets;
· retailers;
· fish processors (small/medium/large-scale);
· exporters; and
· transporters.

9. CONCLUSION AND RECOMMENDATIONS9. CONCLUSION AND RECOMMENDATIONS
s these results indicate, the marketing of fresh and processed fish in Cambodia relies on a complex network of stakeholders and beneficiaries which include middlepersons, traders, wholesalers and transporters as well as fishers, processors, retailers and exporters. Fish marketing, therefore, supports a very wide range of different livelihoods for a great number of rural and urban households, which are consequently very dependent on fisheries resources.
While the domestic market for freshwater fish in Cambodia is relatively well established, despite constraints to distribution and infrastructure, the export market is still developing. Currently, fish exports consist mainly of processed fish products from industrial-scale processing plants and high-value species as fresh fish to neighboring countries such as Vietnam and Thailand. Two low-value fish ($1.1-1.2/kg) species, raws and chdaur, make up 38% of fish sold in domestic markets by volume while high-value fish species such as damrey ($7-19/kg), khya ($10.25/kg) and
A number of opportunities for development of fish marketing and trade already exist. Landing sites are generally at commercially important centers for business exchange and generally have good water transport links. Additionally, sorting and repackaging by brokers and basic processing
The fish export market is relatively small but there seems to be good potential for continued growth, for both fresh and processed forms. However, international food safety and quality standards are becoming increasingly stringent and meeting them will require modernization and
Fish processing and trade are often conducted in addition to fishing and/or farming, and therefore provide an additional source of income for many households. Fish marketing and trade provide one of the few opportunities for women and poor households who live in and near the Tonle Sap Lake areas to increase household income, and their involvement should therefore be encouraged.
The existing infrastructure for marketing and trade of inland fisheries products is still very poorly developed in terms of landing, storage, preserving, transport and retail facilities. This limits market opportunities and also prevents those selling fish to schedule selling decisions to their
A
competitive advantage.
Specifically, constraints to marketing and trade of fish products include the following:
rudimentary or no permanent structure at landing sites;
machines, ice boxes, freezers, salt) at landing sites;
kanchos thmor ($7/kg) are most important for export.
at landing sites give some price differentiation in products.
improvement at all points of the fish marketing chain.
inadequate facilities for hygienically handling, sorting, weighing and packing fish, and lack of storage facilities and preservation equipment or materials (e.g., ice, ice-crushing
minimal quality control measures or hygiene standards and lack of modern equipment or production methods in small and medium-scale fish processing operations; poor land transport links and means of transportation between landing sites and sale and export points, resulting in poorly coordinated distribution of fish products;inadequate market facilities in terms of product conservation and hygiene standards; andpoor access to market information such as prices and supply/demand for fishers.
41

n order to improve, develop and strengthen the fish marketing and trade chain in freshwater fisheries, it is necessary for government and all related agencies and institutions to do the following:
RECOMMENDATIONSRECOMMENDATIONS
IImprove and develop landing sites for inland fisheries, land transport links and means of transportation between landing sites and sale and export points, and market and processing
Strengthen capacity of beneficiaries and all related stakeholders with regard to awareness of market economy function, their role in the economy, market network and information access.Provide reliable and transparent fish market information and prices of fisheries products, which are accessible to all stakeholders (fishers, fish processors, collectors, wholesalers/
Improve processing technology, hygiene, food safety and quality control in order to meet national and international standards, and thereby increase opportunity for domestic and
Provide credit system with low interest rate in the fish marketing and trade chain, which would allow greater uptake of trade and processing activities for income generation,
Improve validity and collection of export and catch statistics for fisheries products.
facilities within fisheries sector.
traders and retailers).
export trade.
particularly for women and poor households.
42
Gregory, R. and H. Guttman. 2002. The ricefield catch and rural food security, p. 1-13. In: P. Edwards, D. C. little and H. Demaine (eds.), Rural Aquaculture. CABI Publishing,
McKenney, B. and P. Tola. 2002. Natural resources and rural livelihoods in Cambodia: a baseline assessment. Work. Pap. 23, 116 p. Cambodia Development Resource Institute,
Netherlands Engineering Consultants (NEDECO). 1998. Natural resources-based development strategy for the Tonle Sap area, Cambodia. Final Rep., Vol. 2, Part B, Sectoral Studies.
Pizzali, A. and F. Medina. 1988. Small-scale fish landing and marketing facilities. FAO Fish.
Tana, T. S. 1993. Fish marketing in Cambodia, Department of Fisheries, Mimeo. Tana, T. S. and E.T. Seang. 2002. The inland and marine fisheries trade of Cambodia. Oxfam
Van Zalinge, N. P., L. Sopha, N. P. Bun, H. Kong, and J. V. Jorgensen. 2002. Status of the Mekong pangasianodon hypophthalmus resources, with special reference to the stocks shared between Cambpdia and Vietnam. MRC Technical Paper No. 1, Mekong River Commission, Phnom Penh. 29 pp.
Wallingford, UK.
Cambodia.
Cambodia National Mekong Committee, Phnom Penh, Cambodia.
Tech. Pap. 291, 68 p.
America, Phnom Penh, Cambodia. 145 pp.
43
10. REFERENCES10. REFERENCES
Ahmed, M., M. A. Rab, M. Dey. 2003. Changing structure of fish supply, demand and trade in developing countries: issues and needs. Proceedings of the Conference of the International Institute of Fisheries Economics and Trade, 19-23 August 2002, Wellington, New Zealand,.Ahmed, M., H. Navy, L. Vuthy and M. Tiongco. 1998. Socioeconomic assessment of freshwater capture fisheries of Cambodia: report on a household survey. Mekong River Commission,
Chea, Y. and B. McKenney. 2003. Great Lake fish exports: an analysis of the fee system. .Degen, P., F. Van Acker, N. van Zallinge, N. Thouk and D. Loeung. 2000. Taken for granted: conflicts over Cambodia's freshwater fish resources. Proceedings of the Eighth Conference of the International Association for the Study of Common Property (IASCP) 31 May-4 June Delgado, C. L. and C. Courbois. 1997. Changing fish trade and demand patterns in developing countries and their significance for policy research. Paper presented for the International Consultation on Fisheries Policy Research in Developing Countries: Issues, Priorities and Department of Fisheries, 2002. Fisheries Statistics 1991-2001, Royal Government of Ferdouse. 2000. The potential Cambodian fishery products in the international market: a market
Gregory, R., H. Guttman and T. Kekputhearith. 1996. Poor in all but fish: a study of the collection of rice field foods from three villages in Svay Theap District, Svay Rieng, AIT Aqua Outreach Working Paper 5, Asian Institute of Technology, Bangkok. 28 pp.
Phnom Penh, Cambodia. 186 p.
Cambodia Dev. Rev. 1 (3) (July-September)
2000, Indiana, USA.
Needs, 2-5 June, North Sea Center, Hirtshals, Denmark.
Cambodia, Phnom Penh.
Study, INFOFISH, Kualampur, Malaysia.

APPENDIX TABLESAPPENDIX TABLESTable 1. Important fish species in terms of quantity landed around Phnom Penh.
Fish Species Quantity (kg) Average Price (US$/kg) % of Important Species
Table 2. Important fish species in terms of price landed in Phnom Penh.
Trey kbork
Trey chhkok
Trey chhlaing
Trey kanchak sla
Trey kanh chorn chey
Trey krum
Trey promah
Trey tilapia chhnoht
Trey ka port
Trey chhdaur
Trey proul
Trey chhlonh chhnoht
Trey kranh srai
Trey chhpin
Trey klaing hay
Trey kaok
Trey chhlaing thmor
Trey chhlaing
Trey kray
Trey kaok
Others
All species
11.00
3,137.00
2.00
1,838.00
109.00
595.30
37.00
33.00
4.00
679.00
135.00
498.00
17.40
84.00
152.00
6.00
703.00
202.00
89.00
82.00
11,417.90
19,831.60
5.80
5.10
4.50
4.33
4.30
3.40
3.35
3.33
3.20
3.18
3.04
2.99
2.92
2.86
2.79
2.70
2.68
2.64
2.63
2.57
1.73
2.46
0.06
15.82
0.01
9.27
0.55
3.00
0.19
0.17
0.02
3.42
0.68
2.51
0.09
0.42
0.77
0.03
3.54
1.02
0.45
0.41
57.57
100.00
Trey chhkok
Trey carp
Trey kanchak sla
Trey kaok
Trey kaok
Trey po
Trey kantrang preng
Trey chhlaing thmor
Trey chhdaur
Trey krum
Trey kaek
Trey kanchos chhnoht
Trey chhlonh chhnoht
Trey pra
Trey krorlang
Trey kanchanh chras thom
Trey chrakaing
Trey chrakaing
Trey chhlaing
Trey sanday
Others
3,137.00
2,029.00
1,838.00
1,736.00
1,434.90
1,107.00
1,066.00
703.00
679.00
595.30
515.00
512.00
498.00
360.00
315.00
277.00
241.00
211.00
202.00
197.00
2,178.40
5.10
0.60
4.33
1.58
2.29
2.36
2.02
2.68
3.18
3.40
1.64
1.20
2.99
2.04
0.70
1.20
1.86
1.84
2.64
2.02
1.91
2.46
15.82
10.23
9.27
8.75
7.24
5.58
5.38
3.54
3.42
3.00
2.60
2.58
2.51
1.82
1.59
1.40
1.22
1.06
1.02
0.99
10.98
100.00All species 19,831.60
Fish Species Quantity (kg) Average Price (US$/kg) % of Important Species
44
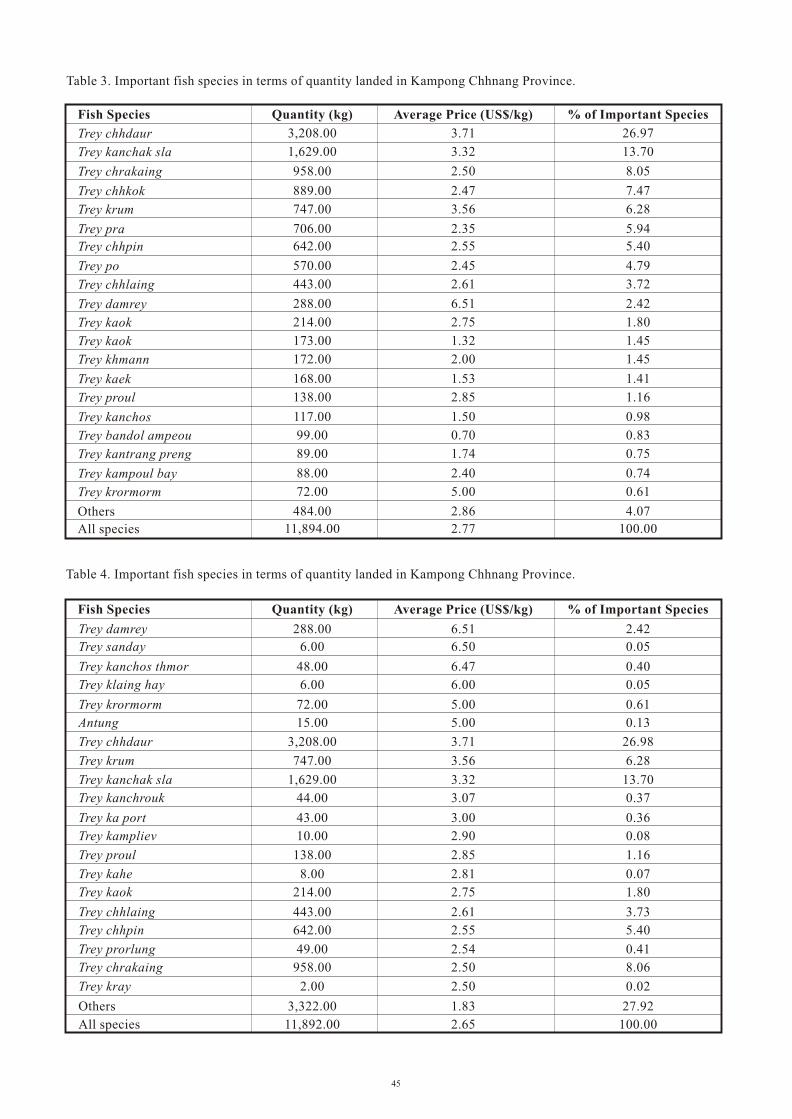
Table 3. Important fish species in terms of quantity landed in Kampong Chhnang Province.
Trey chhdaur
Trey kanchak sla
Trey chrakaing
Trey chhkok
Trey krum
Trey pra
Trey chhpin
Trey po
Trey chhlaing
Trey damrey
Trey kaok
Trey kaok
Trey khmann
Trey kaek
Trey proul
Trey kanchos
Trey bandol ampeou
Trey kantrang preng
Trey kampoul bay
Trey krormorm
Others
All species
3,208.00
1,629.00
958.00
889.00
747.00
706.00
642.00
570.00
443.00
288.00
214.00
173.00
172.00
168.00
138.00
117.00
99.00
89.00
88.00
72.00
484.00
11,894.00
3.71
3.32
2.50
2.47
3.56
2.35
2.55
2.45
2.61
6.51
2.75
1.32
2.00
1.53
2.85
1.50
0.70
1.74
2.40
5.00
2.86
2.77
26.97
13.70
8.05
7.47
6.28
5.94
5.40
4.79
3.72
2.42
1.80
1.45
1.45
1.41
1.16
0.98
0.83
0.75
0.74
0.61
4.07
100.00
Fish Species Quantity (kg) Average Price (US$/kg) % of Important Species
Table 4. Important fish species in terms of quantity landed in Kampong Chhnang Province.
Trey damrey
Trey sanday
Trey kanchos thmor
Trey klaing hay
Trey krormorm
Antung
Trey chhdaur
Trey krum
Trey kanchak sla
Trey kanchrouk
Trey ka port
Trey kampliev
Trey proul
Trey kahe
Trey kaok
Trey chhlaing
Trey chhpin
Trey prorlung
Trey chrakaing
Trey kray
Others
All species
288.00
6.00
48.00
6.00
72.00
15.00
3,208.00
747.00
1,629.00
44.00
43.00
10.00
138.00
8.00
214.00
443.00
642.00
49.00
958.00
2.00
3,322.00
11,892.00
6.51
6.50
6.47
6.00
5.00
5.00
3.71
3.56
3.32
3.07
3.00
2.90
2.85
2.81
2.75
2.61
2.55
2.54
2.50
2.50
1.83
2.65
2.42
0.05
0.40
0.05
0.61
0.13
26.98
6.28
13.70
0.37
0.36
0.08
1.16
0.07
1.80
3.73
5.40
0.41
8.06
0.02
27.92
100.00
Fish Species Quantity (kg) Average Price (US$/kg) % of Important Species
45
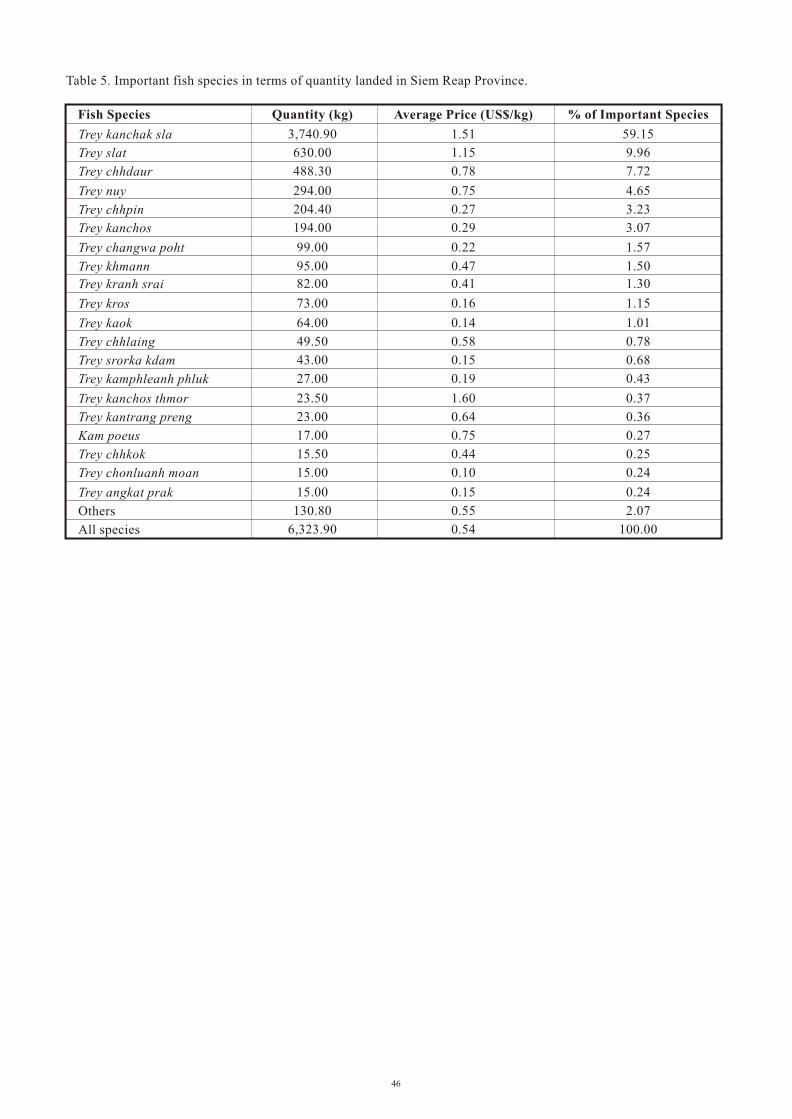
Table 5. Important fish species in terms of quantity landed in Siem Reap Province.
Trey kanchak sla
Trey slat
Trey chhdaur
Trey nuy
Trey chhpin
Trey kanchos
Trey changwa poht
Trey khmann
Trey kranh srai
Trey kros
Trey kaok
Trey chhlaing
Trey srorka kdam
Trey kamphleanh phluk
Trey kanchos thmor
Trey kantrang preng
Kam poeus
Trey chhkok
Trey chonluanh moan
Trey angkat prak
Others
All species
3,740.90
630.00
488.30
294.00
204.40
194.00
99.00
95.00
82.00
73.00
64.00
49.50
43.00
27.00
23.50
23.00
17.00
15.50
15.00
15.00
130.80
6,323.90
1.51
1.15
0.78
0.75
0.27
0.29
0.22
0.47
0.41
0.16
0.14
0.58
0.15
0.19
1.60
0.64
0.75
0.44
0.10
0.15
0.55
0.54
59.15
9.96
7.72
4.65
3.23
3.07
1.57
1.50
1.30
1.15
1.01
0.78
0.68
0.43
0.37
0.36
0.27
0.25
0.24
0.24
2.07
100.00
Fish Species Quantity (kg) Average Price (US$/kg) % of Important Species
46
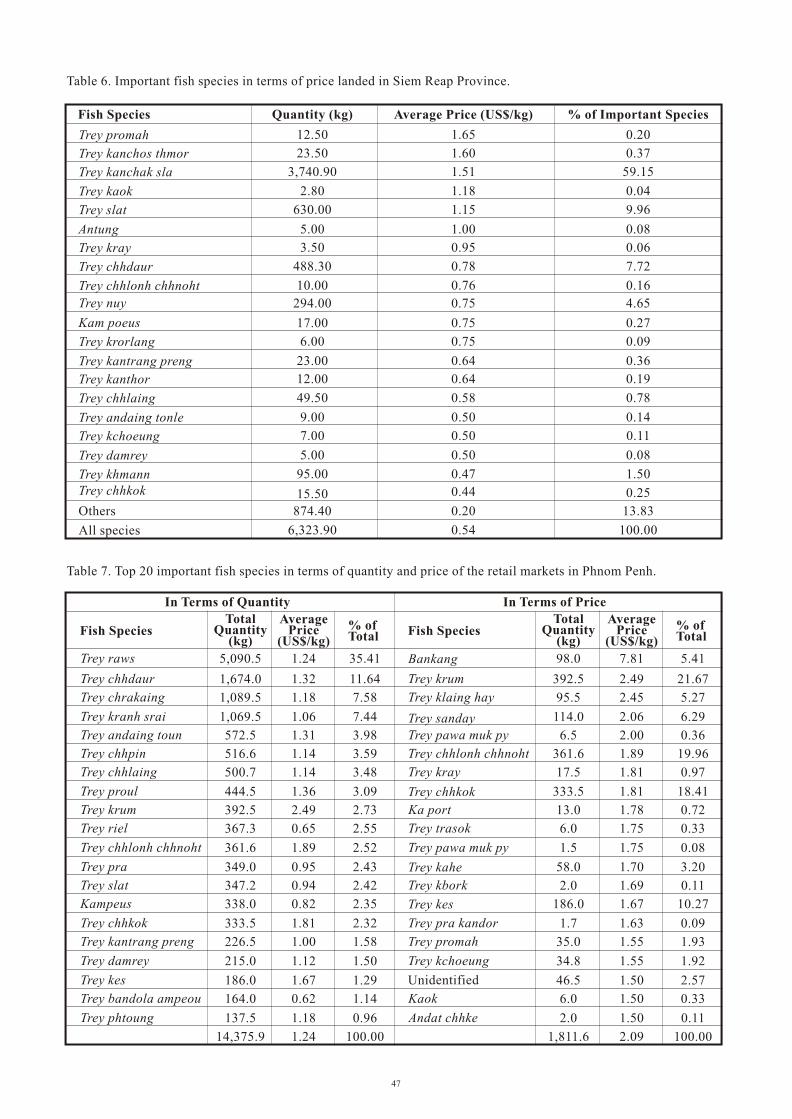
Table 6. Important fish species in terms of price landed in Siem Reap Province.
Trey promah
Trey kanchos thmor
Trey kanchak sla
Trey kaok
Trey slat
Antung
Trey kray
Trey chhdaur
Trey chhlonh chhnoht
Trey nuy
Kam poeus
Trey krorlang
Trey kantrang preng
Trey kanthor
Trey chhlaing
Trey andaing tonle
Trey kchoeung
Trey damrey
Trey khmannTrey chhkok
Others
All species
12.50
23.50
3,740.90
2.80
630.00
5.00
3.50
488.30
10.00
294.00
17.00
6.00
23.00
12.00
49.50
9.00
7.00
5.00
95.00
15.50
874.40
6,323.90
1.65
1.60
1.51
1.18
1.15
1.00
0.95
0.78
0.76
0.75
0.75
0.75
0.64
0.64
0.58
0.50
0.50
0.50
0.47
0.44
0.20
0.54
0.20
0.37
59.15
0.04
9.96
0.08
0.06
7.72
0.16
4.65
0.27
0.09
0.36
0.19
0.78
0.14
0.11
0.08
1.50
0.25
13.83
100.00
Fish Species Quantity (kg) Average Price (US$/kg) % of Important Species
Table 7. Top 20 important fish species in terms of quantity and price of the retail markets in Phnom Penh.
In Terms of Quantity In Terms of Price
Trey raws
Trey chhdaur
Trey chrakaing
Trey kranh srai
Trey andaing toun
Trey chhpin
Trey chhlaing
Trey proul
Trey krum
Trey riel
Trey chhlonh chhnoht
Trey pra
Trey slat
Kampeus
Trey chhkok
Trey kantrang preng
Trey damrey
Trey kes
Trey bandola ampeou
Trey phtoung
5,090.5
1,674.0
1,089.5
1,069.5
572.5
516.6
500.7
444.5
392.5
367.3
361.6
349.0
347.2
338.0
333.5
226.5
215.0
186.0
164.0
137.5
14,375.9
1.24
1.32
1.18
1.06
1.31
1.14
1.14
1.36
2.49
0.65
1.89
0.95
0.94
0.82
1.81
1.00
1.12
1.67
0.62
1.18
1.24
35.41
11.64
7.58
7.44
3.98
3.59
3.48
3.09
2.73
2.55
2.52
2.43
2.42
2.35
2.32
1.58
1.50
1.29
1.14
0.96
100.00
TotalQuantity
(kg)
TotalQuantity
(kg)Fish Species Fish Species
AveragePrice
(US$/kg)
AveragePrice
(US$/kg)% of Total
% of Total
Bankang
Trey krum
Trey klaing hay
Trey sanday
Trey pawa muk py
Trey chhlonh chhnoht
Trey kray
Trey chhkok
Ka port
Trey trasok
Trey pawa muk py
Trey kahe
Trey kbork
Trey kes
Trey pra kandor
Trey promah
Trey kchoeung
Unidentified
Kaok
Andat chhke
98.0
392.5
95.5
114.0
6.5
361.6
17.5
333.5
13.0
6.0
1.5
58.0
2.0
186.0
1.7
35.0
34.8
46.5
6.0
2.0
1,811.6
7.81
2.49
2.45
2.06
2.00
1.89
1.81
1.81
1.78
1.75
1.75
1.70
1.69
1.67
1.63
1.55
1.55
1.50
1.50
1.50
2.09
5.41
21.67
5.27
6.29
0.36
19.96
0.97
18.41
0.72
0.33
0.08
3.20
0.11
10.27
0.09
1.93
1.92
2.57
0.33
0.11
100.00
47

Table 8. Top 20 important fish species in terms of quantity and price of the retail markets in Kampong Chhnang Province.
In Terms of Quantity In Terms of Price
TotalQuantity
(kg)
TotalQuantity
(kg)Fish Species Fish Species
AveragePrice
(US$/kg)
AveragePrice
(US$/kg)% of Total
% of Total
Trey chhdaur
Trey chhkok
Trey po
Trey chhpin
Trey pra
Trey raws
Leas
Krum
Trey chhlaing
Trey kanchos kdaung
Trey khmann
Trey bandol ampeou
Trey chrakaing
Trey kantrang preng
Kampot
Trey riel
Trey phtoung
Trey damrey
Trey kanchos
Trey kaek
Total
840.0
440.0
399.0
395.0
373.0
305.0
295.0
269.0
148.0
140.0
133.0
122.0
104.0
99.0
94.0
91.0
47.0
46.0
45.0
41.0
4,426.0
1.2
0.8
0.7
0.8
0.7
0.9
0.1
0.9
0.7
0.6
0.6
0.2
0.6
0.6
0.5
0.4
0.5
0.8
0.5
0.6
0.7
18.98
9.94
9.01
8.92
8.43
6.89
6.67
6.08
3.34
3.16
3.00
2.76
2.35
2.24
2.12
2.06
1.06
1.04
1.02
0.93
100.00
Antung
Trey chhdaur
Trey krum
Trey raws
Trey sanday
Trey carp kbal thom
Trey krormorm
Trey kchoeung
Trey tanel
Trey chhkok
Trey chhpin
Ka port
Trey damrey
Trey promah
Trey carp prak
Trey andaing toun
Trey dangkteng
Trey carp chi smao
Trey ke, Pra ke
Trey klaing hay
Total
1.0
840.0
269.0
305.0
11.0
4.0
3.0
3.0
1.0
440.0
395.0
23.0
46.0
13.0
8.0
5.0
3.0
2.0
1.0
1.0
2,374.0
1.8
1.2
0.9
0.9
0.9
0.9
0.9
0.9
0.9
0.8
0.8
0.8
0.8
0.8
0.8
0.8
0.8
0.8
0.8
0.8
0.9
0.04
35.38
11.33
12.85
0.46
0.17
0.13
0.13
0.04
18.53
16.64
0.97
1.94
0.55
0.34
0.21
0.13
0.08
0.04
0.04
100.00
48

Table 9. Top 20 important fish species in terms of quantity and price of the retail markets in Siem Reap Province.
In Terms of Quantity In Terms of Price
TotalQuantity
(kg)
TotalQuantity
(kg)Fish Species Fish Species
AveragePrice
(US$/kg)
AveragePrice
(US$/kg)% of Total
% of Total
Trey raws
Trey chhdaur
Trey chhpin
Trey kantrang preng
Trey kanchos chhnoht
Trey kranh srai
Trey kamphleanh phluk
Kampeus
Trey andaing roueng
Trey andaing toun
Trey khnang veng
Trey riel
Trey kanchos kdaung
Trey kros
Trey chhkok
Trey linh
Trey kanchrouk
Trey kaok
Trey pra
Kampot
Total
1,173.5
1,014.2
265.0
265.0
216.5
210.0
158.5
140.0
130.0
123.5
117.0
92.0
89.0
76.0
74.0
74.0
71.0
70.0
68.0
68.0
4,495.2
0.9
0.9
0.7
0.6
0.3
0.4
0.2
0.6
1.0
0.8
0.3
0.3
0.6
0.6
0.7
0.3
0.6
0.1
0.6
1.0
0.6
26.1
22.6
5.9
5.9
4.8
4.7
3.5
3.1
2.9
2.7
2.6
2.0
2.0
1.7
1.6
1.6
1.6
1.6
1.5
1.5
100.0
Trey kray
Trey ta aun
Kampot
Trey andaing roueng
Trey carp samahn
Trey tanel
Trey bandol ampeou
Trey chhdaur
Trey raws
Trey andaing toun
Trey antung
Trey damrey
Trey chhlonh chhnoht
Trey chhkok
Trey chhpin
Trey pra
Trey kanchos kdaung
Trey kros
Trey kchoeung
Trey kantrang preng
Total
9.0
65.5
68.0
130.0
15.0
5.0
13.0
1,014.2
1,173.5
123.5
7.0
32.9
14.0
74.0
265.0
68.0
89.0
76.0
2.0
265.0
3,509.6
1.5
1.2
1.0
1.0
1.0
1.0
0.9
0.9
0.9
0.8
0.8
0.8
0.7
0.7
0.7
0.6
0.6
0.6
0.6
0.6
0.8
0.3
1.9
1.9
3.7
0.4
0.1
0.4
28.9
33.4
3.5
0.2
0.9
0.4
2.1
7.6
1.9
2.5
2.2
0.1
7.6
100.0
Table 10. Top 20 important fish species in terms of quantity and price of the retail markets in Kandal Province.
In Terms of Quantity In Terms of Price
TotalQuantity
(kg)
TotalQuantity
(kg)Fish Species Fish Species
AveragePrice
(US$/kg)
AveragePrice
(US$/kg)% of Total
% of Total
Trey raws
Trey riel
Trey chhdaur
Trey chhlaing
Trey kantrob
Trey chhpin
Trey andaing toun
Trey po
Trey promah
Trey krum
Trey proul
Trey chhlonh chhnoht
Trey chhkok
Trey chrakaing
Trey khnang veng
Trey kantrang preng
Trey slat
Trey kanchos
Trey tilapia chhnoht
Trey kros
Total
1,164.0
564.0
546.0
285.0
115.0
104.5
80.5
75.0
62.5
58.7
58.0
46.3
42.0
42.0
39.0
34.0
31.0
31.0
30.0
27.0
3,435.5
1.1
0.3
1.2
0.9
0.5
1.1
1.1
1.2
0.8
1.3
1.2
0.8
1.8
1.0
0.4
0.9
1.2
0.6
1.0
0.4
0.9
33.9
16.4
15.9
8.3
3.3
3.0
2.3
2.2
1.8
1.7
1.7
1.3
1.2
1.2
1.1
1.0
0.9
0.9
0.9
0.8
100.0
Trey khya
Trey sanday
Trey chhkok
Trey kes
Trey kchoeung
Trey damrey
Antung
Trey krormorm
Trey krum
Ka port
Trey chhdaur
Trey proul
Trey po
Trey slat
Trey raws
Trey andaing toun
Trey chhpin
Trey tilapia chhnoht
Trey chrakaing
Trey phtoung
Total
1.5
3.0
42.0
12.0
1.0
11.5
6.5
7.0
58.7
2.0
546.0
58.0
75.0
31.0
1,164.0
80.5
104.5
30.0
42.0
4.5
2,280.7
2.5
2.0
1.8
1.8
1.8
1.7
1.6
1.5
1.3
1.3
1.2
1.2
1.2
1.2
1.1
1.1
1.1
1.0
1.0
1.0
1.4
0.1
0.1
1.8
0.5
0.0
0.5
0.3
0.3
2.6
0.1
23.9
2.5
3.3
1.4
51.0
3.5
4.6
1.3
1.8
0.2
100.0
49
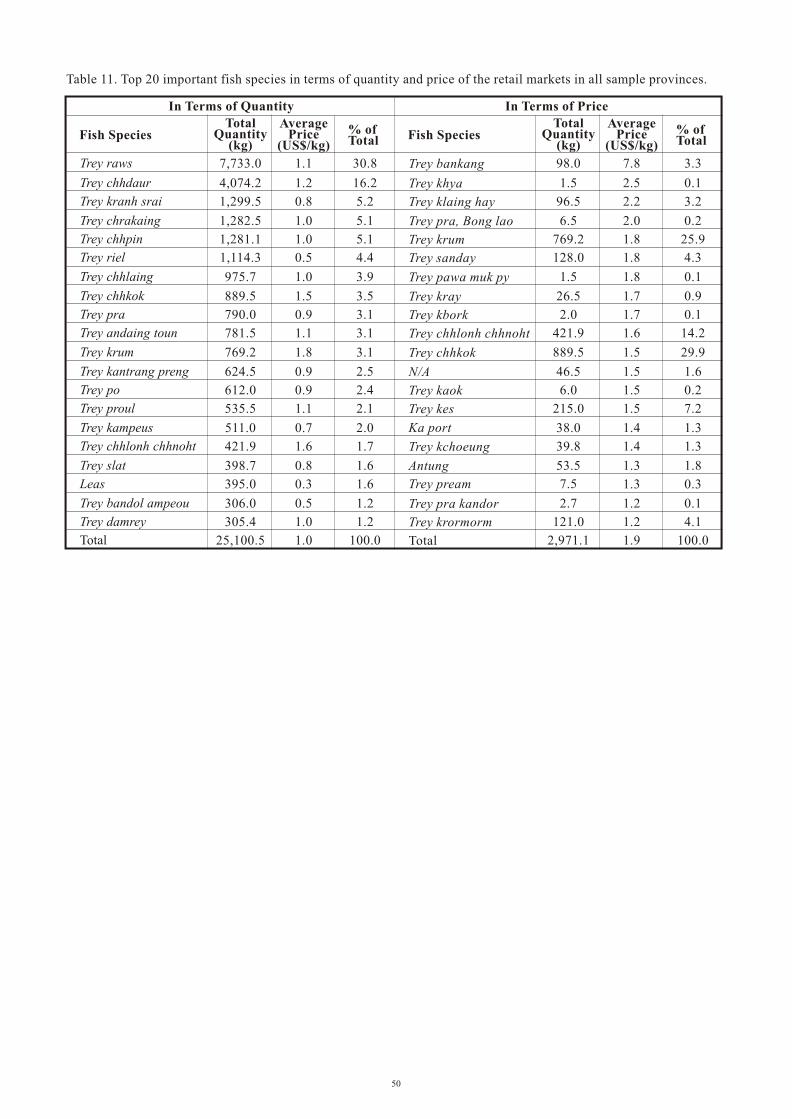
Table 11. Top 20 important fish species in terms of quantity and price of the retail markets in all sample provinces.
In Terms of Quantity In Terms of Price
TotalQuantity
(kg)
TotalQuantity
(kg)Fish Species Fish Species
AveragePrice
(US$/kg)
AveragePrice
(US$/kg)% of Total
% of Total
Trey raws
Trey chhdaur
Trey kranh srai
Trey chrakaing
Trey chhpin
Trey riel
Trey chhlaing
Trey chhkok
Trey pra
Trey andaing toun
Trey krum
Trey kantrang preng
Trey po
Trey proul
Trey kampeus
Trey chhlonh chhnoht
Trey slat
Leas
Trey bandol ampeou
Trey damrey
Total
7,733.0
4,074.2
1,299.5
1,282.5
1,281.1
1,114.3
975.7
889.5
790.0
781.5
769.2
624.5
612.0
535.5
511.0
421.9
398.7
395.0
306.0
305.4
25,100.5
1.1
1.2
0.8
1.0
1.0
0.5
1.0
1.5
0.9
1.1
1.8
0.9
0.9
1.1
0.7
1.6
0.8
0.3
0.5
1.0
1.0
30.8
16.2
5.2
5.1
5.1
4.4
3.9
3.5
3.1
3.1
3.1
2.5
2.4
2.1
2.0
1.7
1.6
1.6
1.2
1.2
100.0
Trey bankang
Trey khya
Trey klaing hay
Trey pra, Bong lao
Trey krum
Trey sanday
Trey pawa muk py
Trey kray
Trey kbork
Trey chhlonh chhnoht
Trey chhkok
N/A
Trey kaok
Trey kes
Ka port
Trey kchoeung
Antung
Trey pream
Trey pra kandor
Trey krormorm
Total
98.0
1.5
96.5
6.5
769.2
128.0
1.5
26.5
2.0
421.9
889.5
46.5
6.0
215.0
38.0
39.8
53.5
7.5
2.7
121.0
2,971.1
7.8
2.5
2.2
2.0
1.8
1.8
1.8
1.7
1.7
1.6
1.5
1.5
1.5
1.5
1.4
1.4
1.3
1.3
1.2
1.2
1.9
3.3
0.1
3.2
0.2
25.9
4.3
0.1
0.9
0.1
14.2
29.9
1.6
0.2
7.2
1.3
1.3
1.8
0.3
0.1
4.1
100.0
50