market watch toronto 2015 january
TRANSCRIPT

Strong Start to 2015 TORONTO, February 4, 2015 – Toronto Real Estate Board President Paul Etherington announced a strong start to 2015, with robust year-over-year sales and average price growth in January. Greater Toronto Area REALTORS® reported 4,355 home sales through the TorontoMLS system during the first month of the year. This result represented a 6.1 per cent increase over January 2014. During the same period, new listings were up by 9.5 per cent.
"The January results represented good news on multiple fronts. First, strong sales growth suggests home buyers continue to see housing as a quality long-term investment, despite the recent period of economic uncertainty. Second, the fact that new listings grew at a faster pace than sales suggests that it has become easier for some people to find a home that meets their needs," said Mr. Etherington.
The average selling price for January 2015 home sales was up by 4.9 per cent year-over-year to $552,575. The MLS® Home Price Index (HPI) Composite benchmark was up by 7.5 percent compared to January 2014.
"Home price growth is forecast to continue in 2015. Lower borrowing costs will largely mitigate price growth this year, which means affordability will remain in check. The strongest rates of price growth will be experienced for low-rise home types, including singles, semis and town houses. However, robust end-user demand for condo apartments will result in above-inflation price growth in the high-rise segment as well," said Jason Mercer, TREB's Director of Market Analysis.
4,355 4,103
January 2015 January 2014
$5
52
,575
$526,965
January 2015 January 2014
For All TREB Member Inquiries: (416) 443-8152
For All Media/Public Inquiries:
(416) 443-8158 January 2015
Real GDP Growthi
Q3 2014 t 2.8%
Toronto Employment Growthi i
December 2014 u -0.2%
Toronto Unemployment Rate
December 2014 q 7.8%
Inflation (Yr./Yr. CPI Growth)i i
December 2014 u 1.5%
Bank of Canada Overnight Rateiii
January 2015 u 0.75%
Prime Ratei v
January 2015 u 2.85%
Mortgage Rates (Jan. 2015)i v
Chartered Bank Fixed Rates
1 Year q 3.14%
3 Year q 3.44%
5 Year q 4.79%
Sources and Notes:
Economic Indicators
iStatistics Canada, Quarter-over-quarter
growth, annualized
iiStatistics Canada, Year-over-year growth
for the most recently reported month
iiiBank of Canada, Rate from most recent
Bank of Canada announcement
ivBank of Canada, Rates for most recently
completed month
Sales & Average Price By Major Home Type1,7
416 905 Total 416 905 Total
Detached 451 1,545 1,996 $948,713 $648,233 $716,127
Yr./Yr. % Change -2.0% 10.0% 7.1% 7.0% 4.2% 4.2%
Semi-Detached 128 290 418 $667,452 $455,653 $520,510
Yr./Yr. % Change -3.8% 2.8% 0.7% 7.2% 9.4% 7.8%
Townhouse 155 518 673 $502,267 $421,443 $440,058
Yr./Yr. % Change -9.9% 4.2% 0.6% 14.5% 6.2% 8.0%
Condo Apartment 809 392 1,201 $382,458 $310,045 $358,823
Yr./Yr. % Change 6.2% 23.3% 11.2% 4.5% 3.6% 3.6%
January 2015Sales Average Price
2015 2014 % Chg.
Sales 4,355 4,103 6.1%
New Listings 9,596 8,762 9.5%
Active Listings 11,600 11,903 -2.5%
Average Price $552,575 $526,965 4.9%
Average DOM 31 36 -13.9%
Year-Over-Year Summary1,7
TorontoMLS Sales Activity1,7
TorontoMLS Average Price1,7

Price Range Detached Semi-Detached Att/Row/Twnhouse Condo Townhouse Condo Apt Link Co-op Apt Det Condo Co-ownership Apt Total
$0 to $99,999 1 0 0 1 8 0 1 0 1 12
$100,000 to $199,999 18 2 1 21 111 0 0 0 1 154
$200,000 to $299,999 80 16 18 73 401 4 1 0 3 596
$300,000 to $399,999 184 77 74 119 386 15 0 1 2 858
$400,000 to $499,999 320 132 116 75 138 6 0 1 0 788
$500,000 to $599,999 324 92 63 17 76 11 2 0 0 585
$600,000 to $699,999 322 49 38 7 32 9 0 1 0 458
$700,000 to $799,999 208 18 22 6 17 4 0 0 0 275
$800,000 to $899,999 154 17 6 4 7 2 1 0 0 191
$900,000 to $999,999 105 7 4 1 8 0 0 0 0 125
$1,000,000 to $1,249,999 112 4 5 1 5 0 0 0 0 127
$1,250,000 to $1,499,999 65 4 0 0 4 0 0 1 0 74
$1,500,000 to $1,749,999 34 0 0 0 5 0 0 0 0 39
$1,750,000 to $1,999,999 29 0 0 0 0 0 0 0 0 29
$2,000,000 + 40 0 1 0 3 0 0 0 0 44
Total Sales 1,996 418 348 325 1,201 51 5 4 7 4,355
Share of Total Sales 45.8% 9.6% 8.0% 7.5% 27.6% 1.2% 0.1% 0.1% 0.2% -
Average Price $716,127 $520,510 $502,473 $373,226 $358,823 $502,681 $450,100 $704,375 $241,500 $552,575
SALES BY PRICE RANGE AND HOUSE TYPE1,7 JANUARY 2015
SALES BY PRICE RANGE AND HOUSE TYPE1,7 YEAR-TO-DATE, 2015
Market Watch, January 2015 2
Toronto Real Estate Board

ALL HOME TYPES, JANUARY 2015ALL TREB AREAS
Number of Sales Dollar Volume1 Average Price1 Median Price1 New Listings2 SNLR (Trend)8 Active Listings3Mos. Inv. (Trend)9 Avg. SP/LP4 Avg. DOM5
TREB Total 4,355 $2,406,464,145 $552,575 $465,000 9,596 59.4% 11,600 2.2 99% 31
Halton Region 371 $228,890,686 $616,956 $535,000 811 63.9% 995 2.1 98% 32
Burlington 100 $51,443,528 $514,435 $490,000 158 67.1% 213 2.3 98% 34
Halton Hills 32 $16,251,999 $507,875 $450,850 100 64.6% 151 2.2 98% 32
Milton 92 $42,970,749 $467,073 $461,900 196 66.4% 189 1.5 99% 20
Oakville 147 $118,224,410 $804,248 $694,900 357 60.5% 442 2.4 97% 37
Peel Region 970 $467,470,361 $481,928 $444,000 1,937 59.0% 2,123 2.1 98% 29
Brampton 428 $195,149,672 $455,957 $430,000 783 61.0% 746 1.8 98% 26
Caledon 42 $23,819,270 $567,125 $556,500 97 57.5% 157 3.3 96% 38
Mississauga 500 $248,501,419 $497,003 $449,000 1,057 57.5% 1,220 2.2 98% 32
City of Toronto 1,561 $907,685,684 $581,477 $460,000 3,912 56.1% 5,056 2.4 100% 32
York Region 789 $532,155,632 $674,468 $618,000 1,749 59.1% 2,077 2.2 99% 32
Aurora 47 $32,110,000 $683,191 $588,000 102 64.5% 115 2.0 98% 29
E. Gwillimbury 18 $8,369,500 $464,972 $429,000 33 65.8% 51 2.5 98% 31
Georgina 34 $11,916,650 $350,490 $304,500 80 66.3% 104 2.3 98% 26
King 19 $15,866,500 $835,079 $720,000 54 42.1% 130 6.1 94% 77
Markham 189 $134,393,767 $711,078 $650,000 428 61.0% 493 1.8 100% 27
Newmarket 74 $40,970,945 $553,661 $527,000 112 71.9% 89 1.3 99% 31
Richmond Hill 173 $123,596,374 $714,430 $640,000 383 55.3% 433 2.2 99% 30
Vaughan 192 $135,335,448 $704,872 $641,500 466 54.8% 542 2.4 99% 34
Whitchurch-Stouffville 43 $29,596,448 $688,289 $600,000 91 63.5% 120 2.5 96% 45
Durham Region 512 $209,198,450 $408,591 $381,000 884 70.0% 857 1.5 99% 26
Ajax 79 $34,982,686 $442,819 $425,000 138 74.6% 104 1.0 99% 20
Brock 11 $3,143,400 $285,764 $312,500 28 57.3% 59 4.8 98% 52
Clarington 85 $31,314,988 $368,412 $341,000 159 68.0% 160 1.6 99% 28
Oshawa 143 $47,617,079 $332,987 $333,500 208 70.6% 161 1.3 99% 23
Pickering 61 $30,875,777 $506,160 $450,000 109 70.0% 112 1.4 99% 30
Scugog 15 $8,943,020 $596,201 $430,000 39 57.8% 67 3.5 95% 54
Uxbridge 14 $6,475,800 $462,557 $431,650 38 62.3% 63 3.7 97% 61
Whitby 104 $45,845,700 $440,824 $428,000 165 72.5% 131 1.2 100% 20
Dufferin County 38 $14,310,899 $376,603 $346,500 70 64.9% 93 2.9 98% 49
Orangeville 38 $14,310,899 $376,603 $346,500 70 64.9% 93 2.9 98% 49
Simcoe County 114 $46,752,433 $410,109 $391,000 233 60.6% 399 3.3 98% 42
Adjala-Tosorontio 12 $4,983,500 $415,292 $412,500 26 52.0% 52 5.4 97% 58
Bradford West Gwillimbury 33 $15,997,690 $484,778 $441,000 74 59.3% 93 2.6 99% 31
Essa 9 $3,797,900 $421,989 $294,900 16 68.0% 37 3.0 97% 61
Innisfil 29 $9,581,000 $330,379 $320,000 71 54.5% 136 3.9 97% 46
New Tecumseth 31 $12,392,343 $399,753 $362,000 46 69.1% 81 3.0 98% 38
SUMMARY OF EXISTING HOME TRANSACTIONS
! TURN PAGE FOR CITY OF TORONTO
TABLES OR CLICK HERE:
Market Watch, January 2015 3
Toronto Real Estate Board

Market Watch, January 2015July 2010 Page 3
4
Toronto Real Estate Board
ALL HOME TYPES, JANUARY 2015CITY OF TORONTO MUNICIPAL BREAKDOWN
Number of Sales Dollar Volume1
Average Price1
Median Price1
New Listings2
SNLR (Trend)8
Active Listings3
Mos. Inv. (Trend)9 Avg. SP/LP4
Avg. DOM5
TREB Total 4,355 $2,406,464,145 $552,575 $465,000 9,596 59.4% 11,600 2.2 99% 31
City of Toronto Total 1,561 $907,685,684 $581,477 $460,000 3,912 56.1% 5,056 2.4 100% 32
Toronto West 384 $181,331,224 $472,217 $435,000 906 57.1% 1,230 2.4 99% 38
Toronto W01 21 $9,700,800 $461,943 $340,000 58 51.7% 82 2.7 100% 41
Toronto W02 26 $16,877,231 $649,124 $632,250 58 69.5% 73 1.3 100% 29
Toronto W03 35 $16,078,800 $459,394 $462,500 56 59.9% 59 1.7 101% 32
Toronto W04 32 $15,043,889 $470,122 $500,750 73 61.7% 93 2.1 99% 26
Toronto W05 56 $18,878,650 $337,119 $326,500 108 60.9% 139 2.4 98% 40
Toronto W06 65 $32,034,538 $492,839 $450,000 189 45.2% 295 3.7 100% 43
Toronto W07 8 $5,712,500 $714,063 $701,250 25 69.8% 29 1.3 101% 40
Toronto W08 74 $41,564,421 $561,681 $391,000 217 54.8% 282 2.7 99% 39
Toronto W09 20 $9,971,500 $498,575 $562,500 43 62.2% 55 2.1 101% 25
Toronto W10 47 $15,468,895 $329,125 $276,000 79 59.2% 123 2.4 96% 45
Toronto Central 776 $523,877,367 $675,100 $457,750 2,201 50.6% 3,033 2.9 100% 34
Toronto C01 212 $97,175,045 $458,373 $380,000 674 45.0% 1,016 3.7 98% 37
Toronto C02 43 $47,286,788 $1,099,693 $799,900 113 48.6% 170 3.6 98% 39
Toronto C03 27 $28,115,063 $1,041,299 $750,000 57 55.8% 84 2.3 99% 20
Toronto C04 31 $35,831,700 $1,155,861 $1,132,000 112 55.9% 136 2.2 101% 27
Toronto C06 22 $16,160,506 $734,568 $762,400 48 50.4% 62 3.1 99% 31
Toronto C07 63 $40,894,790 $649,124 $430,000 164 51.6% 207 2.8 99% 37
Toronto C08 88 $41,452,129 $471,047 $427,500 251 52.8% 309 2.6 99% 35
Toronto C09 24 $37,196,400 $1,549,850 $997,500 48 55.9% 55 2.7 97% 37
Toronto C10 29 $20,003,862 $689,788 $557,500 66 59.5% 98 2.0 105% 22
Toronto C11 15 $7,818,500 $521,233 $294,000 46 73.0% 52 1.3 100% 23
Toronto C12 22 $33,487,970 $1,522,180 $1,532,500 57 48.8% 99 3.8 100% 43
Toronto C13 37 $20,113,350 $543,604 $373,750 65 66.5% 79 1.5 103% 26
Toronto C14 90 $50,496,490 $561,072 $397,600 299 45.6% 388 3.3 101% 38
Toronto C15 73 $47,844,774 $655,408 $425,000 201 52.7% 278 2.6 101% 29
Toronto East 401 $202,477,093 $504,930 $506,000 805 66.9% 793 1.4 101% 24
Toronto E01 32 $21,079,500 $658,734 $645,000 70 68.0% 61 1.1 104% 21
Toronto E02 26 $18,637,350 $716,821 $664,500 56 66.8% 51 1.2 104% 21
Toronto E03 41 $25,673,603 $626,185 $591,500 83 67.7% 61 1.0 103% 20
Toronto E04 51 $21,685,120 $425,198 $500,000 98 69.4% 86 1.3 103% 20
Toronto E05 45 $19,118,500 $424,856 $370,000 75 71.7% 63 1.1 100% 24
Toronto E06 21 $13,603,028 $647,763 $567,500 38 58.8% 33 1.5 101% 21
Toronto E07 36 $15,724,076 $436,780 $380,444 88 62.5% 110 1.8 100% 36
Toronto E08 28 $14,093,400 $503,336 $466,500 67 62.9% 78 1.7 97% 28
Toronto E09 51 $19,955,788 $391,290 $346,888 119 65.5% 132 1.7 100% 27
Toronto E10 37 $18,879,540 $510,258 $497,000 57 65.8% 57 1.6 101% 24
Toronto E11 33 $14,027,188 $425,066 $425,688 54 72.3% 61 1.4 100% 25
SUMMARY OF EXISTING HOME TRANSACTIONS

ALL HOME TYPES, YEAR-TO-DATE 2015ALL TREB AREAS
Number of Sales Dollar Volume1 Average Price1 Median Price1 New Listings2 Avg. SP/LP4 Avg. DOM5
TREB Total 4,355 $2,406,464,145 $552,575 $465,000 9,596 99% 31
Halton Region 371 $228,890,686 $616,956 $535,000 811 98% 32
Burlington 100 $51,443,528 $514,435 $490,000 158 98% 34
Halton Hills 32 $16,251,999 $507,875 $450,850 100 98% 32
Milton 92 $42,970,749 $467,073 $461,900 196 99% 20
Oakville 147 $118,224,410 $804,248 $694,900 357 97% 37
Peel Region 970 $467,470,361 $481,928 $444,000 1,937 98% 29
Brampton 428 $195,149,672 $455,957 $430,000 783 98% 26
Caledon 42 $23,819,270 $567,125 $556,500 97 96% 38
Mississauga 500 $248,501,419 $497,003 $449,000 1,057 98% 32
City of Toronto 1,561 $907,685,684 $581,477 $460,000 3,912 100% 32
York Region 789 $532,155,632 $674,468 $618,000 1,749 99% 32
Aurora 47 $32,110,000 $683,191 $588,000 102 98% 29
E. Gwillimbury 18 $8,369,500 $464,972 $429,000 33 98% 31
Georgina 34 $11,916,650 $350,490 $304,500 80 98% 26
King 19 $15,866,500 $835,079 $720,000 54 94% 77
Markham 189 $134,393,767 $711,078 $650,000 428 100% 27
Newmarket 74 $40,970,945 $553,661 $527,000 112 99% 31
Richmond Hill 173 $123,596,374 $714,430 $640,000 383 99% 30
Vaughan 192 $135,335,448 $704,872 $641,500 466 99% 34
Whitchurch-Stouffville 43 $29,596,448 $688,289 $600,000 91 96% 45
Durham Region 512 $209,198,450 $408,591 $381,000 884 99% 26
Ajax 79 $34,982,686 $442,819 $425,000 138 99% 20
Brock 11 $3,143,400 $285,764 $312,500 28 98% 52
Clarington 85 $31,314,988 $368,412 $341,000 159 99% 28
Oshawa 143 $47,617,079 $332,987 $333,500 208 99% 23
Pickering 61 $30,875,777 $506,160 $450,000 109 99% 30
Scugog 15 $8,943,020 $596,201 $430,000 39 95% 54
Uxbridge 14 $6,475,800 $462,557 $431,650 38 97% 61
Whitby 104 $45,845,700 $440,824 $428,000 165 100% 20
Dufferin County 38 $14,310,899 $376,603 $346,500 70 98% 49
Orangeville 38 $14,310,899 $376,603 $346,500 70 98% 49
Simcoe County 114 $46,752,433 $410,109 $391,000 233 98% 42
Adjala-Tosorontio 12 $4,983,500 $415,292 $412,500 26 97% 58
Bradford West Gwillimbury 33 $15,997,690 $484,778 $441,000 74 99% 31
Essa 9 $3,797,900 $421,989 $294,900 16 97% 61
Innisfil 29 $9,581,000 $330,379 $320,000 71 97% 46
New Tecumseth 31 $12,392,343 $399,753 $362,000 46 98% 38
! TURN PAGE FOR CITY OF TORONTO
TABLES OR CLICK HERE:
SUMMARY OF EXISTING HOME TRANSACTIONS
Market Watch, January 2015July 2010 Page 3
5
Toronto Real Estate Board

Market Watch, January 2015July 2010 Page 3
6
Toronto Real Estate Board
ALL HOME TYPES, YEAR-TO-DATE 2015CITY OF TORONTO MUNICIPAL BREAKDOWN
Number of Sales Dollar Volume1
Average Price1
Median Price1
New Listings2
Avg. SP/LP4
Avg. DOM5
TREB Total 4,355 $2,406,464,145 $552,575 $465,000 9,596 99% 31
City of Toronto Total 1,561 $907,685,684 $581,477 $460,000 3,912 100% 32
Toronto West 384 $181,331,224 $472,217 $435,000 906 99% 38
Toronto W01 21 $9,700,800 $461,943 $340,000 58 100% 41
Toronto W02 26 $16,877,231 $649,124 $632,250 58 100% 29
Toronto W03 35 $16,078,800 $459,394 $462,500 56 101% 32
Toronto W04 32 $15,043,889 $470,122 $500,750 73 99% 26
Toronto W05 56 $18,878,650 $337,119 $326,500 108 98% 40
Toronto W06 65 $32,034,538 $492,839 $450,000 189 100% 43
Toronto W07 8 $5,712,500 $714,063 $701,250 25 101% 40
Toronto W08 74 $41,564,421 $561,681 $391,000 217 99% 39
Toronto W09 20 $9,971,500 $498,575 $562,500 43 101% 25
Toronto W10 47 $15,468,895 $329,125 $276,000 79 96% 45
Toronto Central 776 $523,877,367 $675,100 $457,750 2,201 100% 34
Toronto C01 212 $97,175,045 $458,373 $380,000 674 98% 37
Toronto C02 43 $47,286,788 $1,099,693 $799,900 113 98% 39
Toronto C03 27 $28,115,063 $1,041,299 $750,000 57 99% 20
Toronto C04 31 $35,831,700 $1,155,861 $1,132,000 112 101% 27
Toronto C06 22 $16,160,506 $734,568 $762,400 48 99% 31
Toronto C07 63 $40,894,790 $649,124 $430,000 164 99% 37
Toronto C08 88 $41,452,129 $471,047 $427,500 251 99% 35
Toronto C09 24 $37,196,400 $1,549,850 $997,500 48 97% 37
Toronto C10 29 $20,003,862 $689,788 $557,500 66 105% 22
Toronto C11 15 $7,818,500 $521,233 $294,000 46 100% 23
Toronto C12 22 $33,487,970 $1,522,180 $1,532,500 57 100% 43
Toronto C13 37 $20,113,350 $543,604 $373,750 65 103% 26
Toronto C14 90 $50,496,490 $561,072 $397,600 299 101% 38
Toronto C15 73 $47,844,774 $655,408 $425,000 201 101% 29
Toronto East 401 $202,477,093 $504,930 $506,000 805 101% 24
Toronto E01 32 $21,079,500 $658,734 $645,000 70 104% 21
Toronto E02 26 $18,637,350 $716,821 $664,500 56 104% 21
Toronto E03 41 $25,673,603 $626,185 $591,500 83 103% 20
Toronto E04 51 $21,685,120 $425,198 $500,000 98 103% 20
Toronto E05 45 $19,118,500 $424,856 $370,000 75 100% 24
Toronto E06 21 $13,603,028 $647,763 $567,500 38 101% 21
Toronto E07 36 $15,724,076 $436,780 $380,444 88 100% 36
Toronto E08 28 $14,093,400 $503,336 $466,500 67 97% 28
Toronto E09 51 $19,955,788 $391,290 $346,888 119 100% 27
Toronto E10 37 $18,879,540 $510,258 $497,000 57 101% 24
Toronto E11 33 $14,027,188 $425,066 $425,688 54 100% 25
SUMMARY OF EXISTING HOME TRANSACTIONS

Market Watch, January 2015
Industrial Leasing
July 2010 Page 3
7
Toronto Real Estate Board
ALL TREB AREAS
Sales1 Dollar Volume1 Average Price1 Median Price1 New Listings2 Active Listings3 Avg. SP/LP4 Avg. DOM5
TREB Total 1,996 $1,429,390,097 $716,127 $618,000 4,252 4,966 99% 29- - - - - - - -
Halton Region 202 $155,595,460 $770,275 $657,500 510 669 97% 31
Burlington 49 $33,013,950 $673,754 $653,000 84 123 98% 35
Halton Hills 22 $12,134,800 $551,582 $468,900 78 125 98% 27
Milton 40 $21,882,600 $547,065 $541,500 118 138 99% 17
Oakville 91 $88,564,110 $973,232 $790,000 230 283 97% 36- - - - - - - -
Peel Region 430 $269,344,502 $626,383 $590,000 898 987 98% 28
Brampton 232 $122,313,717 $527,214 $500,500 443 429 98% 26
Caledon 27 $16,745,800 $620,215 $635,000 75 143 95% 45
Mississauga 171 $130,284,985 $761,900 $682,000 380 415 98% 27- - - - - - - -
City of Toronto 451 $427,869,584 $948,713 $751,528 993 1,039 101% 23
- - - - - - - -
York Region 432 $361,680,657 $837,224 $758,000 948 1,144 99% 31
Aurora 35 $26,388,100 $753,946 $700,000 64 71 98% 34
E. Gwillimbury 13 $6,226,000 $478,923 $430,000 28 47 97% 36
Georgina 31 $10,952,150 $353,295 $305,000 78 98 98% 26
King 15 $13,968,000 $931,200 $835,000 36 101 94% 78
Markham 81 $80,145,778 $989,454 $896,000 170 167 100% 19
Newmarket 49 $30,705,745 $626,648 $610,000 67 54 99% 31
Richmond Hill 79 $77,848,288 $985,421 $888,000 187 213 99% 23
Vaughan 100 $92,761,648 $927,616 $839,750 244 278 99% 32
Whitchurch-Stouffville 29 $22,684,948 $782,240 $645,000 74 115 95% 56- - - - - - - -
Durham Region 358 $162,496,962 $453,902 $426,650 651 688 99% 28
Ajax 48 $24,806,286 $516,798 $479,500 91 72 98% 20
Brock 11 $3,143,400 $285,764 $312,500 26 56 98% 52
Clarington 53 $21,876,000 $412,755 $392,500 112 128 99% 34
Oshawa 111 $39,710,879 $357,756 $350,000 159 119 99% 22
Pickering 38 $23,371,277 $615,034 $500,000 71 86 99% 31
Scugog 14 $8,598,120 $614,151 $477,060 38 66 95% 58
Uxbridge 10 $4,810,300 $481,030 $431,650 28 55 96% 62
Whitby 73 $36,180,700 $495,626 $469,900 126 106 100% 21- - - - - - - -
Dufferin County 29 $11,803,899 $407,031 $355,000 49 77 97% 60
Orangeville 29 $11,803,899 $407,031 $355,000 49 77 97% 60- - - - - - - -
Simcoe County 94 $40,599,033 $431,905 $416,450 203 362 98% 46
Adjala-Tosorontio 12 $4,983,500 $415,292 $412,500 26 52 97% 58
Bradford West Gwillimbury 27 $13,649,690 $505,544 $507,000 61 85 98% 36
Essa 5 $2,678,000 $535,600 $491,000 13 37 97% 96
Innisfil 26 $8,829,500 $339,596 $330,000 67 128 97% 47
New Tecumseth 24 $10,458,343 $435,764 $417,500 36 60 98% 38
SUMMARY OF EXISTING HOME TRANSACTIONSDETACHED HOUSES, JANUARY 2015
! TURN PAGE FOR CITY OF TORONTO
TABLES OR CLICK HERE:

Market Watch, January 2015
Industrial Leasing
July 2010 Page 3
8
Toronto Real Estate Board
CITY OF TORONTO MUNICIPAL BREAKDOWN
Sales1 Dollar Volume1 Average Price1 Median Price1 New Listings2 Active Listings3 Avg. SP/LP4 Avg. DOM5
TREB Total 1,996 $1,429,390,097 $716,127 $618,000 4,252 4,966 99% 29
City of Toronto Total 451 $427,869,584 $948,713 $751,528 993 1,039 101% 23
Toronto West 125 $88,502,489 $708,020 $640,000 293 351 100% 28
Toronto W01 2 $2,347,900 $1,173,950 $1,173,950 8 10 100% 5
Toronto W02 8 $7,230,500 $903,813 $832,500 12 16 97% 41
Toronto W03 19 $9,527,800 $501,463 $486,000 31 28 103% 17
Toronto W04 14 $9,232,281 $659,449 $631,741 37 42 99% 17
Toronto W05 7 $4,462,000 $637,429 $630,000 23 32 98% 42
Toronto W06 15 $10,223,788 $681,586 $658,888 37 39 104% 30
Toronto W07 6 $4,242,500 $707,083 $661,250 13 17 102% 23
Toronto W08 25 $24,210,220 $968,409 $835,000 78 103 99% 27
Toronto W09 13 $8,287,500 $637,500 $630,000 18 18 102% 26
Toronto W10 16 $8,738,000 $546,125 $527,500 36 46 96% 48
Toronto Central 163 $231,848,236 $1,422,382 $1,200,000 394 438 101% 22
Toronto C01 2 $1,930,000 $965,000 $965,000 10 8 102% 12
Toronto C02 8 $16,028,888 $2,003,611 $1,875,500 18 24 97% 23
Toronto C03 19 $23,244,360 $1,223,387 $1,045,000 32 31 99% 14
Toronto C04 16 $25,653,800 $1,603,363 $1,349,000 85 102 102% 15
Toronto C06 14 $12,742,118 $910,151 $846,009 19 20 98% 32
Toronto C07 22 $24,764,500 $1,125,659 $964,550 51 58 100% 17
Toronto C08 2 $2,030,000 $1,015,000 $1,015,000 2 2 101% 42
Toronto C09 10 $28,224,000 $2,822,400 $2,647,500 19 22 97% 44
Toronto C10 5 $6,073,900 $1,214,780 $1,025,000 11 14 112% 14
Toronto C11 3 $4,357,000 $1,452,333 $1,330,000 5 5 101% 38
Toronto C12 16 $28,375,070 $1,773,442 $1,661,950 31 62 101% 42
Toronto C13 11 $11,264,000 $1,024,000 $871,500 21 15 106% 15
Toronto C14 15 $19,683,600 $1,312,240 $1,201,000 59 52 105% 11
Toronto C15 20 $27,477,000 $1,373,850 $1,092,900 31 23 103% 17
Toronto East 163 $107,518,859 $659,625 $605,000 306 250 102% 20
Toronto E01 4 $3,017,000 $754,250 $744,000 11 13 104% 11
Toronto E02 5 $5,042,500 $1,008,500 $725,000 15 12 103% 18
Toronto E03 26 $18,002,673 $692,411 $652,000 56 40 103% 21
Toronto E04 22 $12,832,820 $583,310 $573,500 43 30 105% 13
Toronto E05 9 $7,044,900 $782,767 $765,000 13 8 102% 23
Toronto E06 17 $10,723,028 $630,766 $580,000 27 21 101% 20
Toronto E07 12 $8,247,388 $687,282 $686,000 16 13 102% 22
Toronto E08 14 $10,611,000 $757,929 $660,000 35 38 97% 25
Toronto E09 19 $10,775,000 $567,105 $561,000 36 30 101% 20
Toronto E10 26 $15,704,050 $604,002 $525,000 42 32 101% 18
Toronto E11 9 $5,518,500 $613,167 $577,000 12 13 99% 28
DETACHED HOUSES, JANUARY 2015SUMMARY OF EXISTING HOME TRANSACTIONS

Industrial Leasing
Toronto Real Estate Board
ALL TREB AREAS
Sales1 Dollar Volume1 Average Price1 Median Price1 New Listings2 Active Listings3 Avg. SP/LP4 Avg. DOM5
TREB Total 418 $217,573,122 $520,510 $482,000 636 451 101% 19- - - - - - - -
Halton Region 26 $12,173,077 $468,195 $461,500 46 32 100% 21
Burlington 8 $3,643,877 $455,485 $472,050 7 1 101% 14
Halton Hills 4 $1,765,200 $441,300 $447,350 3 2 99% 45
Milton 11 $5,118,000 $465,273 $465,000 24 16 99% 20
Oakville 3 $1,646,000 $548,667 $515,000 12 13 99% 12- - - - - - - -
Peel Region 168 $75,438,342 $449,038 $442,000 237 166 99% 20
Brampton 94 $39,035,942 $415,276 $409,000 140 109 99% 21
Caledon 9 $4,097,500 $455,278 $454,500 8 1 100% 23
Mississauga 65 $32,304,900 $496,998 $495,000 89 56 99% 18- - - - - - - -
City of Toronto 128 $85,433,827 $667,452 $630,000 216 165 104% 18
- - - - - - - -
York Region 57 $32,085,488 $562,903 $555,000 87 59 101% 17
Aurora 2 $872,000 $436,000 $436,000 2 2 99% 13
E. Gwillimbury 3 $1,417,500 $472,500 $500,000 1 1 101% 26
Georgina 1 $379,500 $379,500 $379,500 1 - 97% 17
King - - - - - - - -
Markham 14 $8,991,188 $642,228 $649,900 20 14 101% 16
Newmarket 7 $3,287,900 $469,700 $474,900 8 5 101% 21
Richmond Hill 10 $5,775,100 $577,510 $575,750 17 11 100% 25
Vaughan 16 $9,305,800 $581,613 $570,000 33 25 101% 11
Whitchurch-Stouffville 4 $2,056,500 $514,125 $515,750 5 1 102% 5- - - - - - - -
Durham Region 30 $9,511,988 $317,066 $324,950 40 24 101% 19
Ajax 5 $1,967,900 $393,580 $392,000 3 2 98% 30
Brock - - - - - - - -
Clarington 4 $1,111,888 $277,972 $270,444 5 3 101% 11
Oshawa 14 $3,839,200 $274,229 $265,700 19 10 103% 16
Pickering 2 $829,000 $414,500 $414,500 5 4 101% 6
Scugog - - - - - - - -
Uxbridge 1 $374,500 $374,500 $374,500 1 - 100% 8
Whitby 4 $1,389,500 $347,375 $342,500 7 5 99% 37- - - - - - - -
Dufferin County 3 $863,500 $287,833 $305,000 5 4 99% 8
Orangeville 3 $863,500 $287,833 $305,000 5 4 99% 8- - - - - - - -
Simcoe County 6 $2,066,900 $344,483 $321,450 5 1 100% 13
Adjala-Tosorontio - - - - - - - -
Bradford West Gwillimbury 3 $1,219,000 $406,333 $430,000 3 1 101% 11
Essa 2 $574,900 $287,450 $287,450 1 - 98% 19
Innisfil - - - - - - - -
New Tecumseth 1 $273,000 $273,000 $273,000 1 - 99% 7
! TURN PAGE FOR CITY OF TORONTO
TABLES OR CLICK HERE:
SUMMARY OF EXISTING HOME TRANSACTIONSSEMI-DETACHED HOUSES, JANUARY 2015
July 2010 Page 3 Market Watch, January 2015 9

Industrial Leasing
July 2010 Page 3
Toronto Real Estate Board
Market Watch, January 2015
CITY OF TORONTO MUNICIPAL BREAKDOWN
Sales1 Dollar Volume1 Average Price1 Median Price1 New Listings2 Active Listings3 Avg. SP/LP4 Avg. DOM5
TREB Total 418 $217,573,122 $520,510 $482,000 636 451 101% 19
City of Toronto Total 128 $85,433,827 $667,452 $630,000 216 165 104% 18
Toronto West 35 $20,258,608 $578,817 $547,000 74 78 102% 25
Toronto W01 1 $810,000 $810,000 $810,000 2 1 103% 8
Toronto W02 8 $5,523,500 $690,438 $694,000 15 13 107% 15
Toronto W03 7 $4,072,000 $581,714 $599,000 18 23 99% 47
Toronto W04 2 $1,033,108 $516,554 $516,554 7 5 101% 3
Toronto W05 14 $6,851,600 $489,400 $454,000 25 25 99% 27
Toronto W06 1 $901,500 $901,500 $901,500 2 2 104% 5
Toronto W07 - - - - - - - -
Toronto W08 1 $652,000 $652,000 $652,000 1 3 105% 8
Toronto W09 - - - - 2 3 - -
Toronto W10 1 $414,900 $414,900 $414,900 2 3 99% 30
Toronto Central 33 $26,385,189 $799,551 $762,000 58 47 103% 12
Toronto C01 6 $5,682,377 $947,063 $824,189 8 5 100% 11
Toronto C02 8 $5,914,000 $739,250 $710,000 14 9 102% 12
Toronto C03 3 $2,395,000 $798,333 $630,000 5 5 99% 14
Toronto C04 1 $1,410,000 $1,410,000 $1,410,000 1 - 101% 14
Toronto C06 - - - - - 1 - -
Toronto C07 1 $660,000 $660,000 $660,000 5 4 102% 6
Toronto C08 2 $1,486,250 $743,125 $743,125 5 3 112% 3
Toronto C09 - - - - 3 5 - -
Toronto C10 4 $3,808,562 $952,141 $912,507 7 3 115% 7
Toronto C11 - - - - 1 1 - -
Toronto C12 - - - - 1 1 - -
Toronto C13 4 $2,240,000 $560,000 $551,000 3 3 100% 18
Toronto C14 1 $850,000 $850,000 $850,000 1 - 106% 11
Toronto C15 3 $1,939,000 $646,333 $613,000 4 7 102% 19
Toronto East 60 $38,790,030 $646,501 $621,500 84 40 105% 18
Toronto E01 15 $11,481,600 $765,440 $765,000 25 9 108% 10
Toronto E02 17 $11,963,500 $703,735 $631,000 23 12 104% 20
Toronto E03 8 $5,469,930 $683,741 $687,750 11 8 105% 28
Toronto E04 5 $2,741,500 $548,300 $521,500 6 1 103% 6
Toronto E05 2 $1,160,000 $580,000 $580,000 2 2 104% 44
Toronto E06 2 $965,000 $482,500 $482,500 2 1 101% 38
Toronto E07 1 $568,500 $568,500 $568,500 2 1 101% 21
Toronto E08 - - - - - - - -
Toronto E09 - - - - 1 1 - -
Toronto E10 1 $390,000 $390,000 $390,000 3 1 103% 14
Toronto E11 9 $4,050,000 $450,000 $419,000 9 4 102% 14
SUMMARY OF EXISTING HOME TRANSACTIONSSEMI-DETACHED HOUSES, JANUARY 2015
10

Industrial Leasing
July 2010 Page 3
Toronto Real Estate Board
Market Watch, January 2015
ALL TREB AREAS
Sales1 Dollar Volume1 Average Price1 Median Price1 New Listings2 Active Listings3 Avg. SP/LP4 Avg. DOM5
TREB Total 325 $121,298,607 $373,226 $355,000 622 666 99% 34- - - - - - - -
Halton Region 40 $14,876,550 $371,914 $335,375 59 57 98% 43
Burlington 15 $5,433,900 $362,260 $328,000 25 25 97% 40
Halton Hills 2 $765,000 $382,500 $382,500 6 6 99% 65
Milton 7 $2,108,650 $301,236 $292,400 7 5 97% 38
Oakville 16 $6,569,000 $410,563 $350,500 21 21 98% 45- - - - - - - -
Peel Region 101 $35,480,076 $351,288 $350,000 200 207 99% 32
Brampton 17 $4,999,900 $294,112 $272,000 47 63 98% 39
Caledon - - - - 3 2 - -
Mississauga 84 $30,480,176 $362,859 $368,750 150 142 99% 30- - - - - - - -
City of Toronto 103 $42,015,983 $407,922 $389,000 212 262 99% 32
- - - - - - - -
York Region 42 $18,803,898 $447,712 $459,900 95 91 99% 33
Aurora - - - - 12 17 - -
E. Gwillimbury - - - - - - - -
Georgina - - - - - - - -
King - - - - - - - -
Markham 23 $10,937,900 $475,561 $473,000 36 32 98% 39
Newmarket 3 $1,197,400 $399,133 $322,500 13 11 100% 48
Richmond Hill 11 $4,788,598 $435,327 $460,000 20 17 101% 25
Vaughan 4 $1,584,000 $396,000 $393,000 13 14 99% 18
Whitchurch-Stouffville 1 $296,000 $296,000 $296,000 1 - 100% 16- - - - - - - -
Durham Region 36 $9,344,600 $259,572 $264,450 52 45 99% 34
Ajax 8 $2,407,500 $300,938 $307,500 15 10 101% 13
Brock - - - - 2 3 - -
Clarington 5 $1,160,900 $232,180 $214,000 5 5 99% 39
Oshawa 11 $2,242,100 $203,827 $193,000 15 13 97% 39
Pickering 7 $1,850,100 $264,300 $261,900 8 5 98% 32
Scugog - - - - - 1 - -
Uxbridge 2 $840,000 $420,000 $420,000 3 3 99% 109
Whitby 3 $844,000 $281,333 $280,000 4 5 100% 15- - - - - - - -
Dufferin County 1 $229,500 $229,500 $229,500 4 3 99% 9
Orangeville 1 $229,500 $229,500 $229,500 4 3 99% 9- - - - - - - -
Simcoe County 2 $548,000 $274,000 $274,000 - 1 98% 64
Adjala-Tosorontio - - - - - - - -
Bradford West Gwillimbury - - - - - - - -
Essa - - - - - - - -
Innisfil - - - - - - - -
New Tecumseth 2 $548,000 $274,000 $274,000 - 1 98% 64
! TURN PAGE FOR CITY OF TORONTO
TABLES OR CLICK HERE:
SUMMARY OF EXISTING HOME TRANSACTIONSCONDOMINIUM TOWNHOUSES, JANUARY 2015
11
Industrial Leasing
July 2010 Page 3
Toronto Real Estate Board
Market Watch, January 2015 12
CITY OF TORONTO MUNICIPAL BREAKDOWN
Sales1 Dollar Volume1 Average Price1 Median Price1 New Listings2 Active Listings3 Avg. SP/LP4 Avg. DOM5
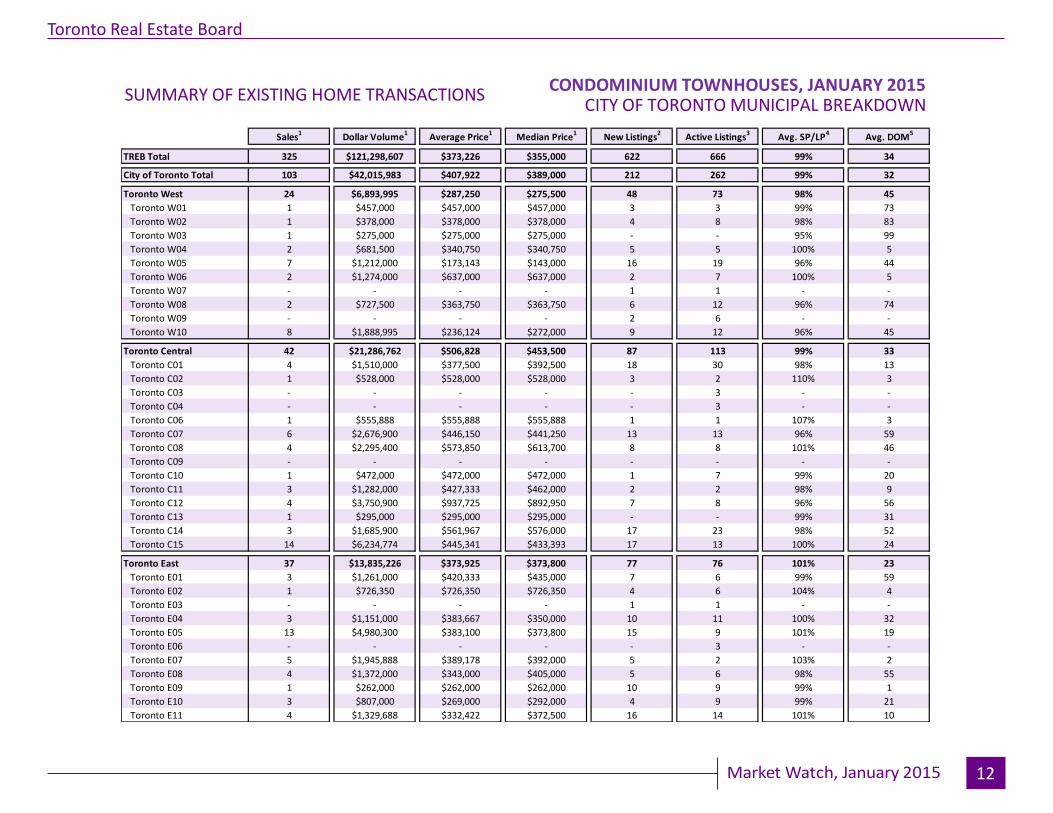
TREB Total 325 $121,298,607 $373,226 $355,000 622 666 99% 34
City of Toronto Total 103 $42,015,983 $407,922 $389,000 212 262 99% 32
Toronto West 24 $6,893,995 $287,250 $275,500 48 73 98% 45
Toronto W01 1 $457,000 $457,000 $457,000 3 3 99% 73
Toronto W02 1 $378,000 $378,000 $378,000 4 8 98% 83
Toronto W03 1 $275,000 $275,000 $275,000 - - 95% 99
Toronto W04 2 $681,500 $340,750 $340,750 5 5 100% 5
Toronto W05 7 $1,212,000 $173,143 $143,000 16 19 96% 44
Toronto W06 2 $1,274,000 $637,000 $637,000 2 7 100% 5
Toronto W07 - - - - 1 1 - -
Toronto W08 2 $727,500 $363,750 $363,750 6 12 96% 74
Toronto W09 - - - - 2 6 - -
Toronto W10 8 $1,888,995 $236,124 $272,000 9 12 96% 45
Toronto Central 42 $21,286,762 $506,828 $453,500 87 113 99% 33
Toronto C01 4 $1,510,000 $377,500 $392,500 18 30 98% 13
Toronto C02 1 $528,000 $528,000 $528,000 3 2 110% 3
Toronto C03 - - - - - 3 - -
Toronto C04 - - - - - 3 - -
Toronto C06 1 $555,888 $555,888 $555,888 1 1 107% 3
Toronto C07 6 $2,676,900 $446,150 $441,250 13 13 96% 59
Toronto C08 4 $2,295,400 $573,850 $613,700 8 8 101% 46
Toronto C09 - - - - - - - -
Toronto C10 1 $472,000 $472,000 $472,000 1 7 99% 20
Toronto C11 3 $1,282,000 $427,333 $462,000 2 2 98% 9
Toronto C12 4 $3,750,900 $937,725 $892,950 7 8 96% 56
Toronto C13 1 $295,000 $295,000 $295,000 - - 99% 31
Toronto C14 3 $1,685,900 $561,967 $576,000 17 23 98% 52
Toronto C15 14 $6,234,774 $445,341 $433,393 17 13 100% 24
Toronto East 37 $13,835,226 $373,925 $373,800 77 76 101% 23
Toronto E01 3 $1,261,000 $420,333 $435,000 7 6 99% 59
Toronto E02 1 $726,350 $726,350 $726,350 4 6 104% 4
Toronto E03 - - - - 1 1 - -
Toronto E04 3 $1,151,000 $383,667 $350,000 10 11 100% 32
Toronto E05 13 $4,980,300 $383,100 $373,800 15 9 101% 19
Toronto E06 - - - - - 3 - -
Toronto E07 5 $1,945,888 $389,178 $392,000 5 2 103% 2
Toronto E08 4 $1,372,000 $343,000 $405,000 5 6 98% 55
Toronto E09 1 $262,000 $262,000 $262,000 10 9 99% 1
Toronto E10 3 $807,000 $269,000 $292,000 4 9 99% 21
Toronto E11 4 $1,329,688 $332,422 $372,500 16 14 101% 10
SUMMARY OF EXISTING HOME TRANSACTIONSCONDOMINIUM TOWNHOUSES, JANUARY 2015

Industrial Leasing
July 2010 Page 3
Toronto Real Estate Board
Market Watch, January 2015
ALL TREB AREAS
Sales1 Dollar Volume1 Average Price1 Median Price1 New Listings2 Active Listings3 Avg. SP/LP4 Avg. DOM5
TREB Total 1,201 $430,946,653 $358,823 $316,500 3,409 5,008 98% 42- - - - - - - -
Halton Region 41 $15,369,013 $374,854 $273,000 92 158 96% 44
Burlington 22 $6,604,013 $300,182 $272,000 28 49 98% 38
Halton Hills 1 $350,000 $350,000 $350,000 4 9 97% 107
Milton 4 $1,045,500 $261,375 $254,250 12 15 96% 20
Oakville 14 $7,369,500 $526,393 $306,500 48 85 95% 56- - - - - - - -
Peel Region 189 $52,238,170 $276,392 $255,000 470 670 97% 44
Brampton 26 $5,683,400 $218,592 $221,000 68 86 97% 41
Caledon - - - - 1 2 - -
Mississauga 163 $46,554,770 $285,612 $259,900 401 582 97% 44- - - - - - - -
City of Toronto 809 $309,408,890 $382,458 $337,500 2,375 3,477 98% 40
- - - - - - - -
York Region 133 $46,847,380 $352,236 $337,500 426 649 97% 53
Aurora 1 $467,000 $467,000 $467,000 12 20 97% 34
E. Gwillimbury - - - - - - - -
Georgina - - - - - 4 - -
King 2 $697,000 $348,500 $348,500 9 19 95% 133
Markham 42 $14,646,280 $348,721 $340,500 142 238 98% 45
Newmarket 7 $2,092,400 $298,914 $317,500 8 8 98% 49
Richmond Hill 32 $10,364,100 $323,878 $297,250 117 168 97% 51
Vaughan 48 $17,955,600 $374,075 $358,300 137 191 97% 56
Whitchurch-Stouffville 1 $625,000 $625,000 $625,000 1 1 99% 205- - - - - - - -
Durham Region 28 $6,918,700 $247,096 $233,100 42 45 98% 35
Ajax 7 $1,539,500 $219,929 $204,500 11 9 98% 37
Brock - - - - - - - -
Clarington - - - - 4 8 - -
Oshawa 3 $460,500 $153,500 $148,500 7 9 96% 34
Pickering 9 $2,812,400 $312,489 $258,000 9 9 99% 45
Scugog - - - - - - - -
Uxbridge - - - - 4 4 - -
Whitby 9 $2,106,300 $234,033 $236,300 7 6 99% 23- - - - - - - -
Dufferin County 1 $164,500 $164,500 $164,500 - 1 97% 27
Orangeville 1 $164,500 $164,500 $164,500 - 1 97% 27- - - - - - - -
Simcoe County - - - - 4 8 - -
Adjala-Tosorontio - - - - - - - -
Bradford West Gwillimbury - - - - 2 2 - -
Essa - - - - - - - -
Innisfil - - - - - - - -
New Tecumseth - - - - 2 6 - -
! TURN PAGE FOR CITY OF TORONTO
TABLES OR CLICK HERE:
SUMMARY OF EXISTING HOME TRANSACTIONSCONDOMINIUM APARTMENT, JANUARY 2015
13

Industrial Leasing
July 2010 Page 3
Toronto Real Estate Board
Market Watch, January 2015 14
CITY OF TORONTO MUNICIPAL BREAKDOWN
Sales1 Dollar Volume1 Average Price1 Median Price1 New Listings2 Active Listings3 Avg. SP/LP4 Avg. DOM5
TREB Total 1,201 $430,946,653 $358,823 $316,500 3,409 5,008 98% 42
City of Toronto Total 809 $309,408,890 $382,458 $337,500 2,375 3,477 98% 40
Toronto West 179 $55,725,132 $311,314 $285,000 467 704 97% 45
Toronto W01 15 $5,205,900 $347,060 $315,000 45 67 99% 46
Toronto W02 6 $2,084,231 $347,372 $294,500 24 34 101% 15
Toronto W03 7 $1,909,000 $272,714 $263,500 6 6 97% 40
Toronto W04 11 $2,398,500 $218,045 $198,000 22 39 98% 40
Toronto W05 23 $4,783,550 $207,980 $175,000 34 54 97% 48
Toronto W06 44 $17,931,250 $407,528 $345,250 144 243 97% 52
Toronto W07 - - - - 8 9 - -
Toronto W08 45 $15,761,701 $350,260 $319,500 131 164 98% 46
Toronto W09 7 $1,684,000 $240,571 $200,000 21 27 95% 24
Toronto W10 21 $3,967,000 $188,905 $199,000 32 61 96% 45
Toronto Central 508 $221,204,280 $435,441 $375,000 1,602 2,370 98% 39
Toronto C01 192 $82,477,168 $429,569 $371,500 627 964 98% 39
Toronto C02 20 $17,747,900 $887,395 $629,750 71 129 97% 51
Toronto C03 5 $2,475,703 $495,141 $515,000 17 39 99% 48
Toronto C04 12 $7,827,900 $652,325 $384,950 17 20 98% 39
Toronto C06 7 $2,862,500 $408,929 $375,000 28 40 99% 33
Toronto C07 33 $12,155,390 $368,345 $350,000 93 129 98% 46
Toronto C08 76 $33,138,579 $436,034 $410,500 229 288 98% 37
Toronto C09 11 $6,860,400 $623,673 $550,000 19 20 99% 33
Toronto C10 17 $8,338,400 $490,494 $428,000 45 74 99% 29
Toronto C11 9 $2,179,500 $242,167 $217,000 38 43 99% 23
Toronto C12 2 $1,362,000 $681,000 $681,000 17 26 98% 26
Toronto C13 20 $5,823,350 $291,168 $300,000 40 60 98% 34
Toronto C14 68 $25,761,490 $378,845 $353,500 213 304 97% 42
Toronto C15 36 $12,194,000 $338,722 $327,000 148 234 97% 38
Toronto East 122 $32,479,478 $266,225 $239,500 306 403 98% 35
Toronto E01 7 $3,455,900 $493,700 $516,000 22 29 100% 31
Toronto E02 3 $905,000 $301,667 $210,000 11 18 101% 36
Toronto E03 6 $1,754,000 $292,333 $231,000 14 11 99% 11
Toronto E04 18 $3,239,800 $179,989 $165,200 35 40 96% 34
Toronto E05 19 $4,802,300 $252,753 $250,500 42 41 98% 26
Toronto E06 2 $1,915,000 $957,500 $957,500 9 8 103% 17
Toronto E07 16 $3,825,300 $239,081 $257,500 59 90 97% 61
Toronto E08 9 $1,692,400 $188,044 $178,900 25 32 97% 24
Toronto E09 31 $8,918,788 $287,703 $272,500 72 92 98% 33
Toronto E10 4 $769,990 $192,498 $194,500 6 14 98% 77
Toronto E11 7 $1,201,000 $171,571 $171,000 11 28 98% 36
SUMMARY OF EXISTING HOME TRANSACTIONSCONDOMINIUM APARTMENT, JANUARY 2015

Industrial Leasing
July 2010 Page 3
Toronto Real Estate Board
Market Watch, January 2015
ALL TREB AREAS
Sales1 Dollar Volume1 Average Price1 Median Price1 New Listings2 Active Listings3 Avg. SP/LP4 Avg. DOM5
TREB Total 51 $25,636,721 $502,681 $500,000 80 53 101% 17- - - - - - - -
Halton Region 1 $483,500 $483,500 $483,500 5 5 100% 61
Burlington - - - - 3 3 - -
Halton Hills - - - - - - - -
Milton 1 $483,500 $483,500 $483,500 - - 100% 61
Oakville - - - - 2 2 - -- - - - - - - -
Peel Region 6 $2,757,700 $459,617 $469,950 9 7 99% 29
Brampton 3 $1,223,000 $407,667 $405,000 7 5 99% 15
Caledon - - - - - 1 - -
Mississauga 3 $1,534,700 $511,567 $500,000 2 1 99% 42- - - - - - - -
City of Toronto 6 $3,181,000 $530,167 $552,000 10 8 97% 32
- - - - - - - -
York Region 21 $13,617,121 $648,434 $641,000 30 15 102% 9
Aurora - - - - - - - -
E. Gwillimbury - - - - - - - -
Georgina - - - - - - - -
King 1 $500,000 $500,000 $500,000 3 2 96% 16
Markham 8 $5,775,121 $721,890 $728,444 15 8 106% 6
Newmarket - - - - - - - -
Richmond Hill 5 $3,284,000 $656,800 $628,000 5 2 99% 10
Vaughan 7 $4,058,000 $579,714 $588,500 7 3 100% 10
Whitchurch-Stouffville - - - - - - - -- - - - - - - -
Durham Region 15 $5,027,400 $335,160 $344,900 22 13 101% 16
Ajax 1 $365,000 $365,000 $365,000 2 2 96% 57
Brock - - - - - - - -
Clarington 11 $3,601,500 $327,409 $335,000 15 9 101% 15
Oshawa - - - - 1 1 - -
Pickering 1 $363,000 $363,000 $363,000 2 1 101% 4
Scugog 1 $344,900 $344,900 $344,900 1 - 100% 11
Uxbridge - - - - - - - -
Whitby 1 $353,000 $353,000 $353,000 1 - 99% 5- - - - - - - -
Dufferin County - - - - - - - -
Orangeville - - - - - - - -- - - - - - - -
Simcoe County 2 $570,000 $285,000 $285,000 4 5 99% 17
Adjala-Tosorontio - - - - - - - -
Bradford West Gwillimbury - - - - 3 3 - -
Essa 1 $290,000 $290,000 $290,000 1 - 99% 17
Innisfil - - - - - 1 - -
New Tecumseth 1 $280,000 $280,000 $280,000 - 1 100% 17
SUMMARY OF EXISTING HOME TRANSACTIONSLINK, JANUARY 2015
! TURN PAGE FOR CITY OF TORONTO
TABLES OR CLICK HERE:
15

Industrial Leasing
July 2010 Page 3
Toronto Real Estate Board
Market Watch, January 2015 16
CITY OF TORONTO MUNICIPAL BREAKDOWN
Sales1 Dollar Volume1 Average Price1 Median Price1 New Listings2 Active Listings3 Avg. SP/LP4 Avg. DOM5
TREB Total 51 $25,636,721 $502,681 $500,000 80 53 101% 17
City of Toronto Total 6 $3,181,000 $530,167 $552,000 10 8 97% 32
Toronto West - - - - 1 2 - -
Toronto W01 - - - - - - - -
Toronto W02 - - - - - - - -
Toronto W03 - - - - - - - -
Toronto W04 - - - - - - - -
Toronto W05 - - - - 1 - - -
Toronto W06 - - - - - - - -
Toronto W07 - - - - - - - -
Toronto W08 - - - - - - - -
Toronto W09 - - - - - 1 - -
Toronto W10 - - - - - 1 - -
Toronto Central - - - - 1 2 - -
Toronto C01 - - - - - - - -
Toronto C02 - - - - - - - -
Toronto C03 - - - - - - - -
Toronto C04 - - - - - - - -
Toronto C06 - - - - - - - -
Toronto C07 - - - - 1 1 - -
Toronto C08 - - - - - - - -
Toronto C09 - - - - - - - -
Toronto C10 - - - - - - - -
Toronto C11 - - - - - - - -
Toronto C12 - - - - - - - -
Toronto C13 - - - - - - - -
Toronto C14 - - - - - 1 - -
Toronto C15 - - - - - - - -
Toronto East 6 $3,181,000 $530,167 $552,000 8 4 97% 32
Toronto E01 - - - - - - - -
Toronto E02 - - - - - - - -
Toronto E03 - - - - - - - -
Toronto E04 - - - - - - - -
Toronto E05 1 $616,000 $616,000 $616,000 2 1 97% 51
Toronto E06 - - - - - - - -
Toronto E07 2 $1,137,000 $568,500 $568,500 4 2 96% 12
Toronto E08 - - - - 1 1 - -
Toronto E09 - - - - - - - -
Toronto E10 1 $399,000 $399,000 $399,000 - - 100% 7
Toronto E11 2 $1,029,000 $514,500 $514,500 1 - 98% 56
SUMMARY OF EXISTING HOME TRANSACTIONSLINK, JANUARY 2015

Industrial Leasing
July 2010 Page 3
Toronto Real Estate Board
Market Watch, January 2015
ALL TREB AREAS
Sales1 Dollar Volume1 Average Price1 Median Price1 New Listings2 Active Listings3 Avg. SP/LP4 Avg. DOM5
TREB Total 348 $174,860,445 $502,473 $460,000 551 396 100% 22- - - - - - - -
Halton Region 60 $29,093,086 $484,885 $442,000 95 71 99% 23
Burlington 6 $2,747,788 $457,965 $439,444 11 12 99% 24
Halton Hills 3 $1,236,999 $412,333 $401,999 9 9 101% 4
Milton 29 $12,332,499 $425,259 $435,000 35 15 100% 20
Oakville 22 $12,775,800 $580,718 $561,400 40 35 99% 28- - - - - - - -
Peel Region 74 $31,084,071 $420,055 $415,000 119 81 99% 20
Brampton 55 $21,421,213 $389,477 $405,000 77 52 99% 22
Caledon 6 $2,975,970 $495,995 $459,495 10 8 100% 25
Mississauga 13 $6,686,888 $514,376 $505,500 32 21 100% 13- - - - - - - -
City of Toronto 52 $35,835,400 $689,142 $639,000 74 67 100% 30
- - - - - - - -
York Region 104 $59,121,088 $568,472 $562,000 162 117 100% 23
Aurora 9 $4,382,900 $486,989 $469,900 12 4 99% 13
E. Gwillimbury 2 $726,000 $363,000 $363,000 4 3 97% 8
Georgina 2 $585,000 $292,500 $292,500 1 2 99% 20
King 1 $701,500 $701,500 $701,500 6 8 97% 14
Markham 21 $13,897,500 $661,786 $620,000 44 33 102% 21
Newmarket 8 $3,687,500 $460,938 $457,750 16 11 100% 20
Richmond Hill 36 $21,536,288 $598,230 $591,500 37 22 100% 33
Vaughan 17 $9,670,400 $568,847 $550,000 32 31 100% 23
Whitchurch-Stouffville 8 $3,934,000 $491,750 $488,500 10 3 101% 10- - - - - - - -
Durham Region 45 $15,898,800 $353,307 $347,000 77 42 100% 12
Ajax 10 $3,896,500 $389,650 $387,500 16 9 99% 10
Brock - - - - - - - -
Clarington 12 $3,564,700 $297,058 $304,500 18 7 100% 12
Oshawa 4 $1,364,400 $341,100 $340,450 7 9 99% 30
Pickering 4 $1,650,000 $412,500 $413,750 14 7 100% 8
Scugog - - - - - - - -
Uxbridge 1 $451,000 $451,000 $451,000 2 1 100% 3
Whitby 14 $4,972,200 $355,157 $350,000 20 9 100% 11- - - - - - - -
Dufferin County 4 $1,249,500 $312,375 $313,750 12 8 101% 15
Orangeville 4 $1,249,500 $312,375 $313,750 12 8 101% 15- - - - - - - -
Simcoe County 9 $2,578,500 $286,500 $273,000 12 10 98% 30
Adjala-Tosorontio - - - - - - - -
Bradford West Gwillimbury 3 $1,129,000 $376,333 $375,000 5 2 99% 11
Essa 1 $255,000 $255,000 $255,000 1 - 98% 13
Innisfil 3 $751,500 $250,500 $257,500 4 7 98% 38
New Tecumseth 2 $443,000 $221,500 $221,500 2 1 97% 56
! TURN PAGE FOR CITY OF TORONTO
TABLES OR CLICK HERE:
SUMMARY OF EXISTING HOME TRANSACTIONSATTACHED/ROW/TOWNHOUSE, JANUARY 2015
17

Industrial Leasing
July 2010 Page 3
Toronto Real Estate Board
Market Watch, January 2015 18
CITY OF TORONTO MUNICIPAL BREAKDOWN
Sales1 Dollar Volume1 Average Price1 Median Price1 New Listings2 Active Listings3 Avg. SP/LP4 Avg. DOM5
TREB Total 348 $174,860,445 $502,473 $460,000 551 396 100% 22
City of Toronto Total 52 $35,835,400 $689,142 $639,000 74 67 100% 30
Toronto West 16 $9,040,500 $565,031 $572,500 14 12 99% 44
Toronto W01 1 $705,000 $705,000 $705,000 - 1 102% 61
Toronto W02 3 $1,661,000 $553,667 $616,000 2 1 97% 44
Toronto W03 1 $295,000 $295,000 $295,000 1 2 98% 80
Toronto W04 3 $1,698,500 $566,167 $501,500 2 2 98% 41
Toronto W05 3 $1,399,000 $466,333 $445,000 5 5 99% 32
Toronto W06 2 $1,352,000 $676,000 $676,000 2 - 104% 4
Toronto W07 2 $1,470,000 $735,000 $735,000 2 1 98% 94
Toronto W08 - - - - - - - -
Toronto W09 - - - - - - - -
Toronto W10 1 $460,000 $460,000 $460,000 - - 98% 21
Toronto Central 23 $20,122,400 $874,887 $775,000 37 36 101% 28
Toronto C01 8 $5,575,500 $696,938 $737,500 11 9 103% 25
Toronto C02 4 $5,935,500 $1,483,875 $1,193,500 6 5 103% 21
Toronto C03 - - - - - 2 - -
Toronto C04 1 $730,000 $730,000 $730,000 3 4 99% 35
Toronto C06 - - - - - - - -
Toronto C07 1 $638,000 $638,000 $638,000 1 2 98% 40
Toronto C08 3 $2,276,900 $758,967 $700,000 6 5 102% 6
Toronto C09 1 $1,000,000 $1,000,000 $1,000,000 1 - 100% 1
Toronto C10 1 $960,000 $960,000 $960,000 1 - 97% 6
Toronto C11 - - - - - 1 - -
Toronto C12 - - - - - 1 - -
Toronto C13 1 $491,000 $491,000 $491,000 - - 96% 23
Toronto C14 3 $2,515,500 $838,500 $780,000 8 7 98% 81
Toronto C15 - - - - - - - -
Toronto East 13 $6,672,500 $513,269 $481,000 23 19 100% 15
Toronto E01 3 $1,864,000 $621,333 $678,000 5 4 98% 23
Toronto E02 - - - - 2 2 - -
Toronto E03 1 $447,000 $447,000 $447,000 1 1 104% 7
Toronto E04 3 $1,720,000 $573,333 $582,000 4 4 100% 8
Toronto E05 1 $515,000 $515,000 $515,000 1 2 98% 12
Toronto E06 - - - - - - - -
Toronto E07 - - - - 2 2 - -
Toronto E08 1 $418,000 $418,000 $418,000 1 1 100% 2
Toronto E09 - - - - - - - -
Toronto E10 2 $809,500 $404,750 $404,750 2 1 103% 18
Toronto E11 2 $899,000 $449,500 $449,500 5 2 100% 21
SUMMARY OF EXISTING HOME TRANSACTIONSATTACHED/ROW/TOWNHOUSE, JANUARY 2015

Industrial Leasing
July 2010 Page 3
Toronto Real Estate Board
Market Watch, January 2015
ALL TREB AREAS
Sales1 Dollar Volume1 Average Price1 Median Price1 New Listings2 Active Listings3 Avg. SP/LP4 Avg. DOM5
TREB Total 5 $2,250,500 $450,100 $542,000 26 30 97% 48- - - - - - - -
Halton Region - - - - 3 3 - -
Burlington - - - - - - - -
Halton Hills - - - - - - - -
Milton - - - - - - - -
Oakville - - - - 3 3 - -- - - - - - - -
Peel Region - - - - 3 3 - -
Brampton - - - - 1 1 - -
Caledon - - - - - - - -
Mississauga - - - - 2 2 - -- - - - - - - -
City of Toronto 5 $2,250,500 $450,100 $542,000 19 23 97% 48
- - - - - - - -
York Region - - - - 1 1 - -
Aurora - - - - - - - -
E. Gwillimbury - - - - - - - -
Georgina - - - - - - - -
King - - - - - - - -
Markham - - - - 1 1 - -
Newmarket - - - - - - - -
Richmond Hill - - - - - - - -
Vaughan - - - - - - - -
Whitchurch-Stouffville - - - - - - - -- - - - - - - -
Durham Region - - - - - - - -
Ajax - - - - - - - -
Brock - - - - - - - -
Clarington - - - - - - - -
Oshawa - - - - - - - -
Pickering - - - - - - - -
Scugog - - - - - - - -
Uxbridge - - - - - - - -
Whitby - - - - - - - -- - - - - - - -
Dufferin County - - - - - - - -
Orangeville - - - - - - - -- - - - - - - -
Simcoe County - - - - - - - -
Adjala-Tosorontio - - - - - - - -
Bradford West Gwillimbury - - - - - - - -
Essa - - - - - - - -
Innisfil - - - - - - - -
New Tecumseth - - - - - - - -
SUMMARY OF EXISTING HOME TRANSACTIONSCO-OP APARTMENT, JANUARY 2015
! TURN PAGE FOR CITY OF TORONTO
TABLES OR CLICK HERE:
19

Industrial Leasing
July 2010 Page 3
Toronto Real Estate Board
Market Watch, January 2015 20
CITY OF TORONTO MUNICIPAL BREAKDOWN
Sales1 Dollar Volume1 Average Price1 Median Price1 New Listings2 Active Listings3 Avg. SP/LP4 Avg. DOM5
TREB Total 5 $2,250,500 $450,100 $542,000 26 30 97% 48
City of Toronto Total 5 $2,250,500 $450,100 $542,000 19 23 97% 48
Toronto West 2 $291,000 $145,500 $145,500 8 9 97% 20
Toronto W01 - - - - - - - -
Toronto W02 - - - - 1 1 - -
Toronto W03 - - - - - - - -
Toronto W04 - - - - - - - -
Toronto W05 1 $78,000 $78,000 $78,000 3 3 98% 16
Toronto W06 - - - - 2 4 - -
Toronto W07 - - - - 1 1 - -
Toronto W08 1 $213,000 $213,000 $213,000 1 - 97% 23
Toronto W09 - - - - - - - -
Toronto W10 - - - - - - - -
Toronto Central 3 $1,959,500 $653,167 $570,000 10 13 97% 67
Toronto C01 - - - - - - - -
Toronto C02 1 $847,500 $847,500 $847,500 1 1 94% 126
Toronto C03 - - - - 1 2 - -
Toronto C04 - - - - 2 2 - -
Toronto C06 - - - - - - - -
Toronto C07 - - - - - - - -
Toronto C08 - - - - - - - -
Toronto C09 2 $1,112,000 $556,000 $556,000 5 7 99% 38
Toronto C10 - - - - - - - -
Toronto C11 - - - - - - - -
Toronto C12 - - - - - - - -
Toronto C13 - - - - - - - -
Toronto C14 - - - - - - - -
Toronto C15 - - - - 1 1 - -
Toronto East - - - - 1 1 - -
Toronto E01 - - - - - - - -
Toronto E02 - - - - 1 1 - -
Toronto E03 - - - - - - - -
Toronto E04 - - - - - - - -
Toronto E05 - - - - - - - -
Toronto E06 - - - - - - - -
Toronto E07 - - - - - - - -
Toronto E08 - - - - - - - -
Toronto E09 - - - - - - - -
Toronto E10 - - - - - - - -
Toronto E11 - - - - - - - -
SUMMARY OF EXISTING HOME TRANSACTIONSCO-OP APARTMENT, JANUARY 2015

Industrial Leasing
July 2010 Page 3
Toronto Real Estate Board
Market Watch, January 2015
ALL TREB AREAS
Sales1 Dollar Volume1 Average Price1 Median Price1 New Listings2 Active Listings3 Avg. SP/LP4 Avg. DOM5
TREB Total 4 $2,817,500 $704,375 $563,750 8 16 95% 18- - - - - - - -
Halton Region 1 $1,300,000 $1,300,000 $1,300,000 1 - 91% 8
Burlington - - - - - - - -
Halton Hills - - - - - - - -
Milton - - - - - - - -
Oakville 1 $1,300,000 $1,300,000 $1,300,000 1 - 91% 8- - - - - - - -
Peel Region 2 $1,127,500 $563,750 $563,750 1 2 98% 22
Brampton 1 $472,500 $472,500 $472,500 - 1 95% 36
Caledon - - - - - - - -
Mississauga 1 $655,000 $655,000 $655,000 1 1 101% 8- - - - - - - -
City of Toronto - - - - 1 1 - -
- - - - - - - -
York Region - - - - - 1 - -
Aurora - - - - - 1 - -
E. Gwillimbury - - - - - - - -
Georgina - - - - - - - -
King - - - - - - - -
Markham - - - - - - - -
Newmarket - - - - - - - -
Richmond Hill - - - - - - - -
Vaughan - - - - - - - -
Whitchurch-Stouffville - - - - - - - -- - - - - - - -
Durham Region - - - - - - - -
Ajax - - - - - - - -
Brock - - - - - - - -
Clarington - - - - - - - -
Oshawa - - - - - - - -
Pickering - - - - - - - -
Scugog - - - - - - - -
Uxbridge - - - - - - - -
Whitby - - - - - - - -- - - - - - - -
Dufferin County - - - - - - - -
Orangeville - - - - - - - -- - - - - - - -
Simcoe County 1 $390,000 $390,000 $390,000 5 12 98% 21
Adjala-Tosorontio - - - - - - - -
Bradford West Gwillimbury - - - - - - - -
Essa - - - - - - - -
Innisfil - - - - - - - -
New Tecumseth 1 $390,000 $390,000 $390,000 5 12 98% 21
! TURN PAGE FOR CITY OF TORONTO
TABLES OR CLICK HERE:
SUMMARY OF EXISTING HOME TRANSACTIONSDETACHED CONDOMINIUM, JANUARY 2015
21

Industrial Leasing
July 2010 Page 3
Toronto Real Estate Board
Market Watch, January 2015 22
CITY OF TORONTO MUNICIPAL BREAKDOWN
Sales1 Dollar Volume1 Average Price1 Median Price1 New Listings2 Active Listings3 Avg. SP/LP4 Avg. DOM5
TREB Total 4 $2,817,500 $704,375 $563,750 8 16 95% 18
City of Toronto Total - - - - 1 1 - -
Toronto West - - - - - - - -
Toronto W01 - - - - - - - -
Toronto W02 - - - - - - - -
Toronto W03 - - - - - - - -
Toronto W04 - - - - - - - -
Toronto W05 - - - - - - - -
Toronto W06 - - - - - - - -
Toronto W07 - - - - - - - -
Toronto W08 - - - - - - - -
Toronto W09 - - - - - - - -
Toronto W10 - - - - - - - -
Toronto Central - - - - 1 1 - -
Toronto C01 - - - - - - - -
Toronto C02 - - - - - - - -
Toronto C03 - - - - - - - -
Toronto C04 - - - - - - - -
Toronto C06 - - - - - - - -
Toronto C07 - - - - - - - -
Toronto C08 - - - - - - - -
Toronto C09 - - - - - - - -
Toronto C10 - - - - - - - -
Toronto C11 - - - - - - - -
Toronto C12 - - - - 1 1 - -
Toronto C13 - - - - - - - -
Toronto C14 - - - - - - - -
Toronto C15 - - - - - - - -
Toronto East - - - - - - - -
Toronto E01 - - - - - - - -
Toronto E02 - - - - - - - -
Toronto E03 - - - - - - - -
Toronto E04 - - - - - - - -
Toronto E05 - - - - - - - -
Toronto E06 - - - - - - - -
Toronto E07 - - - - - - - -
Toronto E08 - - - - - - - -
Toronto E09 - - - - - - - -
Toronto E10 - - - - - - - -
Toronto E11 - - - - - - - -
SUMMARY OF EXISTING HOME TRANSACTIONSDETACHED CONDOMINIUM, JANUARY 2015
Industrial Leasing
July 2010 Page 3
Toronto Real Estate Board
Market Watch, January 2015 23
ALL TREB AREAS
Sales1 Dollar Volume1 Average Price1 Median Price1 New Listings2 Active Listings3 Avg. SP/LP4 Avg. DOM5
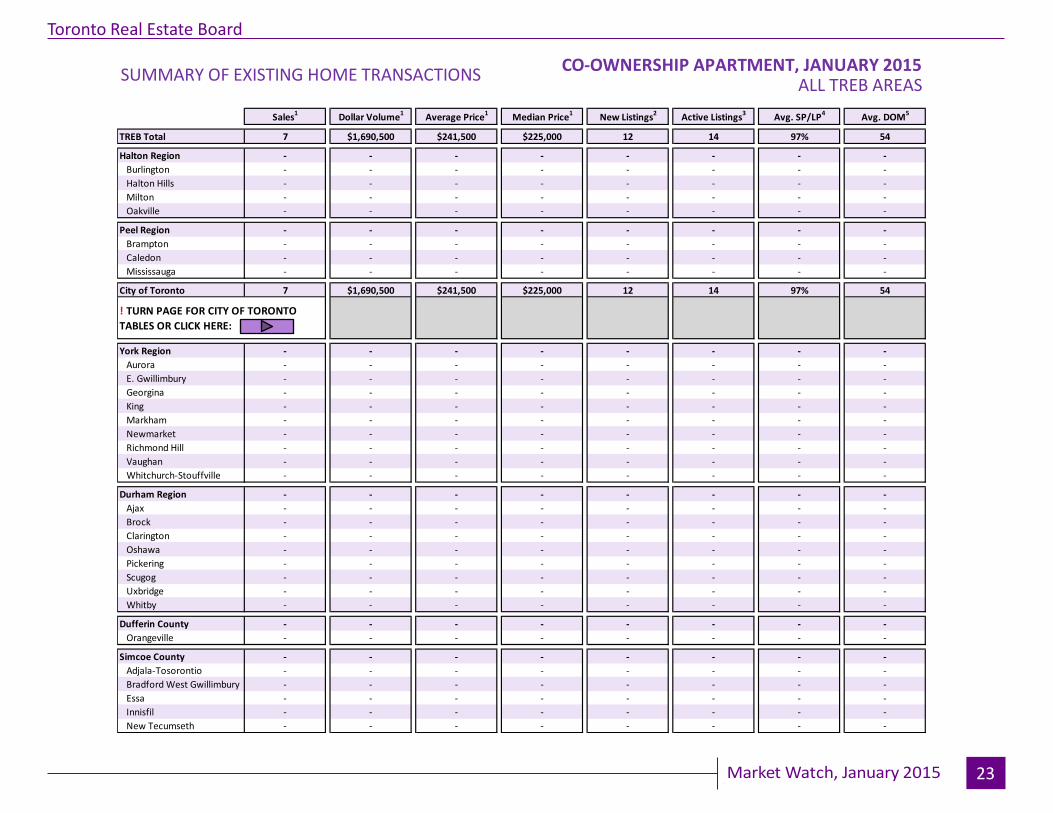
TREB Total 7 $1,690,500 $241,500 $225,000 12 14 97% 54- - - - - - - -
Halton Region - - - - - - - -
Burlington - - - - - - - -
Halton Hills - - - - - - - -
Milton - - - - - - - -
Oakville - - - - - - - -- - - - - - - -
Peel Region - - - - - - - -
Brampton - - - - - - - -
Caledon - - - - - - - -
Mississauga - - - - - - - -- - - - - - - -
City of Toronto 7 $1,690,500 $241,500 $225,000 12 14 97% 54
- - - - - - - -
York Region - - - - - - - -
Aurora - - - - - - - -
E. Gwillimbury - - - - - - - -
Georgina - - - - - - - -
King - - - - - - - -
Markham - - - - - - - -
Newmarket - - - - - - - -
Richmond Hill - - - - - - - -
Vaughan - - - - - - - -
Whitchurch-Stouffville - - - - - - - -- - - - - - - -
Durham Region - - - - - - - -
Ajax - - - - - - - -
Brock - - - - - - - -
Clarington - - - - - - - -
Oshawa - - - - - - - -
Pickering - - - - - - - -
Scugog - - - - - - - -
Uxbridge - - - - - - - -
Whitby - - - - - - - -- - - - - - - -
Dufferin County - - - - - - - -
Orangeville - - - - - - - -- - - - - - - -
Simcoe County - - - - - - - -
Adjala-Tosorontio - - - - - - - -
Bradford West Gwillimbury - - - - - - - -
Essa - - - - - - - -
Innisfil - - - - - - - -
New Tecumseth - - - - - - - -
! TURN PAGE FOR CITY OF TORONTO
TABLES OR CLICK HERE:
SUMMARY OF EXISTING HOME TRANSACTIONSCO-OWNERSHIP APARTMENT, JANUARY 2015

Industrial Leasing
July 2010 Page 3
Toronto Real Estate Board
Market Watch, January 2015 24
CITY OF TORONTO MUNICIPAL BREAKDOWN
Sales1 Dollar Volume1 Average Price1 Median Price1 New Listings2 Active Listings3 Avg. SP/LP4 Avg. DOM5
TREB Total 7 $1,690,500 $241,500 $225,000 12 14 97% 54
City of Toronto Total 7 $1,690,500 $241,500 $225,000 12 14 97% 54
Toronto West 3 $619,500 $206,500 $175,000 1 1 95% 38
Toronto W01 1 $175,000 $175,000 $175,000 - - 88% 32
Toronto W02 - - - - - - - -
Toronto W03 - - - - - - - -
Toronto W04 - - - - - - - -
Toronto W05 1 $92,500 $92,500 $92,500 1 1 93% 30
Toronto W06 1 $352,000 $352,000 $352,000 - - 101% 53
Toronto W07 - - - - - - - -
Toronto W08 - - - - - - - -
Toronto W09 - - - - - - - -
Toronto W10 - - - - - - - -
Toronto Central 4 $1,071,000 $267,750 $255,000 11 13 97% 66
Toronto C01 - - - - - - - -
Toronto C02 1 $285,000 $285,000 $285,000 - - 95% 175
Toronto C03 - - - - 2 2 - -
Toronto C04 1 $210,000 $210,000 $210,000 4 5 95% 72
Toronto C06 - - - - - - - -
Toronto C07 - - - - - - - -
Toronto C08 1 $225,000 $225,000 $225,000 1 3 113% 4
Toronto C09 - - - - 1 1 - -
Toronto C10 1 $351,000 $351,000 $351,000 1 - 93% 12
Toronto C11 - - - - - - - -
Toronto C12 - - - - - - - -
Toronto C13 - - - - 1 1 - -
Toronto C14 - - - - 1 1 - -
Toronto C15 - - - - - - - -
Toronto East - - - - - - - -
Toronto E01 - - - - - - - -
Toronto E02 - - - - - - - -
Toronto E03 - - - - - - - -
Toronto E04 - - - - - - - -
Toronto E05 - - - - - - - -
Toronto E06 - - - - - - - -
Toronto E07 - - - - - - - -
Toronto E08 - - - - - - - -
Toronto E09 - - - - - - - -
Toronto E10 - - - - - - - -
Toronto E11 - - - - - - - -
SUMMARY OF EXISTING HOME TRANSACTIONSCO-OWNERSHIP APARTMENT, JANUARY 2015

Industrial Leasing
July 2010 Page 3
Toronto Real Estate Board
Market Watch, January 2015 25
FOCUS ON THE MLS® HOME PRICE INDEX INDEX AND BENCHMARK PRICE, JANUARY 2015ALL TREB AREAS
Index Benchmark Yr./Yr. % Chg. Index Benchmark Yr./Yr. % Chg. Index Benchmark Yr./Yr. % Chg. Index Benchmark Yr./Yr. % Chg. Index Benchmark Yr./Yr. % Chg.
TREB Total 171.1 $522,200 7.47% 173.4 $645,200 8.44% 178.5 $504,700 8.38% 166.8 $364,900 6.99% 156.7 $315,000 3.91%
Halton Region 178.9 $586,000 7.45% 176.9 $656,500 7.21% 178.9 $464,300 7.25% 169.8 $334,800 4.17% - - -
Burlington 182.6 $548,100 9.60% 181.3 $638,600 7.34% 183.7 $437,900 14.74% 174.3 $345,600 3.26% - - -
Halton Hills 164.1 $477,800 4.92% 163.1 $521,800 4.42% 173.3 $426,800 5.09% 159.3 $287,200 2.84% - - -
Milton 169.6 $468,300 5.28% 160.0 $554,800 5.06% 172.6 $430,900 5.31% - - - - - -
Oakville 187.4 $691,000 8.07% 186.7 $773,800 7.92% 188.1 $509,200 8.60% 172.5 $380,900 4.04% - - -
Peel Region 162.6 $445,100 6.55% 164.2 $556,500 7.04% 166.3 $424,300 7.64% 168.3 $348,300 6.32% 142.3 $245,200 2.08%
Brampton 156.6 $399,600 7.63% 156.4 $457,500 7.27% 158.6 $373,600 8.11% 154.6 $287,100 7.21% 129.9 $203,300 3.26%
Caledon 150.3 $536,400 4.01% 150.4 $553,400 3.58% 165.4 $408,900 4.82% - - - - - -
Mississauga 168.4 $471,200 6.11% 176.0 $657,100 7.38% 175.5 $479,400 7.54% 172.8 $371,100 6.21% 144.6 $253,600 1.97%
City of Toronto 173.7 $569,500 6.37% 181.6 $787,300 7.84% 188.1 $625,000 7.42% 170.9 $413,100 7.01% 159.8 $330,200 3.97%
York Region 185.3 $635,900 10.23% 186.8 $734,400 10.93% 190.1 $550,800 10.72% 166.7 $423,600 7.48% 155.0 $336,300 3.40%
Aurora 174.0 $560,100 7.67% 173.9 $646,100 7.48% 179.6 $464,400 9.18% 142.1 $359,900 1.50% 153.3 $317,000 3.72%
E. Gwillimbury 158.2 $512,800 3.94% 158.3 $521,700 3.26% 171.9 $364,000 7.04% - - - - - -
Georgina 159.6 $331,200 5.49% 166.1 $342,200 5.86% 170.7 $336,400 7.16% - - - - - -
King 172.6 $731,700 9.31% 174.2 $735,000 9.42% - - - - - - - - -
Markham 193.7 $666,600 11.71% 199.0 $818,000 12.49% 197.9 $589,400 12.76% 171.1 $425,100 6.21% 158.5 $365,400 1.93%
Newmarket 166.2 $490,100 8.91% 164.0 $552,100 9.85% 171.7 $404,900 9.22% 168.6 $340,400 7.39% 154.3 $259,900 1.18%
Richmond Hill 194.3 $704,600 11.16% 206.6 $878,200 12.90% 200.2 $607,100 10.98% 162.5 $454,800 14.04% 149.1 $310,600 -0.13%
Vaughan 182.5 $659,700 9.15% 176.0 $732,600 9.59% 187.9 $571,700 8.93% 174.2 $476,000 6.41% 156.4 $347,100 8.84%
Whitchurch-Stouffville 187.6 $707,300 12.67% 187.3 $718,700 12.09% 167.0 $458,700 11.93% - - - - - -
Durham Region 154.7 $363,900 9.56% 153.2 $399,300 9.27% 160.3 $321,200 10.17% 146.1 $239,600 10.68% 149.7 $269,100 15.60%
Ajax 161.4 $398,900 8.25% 160.6 $430,100 9.55% 168.5 $362,400 7.87% 151.0 $276,000 12.18% 145.0 $246,200 14.99%
Brock 130.8 $247,200 2.43% 131.5 $249,000 2.73% 0.0 $0 0.00% - - - - - -
Clarington 149.0 $315,300 7.66% 140.5 $337,700 3.77% 153.0 $292,100 8.97% 165.2 $295,700 9.48% 148.1 $209,600 14.72%
Oshawa 149.8 $286,900 10.39% 148.2 $315,700 9.37% 155.6 $260,700 11.38% 131.6 $176,100 11.62% 148.3 $200,100 13.47%
Pickering 161.8 $437,500 10.82% 162.9 $509,000 10.29% 166.8 $388,800 11.20% 155.6 $279,300 10.59% 154.8 $303,100 16.65%
Scugog 151.0 $391,900 6.71% 155.2 $399,600 6.74% 141.2 $295,500 3.37% - - - - - -
Uxbridge 144.5 $441,800 4.11% 144.8 $448,500 4.32% 140.6 $345,000 1.66% - - - - - -
Whitby 156.3 $407,800 11.40% 158.3 $454,700 13.15% 159.5 $351,400 12.01% 146.0 $267,700 7.99% 146.6 $286,000 15.16%
Dufferin County 152.8 $350,200 3.31% 159.6 $363,700 4.52% 150.3 $281,700 2.04% - - - - - -
Orangeville 152.8 $350,200 3.31% 159.6 $363,700 4.52% 150.3 $281,700 2.04% - - - - - -
Simcoe County 149.0 $317,700 4.86% 144.6 $320,400 4.78% 155.1 $297,700 4.09% - - - - - -
Adjala-Tosorontio 123.7 $439,000 1.14% 123.7 $439,000 1.14% - - - - - - - - -
Bradford West Gwillimbury 164.8 $409,600 4.70% 149.1 $456,700 4.78% 169.4 $352,200 4.37% - - - - - -
Essa 144.8 $339,200 1.97% 142.5 $360,300 1.93% 145.6 $248,000 0.83% - - - - - -
Innisfil 148.3 $274,300 6.61% 148.3 $274,800 5.93% 162.0 $252,000 9.91% - - - - - -
New Tecumseth 134.8 $311,400 1.81% 131.3 $338,200 1.70% 141.3 $269,800 2.24% - - - - - -
Townhouse Apartment
! TURN PAGE FOR CITY OF TORONTO
TABLES OR CLICK HERE:
Composite Single-Family Detached Single-Family Attached
CLICK HERE FOR MORE BACKGROUND INFORMATION ON THE MLS® HPI

Industrial Leasing
July 2010 Page 3
Toronto Real Estate Board
Market Watch, January 2015 26
FOCUS ON THE MLS® HOME PRICE INDEX INDEX AND BENCHMARK PRICE, JANUARY 2015CITY OF TORONTO
Index Benchmark Yr./Yr. % Chg. Index Benchmark Yr./Yr. % Chg. Index Benchmark Yr./Yr. % Chg. Index Benchmark Yr./Yr. % Chg. Index Benchmark Yr./Yr. % Chg.
TREB Total 171.1 $522,200 7.47% 173.4 $645,200 8.44% 178.5 $504,700 8.38% 166.8 $364,900 6.99% 156.7 $315,000 3.91%
City of Toronto 173.7 $569,500 6.37% 181.6 $787,300 7.84% 188.1 $625,000 7.42% 170.9 $413,100 7.01% 159.8 $330,200 3.97%
Toronto W01 159.8 $651,900 0.00% 164.8 $849,400 2.04% 175.6 $677,500 1.80% 201.6 $415,100 -1.66% 139.9 $326,300 -1.20%
Toronto W02 188.7 $680,000 2.06% 196.2 $805,300 7.10% 215.8 $661,100 1.79% 148.8 $410,300 5.31% 138.8 $563,000 3.12%
Toronto W03 184.8 $479,200 6.33% 187.5 $509,900 6.05% 192.7 $493,700 6.88% - - - 135.0 $257,400 2.66%
Toronto W04 162.1 $424,600 6.71% 170.5 $538,000 8.05% 172.6 $501,900 11.43% 138.7 $337,000 -0.07% 140.1 $206,400 1.60%
Toronto W05 147.1 $350,000 1.24% 162.7 $542,400 5.31% 151.1 $441,700 4.28% 147.3 $242,300 -4.47% 117.9 $154,800 -7.89%
Toronto W06 159.0 $463,400 8.02% 187.4 $594,800 5.52% 160.1 $485,400 5.96% 161.5 $475,800 7.38% 133.9 $334,400 11.49%
Toronto W07 170.0 $724,500 6.12% 176.3 $762,000 5.44% 168.0 $688,900 9.09% 136.7 $502,500 10.33% 108.1 $438,300 1.69%
Toronto W08 150.9 $613,900 4.72% 164.5 $860,400 5.86% 170.0 $645,300 4.17% 147.0 $359,300 9.29% 135.8 $273,400 3.43%
Toronto W09 162.8 $418,800 14.41% 174.1 $651,300 7.74% 165.7 $464,500 9.45% 157.0 $405,800 7.39% 143.6 $184,100 28.90%
Toronto W10 153.4 $356,000 9.26% 166.8 $490,800 7.75% 161.3 $436,200 6.61% 143.3 $258,200 9.81% 131.5 $200,800 10.69%
Toronto C01 187.1 $463,700 3.43% 200.8 $708,800 5.02% 212.3 $739,300 5.94% 182.3 $543,000 4.83% 182.5 $380,000 2.64%
Toronto C02 188.6 $895,500 7.59% 176.0 $1,395,000 12.53% 198.4 $1,043,900 12.22% 189.9 $888,000 14.40% 183.6 $512,000 2.23%
Toronto C03 192.9 $992,800 8.31% 188.3 $1,134,800 7.17% 194.6 $720,400 4.96% - - - 205.1 $541,800 18.01%
Toronto C04 168.1 $1,041,500 6.06% 174.1 $1,217,000 6.61% 176.9 $845,700 7.87% 154.6 $577,600 7.81% 139.6 $331,900 2.27%
Toronto C06 180.4 $719,700 4.76% 189.0 $809,000 6.06% 162.1 $605,500 2.34% 0.0 $0 0.00% 170.3 $376,600 3.59%
Toronto C07 170.4 $585,200 4.48% 200.3 $916,900 8.86% 167.8 $599,500 5.01% 143.4 $421,000 7.58% 148.0 $348,600 -1.53%
Toronto C08 176.9 $455,500 7.28% 156.9 $487,300 9.03% 189.6 $790,500 15.75% 179.2 $543,500 -1.43% 176.6 $389,500 6.58%
Toronto C09 128.0 $950,500 1.11% 121.1 $1,521,200 2.11% 142.7 $1,161,200 1.64% 172.6 $890,900 10.15% 129.9 $430,400 -0.61%
Toronto C10 188.9 $736,900 6.00% 178.3 $1,094,200 12.56% 179.7 $887,500 13.02% 228.6 $524,200 10.97% 193.8 $464,300 2.81%
Toronto C11 171.2 $613,400 11.68% 167.4 $1,122,500 6.56% 192.0 $850,900 5.73% 111.9 $178,500 -0.27% 175.0 $249,100 17.06%
Toronto C12 162.3 $1,390,900 8.42% 154.4 $1,659,400 9.89% 178.8 $767,500 10.44% 176.8 $598,900 8.60% 180.3 $567,100 3.86%
Toronto C13 165.4 $610,200 9.68% 178.5 $956,400 11.56% 167.8 $538,400 10.98% 166.3 $473,600 11.91% 148.4 $293,600 5.62%
Toronto C14 175.8 $597,400 3.05% 215.1 $1,167,000 14.11% 195.2 $952,300 7.37% 210.3 $710,600 -1.45% 157.0 $394,800 -2.36%
Toronto C15 176.1 $588,800 9.51% 206.1 $966,100 13.74% 189.9 $618,200 16.00% 185.6 $457,300 6.85% 142.2 $332,300 3.42%
Toronto E01 208.7 $648,600 9.32% 208.1 $702,900 12.85% 220.2 $694,400 11.78% 201.7 $407,900 -6.71% 186.5 $442,400 -1.43%
Toronto E02 192.2 $716,500 6.72% 176.6 $777,800 5.62% 201.9 $675,000 7.85% 195.5 $626,400 2.36% 187.1 $512,700 7.96%
Toronto E03 179.1 $551,700 9.88% 181.6 $610,100 10.06% 181.5 $591,000 10.13% - - - 140.4 $210,000 8.33%
Toronto E04 178.5 $448,100 7.14% 182.5 $538,900 4.46% 171.3 $415,600 0.82% 171.2 $370,000 4.77% 183.8 $278,400 16.48%
Toronto E05 171.7 $459,200 8.88% 193.2 $682,200 6.98% 189.0 $520,500 6.84% 172.0 $373,900 11.76% 145.0 $284,900 8.61%
Toronto E06 183.4 $517,900 3.85% 183.9 $525,600 3.37% 189.3 $450,400 2.16% - - - 175.6 $387,200 9.54%
Toronto E07 184.9 $456,200 8.96% 206.4 $675,500 10.61% 198.1 $517,800 12.75% 181.4 $393,000 11.08% 160.4 $274,600 6.08%
Toronto E08 167.5 $411,400 8.84% 178.5 $557,200 5.25% 162.3 $416,900 3.31% 167.8 $342,500 5.80% 145.2 $231,800 21.51%
Toronto E09 165.8 $400,300 8.51% 181.5 $516,500 9.27% 163.5 $401,300 3.81% 167.1 $307,900 15.32% 147.7 $277,000 6.87%
Toronto E10 182.9 $517,800 15.32% 183.2 $586,400 13.30% 178.7 $464,800 11.69% 193.1 $338,200 20.91% 138.3 $222,900 21.53%
Toronto E11 164.6 $362,900 6.95% 182.0 $505,400 5.51% 176.7 $400,600 5.37% 138.4 $272,000 18.59% 136.6 $203,900 6.30%
ApartmentComposite Single-Family Detached Single-Family Attached Townhouse
CLICK HERE FOR MORE BACKGROUND INFORMATION ON THE MLS® HPI
July 2010 Page 3
Toronto Real Estate Board
Market Watch, January 2015 27
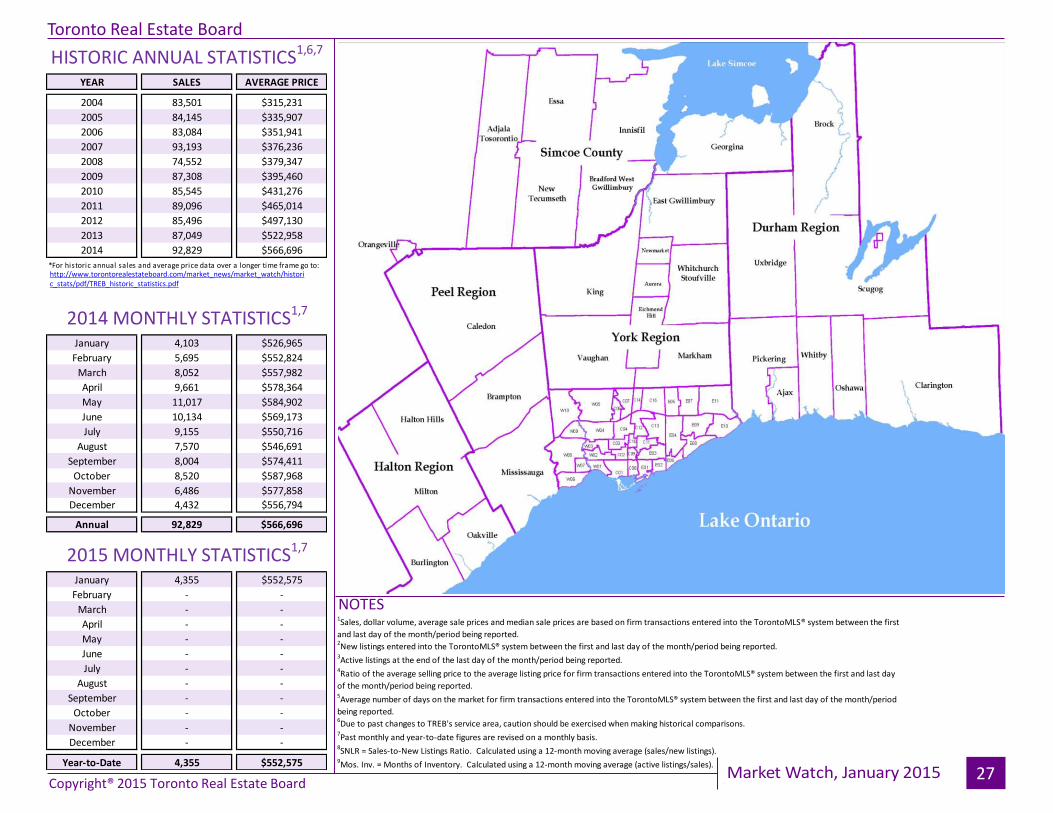
YEAR SALES AVERAGE PRICE
2004 83,501 $315,231
2005 84,145 $335,907
2006 83,084 $351,941
2007 93,193 $376,236
2008 74,552 $379,347
2009 87,308 $395,460
2010 85,545 $431,276
2011 89,096 $465,014
2012 85,496 $497,130
2013 87,049 $522,958
2014 92,829 $566,696
January 4,103 $526,965
February 5,695 $552,824
March 8,052 $557,982
April 9,661 $578,364
May 11,017 $584,902
June 10,134 $569,173
July 9,155 $550,716
August 7,570 $546,691
September 8,004 $574,411
October 8,520 $587,968
November 6,486 $577,858
December 4,432 $556,794
Annual 92,829 $566,696
January 4,355 $552,575
February - -
March - -
April - -
May - -
June - -
July - -
August - -
September - -
October - -
November - -
December - -
Year-to-Date 4,355 $552,575
HISTORIC ANNUAL STATISTICS1,6,7
2015 MONTHLY STATISTICS1,7
2014 MONTHLY STATISTICS1,7
*For historic annual sales and average price data over a longer time frame go to:http://www.torontorealestateboard.com/market_news/market_watch/historic_stats/pdf/TREB_historic_statistics.pdf
NOTES
8SNLR = Sales-to-New Listings Ratio. Calculated using a 12-month moving average (sales/new listings).
9Mos. Inv. = Months of Inventory. Calculated using a 12-month moving average (active listings/sales).
7Past monthly and year-to-date figures are revised on a monthly basis.
1Sales, dollar volume, average sale prices and median sale prices are based on firm transactions entered into the TorontoMLS® system between the first
and last day of the month/period being reported.2New listings entered into the TorontoMLS® system between the first and last day of the month/period being reported.
3Active listings at the end of the last day of the month/period being reported.
4Ratio of the average selling price to the average listing price for firm transactions entered into the TorontoMLS® system between the first and last day
of the month/period being reported.5Average number of days on the market for firm transactions entered into the TorontoMLS® system between the first and last day of the month/period
being reported.6Due to past changes to TREB's service area, caution should be exercised when making historical comparisons.
Copyright® 2015 Toronto Real Estate Board