market update - bairdand mid-ap stocks. on the year, mid-ap growth was the best performing style...
TRANSCRIPT
1
WEALTH SOLUTIONS GROUP
Market Update Q4 2019 Review and Outlook
Equity markets rallied in Q4, adding to strong gains for the full year. Growth continued to triumph over value and the US outperformed developed international equities. Fixed income delivered modest returns and the US Treasury yield curve steepened.
The Markets at a Glance
Performance returns are as of 12/31/2019
Q4 Recap
Equity markets rallied in Q4 thanks to an improved economic picture, alleviated trade tensions, and a dovish Federal Reserve. The S&P 500 gained 9.1% during the quarter and ended the year with a return of 31.5%, the highest since 2013. The dominance of growth over value continued this quarter, and investors showed an increased appetite for risk by favoring small-cap over large-cap equities.
International equities also posted solid returns in Q4 as the US dollar weakened. The progress in trade negotiations sparked a resurgence in emerging markets (+11.8%), which outperformed even US stocks. For the full year, international growth outpaced value by over 11%, the largest calendar year deficit for value ever.
The broad US bond market, as measured by the Bloomberg Barclays US Agg Index, returned 0.2% in Q4 and 8.7% for the year. Long-term bonds pared back their lead slightly in Q4, but ended the year with a robust return of 19.6%. Additionally, the US Treasury Yield Curve steep-ened after the Fed’s third rate cut and is no longer inverted, therefore relieving recession fears for now. The 10-Year Treasury yield ended the year at 1.92%.
Asset Manager Research
(414) 298-7359
January 15, 2020
IN THIS ISSUE PAGE 2: 2020 Vision Market Rally Blurry Vision Task of Diversification PAGE 3: EQUITY Markets at a Glance More of the Same Risk-On in International PAGE 4: FIXED INCOME Markets at a Glance Recovery Optimism Credit Delivers Mixed Securitized Per-
formance Munis Outperform
Asset Class Representative Benchmark Q4
Return YTD
Return
US Large Cap S&P 500 9.1% 31.5%
US Small Cap Russell 2000® 9.9% 25.5%
International MSCI EAFE 8.2% 22.0%
Commodities Bloomberg Commodity 4.4% 7.7%
Municipal Bonds BBgBarc. Municipal 0.7% 7.5%
Taxable Bonds BBgBarc. Aggregate 0.2% 8.7%
Cash FTSE 3-Month T-Bills 0.5% 2.3%
2
2020 Vision
Financial markets delivered strong re-turns across all major asset classes in 2019. The S&P 500 Total Return Index was up 31.5% in for the year, the strong-est annual return since 2013. The year began by rebounding from 4Q18’s selloff and ended with a prospective “Phase One” US/China trade deal and massive liquidity injections from the Federal Re-serve.
Is the Market Rally Sustainable?
S&P 500 earnings increased from $161.45 in 2018 to $162.35 in 2019 (+0.6%), while the index’s trailing price-to-earnings multiple expanded from 15.5x to 19.9x (28.4%) according to FACTSET’s most recent estimates. Mr. Market was willing to pay more for the index despite an increase in geopolitical tensions, a slowdown in global growth, and flat corporate earnings. While these headwinds seemed insurmounta-ble at times, the market was buffeted by easier monetary policy. Fed Chairman Powell began the year by emphasizing the Fed’s “patience” with respect to fu-ture federal funds rate hikes. By the end of Q1 the Fed indicated that it would stabilize its balance sheet runoff by the end of the year. This was followed by three cuts to the federal funds rate be-
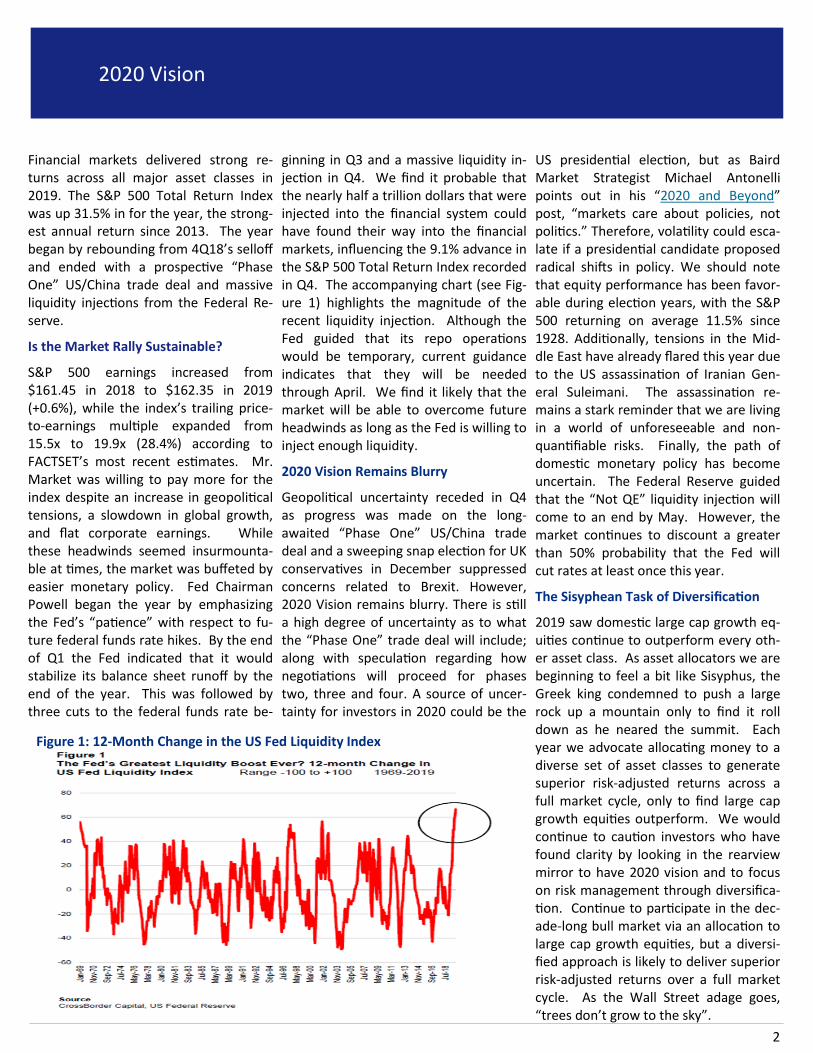
ginning in Q3 and a massive liquidity in-jection in Q4. We find it probable that the nearly half a trillion dollars that were injected into the financial system could have found their way into the financial markets, influencing the 9.1% advance in the S&P 500 Total Return Index recorded in Q4. The accompanying chart (see Fig-ure 1) highlights the magnitude of the recent liquidity injection. Although the Fed guided that its repo operations would be temporary, current guidance indicates that they will be needed through April. We find it likely that the market will be able to overcome future headwinds as long as the Fed is willing to inject enough liquidity.
2020 Vision Remains Blurry
Geopolitical uncertainty receded in Q4 as progress was made on the long-awaited “Phase One” US/China trade deal and a sweeping snap election for UK conservatives in December suppressed concerns related to Brexit. However, 2020 Vision remains blurry. There is still a high degree of uncertainty as to what the “Phase One” trade deal will include; along with speculation regarding how negotiations will proceed for phases two, three and four. A source of uncer-tainty for investors in 2020 could be the
US presidential election, but as Baird Market Strategist Michael Antonelli points out in his “2020 and Beyond” post, “markets care about policies, not politics.” Therefore, volatility could esca-late if a presidential candidate proposed radical shifts in policy. We should note that equity performance has been favor-able during election years, with the S&P 500 returning on average 11.5% since 1928. Additionally, tensions in the Mid-dle East have already flared this year due to the US assassination of Iranian Gen-eral Suleimani. The assassination re-mains a stark reminder that we are living in a world of unforeseeable and non-quantifiable risks. Finally, the path of domestic monetary policy has become uncertain. The Federal Reserve guided that the “Not QE” liquidity injection will come to an end by May. However, the market continues to discount a greater than 50% probability that the Fed will cut rates at least once this year.
The Sisyphean Task of Diversification
2019 saw domestic large cap growth eq-uities continue to outperform every oth-er asset class. As asset allocators we are beginning to feel a bit like Sisyphus, the Greek king condemned to push a large rock up a mountain only to find it roll down as he neared the summit. Each year we advocate allocating money to a diverse set of asset classes to generate superior risk-adjusted returns across a full market cycle, only to find large cap growth equities outperform. We would continue to caution investors who have found clarity by looking in the rearview mirror to have 2020 vision and to focus on risk management through diversifica-tion. Continue to participate in the dec-ade-long bull market via an allocation to large cap growth equities, but a diversi-fied approach is likely to deliver superior risk-adjusted returns over a full market cycle. As the Wall Street adage goes, “trees don’t grow to the sky”.
Figure 1: 12-Month Change in the US Fed Liquidity Index
3
Equity Markets
U.S. Equity Market Benchmarks
Performance returns as of 12/31/2019
Markets at a Glance
Bolstered by an accommodative Federal Reserve, the easing of trade tensions, and a return of pro-risk cyclicality to markets, US stocks capped a historic year with an excellent fourth quarter. The S&P 500 was up 9.1% in Q4, closing 2019 up 31.5%, the second-best calen-dar year return in the last two decades. The quarter was marked by a return of cyclicality to the market, with Technolo-gy, Financials, and Communication Ser-vices among the best performing sectors for both the quarter and the year, while defensive bond proxies underperformed.
More of the Same for US Equities
US Large Cap Growth continued its reign as the top performing equity style with a meteoric 36.4% rise in 2019. Information Technology has been a significant driver of the markets. In 2019 alone, the tech sector returned a whopping 50%, driven by tech behemoths Apple (+89%) and Microsoft (+58%). In contrast, the worst performing sector for the second year in a row was Energy, which returned only 11.8% despite a 34% surge in the price of WTI Crude Oil.
Reviewing the past 1-, 3-, 5-, and 10-year trailing time periods, US large cap growth consistently dominates other categories (see page 4 of the Q4 2019 Rolling Returns Report). Although the
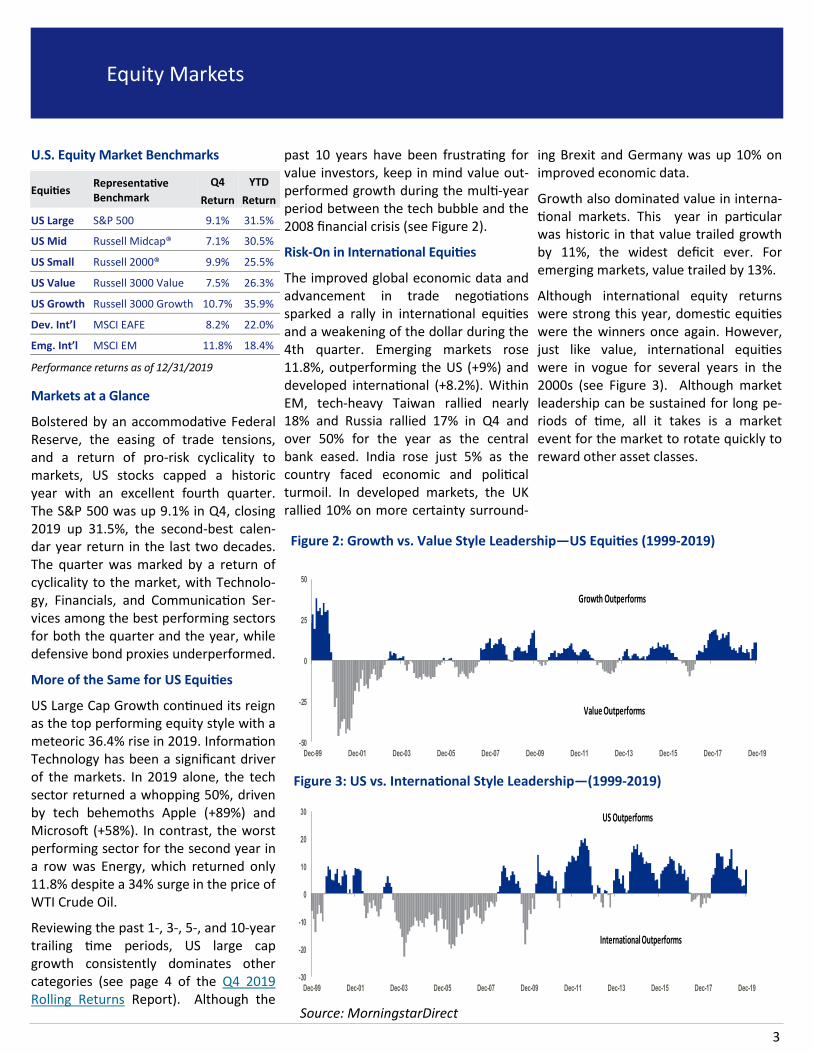
past 10 years have been frustrating for value investors, keep in mind value out-performed growth during the multi-year period between the tech bubble and the 2008 financial crisis (see Figure 2).
Risk-On in International Equities
The improved global economic data and advancement in trade negotiations sparked a rally in international equities and a weakening of the dollar during the 4th quarter. Emerging markets rose 11.8%, outperforming the US (+9%) and developed international (+8.2%). Within EM, tech-heavy Taiwan rallied nearly 18% and Russia rallied 17% in Q4 and over 50% for the year as the central bank eased. India rose just 5% as the country faced economic and political turmoil. In developed markets, the UK rallied 10% on more certainty surround-
ing Brexit and Germany was up 10% on improved economic data.
Growth also dominated value in interna-tional markets. This year in particular was historic in that value trailed growth by 11%, the widest deficit ever. For emerging markets, value trailed by 13%.
Although international equity returns were strong this year, domestic equities were the winners once again. However, just like value, international equities were in vogue for several years in the 2000s (see Figure 3). Although market leadership can be sustained for long pe-riods of time, all it takes is a market event for the market to rotate quickly to reward other asset classes.
Equities Representative Benchmark
Q4 YTD
Return Return
US Large S&P 500 9.1% 31.5%
US Mid Russell Midcap® 7.1% 30.5%
US Small Russell 2000® 9.9% 25.5%
US Value Russell 3000 Value 7.5% 26.3%
US Growth Russell 3000 Growth 10.7% 35.9%
Dev. Int’l MSCI EAFE 8.2% 22.0%
Emg. Int’l MSCI EM 11.8% 18.4%
Figure 2: Growth vs. Value Style Leadership—US Equities (1999-2019)
Source: MorningstarDirect
-50
-25
0
25
50
Dec-99 Dec-01 Dec-03 Dec-05 Dec-07 Dec-09 Dec-11 Dec-13 Dec-15 Dec-17 Dec-19
Growth Outperforms
Value Outperforms
-30
-20
-10
0
10
20
30
Dec-99 Dec-01 Dec-03 Dec-05 Dec-07 Dec-09 Dec-11 Dec-13 Dec-15 Dec-17 Dec-19
US Outperforms
International Outperforms
Figure 3: US vs. International Style Leadership—(1999-2019)
4
Fixed Income
U.S. Fixed Income Benchmarks
Performance returns as of 12/31/2019
Fixed Income at a Glance
The broad US bond market, as measured by the Bloomberg Barclays Agg Index, delivered 0.2% in Q4 as rates bounced off their Labor Day lows and credit con-tinued to outperform. Following the Fed’s actions to calm markets with three rate cuts earlier this year, injections of additional liquidity measures served as an effective backstop for financial mar-kets. During the quarter, investors saw the impact of easy monetary policy as global growth expectations and econom-ic data bottomed and reversed course, increasing optimism and market senti-ment. The improving economic and infla-tion picture lifted rates and steepened the US Treasury curve. Demand for US Treasuries waned, pushing the 10-Yr Treasury yield up to 1.92%. Concerns of an inverted yield curve were put to rest during the quarter as increased growth and inflation expectations lifted long dated interest rates.
Optimism on Global Recovery
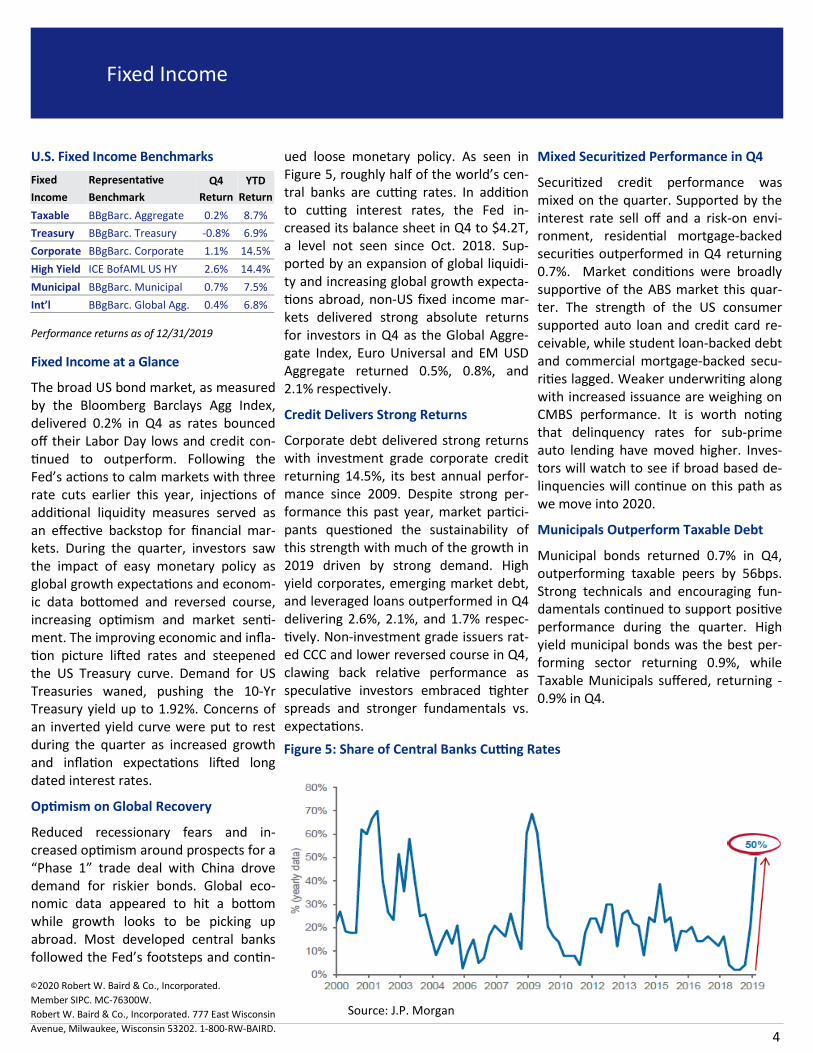
Reduced recessionary fears and in-creased optimism around prospects for a “Phase 1” trade deal with China drove demand for riskier bonds. Global eco-nomic data appeared to hit a bottom while growth looks to be picking up abroad. Most developed central banks followed the Fed’s footsteps and contin-
ued loose monetary policy. As seen in Figure 5, roughly half of the world’s cen-tral banks are cutting rates. In addition to cutting interest rates, the Fed in-creased its balance sheet in Q4 to $4.2T, a level not seen since Oct. 2018. Sup-ported by an expansion of global liquidi-ty and increasing global growth expecta-tions abroad, non-US fixed income mar-kets delivered strong absolute returns for investors in Q4 as the Global Aggre-gate Index, Euro Universal and EM USD Aggregate returned 0.5%, 0.8%, and 2.1% respectively.
Credit Delivers Strong Returns
Corporate debt delivered strong returns with investment grade corporate credit returning 14.5%, its best annual perfor-mance since 2009. Despite strong per-formance this past year, market partici-pants questioned the sustainability of this strength with much of the growth in 2019 driven by strong demand. High yield corporates, emerging market debt, and leveraged loans outperformed in Q4 delivering 2.6%, 2.1%, and 1.7% respec-tively. Non-investment grade issuers rat-ed CCC and lower reversed course in Q4, clawing back relative performance as speculative investors embraced tighter spreads and stronger fundamentals vs. expectations.
Mixed Securitized Performance in Q4
Securitized credit performance was mixed on the quarter. Supported by the interest rate sell off and a risk-on envi-ronment, residential mortgage-backed securities outperformed in Q4 returning 0.7%. Market conditions were broadly supportive of the ABS market this quar-ter. The strength of the US consumer supported auto loan and credit card re-ceivable, while student loan-backed debt and commercial mortgage-backed secu-rities lagged. Weaker underwriting along with increased issuance are weighing on CMBS performance. It is worth noting that delinquency rates for sub-prime auto lending have moved higher. Inves-tors will watch to see if broad based de-linquencies will continue on this path as we move into 2020.
Municipals Outperform Taxable Debt
Municipal bonds returned 0.7% in Q4, outperforming taxable peers by 56bps. Strong technicals and encouraging fun-damentals continued to support positive performance during the quarter. High yield municipal bonds was the best per-forming sector returning 0.9%, while Taxable Municipals suffered, returning -0.9% in Q4.
Fixed
Income
Representative
Benchmark
Q4 YTD
Return Return
Taxable BBgBarc. Aggregate 0.2% 8.7%
Treasury BBgBarc. Treasury -0.8% 6.9%
Corporate BBgBarc. Corporate 1.1% 14.5%
High Yield ICE BofAML US HY 2.6% 14.4%
Municipal BBgBarc. Municipal 0.7% 7.5%
Int’l BBgBarc. Global Agg. 0.4% 6.8%
©2020 Robert W. Baird & Co., Incorporated.
Member SIPC. MC-76300W.
Robert W. Baird & Co., Incorporated. 777 East Wisconsin
Avenue, Milwaukee, Wisconsin 53202. 1-800-RW-BAIRD.
Figure 5: Share of Central Banks Cutting Rates
Source: J.P. Morgan

5
Appendix Definitions and Disclosures
Benchmark and Asset Class Definitions S&P 500 Index (Large Cap / U.S. Stocks): A representative sample of 500 leading compa-nies in leading industries of the U.S. econo-my. These are equity securities of large capi-talization (generally $7 billion plus market cap) companies having growth and value characteristics. Russell 3000® Growth Index (All Cap Growth / Growth Stocks): Measures the performance of the 3,000 largest U.S. com-panies based on total market capitalization with higher price-to-book ratios and higher forecasted growth values. Russell 3000® Value Index (All Cap Value / Value Stocks): Measures the performance of the 3,000 largest U.S. companies based on total market capitalization with lower price-to-book ratios and lower forecasted growth values. Russell 1000® Growth Index (Large Growth): Measures the performance of those Russell 1000® Index companies with higher price-to-book ratios and higher forecasted growth values. These are equity securities of large capitalization ($7 billion plus market cap) companies having growth stock characteris-tics (high price to earnings, high return on equity and low dividend yield. Russell 1000® Value Index (Large Value): Measures the performance of those Russell 1000® Index companies with lower price-to-book ratios and lower forecasted growth values. These are equity securities of large capitalization ($7 billion plus market cap) companies having value stock characteristics (low forecasted price-to-earnings ratio, low price-to-book ratio, high dividend yield). Russell Midcap® Index (Mid Cap / Mid Core): Measures the performance of the 800 small-est companies of the Russell 1000® Index, which represent approximately 31% of the total market capitalization of the Russell 1000® Index. These are equity securities of middle capitalization ($2-7 billion plus mar-ket cap) companies having growth and value characteristics. Russell 2000® Index (Small Cap / Small Core): Measures the performance of the 2,000 smallest companies in the Russell
3000® Index, which represent approximately 10% of the total market capitalization of the Russell 3000® Index. These are equity securi-ties of small capitalization (<$2 billion plus market cap) companies having growth and value characteristics. Russell Micro Cap Index (Micro Cap): Measures the performance of the 1,000 smallest companies in the Russell 2000® In-dex, which represent approximately 3% of the total market capitalization of the Russell 3000® Index. MSCI EAFE Index Net (International / Devel-oped Markets): A free float-adjusted market capitalization index that is designed to meas-ure the equity market performance of devel-oped markets, excluding the US & Canada. As of May 27, 2010 the MSCI EAFE Index consisted of the following 22 developed mar-ket country indices: Australia, Austria, Bel-gium, Denmark, Finland, France, Germany, Greece, Hong Kong, Ireland, Israel, Italy, Ja-pan, the Netherlands, New Zealand, Norway, Portugal, Singapore, Spain, Sweden, Switzer-land, and the United Kingdom. FTSE 3-month T-bill Index (Cash): This index measures monthly return equivalents of yield averages that are not marked to mar-ket. It consists of the last one-month and three-month Treasury bill issues, respective-ly. Bloomberg Commodity Index (Commodities): Composed of commodities traded on U.S. exchanges, with the exception of aluminum, nickel and zinc, which trade on the London Metal Exchange (LME). Sub-indices include Petroleum, Grains, Industrial Metals, Livestock, Precious Metals, and Softs
MSCI Emerging Markets Index Net (Emerging Markets): A free float-adjusted market capitalization index that is designed to measure equity market performance of emerging markets. As of May 27, 2010 the MSCI Emerging Markets Index consisted of the following 21 emerging market country indices. MSCI Country Indices (Country-Specific Mar-kets): To construct an MSCI Country Index, every listed security in the market is identi-fied. Securities are free float adjusted, classi-
fied in accordance with the Global Industry Classification Standard (GICS®), and screened by size and liquidity. MSCI then constructs its indices by targeting for index inclusion 85% of the free float adjusted market capitaliza-tion in each industry group, within each country. By targeting 85% of each industry group, the MSCI Country Index captures 85% of the total country market capitalization while it accurately reflects the economic diversity of the market. This includes the MSCI Japan Index. International indices. BBgBarc Aggregate Bond Index (Taxable Bonds / Bonds): Comprised of approximately 6,000 publicly traded bonds, including U.S. Government, mortgage-backed, corporate, and Yankee bonds with an average maturity of approximately 10 years. BBgBarc Global Aggregate Bond Index (Global Bonds): Provides a broad-based measure of the global investment-grade fixed income markets. The three major com-ponents of this index are the U.S. Aggregate, the Pan-European Aggregate, and the Asian-Pacific Aggregate Indices. The index also in-cludes Eurodollar and Euro-Yen corporate bonds, Canadian government, agency and corporate securities, and USD investment grade 144A securities. BBgBarc Muni Bond Index (Municipal Bonds): Bonds must have a minimum credit rating of at least Baa, an outstanding par value of at least $3 million, part of a transac-tion of at least $50 million, issued after De-cember 31, 1990 and have a year or longer remaining maturity. BBgBarc U.S. High Yield Bond Index (High Yield): Covers the universe of fixed rate, non-investment grade debt. Eurobonds and debt issues from countries designated as emerg-ing markets (e.g., Argentina, Brazil, Venezue-la, etc.) are excluded, but Canadian and glob-al bonds (SEC registered) of issuers in non-EMG countries are included. Original issue zeroes, step-up coupon structures, 144-As and pay-in-kind bonds (PIKs, as of October 1, 2009) are also included. BBgBarc U.S. Treasury Bond Index (Treasury Bonds): Comprised of U.S Treasury securities with at least one-year maturities.
©2018 Robert W. Baird & Co., Incorporated.
Member SIPC. MC-76300W.
Robert W. Baird & Co., Incorporated. 777 East Wisconsin Avenue, Milwaukee, Wisconsin 53202. 1-800-RW-BAIRD. www.rwbaird.com
6
Appendix Definitions and Disclosures
GICS
The Global Industry Classification Standard ("GICS") is the exclusive property of Morgan Stanley Capital International Inc. ("MSCI") and Standard & Poor's, a division of The McGraw-Hill Companies, Inc. ("S&P") and is licensed for use by Robert W. Baird & Co. Inc. MSCI and S&P hereby provided all infor-mation "as is" and expressly disclaim all war-ranties. Without limiting any of the forego-ing, in no event shall MSCI or S&P have any liability.
The Russell Indices are a trademark of the Frank Russell Company. Russell® is a trade-mark of the Frank Russell Company.
Investors should consider the investment objectives, risks, charges and expenses of each fund carefully before investing. This and other information is found in the pro-spectus and summary prospectus, which can be obtained from your Baird Financial Advisor. Please read the prospectus or sum-mary prospectus carefully before investing.
Appendix – Important Disclosures and Defi-nitions.
Disclaimers
This is not a complete analysis of every ma-terial fact regarding any company, industry or security. The opinions expressed here reflect our judgment at this date and are subject to change. The information has been obtained from sources we consider to be reliable, but we cannot guarantee the accu-racy. Past performance is not a guarantee of future results and diversification does not ensure against market loss.
There are risks associated with all invest-ments which should be considered prior to investing. Small-capitalization and mid-capitalization stocks are often more volatile and less liquid than investments in larger companies. Satellite and alternative invest-ments can be volatile and are not appropri-ate as large percentages of an investor’s to-tal asset allocation. Foreign issuers are sub-ject to certain risks, such as the potential for political or economic disruptions or instabil-ity of the country of issue, the difficulty of predicting international trade patterns, for-eign currency fluctuations, and the possibil-
ity of imposition of exchange controls. In-vestments in lower-rated debt securities (commonly referred to as high-yield or junk bonds) involve additional risks because of their lower credit quality which could equate to a possibly higher level of volatility and increased risk of default. While sector in-vesting reduces company specific risk, it will still be more volatile than the overall stock market due to its narrow focus and lack of diversification.
Stocks represent partial ownership of a cor-poration. If the corporation does well, its value increases, and investors share in the appreciation. However, if it goes bankrupt, or performs poorly, investors can lose their entire initial investment (i.e., the stock price can go to zero). Bonds represent a loan made by an investor to a corporation or gov-ernment. As such, the investor gets a guar-anteed interest rate for a specific period of time and expects to get their original invest-ment back at the end of that time period, along with the interest earned. Investment risk is repayment of the principal (amount invested). In the event of a bankruptcy or other corporate disruption, bonds are senior to stocks. Investors should be aware of these differences prior to investing. Additionally, an investment decision should not be made solely due to a security’s stated yield as divi-dends can be reduced or suspended alto-gether. The indices referenced in this report are unmanaged common indices used to measure and report performance of various sectors of the stock and fixed income mar-kets; direct investment in indices is not avail-able.
Baird is exempt from the requirement to hold an Australian financial services license. Baird is regulated by the United States Secu-rities and Exchange Commission, FINRA, NYSE, and various other self-regulatory or-ganizations and those laws and regulations may differ from Australian laws. This report has been prepared in accordance with the laws and regulations governing United States broker-dealers and not Australian laws.
Credit Quality Ratings: Measured on a scale that ranges from AAA or Aaa (highest) to D or C (lowest). Investment grade investments are those rated from highest down to BBB- or Baa3.
Other Disclosures
UK disclosure requirements for the purpose of distributing this research into the UK and other countries for which Robert W Baird Limited holds an ISD passport.
This report is for distribution into the United Kingdom only to persons who fall within Arti-cle 19 or Article 49(2) of the Financial Ser-vices and Markets Act 2000 (financial promo-tion) order 2001 being persons who are in-vestment professionals and may not be dis-tributed to private clients. Issued in the United Kingdom by Robert W Baird Limited, which has offices at Mint House 77 Mansell Street, London, E1 8AF, and is a company authorized and regulated by the Financial Conduct Authority. For the purposes of the Financial Conduct Authority requirements, this investment research report is classified as objective.
Robert W Baird Limited ("RWBL") is exempt from the requirement to hold an Australian financial services license. RWBL is regulated by the Financial Conduct Authority ("FCA") under UK laws and those laws may differ from Australian laws. This document has been prepared in accordance with FCA re-quirements and not Australian laws.
Copyright 2018 Robert W. Baird & Co. Incor-porated.
©2018 Robert W. Baird & Co., Incorporated.
Member SIPC. MC-76300W.
Robert W. Baird & Co., Incorporated. 777 East Wisconsin Avenue, Milwaukee, Wisconsin 53202. 1-800-RW-BAIRD. www.rwbaird.com