market trends - animpanimp.it/animp_/images/pdf_archivio/montefiore.pdf · (comperj, rnest) and...
TRANSCRIPT

Mauro Montefiore Chief Business Officer Technip Region B
24/10/2013 Le strategie di mercato per la filiera dell’impiantistica italiana 1
MARKET TRENDS

Market Trends
2
1. North America
2. Latin America
3. Russia, CIS and Southern
Eastern Europe (SEE)
4. North Africa – Egypt & Libya

North America
• US Market
• Overview
• By sector
• Canada Market
• Overview
• By sector
3

US Market
Unconventional Oil & Gas - shale Gas revolution:
Shale gas production today : 30% of total U.S. gas supply
Potentially more than $20b/year of investment in gas monetization
projects
Gas export opportunities
Inexpensive feedstock for petrochemical and fertilizer projects
Gas processing, ethylene, petrochem, fertilizers and LNG export :
31 high potential projects ($110b) out of 77 announced ($227b)
17 projects ($37b) already awarded
14 high potential projects ($73b) to be awarded - $38b by 2015
Overview
First wave award between 2012 and 2015 ($75b)
Second wave award between 2016 and 2020 (after impact of first wave)
Most probably a last group of projects (around 50%) will never be built
4

US Market
By sector
Capex for announced projects
5.000
15.000
25.000
35.000
45.000
55.000
2013-2014 2015-2016
M U
S $
UPSTREAM MARKET TREND North America - US
-
10.000
20.000
30.000
40.000
50.000
2013-2014 2015-2016
M U
S $
DOWNSTREAM MARKET TREND North America - US
5.000
15.000
25.000
35.000
45.000
55.000
2013-2014 2015-2016
M U
S $
MIDSTREAM MARKET TREND North America - US
Source: TPIT Internal Research
5

US Market
Gas processing and derivatives
Ethylene cracker
Global GDP growth: increasing demand for ethylene derivatives
Reduced ethane cost: ethylene cracking margins more attractive
ethylene cracker projects – 7 “high potential”
LNG/GTL
Shale gas developments : natural gas cost spread between US - Asia
LNG export facilities: 8 “high potential” LNG projects (roughly $70b)
Go-forward LNG prospects “large but uncertain” (potential for 1-2
projects/year)
Crude oil to natural gas price ratio: well above the minimum making GTL
projects viable – 2 “high potential”GTL projects
Fertilizer, PDH and Downstream Market Potential
Increased pricing and reduced natural gas costs: margins for ammonia
fertilizer production in NA dramaticallly increased
More than 20 Fertilizer ($22b) projects announced in North America – only few
serious initiatives – real potential: no more than one or two projects per year
Several major methanol projects emerging
Ethylene projects driving downstream derivative projects : several polymer
opportunities emerging
BG / Trunkline Lake Charles
Cheniere Corpus Christi
Cheniere Creole Trail
Cheniere Sabine Pass
Freeport
Sempra Lake Charles
Sasol GTL
Shell GTL
US Gulf Coast
North
America Asia Europe
$14-16/mmBTU $8 - 9/mmBTU $3-5/mmBTU
Jordan Cove
US West Coast
Dominion Cove Point
US East Coast
By sector
6
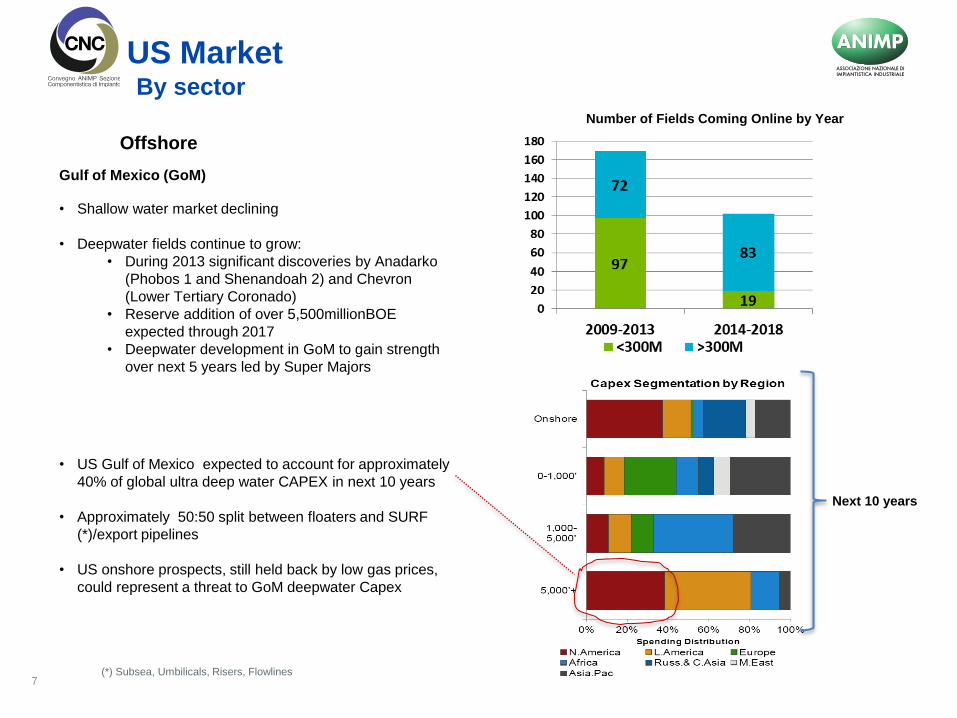
Offshore
Gulf of Mexico (GoM)
• Shallow water market declining
• Deepwater fields continue to grow:
• During 2013 significant discoveries by Anadarko
(Phobos 1 and Shenandoah 2) and Chevron
(Lower Tertiary Coronado)
• Reserve addition of over 5,500millionBOE
expected through 2017
• Deepwater development in GoM to gain strength
over next 5 years led by Super Majors
• US Gulf of Mexico expected to account for approximately
40% of global ultra deep water CAPEX in next 10 years
• Approximately 50:50 split between floaters and SURF
(*)/export pipelines
• US onshore prospects, still held back by low gas prices,
could represent a threat to GoM deepwater Capex
Next 10 years
US Market By sector
Number of Fields Coming Online by Year
(*) Subsea, Umbilicals, Risers, Flowlines 7

• Oil reserves :the 3rd largest oil reserves of the world, in excess of 173 billion bpd
• Oil production : up to 6.2 million bpd in 2030 (mainly unconventional reserves in Alberta)
• Oil sands production:
• from 1.6 million b/d in 2011 to 3.2 in 2020 and to 5.0 in 2030
• capital investment in Alberta oil sands: expected to exceed 180 B$ in the next decade
• Natural Gas: the 3rd largest natural gas producer in the world
• abundance of shale gas: developments in mega LNG projects (Pacific coast), GTL, gas processing and downstream
• Last 5 years: Chinese, Korean and Japanese investors acquired multi billion CAD stakes in oil sands and LNG
projects
• Today investors cautious - upstream developments to maintain the present pace (15-20 billion $/y) provided no significant
decrease in USA demand occur and limitation in export pipelines is overcome
• High workload and aging workforce causes shortage of resources in engineering, fabrication and erection
• The energy market : a cycle of expansion extending beyond the next decade.
Canada Market
Overview
8

Canada Market By sector
5.000
10.000
15.000
20.000
25.000
30.000
35.000
40.000
2013-2014 2015-2016
M U
S $
UPSTREAM MARKET TREND North America - Canada
Capex for announced projects
-
5.000
10.000
15.000
20.000
25.000
30.000
35.000
40.000
2013-2014 2015-2016
M U
S $
MIDSTREAM MARKET TREND North America - Canada
Source: TPIT Internal Research
9

Gas processing and derivatives
• Shale gas in North America affecting gas price (below 2$ per million
BTU) and threatening in medium terms export to USA
• Access to new markets – new LNG export facilities – LNG to Asia
• GTL conversion (Alberta)
• Gas monetization: petrochemical and fertilizer production
Oil production and refining
• Most of crude exported to USA; export pipeline capacity added
• Change in the future – export to Asia expected to grow
• Last 30 years: number of refineries from 44 to 18
• Most of upgrader projects cancelled due to: • narrow price differential,
• excess of refining capacity in USA,
• cost/schedule uncertainty
• Large number of SAGD (*) Projects (*) Steam Assisted Gravity Drainage
Different LNG projects may merge, only one
or two likely to be built by 2020
GTL Sasol Pre FEED 2015 2019
Canada Market By sector
10

Latin America
11
• Latin America Market
• Overview by country
• By sector

General
• Political uncertainty & debt of some Alba countries: delay on projects
Venezuela (PDVSA)
• 297 billion barrels oil proven resources; from 2,8mbpd up to 6mbpd in 2020
• $230b investments up to 2018 ($70b in downstream), out of which:
• $60b by JV partners: CNPC, Sinopec, Petrovietnam, Rosneft, Lukoil,
Gazpom, Chevron, Petrobras, Repsol, ENI etc.
• $35b Credit line from China
• Chinese and Russian investors more and more present
• Focus on production increase: 6 Heavy Oil Upgraders - Orinoco Basin
• Some JV partners holding / postponing commitment
Ecuador
• US$ 20bn up to 2018
• IOCs (Petrobras, Repsol, ENI, ENAP) reduced their local investments
• CNPC main investor in Pacific Refinery ($10b)
• Other projects not progressing for lack of financing
Bolivia
• US$ 10bn up to 2018 (mainly YPBF; limited contribution of foreign
investors like Petrobras; probably Braskem in the future);
• YPBF full control of the field of hydrocarbons; target to increase refining
capability from 45kbpd to 125kbpd by 2018
• Significant gas resources (even if not certified)
Cuba
• Potential projects in cooperation with PDVSA financed
from China (Cienfuegos and Matanzas refineries)
Venezuela & ALBA Countries
General
• Stability climate and investors trust;
• Investments: refineries modernization (new diesel / gasoline specs -
Mexico, Peru, Colombia) and gas production/distribution/monetization
• Impact of shale gas revolution to be evaluated
Mexico - PEMEX
• Investments: ~$20b per year up to 2018, 20% in downstream
• Focus in Tula Refinery, Reconfiguration of Salamanca Refinery and
Diesel Desulphurization Units (new specifications)
• Moving toward more flexible contracting system
Colombia
• ECOPETROL: $83b through 2020, inc. $12b in downstream
• Modernization of Cartagena & Barranca refineries: significant delays
• Long term potential in heavy crude upgrading and offshore
Peru
• Estimated country’s gas reserves 50 trillion cuft -more than 70% to be
confirmed/certified – future investments in fertilizers, petrochemicals and
LNG/GTL
• Petroperu / Repsol: investment in refining to meet new diesel and
gasoline specifications in 2016 (Talara, La Pampilla etc.)
• $30b investment in Oil & Gas up to 2018 - foreign investors (Petrobras,
Repsol, Ecopetrol, Pacific Rubiales and Braskem)
Chile
• Limited future investment to improve capacity and final products quality of the two existing refinery (Bio Bio and Acongaua)
• Investment mainly in mining and infrastructures
Pacific Alliance (Mexico, Colombia, Peru and Chile)
Latina America Market Overview by country
12

• Braskem: planning to invest in Brazil and abroad (both in
Latin America, i.e. Peru, Venezuela and in US);
• Chinese NOC (CNPC in Venezuela / Ecuador / Central
America, Sinopec and CNOOC in Brazil / Argentina /
Bolivia)
• Russian NOC (Rosneft & Lukoil in Venezuela, Gazprom in
Venezuela/Bolivia/Argentina)
• South America NOCs (Petrobras, PDVSA & Ecopetrol)
active in neighbouring countries
International Players in several
Latin America countries
• Issues in existing projects and debt of Petrobras:
investments potential slowdown
• Petrobras investments: $75b downstream - $147b upstream up to
2017
• Target: production increase from 2,1mbpd up to over 5mbpd in
2020
• Smaller investments in the field of ethanol, biodiesel and mining
• More than 95% of investments inside the Country
• Investment slowing down due to issues in existing projects
(Comperj, RNEST) and debt of Petrobras
• Looking for financing (almost 10MUS$ per year) through
recapitalization plan and several bilateral financing and
partnership deals
• Key projects:
• Several FPSO linked to pre-salt projects
• Petrobras Premium Refineries I & II – Chinese, Korean
and other international investors involved
• Petrobras Comperj Refinery 2nd Train, UFN4 and UFN5
Complex under evaluation
• Braskem Comperj Petrochemical Complex; negotiations
with Petrobras on gas supply conditions
• Opportunities in Biofuels – 2nd Generation Ethanol (BP
and Total)
Brazil
Latina America Market Overview by country
• Limited investment expected in the next years;
• Potential shale gas and shale oil resources under assesment • Among the planned projects:
• Baia Balanca Refinery (FEED underway) • Campana Refinery (FEED pre-qualification launched) • HDS new units in some of the existing refineries • Several Regassification Plant
• chances to be implemented low due to the economical situation of the country
Argentina
13

Latina America Market Overview by sector
Capex for announced projects
Source: TPIT Internal Research
14

Onshore accessible Market (m€); >50%GO
0
1000
2000
3000
4000
5000
6000
7000
2011A 2012A 2013F 2014 2015 2016
Other LAM
Pacific Alliance
(*)
Brazil
Venezuela &
ALBA
(*) Colombia, Mexico , Peru, Chile
Onshore by Product Line
Latina America Market Overview by sector
0
1000
2000
3000
4000
5000
6000
7000
2011 2012 2013 2014 2015 2016
Other
Fertilizers
Petrochemicals
Refining
Oil production and refining
Heavy Oil Upgraders in Venezuela (potential in other countries)
Shale Oil: Argentina (27Bbl), Venezuela(13Bbl), Colombia (7Bbl), Brazil
(5Bbl)
Oil products: internal demand increase; new refineries or modernization (Brazil, Ecuador, Venezuela, Perù, Colombia, Mexico etc.)
USA no longer a captive market for LAM crudes – LAM looking to Far East
Excess US Refining Capacity challenging economics of Refinery Upgrading
Gas processing and derivatives
Shale Gas: Argentina (800tcf),Brazil (245tcf),Venezuela (170tcf),Colombia
(55 tcf)
Gas production increase in several countries (in particualr Peru, Bolivia)
Petrochemical and fertilizers: internal demand increase; investment
decisions affected by shale gas revolution in USA
Gas Monetization projects in South America: competition against US
LNG : terminals (Colombia, Uruguay, Caribbean and Central American
Countries) and small-size LNG liquefaction plants for local use (Bolivia,
Peru)
Petrochemicals: new Petrochemical complexes in Mexico and potentially in
Brazil, Peru and Bolivia – Braskem as a key player
Fertilizers: significant investments in Brazil - other potential initiatives in
Peru
Investments: low Average GO factor and long decision process
Limited financial resources – e.g. debt situation of some NOCs
Cost / schedule overruns on projects draining NOCs’ resources/confidence
15 Source: TPIT Internal Research

$0
$5
$10
$15
$20
$25
$30
$35
$40
$45
2013 2014 2015 2016
NorthAmerica
Middle East& CaspianSeaLatinAmerica
Europe
Asia &Pacific
Africa
+44%
Subsea CAPEX: Latin America the largest contributor
$U
SB
$0
$1
$2
$3
$4
$5
$6
$7
2013 2014 2015 2016
Africa Asia & Pacific
Europe Latin America
Middle East & Caspian Sea North America
$US 20 bn $US 23 bn
$US13B $US16B
Floating Platform CAPEX: Latin America the 2° contributor
In Brazil:
Many opportunities with Pre-Salt developments offshore Brazil (High-Pressure
High-Temperature Fields) - water depths from Deep to Ultra-Deep
Petrobras to invest $147B in E&P up to 2017
3 Cessão Onerosa (Transfer of Rights) FPSOs to be awarded in 4Q 2013 and 3 in
2014
Auction for Libra Field (up to 42 billion BOE) will require at least 17 FPU
Petrobras announced need of 100 FPSO in the decades of 2020-2030
New Build:
59%
Converted:
41%
Latina America Market Overview by sector
Offshore
2013-2016: CAPEX breakdown by regions
16

17
Russia - CIS - SEE
• Russia - CIS - SEE
• Overview by country
• By sector

Russia - CA - SEE Market Overview by country
• No substantial pace change in 2013 - limited investments
• With the exception of Kazakhstan and Azerbaijan, foreign financing key
factor to select contractors (Korean in Uzbekistan, Japanese, Korean and
Chinese in Turkmenistan), unless specific technological content applies
• Local content in some countries a differentiator
• Azerbaijan
High potential market - Western-type contracting approach.
Funds not an issue
Koreans entering into the market
SOCAR main investor- domestic/abroad investments (Turkey, Georgia, Kyrgistan)
Uzbekistan
Significant gas resources - subject to foreigners partners interest (Kogas, Indorama, Sasol, Lukoil, etc.) – market controlled by Koreans
Kazakhstan
Development of existing Oil/Gas fields (Kashagan, Karachganak, etc);
Modernization of refineries (Shymkent and Pavlodar)
Turkmenistan
• Gas resources and dominant presence of Koreans, Chinese and Japanese.
• Japanese contractors favoured by recent governmental agreements
CIS
• Market: significant increase expected
• Oil & Gas sector reorganization (led by Rosneft)
• Refining: substantial investments in modernization (Rosneft,
Gazpromneft, Bashneft) to comply with more stringent requirement
(Euro V 2015 specifications) - 124 future units in existing refineries by
2020. Major Projects Capex 34B€ up to 2020; 1 - 2 new Refineries to
be launched on 2016
• Gas processing: first NG world producer (20% worldwide production);
Gazprom (70% production) monopolistic approach limits investments;
however two non-Gazprom major LNG EPC projects (Yamal and
Sakhalin) under way – opening of gas processing market in the future;
• Petrochemicals: focus on ethylene, PE, PP (Sibur, UPC, Lukoil and
Rosneft) - 6 petrochemical clusters to be developed: West-Siberian,
Volga River, Caspian, East-Siberian, North-Western and Far-Eastern.
• Market drivers: Surplus of petrochemical feedstock, low size of
existing petrochemical facilities (avg 300 kT/year) compared to
worldwide economical scale (1 MT/year), technological obsolescence
• Relevance of local content
• Russian Majors investing also abroad (Rosneft, Lukoil, etc.)
• Growing investment cooperation between Russia and China
• Rosneft to export to China 365mln tons of crude oil over next 25 years;
Russia is China’s biggest energy supplier.
RUSSIA
• Still recession
• Refining: improve profitability and compliance to Euro V
• Polyolefins/derivatives: opportunity of domestic market growth
• Potential investments in gas, re-gasification and export facilities pending
developments in shale gas and offshore fields in East Mediterranean Sea
SEE
18

Russia - CA - SEE Market Overview by sector
Capex for announced projects
Source: TPIT Internal Research 19

20
Russia - CA - SEE Market Overview by sector
Onshore accessible Market (m€); >50%GO
Onshore by Product Line
0
1000
2000
3000
4000
5000
6000
7000
2011A 2012A 2013 2014 2015 2016
GasProc
Petrochemicals & Fertilizers
Refining
0
1000
2000
3000
4000
5000
6000
7000
2011A 2012A 2013 2014 2015 2016
SEE
Central Asia
Russia
20
A developing market expected to stabilize growth pace in the medium term - driven by Russia
Oil production and Refining
• Investments for deep conversion to increase the profitability of
large size refineries
• Refineries mondernization to increase energy efficiency and to
comply with EURO V specifications and 1-2 new Refineries to
be launched in 2016
Gas processing and derivatives
LNG/GTL
• Mega LNG projects in Russia (Yamal, Sakhalin,Vladivostok)
• LNG export facilities linked to the development of offshore field in the East Mediterranean basin
• In Central Asia future investments aimed at shipping the extracted gas to China which is financing and building pipelines.
• New GTL in Uzbekistan
Petrochemicals
Integration of Refining and Petrochemicals Plants for
profitability increase (SOCAR future complex)
Several prospects for Ethylene plants and Petrochemicals
derivates (Sibur, Rosbeft, UPC, Lukoil in Russia)
Fertilizers
Fertilizers initiatives depending on Gas price evolution
Source: TPIT Internal Research

Offshore
Russia - CA - SEE Market Overview by sector
Caspian see: among the first three contributors to the Fixed
Platform CAPEX
Northern Caspian Sea: a shallow water area (between 5 and 10
meters of water depth on average) - Artificial Islands (Kalamkas)
and Fixed Platforms Clusters the preferred Field Development
solutions
Kazakhstan: two large projects in the future (Kalamkas, Pearls)
Russia: Kuvikina Field Development
Caspian Sea
$US 15 bn $US 15 bn
• Cyprus offshore gas reserves: Government awarded licenses for six
blocks to Noble, JV Eni-KOGAS and Total - up to 40 tcf
corresponding to approx. €4B/year in Government revenue
• Total estimated natural gas reserves for Cyprus:in the range of 60tcf.
• The East Mediterranean basin: up to 100 tcf of gas resources
becoming one of the main producers in the region
Mediterranean Sea
$U
SB
CAPEX for Fixed Platforms by Regions
The Arctic under appraisal - may hold up to 13% of the
global oil reserves, 30% of the gas reserves with 80% of
these reserves located Offshore
Arctic Sea
• Potential key offshore projects in Black Sea states : Neptun Deep,
Khan Asparuh and Skifska blocks
• Rosneft and ExxonMobil could revitalize Tuapse Trough project
(11,500 square kilometers - 1,000 to 2,000 meters water depth) in
the Russia Continental Shelf of the Black Sea
• Discovered in 2003 and with 3D seismic survey completed in 2010,
the Tuapse Trough project is very similar to Gulf of Mexico
deepwater project.
Black Sea
21

22
North Africa – Egypt and Libya
• Egypt and Libya Market
• Overview by country
• By sector

Egypt and Libya Market Overview by country
Investment restarted
Army supporting Country stabilization road map, aiming
at GDP growth
Country targets: double gas production and “zero”
balance of trade in petroleum products
Foreign investors renewed interest for the Country:
BP report a new important gas discovery
BG, Shell, ENI are planning to increase
production from the existing gas fields
On September 2013 GCC countries announced
that will lead the investments in Petrochemicals
and Refinery (30b$)
On September 2013 Sinopec bought 33% of
Apache Egypt (3,1b$) to pursue new Western
Desert oil discoveries
On September 2013 Total has acquired a large
portion of the fuel stations
EGYPT
Still a “stand by” period
Control of Libyan territory is the key issue to stabilize
the Country for steady operations and new projects
Potential developments:
ENI target to increase production from fields
connected to Mellitah complex
NOC aiming at 2mb/d of oil, 0,8mb/d of new
refinery capacity (LERCO, Zwara, Tobruk), 1
mt/y of LNG (new train in Brega) and a new JV
for Polyethylene in RASCO.
Repsol-OMV, ENI, Conoco Philips, Total will be
the pioneers of the new Oil Exploration &
Production
LYBIA
23

Egypt and Libya Market
Overview by sector
-
2.000
4.000
6.000
8.000
10.000
12.000
14.000
2013-2014 2015-2016
M U
S $
DOWNSTREAM MARKET TREND AFRICA - Egypt and Libya
Libya
Egypt
Capex for announced projects
24 Source: TPIT Internal Research

Egypt and Libya Market Overview by sector
Investments Key contributor to the stabilization of the
countries economy
Egypt
Investments driven by the need to fill the gap between internal demand and potential refining capabilities
Libya
Recovery of the production level before arab spring
Oil production and Refining
• Egypt: refining plan (new refinery and revamping of existing) to reduce negative balance of trade: a new Refinery (SRPC Soukhna Refinery) and upgrading of the existing ones (Midor)
• Libya: existing refineries looking at foreign investments for upgrading (LERCO: Ras Lanuf Revamping)
Gas processing and derivatives
Egypt: large proven gas reserves; foreign investments needed to fully re-start:
• In E&P (currently slow by only few IOC’s mainly in off-
shore)
• In Petrochemical (also aimed to promote plastics
clusters) – new potential Petrochemical Complex
(Tahrir) -
• In Fertilizer complex to boost agriculture
Libya: new E&P potential investments (ENI, BP, Repsol, Conoco & Total) – potential future projects in LNG and Ethylene
-
500
1.000
1.500
2.000
2.500
3.000
3.500
4.000
4.500
2011A 2012A 2013F 2014 2015 2016
Libya Petrochemical
Libya Refinery
Libya LNG
Libya upstream
Egypt Petrochemical
Egypt Refinery
Egypt LNG
Egypt upstream
Onshore accessible Market (m€); >50%GO
25 Source: TPIT Internal Research

Mauro Montefiore Chief Business Officer Technip Region B
24/10/2013 Le strategie di mercato per la filiera dell’impiantistica italiana 26
MARKET TRENDS
THANK YOU !