market structure and proï¬t complementarity: the case of
TRANSCRIPT
Market Structure and Profit Complementarity:
The Case of SPECT and PET ∗
Justin Lenzo †
August 2007
Abstract
The paper examines how the market structure in which a firm operates affectscomplementarity in its decisions to adopt service-oriented technologies. Adoption de-cisions over multiple technologies often exhibit interdependence and the competitiveenvironment in which a firm operates can substantially affect such interdependence.We use the case of hospital adoption of SPECT and PET diagnostic imaging tech-nologies to illustrate the effects of market structure on profit complementarity betweendecisions. A monopolist hospital faces strong cannibalization of SPECT service utiliza-tion by adopting PET as well. With one or more competing hospitals in the market forSPECT service, the potential for self-cannibalization diminishes, and hence we wouldexpect complementarity to increase.
We test for changes in profit complementarity between the adoption of SPECT andPET technologies using a static discrete choice framework that accounts for the strate-gic nature of adoption among market rivals. Specifically, we use observed variation injoint versus separate adoption of the two technologies across rival adoption strategies toinfer changes in the relative profitability of joint versus separate adoption. We accountfor the endogeneity of a rival hospital’s adoption decisions using a recursive approachbased on alternating parameter estimation and equilibrium solution. We find evidencethat hospitals in more competitive hospital markets face greater profit complementar-ity between their adoption decisions; however, the primary motivation for adoptingthese technologies appears to be patient feeding rather than direct service profit maxi-mization. We discuss implications for inference about technology adoption in strategicsettings. In particular, we argue that neglecting variation in profit complementarityacross market structures can result in biased estimates, even when only the adoptionof one technology is of interest.
∗I am especially grateful to Marc Rysman and Victor Aguirregabiria for their guidance on this project.I would also like to thank Randy Ellis and seminar participants at Boston University for their helpfulcomments. All errors are my own.
†Department of Management and Strategy, Kellogg School of Management, Northwestern University,2001 Sheridan Road, Evanston, IL 60208-2001. e-mail: [email protected]
1 Introduction
This paper examines firm adoption decisions over multiple, service-oriented technologiesthat are crucially tied to the firm’s participation in related service markets. We focus onthe interaction of hospitals’ decisions to adopt single-photon emission tomography (SPECT)and positron emission tomography (PET) and how hospital market structure affects thisinteraction. With both diagnostic imaging technologies, one can view the adoption decisionas synonymous with the decision to enter the associated service market. Hence, the mar-ket forces that affect the profitability of each service also influence the adoption payoffs.Importantly, the manner in which the profitability of the two services interacts gives riseto complementarity or anti-complementarity between the two adoption decisions. Marketconditions will affect the interaction in profits between the two services and hence the com-plementarity between the adoption decisions. In this manner, the case of SPECT and PETillustrates how market structure influences the degree of complementarity among a firm’sdecisions.
The substitutability of SPECT and PET scans for most consumers will drive down thecomplementarity between a monopolist hospital’s decisions to adopt the technologies, evenwhen we allow the hospital to price discriminate. The downward pressure on complementar-ity stems from the presence of one service cannibalizing usage of the other. If a competinghospital adopts SPECT technology and offers scanning services, then its presence in theSPECT submarket will draw away some of those SPECT consumers that a monopolistwould otherwise lose by offering PET as well. Hence, we expect that the source of anti-complementarity faced by the hospital should weaken as one of the submarkets becomesmore competitive.
We test this intuition empirically with a discrete choice framework that takes intoaccount both the interaction between the two adoption decisions and the interaction amongcompeting hospitals in a market. We model the adoption decisions as a choice over bundlesof the two technologies, using an approach similar to Gentzkow (2005) in his work onprint and online newspapers. To incorporate the strategic considerations, we employ theNested Pseudo-Likelihood (NPL) method developed by Aguirregabiria and Mira (2004).The results of the structural estimation suggest that profit complementarity is affected bythe number of hospitals in the market, rather than expectations regarding rival adoption.In the end, the estimated parameters provide stronger evidence for patient-feeding as themotive for adopting these technologies, rather than direct service profit maximization.
Multi-product oligopolies present distinct challenges to the study of imperfect compe-tition, both in its theoretical and empirical branches. Researchers confront the dilemmathat there are very few firms that make decisions with consideration of only one product;however, the multi-product nature of most firms adds considerable complexity to our mod-els, especially when strategic factors are present. When the product line of a multi-productfirm is linked to its technological adoption decisions, the same strategic considerations thataffect the firm’s product choices also affect these adoption decisions. In such situations,the market environment will have an impact not only on the profitability of each adoptiondecision in isolation, but also on the interaction of the decisions in the firm’s overall profits.
Several important factors complicate the decision problem of a multi-product firm rel-ative to that of a single-product firm. A firm offering multiple products that consumersview as substitutes faces the prospect of cannibalization of its revenues in one submarketthrough its operation in another. If the firm enjoys enough market power, it may partially,and in some cases completely, ameliorate such cannibalization through price discrimination.Of course, if consumers view the products offered by the firm as complements, then the
1

firm’s operation in one submarket may expand demand in others. Furthermore, productsmay also interact in production, generating economies or diseconomies of scope.
The notion of profit complementarity is a cumulative measure of the these variouseffects. Demand-side complementary products and economies of scope will generate positiveprofit complementarity, whereas demand-side substitution and diseconomies of scope willgenerate negative profit complementarity. The precise definition of profit complementaritywould vary by context; however, for a dual technology adoption situation like that understudy, it suffices to define the two adoption choices as profit complements if adoption of onetechnology increases the profitability of adopting the other ceteris paribus.1 This definitioncorresponds to strategic complementarity among the components of a firm’s own strategy.Note that we use the term negative profit complementarity, or anti-complementarity, forthe opposite case, rather than profit substitutability.
The use of profit complementarity to aggregate cost and demand factors is well-suitedto contexts where the econometrician observes limited information about the post-adoptionplay among market rivals. In the empirical investigation, we use a strategic discrete choicemodel to infer changes in profit complementarity between adoption decisions over marketstructure. While we do not observe data on the prices, quantities, or profits that result fromthe post-adoption competition, the observed adoption decisions, along with data on hospi-tals and markets, provide insight into how market conditions affect profit complementaritybetween SPECT and PET adoption.
The market forces that drive the adoption of technologies and the selection of servicesprovided by hospitals has attracted a great deal of attention over the last several decades.Given the critical importance of the hospital services sector to the economy, the relativeavailability of data pertaining to this sector, and the host of intriguing economic phenomenathat appear, the level of interest comes as no surprise. Along with the bundle of issuesspecific to the industry, such as the medical arms race, physician-induced demand, andthird-party payment, the hospital services industry provides insights into broader questionsof imperfect competition. In particular, the variety of interacting services supplied by agiven hospital presents an application and test of models of multi-product oligopoly.
Among the many services provided by hospitals, diagnostic imaging services are amongthe most technologically intensive. This feature, combined with the relative availabilityof data on markets for these services, has led to a number of empirical investigations onthe role of competitive factors in technological choice that have focused on these markets.The works of Trajtenberg (1989), Baker (2001), and Schmidt-Dengler (2005) exemplify thetypes of questions that economists have tried to address by examining diagnostic imagingtechnologies. Trajtenberg (1989) examines the market for computed tomography (CT)scanners to discern the welfare gains from the diffusion of product innovations using discretechoice analysis of hospital purchase decisions. Baker (2001) and Schmidt-Dengler (2005)study a dynamic model of the timing of adoption of magnetic resonance imaging (MRI) byhospitals. While Baker (2001) investigates the effect of HMO penetration on diffusion ofthe technology into markets, Schmidt-Dengler (2005) focuses on strategic factors stemmingfrom the oligopoly structure of most hospital markets.
The difference in the present study from these earlier works extends beyond the par-ticular choice of diagnostic scanner. The lack of detailed purchase data does not permitthe evaluation of these technologies from a welfare perspective as Trajtenberg (1989) does.
1A more general definition of profit complementarity (or better yet, payoff complementarity) between twochoice variables would be that the objective function be supermodular (for positive profit complementarity)or submodular (for negative profit complementarity) in those variables. See Milgrom and Roberts (1990b)for formalization and discussion of this concept.
2
Instead, this paper, like those of Baker (2001) and Schmidt-Dengler (2005), concentrateson the market factors that affect hospital’s decisions to adopt these technologies. However,unlike these papers, we focus on the complementarity of multiple adoption decisions, ratherthan on the timing of a single adoption. We certainly do not claim that adoption timingis not important; rather, we highlight another feature present in these contexts. In thisrespect, the present study complements the previous literature. Ideally, one should considerboth adoption timing and complementarity because each has implications for the other. Weneglect the dynamic considerations present mainly for simplicity.
The remainder of the paper proceeds as follows. We first present an analytical frameworkfor the effects of market structure on profit complementarity. We then illustrate how thenature of competition among rivals may affect profit complementarity between adoptiondecisions. Turning to our empirical context, we describe the two technologies under studyand the data used in our estimation. We then present the econometric specification andthe estimation procedure. After discussing the results and directions for further work, weconclude with a discussion of implications for inference regarding technology adoption instrategic settings.
2 Structure and Examples
2.1 Basic game structure
We model adoption of the SPECT and PET as a static, two-stage game among hospi-tals. While neglecting potentially important features of the dynamic version, the staticapproximation of the adoption game adequately highlights the primary elements of howthe competitive environment can affect profit complementarity.
A market consists of n firms that may adopt neither, one, or both of two technologies.Much of the intuition presented here extends to cases of three or more technologies; however,the analysis becomes far more cumbersome. The set of firms in the market, and hence theset of potential adopters of both technologies, is exogenous to the model. This restriction issensible for our context because SPECT and PET services are relatively small componentsof a hospital’s overall operations, and hence adoption of these technologies should have anegligible effect on the entry or exit decisions of hospitals as a whole. In the first stage of thegame, each of the n firms chooses whether to adopt each of the two technologies. The choiceset of each firm consists of the four possible combinations of adoption/non-adoption of theindividual technologies, denoted A ≡
{(0, 0), (0, 1), (1, 0), (1, 1)
}. The adoption decisions of
all firms are made simultaneously.After the adoption decisions are made in the first stage, all firms observe these decisions.
Those that have adopted at least one of the technologies then compete in the market fordiagnostic imaging services. The outcome of this second-stage oligopoly game determinesthe final payoffs to the firms. The precise nature of the interaction within each servicesubmarket and between the two submarkets is left unspecified for most purposes; however,we will consider specific examples of the second-stage subgames below. We do impose thefollowing assumption throughout:
Assumption 1. There exists a unique equilibrium in all of the second-stage subgames.The equilibrium resulting from each market structure generated by the first-stage decisionsis known to the firms in the first stage.
Assumption 1 permits the specification of the firms’ payoffs to adoption decisions di-rectly as a function of the outcome of the first stage, without regard to the details of the
3
subsequent play. The payoff function faced by firm i is denoted πi : A × An−1 → R. Thepayoff to adopting neither technology, regardless of the decisions of the other firms, is fixedat zero. One should then interpret the payoffs of the other options as differences from thenon-adoption option. This normalization imposes a substantive restriction given the dy-namic nature of the true adoption game. In the dynamic game, the payoff to non-adoptionis the value of waiting, which may differ across firms and, more importantly, across ri-val strategies. Nevertheless, since the normalization is required for identification of theeconometric model, we impose it here as well for simplicity.
We measure profit complementarity by how much better or worse the firm would do byadopting both technologies than would two identically situated firms each specializing byadopting one technology. We denote the profit complementarity by Γi(a−i) and define itas:
Γi(a−i) = πi((1, 1), a−i
)− πi
((1, 0), a−i
)− πi
((0, 1), a−i
)(1)
One should not infer from the use of the term complementarity any restriction that Γi
be positive. The case of negative profit complementarity is certainly plausible in manycontexts, especially if the two service types are substitutes to consumers.
The changes in the complementarity of the adoption decisions across different opponentdecision profiles is our particular interest. That is, if a−i,1 and a−i,2 are two opponentadoption profiles such that a−i,2 > a−i,1, then we investigate conditions under which wecan predict the sign of Γi(a−i,2) − Γi(a−i,1).2 In particular, what conditions should bepresent for which we can claim that firm i’s adoption decisions exhibit stronger (morepositive) complementarity when an opponent has adopted a technology versus when thatopponent has not?
One may see a connection between the basic game structure presented here and thetheory of supermodular games developed by Topkis (1979), Vives (1990), and Milgrom andRoberts (1990b). However, only under special circumstances is the game supermodularor submodular. If we select the standard component-wise ordering as the strategy set’spartial order, then a firm’s profit function is supermodular if and only if Γi(a−i) > 0 forall a−i.3 We should reiterate, however, that we do not assume that Γi is always positive.Furthermore, even if this were the case, the profit functions need not satisfy the increasingdifferences property also required for supermodularity of the adoption game. The resultsfor supermodular games may apply to special cases, and may apply to the second-stagesubgames; however, the first-stage adoption games are not in general supermodular.
Because of the agnostic view of behavior in the second-stage subgames, the structureimposed can encompass a large class of oligopoly models. The cost, of course, is that we candetermine in general neither the sign of the complementarity at a particular rival decisionprofile, nor how the complementarity changes over rival decision profiles. We considerexamples below that illustrate how assumptions regarding the second-stage play can permitpredictions regarding both the level and change in profit complementarity. We reiteratethat we do not impose the restrictions described below in the empirical investigation; rather,we use the intuition that these examples provide to generate predictions and interpret theresults.
2The notation a > b for vectors a and b denotes the condition that all entries of a are no less than thecorresponding entries of b and that at least one entry of a is strictly greater.
3Given the size and structure of the choice set, the condition that Γi is positive is a necessary andsufficient condition for the defining inequality of the supermodularity property to be satisfied for all ai ∈ Aat a fixed a−i. All other combinations of ai, ai′ ∈ A would satisfy the inequality trivially.
4
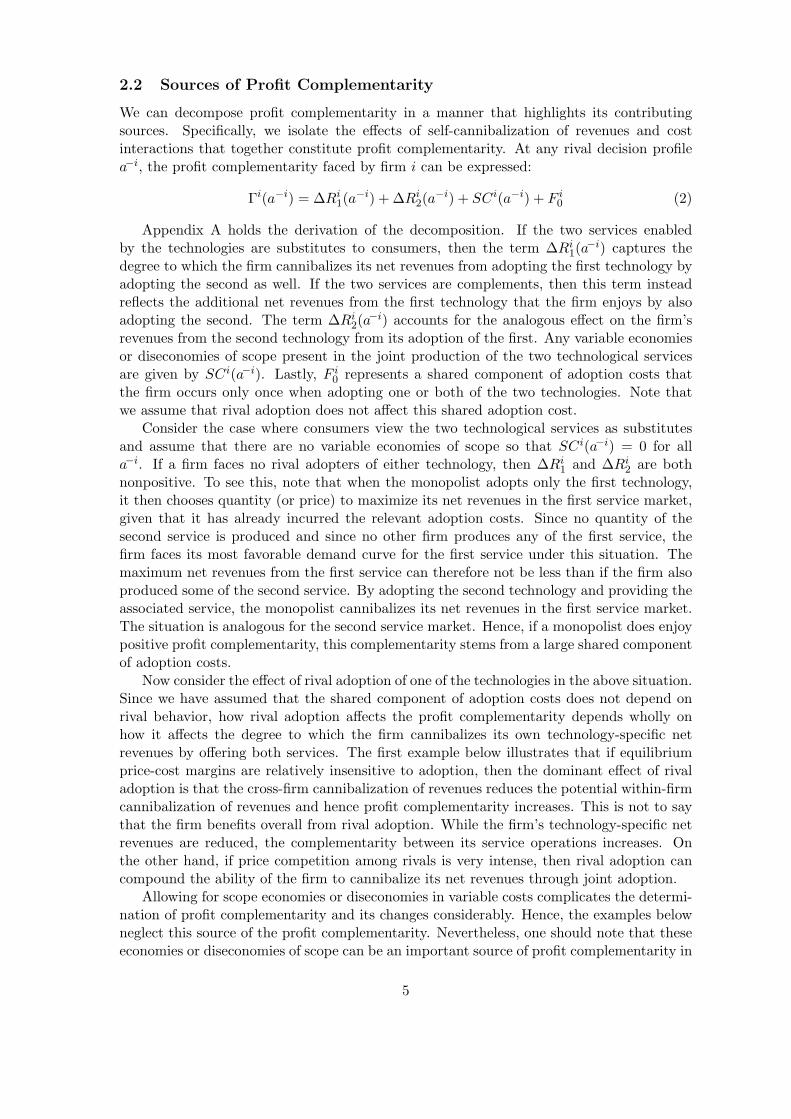
2.2 Sources of Profit Complementarity
We can decompose profit complementarity in a manner that highlights its contributingsources. Specifically, we isolate the effects of self-cannibalization of revenues and costinteractions that together constitute profit complementarity. At any rival decision profilea−i, the profit complementarity faced by firm i can be expressed:
Γi(a−i) = ∆Ri1(a
−i) + ∆Ri2(a
−i) + SCi(a−i) + F i0 (2)
Appendix A holds the derivation of the decomposition. If the two services enabledby the technologies are substitutes to consumers, then the term ∆Ri
1(a−i) captures the
degree to which the firm cannibalizes its net revenues from adopting the first technology byadopting the second as well. If the two services are complements, then this term insteadreflects the additional net revenues from the first technology that the firm enjoys by alsoadopting the second. The term ∆Ri
2(a−i) accounts for the analogous effect on the firm’s
revenues from the second technology from its adoption of the first. Any variable economiesor diseconomies of scope present in the joint production of the two technological servicesare given by SCi(a−i). Lastly, F i
0 represents a shared component of adoption costs thatthe firm occurs only once when adopting one or both of the two technologies. Note thatwe assume that rival adoption does not affect this shared adoption cost.
Consider the case where consumers view the two technological services as substitutesand assume that there are no variable economies of scope so that SCi(a−i) = 0 for alla−i. If a firm faces no rival adopters of either technology, then ∆Ri
1 and ∆Ri2 are both
nonpositive. To see this, note that when the monopolist adopts only the first technology,it then chooses quantity (or price) to maximize its net revenues in the first service market,given that it has already incurred the relevant adoption costs. Since no quantity of thesecond service is produced and since no other firm produces any of the first service, thefirm faces its most favorable demand curve for the first service under this situation. Themaximum net revenues from the first service can therefore not be less than if the firm alsoproduced some of the second service. By adopting the second technology and providing theassociated service, the monopolist cannibalizes its net revenues in the first service market.The situation is analogous for the second service market. Hence, if a monopolist does enjoypositive profit complementarity, this complementarity stems from a large shared componentof adoption costs.
Now consider the effect of rival adoption of one of the technologies in the above situation.Since we have assumed that the shared component of adoption costs does not depend onrival behavior, how rival adoption affects the profit complementarity depends wholly onhow it affects the degree to which the firm cannibalizes its own technology-specific netrevenues by offering both services. The first example below illustrates that if equilibriumprice-cost margins are relatively insensitive to adoption, then the dominant effect of rivaladoption is that the cross-firm cannibalization of revenues reduces the potential within-firmcannibalization of revenues and hence profit complementarity increases. This is not to saythat the firm benefits overall from rival adoption. While the firm’s technology-specific netrevenues are reduced, the complementarity between its service operations increases. Onthe other hand, if price competition among rivals is very intense, then rival adoption cancompound the ability of the firm to cannibalize its net revenues through joint adoption.
Allowing for scope economies or diseconomies in variable costs complicates the determi-nation of profit complementarity and its changes considerably. Hence, the examples belowneglect this source of the profit complementarity. Nevertheless, one should note that theseeconomies or diseconomies of scope can be an important source of profit complementarity in
5

some contexts. In fact, as Bulow et al. (1985) demonstrates, cost interactions may generateprofit complementarity or anti-complementarity even where demands for the service typesare independent.
2.3 Examples
We present two polar examples that illustrate how the rules of the game will affect whetherprofit complementarity is increasing or decreasing as rival firms adopt more technologies.The examples are chosen for their relative ease in deriving the equilibrium of each post-adoption subgame and the clarity with which they highlight the sources of change in com-plementarity. The first example removes any post-adoption strategy by firms to show howthe effect of cross-firm revenue cannibalization on potential within-firm cannibalization willlead to increasing profit complementarity. The second example, on the other hand, demon-strates that very sensitive prices (as in the Bertrand model) will result in decreasing profitcomplementarity.
We also provide a variation on the first example suited to our empirical context. Thisthird example extends the first by considering an additional source of adoption profits fromfeeding diagnostic imaging patients into a hospital’s treatment services.
2.3.1 Example with exogenous price-cost margins
We start with a particularly tractable, albeit restrictive, example to illustrate one of theprimary sources of change in profit complementarity over market structure. The key featureof the example is that service price-cost margins do not vary over the first-stage decisionsof any firm. By fixing these margins, we are able to highlight the roles that within-firmcannibalization and cross-firm cannibalization play in the determination of profit comple-mentarity. We also assume constant marginal costs and disregard cost interactions in orderto focus on the cannibalization effects; however, we consider including shared adoptioncosts below. The basic result is that cross-firm cannibalization reduces potential within-firm cannibalization, and hence adoption by rivals will increase the profit complementaritythat a firm faces in its own adoption decisions.
In this environment, there are no strategic considerations in the post-adoption sub-games. So long as a firm’s price exceeds marginal cost, the firm will produce to meetdemand at that price if it has adopted the relevant service technology. Consumers in themarket may purchase at most one unit of either type of service. The fixed-prices restrictionassures that a consumer’s preference ordering over the four firm-service pairs does not de-pend on the adoption decisions of the firms in the first stage. These adoption decisions onlydetermine the budget set from which consumers may choose. We assume that consumershave heterogeneous preferences over the firm-service pairs and show that with sufficientheterogeneity, the profit complementarity faced by a firm will increase with rival adoption.
We find some justification for these assumptions from our empirical context. In a marketwith very high Medicare penetration, the assumption here of a fixed price-cost margin maybe a reasonable approximation. Furthermore, if a hospital is part of a larger hospitalsystem that interacts with HMOs on a national or regional level, the exogeneity of pricesto the local market structure again seems sensible. Lastly, if hospitals provide these typesof diagnostic services merely to feed patients into profitable treatment services, we mayinterpret the margin instead as an expected profit term per patient scan, dependent onfactors exogenous to the SPECT/PET market structure.
One can find the details of the result in Appendix A. Under the stated assumptions,
6
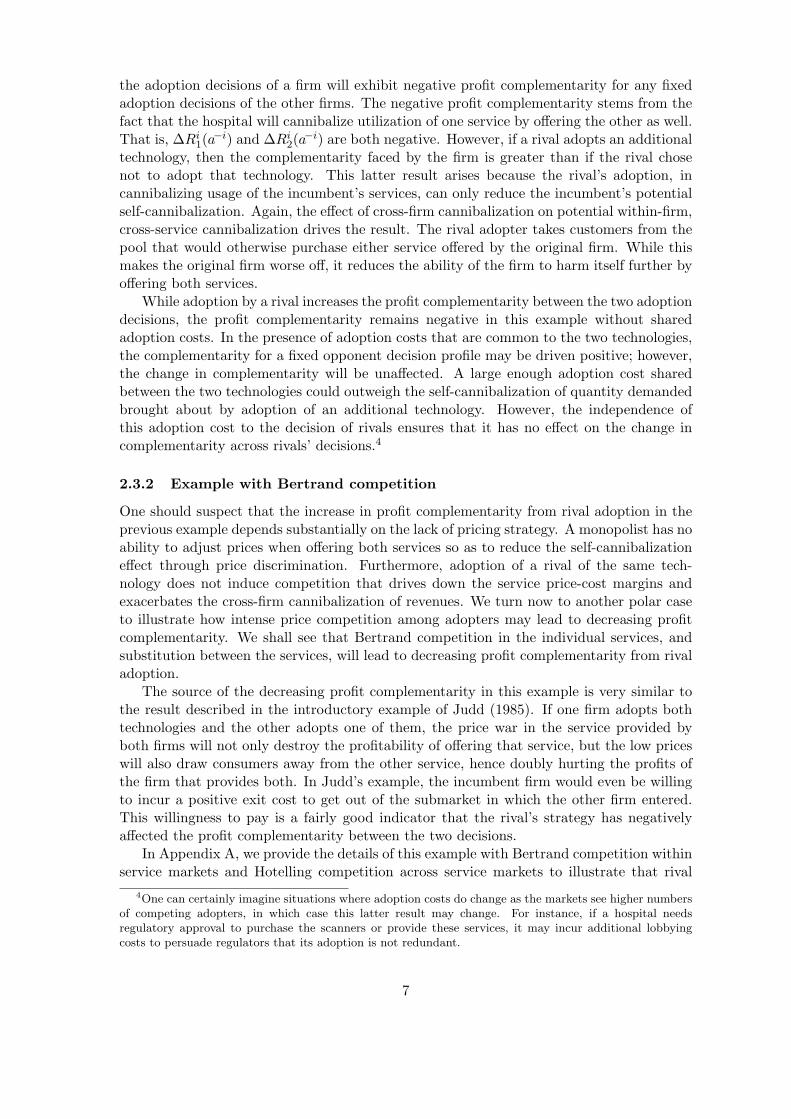
the adoption decisions of a firm will exhibit negative profit complementarity for any fixedadoption decisions of the other firms. The negative profit complementarity stems from thefact that the hospital will cannibalize utilization of one service by offering the other as well.That is, ∆Ri
1(a−i) and ∆Ri
2(a−i) are both negative. However, if a rival adopts an additional
technology, then the complementarity faced by the firm is greater than if the rival chosenot to adopt that technology. This latter result arises because the rival’s adoption, incannibalizing usage of the incumbent’s services, can only reduce the incumbent’s potentialself-cannibalization. Again, the effect of cross-firm cannibalization on potential within-firm,cross-service cannibalization drives the result. The rival adopter takes customers from thepool that would otherwise purchase either service offered by the original firm. While thismakes the original firm worse off, it reduces the ability of the firm to harm itself further byoffering both services.
While adoption by a rival increases the profit complementarity between the two adoptiondecisions, the profit complementarity remains negative in this example without sharedadoption costs. In the presence of adoption costs that are common to the two technologies,the complementarity for a fixed opponent decision profile may be driven positive; however,the change in complementarity will be unaffected. A large enough adoption cost sharedbetween the two technologies could outweigh the self-cannibalization of quantity demandedbrought about by adoption of an additional technology. However, the independence ofthis adoption cost to the decision of rivals ensures that it has no effect on the change incomplementarity across rivals’ decisions.4
2.3.2 Example with Bertrand competition
One should suspect that the increase in profit complementarity from rival adoption in theprevious example depends substantially on the lack of pricing strategy. A monopolist has noability to adjust prices when offering both services so as to reduce the self-cannibalizationeffect through price discrimination. Furthermore, adoption of a rival of the same tech-nology does not induce competition that drives down the service price-cost margins andexacerbates the cross-firm cannibalization of revenues. We turn now to another polar caseto illustrate how intense price competition among adopters may lead to decreasing profitcomplementarity. We shall see that Bertrand competition in the individual services, andsubstitution between the services, will lead to decreasing profit complementarity from rivaladoption.
The source of the decreasing profit complementarity in this example is very similar tothe result described in the introductory example of Judd (1985). If one firm adopts bothtechnologies and the other adopts one of them, the price war in the service provided byboth firms will not only destroy the profitability of offering that service, but the low priceswill also draw consumers away from the other service, hence doubly hurting the profits ofthe firm that provides both. In Judd’s example, the incumbent firm would even be willingto incur a positive exit cost to get out of the submarket in which the other firm entered.This willingness to pay is a fairly good indicator that the rival’s strategy has negativelyaffected the profit complementarity between the two decisions.
In Appendix A, we provide the details of this example with Bertrand competition withinservice markets and Hotelling competition across service markets to illustrate that rival
4One can certainly imagine situations where adoption costs do change as the markets see higher numbersof competing adopters, in which case this latter result may change. For instance, if a hospital needsregulatory approval to purchase the scanners or provide these services, it may incur additional lobbyingcosts to persuade regulators that its adoption is not redundant.
7

adoption in the presence of intense price competition drives down complementarity betweena firm’s adoption decisions. Prices for any service that both firms provide will be drivendown to marginal cost, as in the Bertrand model. Note that this result holds even if oneof the firms also provides the other service because that firm can undercut the price of theother without significantly affecting the relative prices of the two services. A monopolisthaving adopted both technologies will be able to reduce the self-cannibalization in theservices through price discrimination, although there will still be some cannibalization withtravel costs in the assumed range. The resulting price war from adoption of one technologyby the other firm destroys the ability of the firm that operates in both to price discriminate.Furthermore, the low prices that result from the price war draw away consumers from theneighborhood of the other service. We have then that the presence of a rival exacerbatesthe ability of a firm to cannibalize its revenues from adopting one technology by adoptingthe other.
2.3.3 Example with patient feeding
Since the investigation focuses on medical diagnostic imaging technology, one should con-sider that a hospital may be motivated to adopt these technologies primarily by the prospectof feeding patients into its treatment services. Under such a motivation, a hospital maycare far less about the direct profits from providing the diagnostic services. The analysisof this scenario closely resembles that with exogenous price-cost margins. However, thepresent case predicts that profit complementarity is affected by the number of hospitalsin the market, not only on their adoption decisions. While rival adoption of additionaltechnologies increases profit complementarity just as before, profit complementarity alsoincreases with the number of hospitals in the market.
Appendix A presents a stylized example of patient feeding to illustrate that profit com-plementarity is increasing not only in rival adoption, but also in the number of hospitalsin the market. The example differs from Example 2.3.1 in that the increase in profit com-plementarity stems not only from reduced self-cannibalization in quantity, but also from areduction in the value of each patient in the cannibalized quantity. Since patients in mar-kets with more hospitals have more options for treatment services, the expected value to ahospital of each scanned patient decreases as the number of hospitals increases. While againthis hurts the profitability of the individual technologies, it serves to increase the profitsto joint adoption relative to specialized adoption by reducing the self-cannibalization oftechnology-specific revenues.
2.4 Testing for Changes in Profit Complementarity
The level of profit complementarity significantly affects the equilibria that tend to arise ina multi-product oligopoly game, as illustrated by Shaked and Sutton (1990). In contextswith positive complementarity, equilibria where fewer firms adopt both technologies will bemore common. With negative complementarity, one would expect equilibria where a largernumber of firms adopt only one of the technologies.
One may then use observations of the equilibrium patterns across markets to inferwhether profit complementarity is positive or negative, subject to the limitations discussedin Section 4. If one observes that firms tend to adopt either both technologies or neitherof them, then we may infer positive profit complementarity. Alternatively, if one sees atendency of firms to adopt either one technology or the other, then we may infer negativecomplementarity. The accuracy of these inferences, of course, depends crucially on one’s
8

ability to control for other forces at work, especially correlation in the profitability of theindividual adoption decisions.
Similarly, one may observe changes in equilibrium patterns across market structuresto infer changes in profit complementarity. If profit complementarity increases with rivaladoption, then we should see a stronger tendency toward firms adopting one technologyor the other in less competitive markets and toward firms adopting both technologies orneither in more competitive markets. From the examples above, we suspect that contextsfor which price competition is limited in intensity would tend to exhibit increasing profitcomplementarity.
One could, of course, impose structural assumptions on the second-stage subgames thatgenerate increasing or decreasing profit complementarity and use this structure to reducethe degrees of freedom in testing other hypotheses regarding the model. Alternatively, onecould take a “black box” approach to the second-stage subgames and use the estimatedchanges in profit complementarity to make inferences regarding the nature of competitionwithin and across the submarkets.
The latter approach appears preferable for the case of hospital diagnostic imaging ser-vices. Competition among hospitals is thought to depart somewhat from conventionalmodels of imperfect competition. The presence and strength of both insurance and inter-mediaries between the providers and consumers of hospital services, and the fact that mosthospitals are non-profit organizations, have led market observers to question whether tradi-tional models of competitive behavior among firms should be applied to hospitals. Paperssuch as Noether (1988) and Gaynor and Vogt (2003) find ambiguity in whether hospitalscompete in price, quantity, or quality. Luft et al. (1986) find that the effect of rivalry onprovision of specialized clinical services depends significantly on whether the services areintended to directly attract patients, such as twenty-four hour emergency care, or are in-tended to attract physician affiliations and feed patients into further treatment services, aswould likely be the case for diagnostic imaging. A hospital may even have a greater in-centive to provide a service also provided by a rival, independent of complementarity withother decisions, if the Medical Arms Race hypothesis holds.
We turn now to the estimation of adoption decisions regarding SPECT and PET scan-ners. Before considering the econometric specification, we examine the two technologies,the dataset, and assumptions on the data used in the estimation.
3 Empirical Context
3.1 SPECT and PET
The two diagnostic imaging technologies present an appropriate setting for the study ofprofit complementarity in multi-product oligopolies. For many diagnostic purposes, eithertechnology may be used; however, the optimal technology varies across diagnostic proce-dures, especially considering their relative operating costs. In general, PET scans providethe radiologist with substantially better resolution, whereas SPECT scans cover larger areasof the body, utilize a wider variety of radiopharmaceuticals, and have a clear cost advantage.
Both SPECT and PET fall within the category of nuclear medicine imaging, or ra-dionuclide imaging. Whereas CT and MRI scanners provide only a structural view of theinner anatomy, nuclear medicine imaging provides functional and physiological informa-tion. Rather than emitting radiation beams through the patient, as conventional X-rays,mammographs, and CT scanners do, nuclear imaging involves the injection of radiopharma-ceuticals (“tracers”), which emit gamma rays as the small amounts of radioactive material
9

decays in the body. The scanner detects these gamma rays emanating from the patientto reconstruct a two- or three-dimensional image of the organs under study.5 For exam-ple, since cancer cells divide rapidly, they exhibit high rates of metabolic activity. Theytherefore absorb more of the radionuclide material than typical cells and hence show up innuclear images as “hotspots” or “coldspots.” This information enables detection of cancer-ous areas sooner than does either CT or MRI scanning, which look for tumors that haveformed in the tissue. Furthermore, these scans can, in some instances, substitute for inva-sive diagnostic surgery, such as biopsy. However, radionuclide imaging has not yet reachedthe resolution possible with CT and MRI scans, and hence they are not widely used inareas such as mammography and are often preceded by a CT or MRI scan.
Scanning technologies involving radioisotopes actually predate even CT scanning. How-ever, the advent of CT and MRI rendered obsolete the need to inject patients with radioac-tive materials. Recently, however, as technology has made the process safer and moreuseful, nuclear imaging has found an important place in early diagnosis of cancer, epilepsy,cardiac disease, and other particular maladies.
SPECT is the cheaper and more widely available of the two technologies. The SPECTscanners form the organ image using a gamma camera that detects the gamma rays emittedfrom the decay of the radioisotope that has been injected into the patient. While the prin-cipals of SPECT imaging were developed in the 1960s and prototypes had been developedby the late 1970s, the SPECT scanner did not become a clinically available technology untilthe late 1980s.
PET scanners detect gamma rays from two emission sources. They therefore tend tohave better resolution and give more precise functional information than SPECT scanners.However, whereas PET scans primarily employ the fluorine-18 deoxyglucose (FDG) tracer,SPECT scans can use a variety of tracers, which allows improvements in the sensitivityof the scan by adapting the tracer to the targeted organ. The first PET scanner wasintroduced in 1977 and had made only limited diffusion into hospitals as of 1998, the yearof our data. Because PET scans involve the use of a tracer with a very high rate of decay,PET scanners must be located very near a cyclotron that generates these radioisotopes.This contributes to the very substantial costs of providing PET service.
Both scanners are manufactured by essentially the same set of firms, dominated byGE and Siemens. Given the oligopoly structure of the scanner market, one may questionwhether adoption costs are invariant to the hospital market structure as we have assumed.Since the suppliers of these machines enjoy substantial market power, they may employprice discrimination based on the market environment in which the purchasing hospitaloperates. If we assume, intuitively, that the suppliers wish to sell as many types of machinesto as many hospitals as it can, then the suppliers would likely partially compensate for anyprofit complementarity between the adoption decisions. That is, a supplier may be awarethat a hospital facing no rivals in either technology faces stronger self-cannibalization injoint adoption. The supplier may then offer the dual-technology bundle to such a hospitalat a substantial discount over that for a hospital facing rivals with one or more of thetechnologies. The data provides no means of controlling for this effect because we do notobserve the make or price of the scanner purchased by the hospital. If this effect is present,then it will diminish the changes in profit complementarity over market structures. Thatis, the presence of this effect, and the inability to control for it, would bias the apparentchanges in profit complementarity towards zero.
5See Lopes and Chepel (2004) and Spencer et al. (1995) for a detailed description and comparison of thetwo imaging techniques.
10

The fixed costs of adopting the two technologies differ enormously. While SPECT facil-ities can be constructed for under one million dollars, PET facilities, especially given thatan on-premises cyclotron is often required to generate the tracer, are far more expensive.Keppler and Conti (2001) estimate the costs of building a PET facility as ranging from$1.4 to $6.2 million, depending on the quality of the scanner and whether a cyclotron isinstalled. Furthermore, the average variable costs of PET scans typically exceed those ofSPECT scans, although the costs of both vary substantially over diagnostic procedures.One should note that Berger et al. (2003) finds little difference in the average cost of PETscans between those for which the FDG tracer was manufactured on premises for those forwhich the FDG tracer was purchased from a local manufacturer.
Given the substantial fixed costs of providing each service, one would speculate thatsubstantial economies of scale are present in the provision of each if typical utilization isbelow capacity. Indeed, both Berger et al. (2003) and Keppler and Conti (2001) arguethat per-scan PET costs decrease strongly with quantity. While SPECT scans would alsoexhibit strong economies of scale at lower production levels, the utilization rates of thistechnology tend to be higher, even reaching capacity at some institutions.
The substantial fixed costs shared between adoption of the two technologies is as animportant feature of this context. The adoption of either technology generally requires thedevelopment of a nuclear medicine division of the hospital’s radiology department; however,this cost would occur only once when adopting both technologies. Furthermore, radiologistsand technicians trained in the one of the technologies are most likely trained in the otheras well, reducing the incremental cost of recruiting personnel. These shared fixed costscontribute to economies of scope in the joint provision of the two services. On the otherhand, that the two services share labor input of radiologists and technicians implies likelydiseconomies of scope in variable costs that counter the economies of scope from fixed costs.
An economist may be tempted to view the two technologies as vertical substitutes.PET technology, given its better resolution and far higher cost, would be seen as the highquality scanner, whereas SPECT technology would be seen as the low quality, cost-savingtechnology. While not a bad approximation when analysis is restricted to specific diagnosticareas, one should be cautious about imposing this view in general. Several studies, includingBairey Merz and Berman (1997) and Spencer et al. (1995), have identified cases for whichSPECT is the superior diagnostic technology. The Spencer et al. (1995) study demonstrateseven quality variation within diagnoses of similar types of pathoses (e.g. types of epilepsy).For the most part, the analysis and estimation of hospital adoption decisions takes anagnostic view regarding the precise substitution patterns present on the demand-side. Wedo assume that consumers view the services as substitutes; however, both vertical andhorizontal differentiation should generate the sort of profit complementarity patterns thatwe investigate.
In particular, one should note the prevalence of SPECT use in cardiological diagnosticsduring the late 1990s. Bairey Merz and Berman (1997) conclude that the gain in resolu-tion from PET over SPECT does not justify the difference in cost. Furthermore, Medicarereimbursement for PET diagnostics was more or less limited to oncology. The very fewcardiological PET diagnostic procedures eligible for reimbursement, such as mycardial via-bility, were eligible only when a previous SPECT scan was inconclusive. We will exploit thedominance of SPECT in cardiology to aid in identification through exclusion restrictionsfor cardiology services on PET profitability.
11

3.2 Data
Hospital markets are defined using the 802 Health Service Area (HSA) divisions delineatedby Makuc, et al. (1991). This partition of U.S. counties has been utilized in other studieson medical technology, including Baker (2001), Dafny (2003), and Schmidt-Dengler (2005).Because HSA’s were designed to approximate markets for hospital-based health care ser-vices, they form a more appropriate definition than the more general-purpose divisionssuch as the Metropolitan Statistical Areas used in Noether (1988). However, one shouldnote that HSA’s were constructed from data on Medicare patient flow between counties forroutine medical services. As SPECT and PET service are beyond routine care, this marketdefinition is likely too narrow. One would expect that a patient would be willing to travela farther distance for a technologically intensive service like diagnostic imaging than forroutine health services. Hence, the definition used presumably understates the true extentof the market for these services. Alternative approaches include markets based on a fixedradius, as in Robinson and Luft (1985) and Luft et al. (1986), or markets that account forflow from neighboring markets, as in Dranove, Shanley, and Simon (1992).6 Certainly, nodefinition perfectly captures the true reach of strategic interaction among hospitals. TheHSA is chosen as the definition mainly because it was designed to estimate markets forhospital services, despite the fact that the markets for SPECT and PET service are proba-bly broader than the markets for basic services. In addition, that the HSA’s are defined asgroups of counties facilitates aggregation of county-level data to obtain the relevant marketcharacteristics.
We assume that the set of hospitals in each market is exogenous to the adoption deci-sions. That SPECT and PET services are relatively small components of a hospital’s overalloperations justifies this assumption. We then have in each market a fixed, observable setof potential adopters of the two technologies. One qualification that arises is the questionof whether there exist free-standing SPECT and PET diagnostic imaging centers that maycompete with hospital-based services. While the number of free-standing clinics providingSPECT and PET service has grown in recent years, they did not have a substantial enoughpresence in the late 1990’s to pose a problem to our estimation.
County-level data was acquired from the Area Resource File (ARF), which combinesdemographic data obtained from the U.S. Census with specialized data related to health carefrom the American Medical Association, the Centers for Medicare and Medicaid Services,and other sources. Data from 1998 on population size, median household income, HMOpenetration, and Medicare penetration were aggregated up to the HSA level to form themarket characteristics.
Hospital characteristics, including whether or not SPECT and PET are offered, aredrawn from the 1999 AHA Guide, which was compiled from the 1998 American HospitalAssociation (AHA) Annual Survey. The guide provides a directory listing of almost allhospitals in the United States in 1998. The relevant information for this study include thehospital’s county, control type, service type, system membership, exogenous characteristicsof the hospital such as bed size and outpatient visits, and list of facilities. To be includedin the sample, the institution must be a non-federal general medical and surgical hospitallocated in the forty-eight continental states.7 In addition, hospitals with missing informa-tion were not included. Of the over six thousand entries in the directory, only 3135 wereadmissible based on this criteria.
6See Dranove, Shanley, and Simon (1992) for a discussion of how market definition in studies of hospitalcompetition may bias estimation.
7Hospitals in Alaska, Hawaii, and the U.S. territories were not assigned Health Service Area (HSA) codes.
12

The AHA Guide (1999) provides listings for three types of associations among hospitalsthat may indicate joint decision: systems, networks, and alliances. A system is defined bythe Guide as “two or more hospitals that are owned, leased, sponsored, or contract managedby a central organization.” A network is defined as “a group of hospitals, physicians, otherproviders, insurers, and/or community agencies that work together to coordinate and delivera broad spectrum of services to their community.” Finally, an alliance is defined as “a formalorganization, usually owned by shareholders/members, that works on behalf of its individualmembers in the provision of services and products and in the promotion of activities andventures.” While all three associations indicate a certain degree of coordination that mayaffect provision of diagnostic services, we assume that adoption decisions are coordinated atthe the hospital system level. One should note that there appears to be strong correlationin the composition of the three associations, with many networks and alliances consistingonly or principally of hospitals within the same system. While hospital networks haveattracted scrutiny recently from antitrust agencies as possibly enabling some degree ofprice coordination, Burgess, Carey, and Young (2005), in their study of California hospitalnetworks, find that evidence for joint pricing is strongest in networks of hospitals underthe same system and find only weak evidence of price coordination in networks of hospitalsacross systems.8
Given our focus on strategic interaction among hospital oligopolists, the presence ofmarkets with a large number of competing hospitals complicates our analysis. In suchmarkets, hospitals most likely compete with only a subset of the other hospitals; however,the data does not permit us to distinguish hospitals that are linked strategically in thesemarkets. Furthermore, because we model strategic interaction as a simultaneous game ofimperfect information regarding opponents’ adoption, to assume that all hospitals competewith all others raises quite exorbitantly the dimensionality of the computation of expectedopponent adoption in these large markets. Therefore, we limit our sample to those marketsfor which we observe no more than seven hospitals.
This restriction to small markets leaves 2011 observations in 641 markets. In the sample,there are 125 monopoly hospital markets, 172 duopolies, 155 triopolies, and decreasingnumbers of hospitals in markets of four to seven rival hospitals. Note that these figurescount rival hospitals: that is, hospitals from distinct hospital systems. For example, eightof the monopoly markets contained more than one hospital, all of which were managed bythe same hospital system.9
With only six percent of the sample adopting PET, and only one and a half percentadopting PET without also adopting SPECT, the low variation in this component of thedependent variable is cause for concern. Nevertheless, there should be sufficient variationin the choice proportions across market structures to enable estimation, so long as we areparsimonious with the characteristics that enter PET profitability and the profit comple-mentarity between the two services.
One should also note that the sample substantially underrepresents teaching hospitalsbecause of our exclusion of large hospital markets. When these markets are included,teaching hospitals constitute six percent of the hospitals, whereas in the sample used for
8As Burgess, Carey, and Young (2005) note, hospitals already in the same system may form networks tobetter share information and coordinate decisions among employees.
9The market comprised of the Minnesota counties Cottonwood, Jackson, Murray, and Nobles containedfive hospitals, all of which were run by Sioux Valley Hospitals and Health System of Sioux Falls, SD. Themarket comprised of the Iowa counties Cerro Gordo, Franklin, Hancock, Kossuth, Winnebago, and Worthcontained four hospitals, all run by Mercy Health Services of Farmington Hills, MI. The other six monopolymarkets contained two hospitals.
13
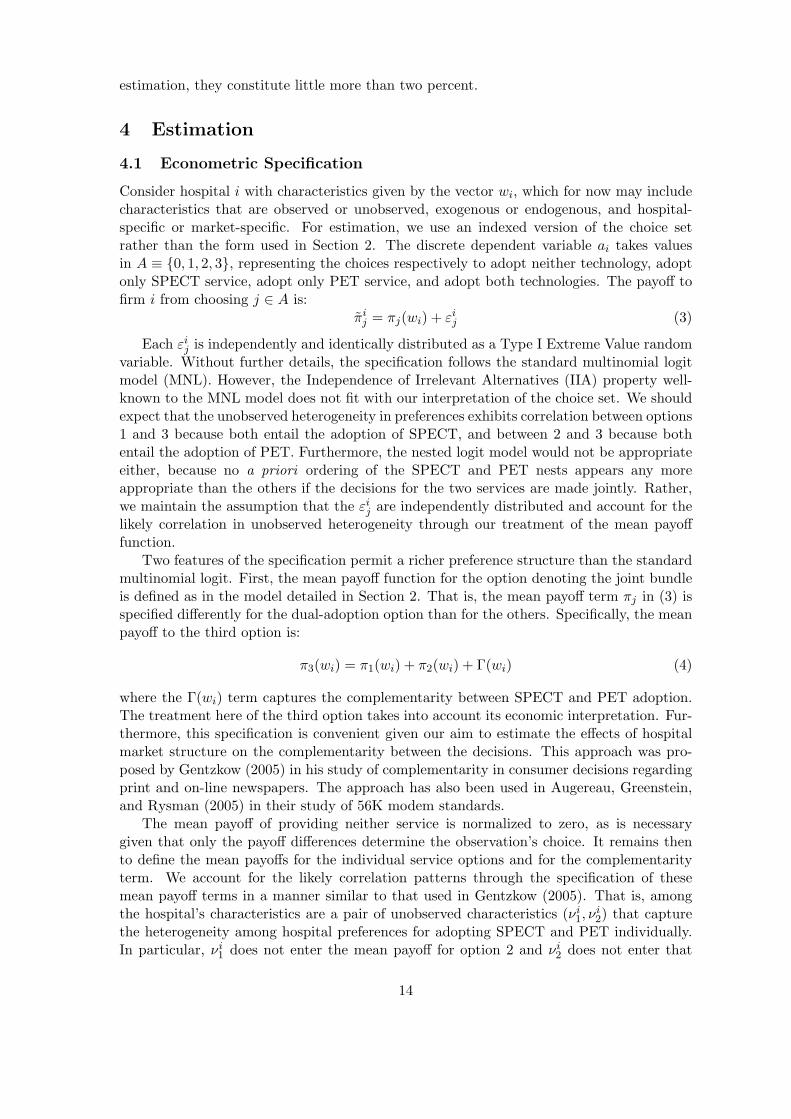
estimation, they constitute little more than two percent.
4 Estimation
4.1 Econometric Specification
Consider hospital i with characteristics given by the vector wi, which for now may includecharacteristics that are observed or unobserved, exogenous or endogenous, and hospital-specific or market-specific. For estimation, we use an indexed version of the choice setrather than the form used in Section 2. The discrete dependent variable ai takes valuesin A ≡ {0, 1, 2, 3}, representing the choices respectively to adopt neither technology, adoptonly SPECT service, adopt only PET service, and adopt both technologies. The payoff tofirm i from choosing j ∈ A is:
πij = πj(wi) + εij (3)
Each εij is independently and identically distributed as a Type I Extreme Value randomvariable. Without further details, the specification follows the standard multinomial logitmodel (MNL). However, the Independence of Irrelevant Alternatives (IIA) property well-known to the MNL model does not fit with our interpretation of the choice set. We shouldexpect that the unobserved heterogeneity in preferences exhibits correlation between options1 and 3 because both entail the adoption of SPECT, and between 2 and 3 because bothentail the adoption of PET. Furthermore, the nested logit model would not be appropriateeither, because no a priori ordering of the SPECT and PET nests appears any moreappropriate than the others if the decisions for the two services are made jointly. Rather,we maintain the assumption that the εij are independently distributed and account for thelikely correlation in unobserved heterogeneity through our treatment of the mean payofffunction.
Two features of the specification permit a richer preference structure than the standardmultinomial logit. First, the mean payoff function for the option denoting the joint bundleis defined as in the model detailed in Section 2. That is, the mean payoff term πj in (3) isspecified differently for the dual-adoption option than for the others. Specifically, the meanpayoff to the third option is:
π3(wi) = π1(wi) + π2(wi) + Γ(wi) (4)
where the Γ(wi) term captures the complementarity between SPECT and PET adoption.The treatment here of the third option takes into account its economic interpretation. Fur-thermore, this specification is convenient given our aim to estimate the effects of hospitalmarket structure on the complementarity between the decisions. This approach was pro-posed by Gentzkow (2005) in his study of complementarity in consumer decisions regardingprint and on-line newspapers. The approach has also been used in Augereau, Greenstein,and Rysman (2005) in their study of 56K modem standards.
The mean payoff of providing neither service is normalized to zero, as is necessarygiven that only the payoff differences determine the observation’s choice. It remains thento define the mean payoffs for the individual service options and for the complementarityterm. We account for the likely correlation patterns through the specification of thesemean payoff terms in a manner similar to that used in Gentzkow (2005). That is, amongthe hospital’s characteristics are a pair of unobserved characteristics (νi
1, νi2) that capture
the heterogeneity among hospital preferences for adopting SPECT and PET individually.In particular, νi
1 does not enter the mean payoff for option 2 and νi2 does not enter that
14

for option 1. We assume that these characteristics are independently distributed acrosshospitals; however, the two characteristics for the same hospital need not be independentof each other.
Combined with our treatment of the mean payoff of the dual-adoption option, the terms(νi
1, νi2) will allow for correlation in unobserved heterogeneity among the options. To see
this, consider an expression of payoffs where these terms have been removed from wi andπj :
πi1 = π1(wi) + νi
1 + εi1
πi2 = π2(wi) + νi
2 + εi2
πi3 = π1(wi) + π2(wi) + Γ(wi) + νi
1 + νi2 + εi3
Even though εi1 and εi3 are independent, the unobserved preference for SPECT (νi1 + εi1)
will correlate with that of both SPECT and PET (νi1 + νi
2 + εi3), and likewise for those ofPET and both SPECT and PET. Correlation in unobserved preferences for SPECT andPET would be captured by correlation between νi
1 and νi2.
We assume that νi1 and νi
2 follow a bivariate normal distribution with zero means,variances σ2
1 and σ22, and correlation parameter ρ. A positive value of ρ would indicate
that hospitals that tend to be more profitable in adopting SPECT also tend to be moreprofitable in adopting PET, even if no profit complementarity exists between the two.Such positive correlation would also capture unobserved heterogeneity among hospitals inthe preference for technology overall. Negative correlation, on the other hand, may implyunobserved gains from specialization in one of the imaging services. The correlation actuallypresents an identification problem in that correlation between νi
1 and νi2 has a similar effect
on the payoffs as the complementarity term Γ. This issue will be discussed further in thesubsection on identification below. The other random terms, the εij ’s, capture the remainingidiosyncratic preferences over the alternatives.
To capture the strategic nature of the decisions, let ri1 and ri
2 denote the number of rivalhospitals in hospital i’s market that adopt SPECT and PET respectively. Note that thesevariables count neither hospital i nor any hospital in the same system as i. The question ofendogeneity with respect to the variables ri
1 and ri2 immediately arises. In hospital markets
with favorable unobserved conditions for SPECT, we would expect to see higher numbersof firms operating in this submarket. These same conditions would make hospital i morelikely to adopt SPECT. Since these conditions are unobserved, the problem becomes one ofomitted variable bias that induces correlation between ri
1 and εi1 or νi1. The same problem
of course arises between ri2 and εi2 or νi
2.To address this issue, we take the approach of Seim (2004) and model the strategic
interaction among rival hospitals as a simultaneous discrete game of imperfect information.Instead of observing the number of rival adopters, hospital i forms beliefs regarding thechoice probabilities, P−i, of its rivals and uses these beliefs to construct expectations ofhow many rivals it would face in each service. With these beliefs and the hospital’s observ-able exogenous characteristics xi, the expected profitability of the individual adoptions arespecified:
π1(xi, P−i, νi) = α1 + x′iβ1 + δ11E
[ln(1+ri
1)∣∣P−i
]+ δ12E
[ln(1+ri
2)∣∣P−i
]+ νi
1
π2(xi, P−i, νi) = α2 + x′iβ2 + δ21E
[ln(1+ri
1)∣∣P−i
]+ δ22E
[ln(1+ri
2)∣∣P−i
]+ νi
2 (5)
The use of the logarithm in (5) gives the payoffs the desirable property that the marginaleffect on profits of additional rival adoption decreases with the number of rivals. That is,
15

the adoption by a third firm would have less of an effect on profits than the adoption by asecond firm, and so on. This functional assumption was proposed by Berry (1992) and hasbecome fairly standard in discrete choice entry models.
The complementarity term is similarly specified:
Γi(P−i) = α3 + x′iβ3 + δ31E[ln(1+ri
1)∣∣P−i
]+ δ32E
[ln(1+ri
2)∣∣P−i
](6)
In the actual estimation, we exclude from the complementarity term the exogenous char-acteristics xi, with the exception of the number of rival hospitals present in the hospitalmarket. These restrictions are not innocuous, as it is conceivable that many of the samecharacteristics that effect the profitability of providing SPECT or PET service also effectthe degree to which the two services interact. Nevertheless, given that our focus is on theeffects of the strategic variables, these exclusions are reasonable in the interest of parsimony.
One might ask why Equations (5) and (6) do not include a term dependent on thenumber of rivals in both submarkets. Such a term is excluded mainly for simplicity. Thespecifications of the profitability of the individual services and the complementarity betweenthem represent an environment where a hospital loses some business to each rival in eachsubmarket, but is unaffected by the identities of these rivals and their other enterprises. Aricher model of the underlying competition may take into account a hospital’s incentives tosignal quality through the provision of multiple services and even some coordination amongrival firms that operate together in both submarkets. In such cases, the inclusion of a termfor the number of hospitals that operate in both markets may be appealing, even if theidentities of the rivals are still brushed aside. In the present context, however, we envisionthat a hospital does not care that a rival is present in both markets, only that the rival isstealing business in each of the submarkets.
Equations (5) and (6) complete the specification of the option payoff functions:
π0(xi, P−i, νi) = 0
π1(xi, P−i, νi) = α1 + x′iβ1 + δ11E
[ln(1+ri
1)∣∣P−i
]+ δ12E
[ln(1+ri
2)∣∣P−i
]+ νi
1
π2(xi, P−i, νi) = α2 + x′iβ2 + δ21E
[ln(1+ri
1)∣∣P−i
]+ δ22E
[ln(1+ri
2)∣∣P−i
]+ νi
2
π3(xi, P−i, νi) = π1(xi, P−i, ν
i) + π2(xi, P−i, νi) + Γ(P−i) (7)
A hospital’s beliefs about its rivals’ choice probabilities will be determined by whatinformation about the rival the hospital observes. The following assumption characterizesthe information available to hospitals.
Assumption 2. All exogenous market characteristics and hospital characteristics of eachhospital in the market (i.e. all xi) are observable to every hospital in the market. Theterms νi
1, νi2, and εij for j ∈ A are privately known to hospital i.
Assumption 2 effectively states that rivals to hospital i observe no more informationabout i than does the econometrician.10 The assumption is admittedly strong. We wouldexpect that hospitals would have better information about their rivals, having interactedwith them in the market repeatedly, than does an outside observer. One might desire tomodel this informational feature by allowing rival hospitals to observe νi
j , perhaps imper-fectly, and allow hospital i to retain εij as private information. For our purposes, such anembellishment would come at great computational cost because we would have to integrate
10In fact, they observe less because they do not see ai.
16
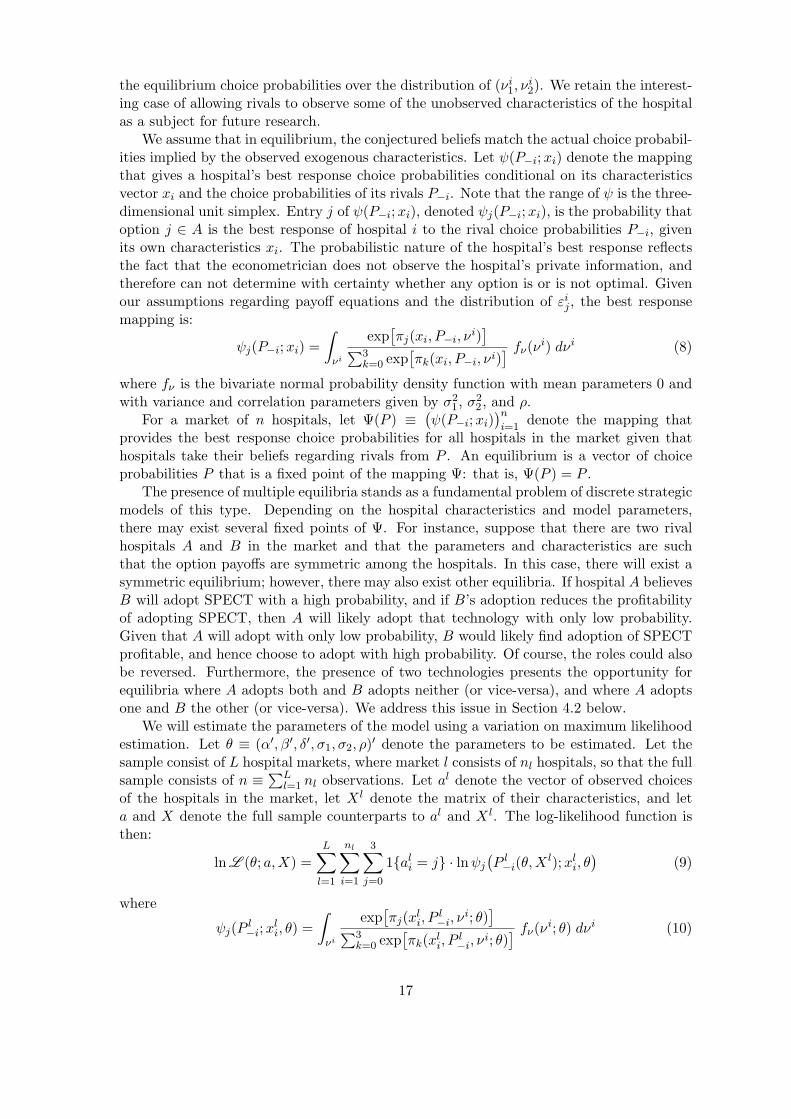
the equilibrium choice probabilities over the distribution of (νi1, ν
i2). We retain the interest-
ing case of allowing rivals to observe some of the unobserved characteristics of the hospitalas a subject for future research.
We assume that in equilibrium, the conjectured beliefs match the actual choice probabil-ities implied by the observed exogenous characteristics. Let ψ(P−i;xi) denote the mappingthat gives a hospital’s best response choice probabilities conditional on its characteristicsvector xi and the choice probabilities of its rivals P−i. Note that the range of ψ is the three-dimensional unit simplex. Entry j of ψ(P−i;xi), denoted ψj(P−i;xi), is the probability thatoption j ∈ A is the best response of hospital i to the rival choice probabilities P−i, givenits own characteristics xi. The probabilistic nature of the hospital’s best response reflectsthe fact that the econometrician does not observe the hospital’s private information, andtherefore can not determine with certainty whether any option is or is not optimal. Givenour assumptions regarding payoff equations and the distribution of εij , the best responsemapping is:
ψj(P−i;xi) =∫
νi
exp[πj(xi, P−i, ν
i)]∑3
k=0 exp[πk(xi, P−i, νi)
] fν(νi) dνi (8)
where fν is the bivariate normal probability density function with mean parameters 0 andwith variance and correlation parameters given by σ2
1, σ22, and ρ.
For a market of n hospitals, let Ψ(P ) ≡(ψ(P−i;xi)
)n
i=1denote the mapping that
provides the best response choice probabilities for all hospitals in the market given thathospitals take their beliefs regarding rivals from P . An equilibrium is a vector of choiceprobabilities P that is a fixed point of the mapping Ψ: that is, Ψ(P ) = P .
The presence of multiple equilibria stands as a fundamental problem of discrete strategicmodels of this type. Depending on the hospital characteristics and model parameters,there may exist several fixed points of Ψ. For instance, suppose that there are two rivalhospitals A and B in the market and that the parameters and characteristics are suchthat the option payoffs are symmetric among the hospitals. In this case, there will exist asymmetric equilibrium; however, there may also exist other equilibria. If hospital A believesB will adopt SPECT with a high probability, and if B’s adoption reduces the profitabilityof adopting SPECT, then A will likely adopt that technology with only low probability.Given that A will adopt with only low probability, B would likely find adoption of SPECTprofitable, and hence choose to adopt with high probability. Of course, the roles could alsobe reversed. Furthermore, the presence of two technologies presents the opportunity forequilibria where A adopts both and B adopts neither (or vice-versa), and where A adoptsone and B the other (or vice-versa). We address this issue in Section 4.2 below.
We will estimate the parameters of the model using a variation on maximum likelihoodestimation. Let θ ≡ (α′, β′, δ′, σ1, σ2, ρ)′ denote the parameters to be estimated. Let thesample consist of L hospital markets, where market l consists of nl hospitals, so that the fullsample consists of n ≡
∑Ll=1 nl observations. Let al denote the vector of observed choices
of the hospitals in the market, let X l denote the matrix of their characteristics, and leta and X denote the full sample counterparts to al and X l. The log-likelihood function isthen:
lnL (θ; a,X) =L∑
l=1
nl∑i=1
3∑j=0
1{ali = j} · lnψj
(P l−i(θ,X
l);xli, θ
)(9)
where
ψj(P l−i;x
li, θ) =
∫νi
exp[πj(xl
i, Pl−i, ν
i; θ)]∑3
k=0 exp[πk(xl
i, Pl−i, ν
i; θ)] fν(νi; θ) dνi (10)
17

and where P l(θ,X l) = Ψ(P l(θ,X l); θ,X l
).
4.2 Identification
Before discussing the estimation procedure, we must address the issue of identification ofthe model. For this purpose, we consider first the identification of the parameters when thetrue equilibrium choice probabilities are known. We then consider the additional challengesbrought about the fact that we do not observe these choice probabilities.
Suppose first that we knew the true choice probabilities P l∗ that characterize the equilib-rium of each market l. If this were the case, P l∗ would be a fixed point of the best-responsemapping at the true parameter values θ∗. If θ∗ is the only parameter vector such thatP l∗ = Ψ(P l∗; θ∗, X l) for all l, then these parameters are identified by the fixed-point map-ping. However, if there exists another parameter vector θ 6= θ∗ such that P l∗ = Ψ(P l∗; θ,X l)for all l, then the model is not identified. Indeed, the log-likelihood function in (9) wouldevaluate to the same values at both θ∗ and θ when evaluated at the true choice probabilities.A necessary condition for identification is therefore:
Assumption 3. There exists a unique vector of parameters for which the true choiceprobabilities constitute an equilibrium. That is, there exists θ∗ ∈ Θ such that for all θ ∈ Θ,θ 6= θ∗, there exists l ∈ {1, . . . , L} such that P l∗ 6= Ψ(P l∗; θ,X l).
One issue, as mentioned above, concerns the constant in the complementarity term(α3) and the correlation parameter (ρ) between the unobserved profitability shocks toSPECT and PET. As noted above, and discussed in Manski (1993), Athey and Stern(1998), Gentzkow (2005), and Augereau, Greenstein, and Rysman (2005), these two pa-rameters have a very similar effect on the choice probabilities. If hospitals tend to provideboth services or neither of them, then this could imply either positive complementarity orpositive correlation in νi
1 and νi2. Likewise, tendency toward specialization in individual
services may be generated by negative complementarity or negative correlation. While thenon-linearity of the choice model may permit separate identification of α3 and ρ, we wouldnot want to rely on this source because it is sensitive to functional form. We observe hos-pital characteristics related to cardiology services that may comfortably be excluded fromthe profit equation of PET adoption, and these exclusions will aid in separating the effectsof the complementarity and the correlation.
The complementarity constant and correlation term, however, are of less interest thanthe parameters δ31 and δ32, which capture the effects of rival entry on complementarity. Ifthe correlation in unobserved heterogeneity changes across market structure, then we havean identification problem with respect to these parameters as well. For identification ofthese parameters, we require the following assumption:
Assumption 4. The correlation between νi1 and νi
2 is not affected by number of rivalhospitals faced by i, nor by the probabilities with which they enter the two submarkets.
The assumption states that market structure has no effect on the unobserved hetero-geneity that generates a tendency for a hospital that is more profitable in one market to bemore or less profitable in the other market. If we imagine that such unobserved heterogene-ity stems from some hospitals being better suited to employ medical technology because ofpersonnel or experience, then the assumption appears reasonable. Once this assumption isimposed, the identification problem presented by the correlation in unobserved heterogene-ity is contained to the identification of the constant level of complementarity between thetwo services.
18

For separate identification of the complementarity constant and the correlation param-eter, we exclude the indicators for cardiology treatment services from PET profitability.With these restrictions, any apparent effect of variation in cardiology services on PETadoption will stem from complementarity between the adoption of the technologies. Tosee this, suppose first that there is no complementarity between the two technologies andthat the presence of cardiology services increases the profitability of SPECT adoption.We should then see that hospitals that offer cardiology services would more likely adoptSPECT. However, there would be no such effect on PET adoption, regardless of whetherthe unobserved preferences are correlated. Now suppose that there is positive complemen-tarity between the adoption decisions. Although the presence of cardiology services doesnot directly affect the profitability of PET adoption, the indirect effect through the increasein SPECT adoption and positive complementarity will serve to increase the likelihood ofPET adoption.
The fact that we do not observe the true choice probabilities presents additional issueswith respect to identification. In particular, as with many strategic models, the presence ofmultiple equilibria at some parameter values complicates the identification question. If forsome X l and θ, the mapping Ψ(· ; θ,X l) has multiple fixed points, then the log-likelihoodfunction in (9) is not well-defined at these values. In such cases, the different equilibria willlikely generate different values for the log-likelihood function and, without an equilibriumselection mechanism, we can not distinguish the “correct” value. If there are multipleequilibria at the true parameter values θ∗, then again the log-likelihood function at thetrue parameters is not well defined and the model is not identified.
We therefore require that the equilibrium at the true parameters be unique. We justifythis assumption by noting the exogenous asymmetry of hospitals in the markets that con-stitute our sample. Multiple equilibria are far more likely in markets for which the firms arenearly symmetric than for markets where substantial asymmetries exist. For example, in amarket with one large hospital and one small hospital, the profits of the large hospital arelikely far less sensitive to rival adoption than those of the small hospital. In the extreme,the hospitals in a simultaneous entry game behave as they would in a sequential adoptiongame where the large hospital moves first. In general, the more exogenous variation in thehospital characteristics among rivals in a market, the more dominating these characteris-tics are relative to the strategic effects in determining the best-response choice probabilities,and hence the less likely two different vectors of choice probabilities would constitute anequilibrium. To check the validity of this assumption, we check that the equilibrium isunique at the estimated parameter values.
While multiple equilibria at other parameter vectors clearly present challenges to thesearch for the parameters, the model is identified so long as the equilibrium at the trueparameters is unique and Assumption 3 holds. To see this, consider the following function:
Υ(P ; a,X
)=
L∑l=1
nl∑i=1
3∑j=0
1{ali = j} · ln pl
ij
where plij is the choice probability of option j for hospital i in market l under the choice
probabilities P . If P 6= P ∗, then there exists a sample of observed choices a such thatΥ(P ; a,X) 6= Υ(P ∗; a,X).
If we allow for multiple equilibria at θ 6= θ∗, then the log-likelihood in (9) becomes acorrespondence. That is, lnL (θ; a,X) =
{Υ(P ; a,X) : P = Ψ(P ; θ,X)
}. Since P ∗ is the
only equilibrium at θ∗, lnL (θ∗; a,X) is single-valued. For identification, we must have thatfor any θ 6= θ∗, there exist samples for which ` 6= lnL (θ∗; a,X) for all ` ∈ lnL (θ; a,X).
19

So long as P ∗ 6= Ψ(P ∗; θ,X), then there exists a sample of observed choices such thatΥ(P ; a,X) 6= Υ(P ∗, a,X) for all P that are equilibria under θ 6= θ∗. By Assumption 3, P ∗
is an equilibrium only under θ∗, and hence ` 6= ln L (θ∗; a,X) for all ` ∈ lnL (θ; a,X).One can think of the estimation problem as jointly estimating the parameters and the
choice probabilities. Sufficient variation in the observed choices will prevent other choiceprobabilities from appearing equally likely as the true probabilities. Sufficient variationin the exogenous hospital characteristics ensures that only the true choice probabilitiesconstitute an equilibrium under the true parameters and that only the true parameters willgenerate the true choice probabilities as an equilibrium.
We now consider the procedure used to estimate the parameters of the SPECT andPET adoption game. We choose an approach that is robust to the presence of multipleequilibria at intermediate parameter values and that is computationally tractable.
4.3 Nested-Pseudo Likelihood Estimation
To estimate the structural parameters, we employ the Nested Pseudo-Likelihood (NPL)algorithm described in Aguirregabiria and Mira (2004) and Aguirregabiria (2004a). Theprocedure involves recursively maximizing a pseudo-likelihood function with respect to theparameters, holding rival choice probabilities fixed, and then updating rival choice proba-bilities by finding an equilibrium under the optimal parameters. An alternative approach,such as in Seim (2004), is to find an equilibrium at every guess of the parameter vectorand then evaluate the likelihood function using those choice probabilities. The NPL hastwo advantages over the nested fixed-point method. First, the pseudo-likelihood function,unlike the actual likelihood function, is always well-defined, even in the presence of multipleequilibria at a particular parameter vector. Secondly, the NPL reduces the number of fixedpoint searches considerably, resulting in substantial computational gains.
While Aguirregabiria and Mira (2004) consider the estimation of a dynamic model withdiscrete exogenous characteristics, we use the approach for the estimation of a static modelwith some continuous characteristics present. The use of the procedure for static modelsinvolving a fixed-point search is described in Aguirregabiria (2004a) and Aguirregabiria(2004b). The fact that we include continuous characteristics does not alter the propertiesof the estimator. The requirement of characteristics with a discrete support is needed indynamic models because such settings require the construction of a global state transitionmatrix. However, we have no need of such transition matrices in static settings.
We define the pseudo-likelihood function similarly to the actual likelihood function in(9). The pseudo-likelihood function takes fixed choice probabilities as an argument, ratherthan having them implicitly defined as a fixed point of the equilibrium mapping under theinput parameters and data, as in the actual likelihood function. The function is then:
lnL P (θ;P, a,X) =L∑
l=1
nl∑i=1
3∑j=0
1{ali = j} · lnψj
(P l−i;x
li, θ
)(11)
The gain from fixing the choice probabilities as an explicit argument is that the pseudo-likelihood function is always well-defined. Of course, a parameter vector that maximizeslnL P at arbitrary choice probabilities is not the maximum likelihood estimate.
How the procedure works is best illustrated by first considering a simpler two-stageestimator. The first stage involves consistently estimating the choice probabilities non-parametrically, which with continuous explanatory variables would require the use of kernel
20

methods. Let P denote this estimator. In the second stage, we then choose θ as:
θ = argmaxθ∈Θ
lnL P (θ; P , a,X) (12)
Aguirregabiria and Mira (2004) show that this two-stage estimator is consistent and asymp-totically normal. Notice that this estimator overcomes the problem of multiple equilibria bylooking to the data, including the observed choices, to select choice probabilities. Note alsothat it does not require an equilibrium search. The two-stage estimator, while convenient,may suffer from severe finite sample bias if the choice probabilities are poorly estimated. Incontexts with many explanatory variables, like the present one, non-parametric estimatorsof the choice probabilities, while consistent, may be very imprecise. The precision of theresulting parameter estimates will suffer as a result.
By iterating further, we not only improve on the two-stage estimator, but we are alsoable to drop the requirement that the initial estimator of the choice probabilities be consis-tent. Starting with an initial guess of the choice probabilities P 0, we maximize the pseudo-likelihood function in (12) to obtain a parameter vector θ1. We then find an equilibrium P 1
by finding a fixed point of the equilibrium mapping under θ1. We repeat this process untilfurther iterations do not change the guess of the equilibrium choice probabilities. Uponconvergence of the algorithm, we have an estimate of the parameter vector θ and of theequilibrium choice probabilities P . We initialize the search at multiple initial guesses andif these initial guesses result in convergence to different points, we choose as the estimatethe resulting parameters and choice probabilities that have the highest pseudo-likelihoodvalue.11
One should note that convergence of the NPL is not guaranteed in general. Thatis, the search could potentially enter a cycle among several parameter vectors and choiceprobabilities. In most of the specifications and trials run for the present investigation, thealgorithm converged. In cases where it did enter a cycle, the culprit always was lack ofseparate identification of the parameters due to the limitations of the sample.
If the NPL does converge, then the resulting estimator (θ, P ) is consistent and asymp-totically normal. One can find the full proof of these properties in Aguirregabiria and Mira(2004) and we summarize the argument for consistency in Appendix B. The asymptoticcovariance matrix, however, is a cumbersome function of the pseudo-score variances andthe Jacobian of the choice probabilities. The standard errors can also be estimated via abootstrap method, which will also provide a better idea of the finite sample variance.
To implement the NPL algorithm, we use successive approximations to find a fixedpoint of Ψ for each market, given the current values of the parameters. In both computingthe pseudo-likelihood and updating the choice probabilities through the mapping Ψ, we useMonte Carlo integration to approximate the integral in (8). Specifically, for each observa-tion, we draw S realizations from the bivariate normal distribution under the parameters(σ2
1, σ22, ρ) and compute the approximated integral as:
ψSj (P−i;xi, ν
i) = S−1S∑
s=1
exp[πj(xi, P−i, ν
is)
]∑3k=0 exp
[πk(xi, P−i, νi
s)] (13)
One should note that the simulated maximum likelihood approach used exhibits sim-ulation bias in the evaluation of the log-likelihood function. While ψS
j is an unbiased
11This rule was never binding. All starting choice probabilities in each experiment resulted in convergenceto the same choice probabilities and parameters.
21
estimator for ψj , the estimator ln ψSj , while consistent, is biased for lnψj with a finite num-
ber of replications. Note that this bias does not appear in the equilibrium search becausethe the equilibrium search uses the level of the choice probabilities rather than the loga-rithm. To reduce the simulation bias, we draw the simulated characteristics using Haltonsequences as described in Train (1999). We use 500 replications in the actual estimationsand note that the parameter estimates do not change substantially by increasing the numberof replications beyond this level.
One can find further details regarding the implementation in Appendix B. The al-gorithm performed very well in most cases. The successive approximations equilibriumsearch rarely took more than a handful of iterations through the hospitals. The rapiditylikely stems from the use of the logistic form for the choice probabilities, the wide varia-tion in exogenous hospital characteristics, and the additional smoothing provided by thetechnology-specific errors. Even with rather strict convergence criteria, the outer NPL looprarely exceeded thirty iterations.
5 Results
Given that most consumers view these scanning services as substitutes, and given thatprice competition among hospitals for diagnostic imaging services is likely low relativeto conventional markets, we expect that profit complementarity increases as each servicemarket becomes more competitive. The intuition again is that the additional cross-hospitalcannibalization in quantity that comes from adoption by rivals decreases the potential forself-cannibalization from offering both services as opposed to only one. The additional pricecompetition from rival adoption should not be intense enough to counter this effect. Thelevel of complementarity for monopolist hospitals will depend on how strong the sharedadoption costs are relative to the self-cannibalization effect. If the shared component offixed adoption costs is not too high relative to the self-cannibalization effect, then wewould expect profit complementarity to be negative for hospitals in monopoly markets andto grow toward zero as the hospitals face more competitors in each of the service markets.Otherwise, we would expect profit complementarity to start positive for monopolists andgrow as we see more rival adoption.
Both profit equations for the individual technologies include as explanatory variablesthe log values of bed size and outpatient visits. These continuous variables provide a highdegree of exogenous variation among hospitals in a market.12 In addition, indicators fornon-profit status and community hospital status were included in both equations, privatefor-profit hospitals being the reference group.
An indicator for whether the hospital offers oncology services is included in the profitequations of both technologies. Hospitals that offer cancer treatment services will likely ben-efit more from offering these technologies, which tend to perform well and are commonlyused in cancer diagnosis. Adopting these technologies and offering cancer-related diagnos-tic services will feed patients into the treatment services, hence raising the profitabilitiesrelative to hospitals that do not offer oncology services. Indicators for cardiac catheteri-zation laboratory (CCL), angioplasty, cardiac intensive care, and open-heart surgery wereincluded in SPECT profitability, but excluded from the profitability of PET, reflecting the
12One may argue that outpatient visits has an endogenous component because they are affected bythe adoption decisions. However, the contribution of SPECT and PET services to the overall number ofoutpatient visits and to overall expenditure is sufficiently small that the exogeneity of these variables is veryreasonable.
22

far greater usage of SPECT in cardiology. The presence of these indicators implies thata hospital is strong in cardiology. Since SPECT technology tends to perform better incardiology diagnostics, we would expect that these hospitals would be more likely to adoptSPECT. On the other hand, the presence of these services should have no substantive directeffect on PET profitability, and are therefore excluded from PET profitability. As discussedin Section 4.2, these exclusion restrictions help to separately identify the complementarityconstant from the correlation in unobserved preferences.
An indicator for teaching hospitals was included in the SPECT equation; however, itcould not be included in the PET equation because of collinearity with the constant termin PET profitability (no teaching hospital in the sample adopted only PET).
Both equations include the log values of population and median household income andthe levels of HMO and Medicare Part B penetration as exogenous market characteristics.These variables capture heterogeneity among hospital markets that may affect the prof-itability of adopting each technology. Larger and wealthier hospital markets should raisethe profitability of adopting each technology by raising prospective utilization. Rival hos-pitals in markets with relatively high HMO penetration may engage in more intense pricecompetition, and hence we would expect that higher HMO penetration reduces the prof-itability of providing SPECT or PET service. Note that while Medicare covered a varietyof diagnostic procedures relating to SPECT, Medicare PET coverage had just been intro-duced in 1998 and was limited to a very restricted group of cancer-related diagnostic groups.A patient covered by Medicare would therefore face higher opportunity costs in getting aPET scan as opposed to a SPECT scan relative to non-Medicare patients. Higher Medicarepenetration should therefore shift the demand curve for PET and make the provision ofthis service, and hence adoption of this technology, less profitable.
As we have discussed, patient-feeding behavior on the part of hospitals would predictthat both the profitability of the individual technologies and the complementarity betweenthem will be affected by the number of hospitals in the market. We include the log of thenumber of hospitals in the individual profitability equations and in the complementarityequation. Given that much of the effect of an increase in the number of hospitals on theprofitability of an individual technology likely stems from the additional competition intreatment services, the effect on the two individual profitabilities should be symmetric. Toimprove the precision of our estimates, we impose this restriction.
For the endogenous characteristics, we include the expected number of rival adopters ofthe SPECT and the expected number of rival adopters of PET in both profit equations. Weinclude the cross terms because the services are substitutes to consumers and therefore rivaladoption of one technology should affect the profitability of adopting the other, independentof profit complementarity between the technologies. These expectations are also includedin the profit complementarity equation. All three equations contain constant terms.
5.1 Bivariate Probit Estimation
Before presenting the results of the structural estimation, we first consider a bivariate pro-bit estimation of the adoption decisions. This first specification does not account for anycomplementarity between the two technologies. If there exists profit complementarity, thenthis complementarity will affect the estimate of the correlation parameter of the bivariateerror distribution. We look for changes in profit complementarity by running the estima-tion over restricted samples: that is, we run the estimation for disjoint samples consistingof markets with one through four hospital systems present. If profit complementarity in-creases as hospital markets become more competitive, we should see higher estimates of the
23
correlation parameter in markets with more rival hospitals present. Under Assumption 4,the actual correlation in unobserved heterogeneity is not affected by the competitive envi-ronment. Apparent changes in correlation across market structure will stem from changingprofit complementarity.
Only a subset of the variables used in the main specification could be included in thebivariate probit estimation on restricted samples. We observe only 139 observations inmonopoly markets and this subsample lacks sufficient variation in several of the variablesto enable estimation of the full set of parameters. For the sake of comparison, we maintainthe same set of variables for all subsamples.
Table 1 holds the parameter estimates for the bivariate probit specification. Of par-ticular interest is the estimate of the correlation parameter. For monopoly markets, theestimate is negative, though not significantly so. For the duopoly subsample, the estimatedparameter is positive, but only marginally significant. However, for the subsamples of mar-kets with three and four rivals, the correlation is very significantly positive. While the lackof precision for most of the parameter estimates for the monopoly subsample make inferenceproblematic, the fact that the correlation between the profitability of the two technologiesappears to increase provides at least preliminary evidence that complementarity betweenthe two technologies is greater in more competitive markets.
Note that we can not separately identify the contributions of the complementarity andthe correlation in unobserved preferences factor in any single subsample using this speci-fication. However, only the complementarity should change as the market becomes morecompetitive. If the individual profitabilities are positively correlated, then the more stronglynegative profit complementarity in monopoly markets counters this actual correlation anddecreases the apparent correlation for these markets. For the subsamples with three or fourrivals in each market, the self-cannibalization effect is less strong and hence the level ofprofit complementarity has less effect on the apparent correlation. Again, precise inferenceis difficult in this specification; however, the change in the estimated correlation acrossthese subsamples fits the pattern we would expect.
Since this specification does not explicitly include the strategic variables in the specifica-tion, one may wonder whether the changes in the individual profitabilities of the technologiesover market structure, rather than the profit complementarity between the technologies,could be driving the apparent change in correlation. Adoption by a rival of even just oneof the technologies should decrease the profitability of adopting both technologies becausethe two imaging services are substitutes to consumers. Hospitals in markets with morerivals should expect more rival adoption of one or both of the technologies, and hence theirexpected profitability from adoption of both technologies will be lower. However, since theindividual profitabilities move in the same direction, the effect of additional rivals on theindividual profitabilities should not influence the estimate of the correlation between thetwo technologies.13
5.2 NPL Estimation
Table 2 presents parameter estimates for the structural specification. One should note animportant qualification of the results. The reported standard errors are those based onthe Hessian of the pseudo-likelihood function at the final parameter estimates. These are
13If the Medical Arms Race hypothesis holds, then adoption by a rival of one of the technologies mayprovide greater incentive to adopt that technology and the other. If this is the case, then the profitabilityof adoption of both will appear to increase with rival adoption. The same logic applies: the key is that theprofitabilities of the individual technologies move in the same direction.
24

Table 1: Bivariate Probit Specification
ρ n = 1 n = 2 n = 3 n = 4 all
-0.037 0.307 0.600 0.468 0.345(0.236) (0.155) (0.108) (0.137) (0.075)
SPECT n = 1 n = 2 n = 3 n = 4 all
Constant -7.458 -3.690 -5.358 -6.807 -6.024(8.313) (5.358) (4.103) (5.329) (2.553)
Beds(log) 0.182 0.030 0.267 0.299 0.208(0.251) (0.133) (0.105) (0.120) (0.063)
Outpat.(log) 0.285 0.445 0.178 0.227 0.244(0.206) (0.116) (0.084) (0.101) (0.052)
Community -0.218 -0.044 -0.163 -0.210 -0.164(0.275) (0.170) (0.142) (0.165) (0.084)
Oncology 0.754 0.474 0.649 0.307 0.506(0.301) (0.184) (0.154) (0.179) (0.092)
Heart Surg. 0.269 0.402 0.216 0.077 0.221(0.373) (0.237) (0.188) (0.205) (0.111)
Pop. (log) 0.256 0.217 -0.152 0.321 0.097(0.213) (0.178) (0.132) (0.233) (0.081)
HMO -0.651 0.005 -0.734 -0.487 -0.411(1.530) (0.702) (0.679) (0.666) (0.368)
Medicare 5.771 -3.318 0.326 1.539 0.551(3.986) (2.982) (2.097) (2.697) (1.299)
Income (log) -0.064 -0.378 0.314 -0.131 0.066(0.755) (0.475) (0.373) (0.478) (0.230)
PET n = 1 n = 2 n = 3 n = 4 all
Constant 6.459 -7.197 1.204 11.949 0.943(11.139) (8.066) (6.516) (10.684) (4.013)
Beds(log) 0.011 0.209 -0.027 0.527 0.184(0.358) (0.213) (0.169) (0.255) (0.104)
Outpat.(log) 0.190 -0.083 -0.054 -0.477 -0.124(0.300) (0.166) (0.135) (0.178) (0.079)
Community -0.460 0.045 0.060 -0.240 -0.099(0.431) (0.288) (0.233) (0.314) (0.140)
Oncology 0.263 0.435 0.470 0.529 0.404(0.460) (0.356) (0.292) (0.392) (0.171)
Heart Surg. 0.209 0.711 1.055 0.666 0.711(0.476) (0.315) (0.269) (0.372) (0.157)
Pop. (log) -0.159 0.178 0.334 -0.065 0.036(0.323) (0.275) (0.251) (0.433) (0.137)
HMO -0.573 0.641 -1.321 0.535 -0.106(2.023) (0.979) (1.117) (1.389) (0.591)
Medicare -8.644 1.983 -7.968 3.248 -3.634(6.265) (4.254) (4.166) (5.184) (2.239)
Income (log) -0.699 0.258 -0.507 -1.121 -0.234(0.996) (0.706) (0.594) (0.995) (0.362)
Obs. 139 384 521 385 1429
Notes: Standard errors are in parentheses.
25

not the best estimates of the standard errors for the NPL estimator. The best asymp-totic approximation to the standard errors would take into account the Jacobian matrixof equilibrium mapping with respect to both the input choice probabilities and the param-eters. The use of the bootstrap method for the estimation of these standard errors bothappears more practical and will provide a better idea of the finite sample variance. Futuredevelopment of this work will include bootstrapped standard errors.
The primary parameters of interest are the coefficients on the strategic terms, and inparticular, the coefficients on the strategic terms that enter the profit complementarityequation. While these coefficients have the predicted sign, the lack of precision with whichthey are estimated renders them insignificant. This lack of precision in these coefficientsmay stem from the low proportion of the sample that adopts only PET technology. Thestandard errors on the estimates of the strategic coefficients that enter PET profitability(δ21 and δ22) and on those that enter the profit complementarity (δ31 and δ32) indicate thatthe sample does not provide sufficient variation to separate these parameters precisely. Onemight restrict δ21 and δ22 to zero in order to improve the precision of δ31 and δ32; however,we could not be sure that resulting estimates reflect the effect of rival adoption on PETprofitability or on the complementarity between SPECT and PET.
Another possibility is that we may have overestimated the degree of substitutabilitybetween the two technologies for consumers. If the two scanning technologies are onlyweakly substitutable, then any profit complementarity between the adoption decisions stemsfrom the shared adoption costs. Since this cost does not vary over rival adoption, we wouldsee very little difference in profit complementarity from rival adoption.
We find that the number of hospitals in the market has a significant negative effect onthe profitability of the individual technologies. Furthermore, the number of hospitals has asignificant positive effect on the profit complementarity between the adoption decisions.These results are consistent with the predictions of patient-feeding behavior. Patient-feeding finds additional support in the estimates of coefficients on treatment services. Themost significant predictor of both SPECT and PET adoption appears to be whether ornot the hospital offers oncology services. Since both SPECT and PET are used heavilyin cancer diagnosis, hospitals that offer oncology treatment have a greater incentive toadopt both technologies. Furthermore, the coefficients on cardiac intensive care and cardiaccatheterization laboratory (CCL) in SPECT profitability are also significant, supporting thecontention that SPECT service feeds patients into cardiology treatment services.
The coefficients on hospital characteristics that provide exogenous asymmetry to theadoption game among rivals are also significant. The estimated coefficients on outpatientvisits and bed size in SPECT profitability are also positive, indicating that larger hospitalsare more likely to adopt SPECT. The effect of hospital size on PET adoption is less clear:bed size appears to positively affect adoption whereas outpatient visits negatively so.
Non-profit status has a significant, negative effect on SPECT profitability. Further-more, community hospitals are significantly less likely to adopt SPECT even compared toother non-profit hospitals. Neither indicator appears to have a significant effect on PETprofitability.
The coefficients on the market characteristics are overall less significant than thoseon the hospital characteristics. Hospitals in markets with higher HMO penetration aresignificantly less likely to adopt SPECT technology; however, no such effect appears withregard to PET technology.
The imprecision of the estimates of the parameters on technology-specific unobservedheterogeneity make interpretation difficult. The estimated values appear reasonable; how-ever, the standard errors are rather large.
26

Overall, the estimates best support patient-feeding as being the primary motivation foradoption of these technologies. The presence of relevant treatment services appears to be thebest predictor of whether or not a hospital adopts either SPECT or PET. Furthermore, anincrease in the number of hospitals has the effect that this behavior would predict. Namely,adding a hospital to the market decreases the profitability of the individual technologies,but increases the profit complementarity between them.
The overall goodness of fit is rather good. The likelihood ratio test statistic for the hy-pothesis that all parameters except the constants and unobserved heterogeneity parametersare restricted to zero is 257.16, which is large even for the thirty-six degrees of freedom inthe test statistic.
6 Discussion
6.1 Bias from Neglecting Changes in Complementarity
While estimation of the effect of market structure on profit complementarity is of interestto economists in itself, one should also take this effect into account even when one desiresto estimate only the level of complementarity between two decisions. Clearly, if marketstructure systematically affects profit complementarity, then an estimate of the level thatneglects this factor will be rather sensitive to the market structures present in a sample.Suppose that we were interested in estimating only the level of profit complementaritybetween SPECT and PET in order to infer the strength of the self-cannibalization effectpresent when offering both services. Samples that over-represent monopoly hospital marketswould lead us to overestimate the strength of this self-cannibalization because it neglectsthe reduction in self-cannibalization brought about by the presence of rivals. By accountingfor the change in profit complementarity, the inferences are more robust to the distributionof market structures in the sample.
Furthermore, neglect of changing profit complementarity will lead to biased estimatesof the strategic coefficients, which are often of great interest in entry or adoption contexts.To see this, consider an expansion of the profit equation for the dual-adoption option from(7):
π3(xi, P−i, νi) = (α1 + α2 + α3) + x′i(β1 + β2) + y′i(δ1 + δ2 + δ3) + (νi
1 + νi2) + ε3
where yi ≡(E
[ln(1+ri
1)∣∣P−i
], E
[ln(1+ri
2)∣∣P−i
])′ and δj = (δj1, δj2)′ for j = 1, 2, 3. Nowimagine omitting y′iδ3 from the specification. If the two parameters in δ3 are positive, thenthe omission will induce positive correlation between the rival adoption expectation termsand the error term for this option, which would be ε3 = ε3 + y′iδ3. The omissions in thiscase will bias upward the estimators for the coefficients on the rival adoption expectationterms in the SPECT and PET profitability equations (δ1 and δ2). The strength of this biaswill increase with the proportion of observations that adopt both technologies. If the trueparameters in δ1 and δ2 are all negative, then the bias will bring the estimates in δ1 andδ2 closer to zero and may lead us to believe that the hospitals are more isolated from eachother than they really are and that the two technologies are more differentiated from eachother than they really are. If δ1 and δ2 are really positive, because of a medical arms raceeffect for example, then the bias will lead us to believe this the arms race effect is strongerthan it actually is.
In fact, even if one is interested only the adoption of one of the technologies, the neglectof changes in profit complementarity may result in biased estimates. Suppose that we want
27
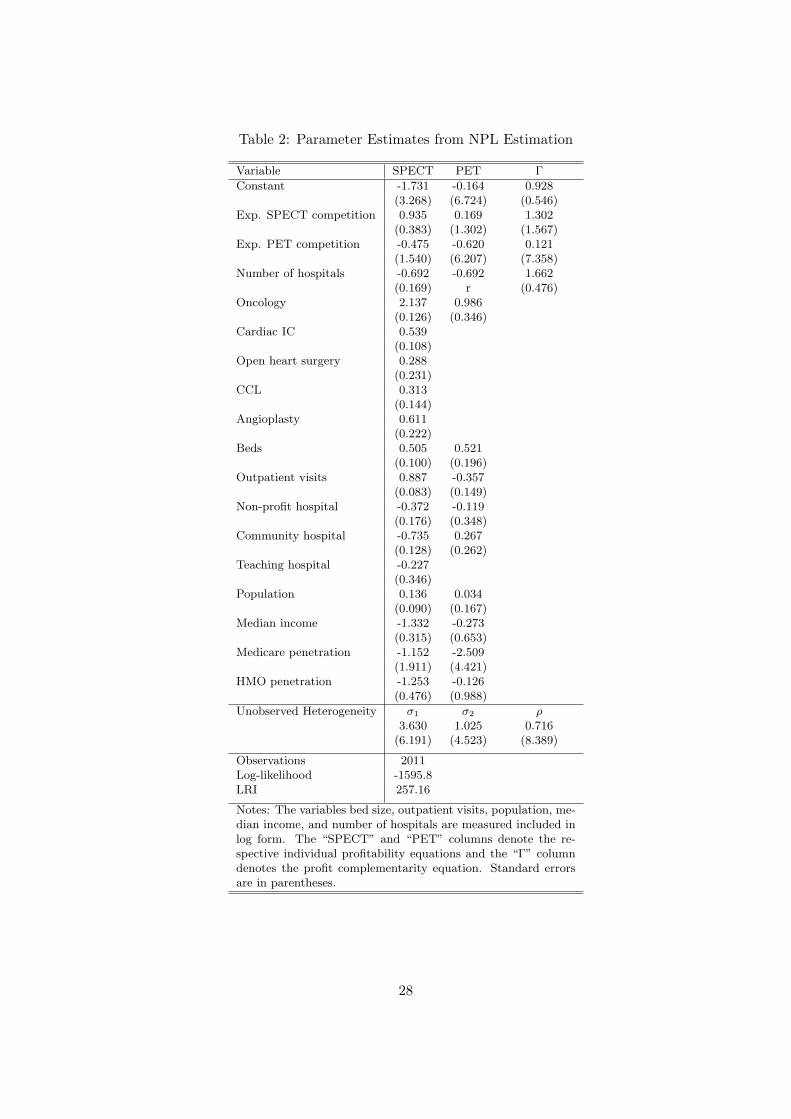
Table 2: Parameter Estimates from NPL Estimation
Variable SPECT PET Γ
Constant -1.731 -0.164 0.928(3.268) (6.724) (0.546)
Exp. SPECT competition 0.935 0.169 1.302(0.383) (1.302) (1.567)
Exp. PET competition -0.475 -0.620 0.121(1.540) (6.207) (7.358)
Number of hospitals -0.692 -0.692 1.662(0.169) r (0.476)
Oncology 2.137 0.986(0.126) (0.346)
Cardiac IC 0.539(0.108)
Open heart surgery 0.288(0.231)
CCL 0.313(0.144)
Angioplasty 0.611(0.222)
Beds 0.505 0.521(0.100) (0.196)
Outpatient visits 0.887 -0.357(0.083) (0.149)
Non-profit hospital -0.372 -0.119(0.176) (0.348)
Community hospital -0.735 0.267(0.128) (0.262)
Teaching hospital -0.227(0.346)
Population 0.136 0.034(0.090) (0.167)
Median income -1.332 -0.273(0.315) (0.653)
Medicare penetration -1.152 -2.509(1.911) (4.421)
HMO penetration -1.253 -0.126(0.476) (0.988)
Unobserved Heterogeneity σ1 σ2 ρ3.630 1.025 0.716
(6.191) (4.523) (8.389)
Observations 2011Log-likelihood -1595.8LRI 257.16
Notes: The variables bed size, outpatient visits, population, me-dian income, and number of hospitals are measured included inlog form. The “SPECT” and “PET” columns denote the re-spective individual profitability equations and the “Γ” columndenotes the profit complementarity equation. Standard errorsare in parentheses.
28

only to estimate the parameters that enter the PET adoption decision. If we assume, incontrast to the rest of the paper, that the decision to adopt SPECT technology is exogenousto the PET adoption decision, we may model the PET adoption decision as a binary choicelogit with the payoff to adoption (ai2 = 1) derived from the main specification in (7):
πi1 = α2 + x′iβ2 + δ21 ln(1+ri1) + δ22E
[ln(1+ri
2)∣∣P−i
]+ α3ai1 + δ31ai1 ln(1+ri
1) + δ32ai1E[ln(1+ri
2)∣∣P−i
]+ εi1 (14)
where ai1 ∈ {0, 1} is the indicator of SPECT adoption and where εi1 is a logistic error.Note that we drop the unobserved heterogeneity term νi
1 because it is redundant whenestimating only a single adoption decision. Suppose that we neglected the terms associatedwith changes in profit complementarity and instead specified the payoffs to adoption as:
π′i1 = α2 + x′iβ2 + δ21 ln(1+ri1) + δ22E
[ln(1+ri
2)∣∣P−i
]+ α3ai1 + εi1 (15)
The specification in (15) accounts somewhat for profit complementarity between thetwo technologies by its inclusion of the SPECT indicator. However, by omitting the otherterms, we again induce bias in the estimators for δ21 and δ22. If profit complementarity isincreasing with rival adoption of PET (δ32 > 0), then the estimator of δ22 will be biasedupward. Again, this bias will become stronger as a larger portion of those hospitals thatadopt PET have also adopted SPECT. For our sample, this proportion is very large andhence the estimator for δ32 will have a mean close to δ22 + δ32. Note that the bias here isnot limited to the finite samples: the omission will cause the estimators to be inconsistentas well.
6.2 Extensions and Policy Implications
We have focused on demonstrating how profit complementarity among a firm’s decisionsis influenced by the market structure under which it operates. This analysis is only a firststep; however, it highlights a feature of multi-product oligopolies that has previously beenneglected. We consider now avenues where future research may use these ideas to contributefurther to the study of imperfect competition.
While we have modeled adoption using a static approximation to a repeated gameamong firms, the effect of market structure on profit complementarity has implications fora dynamic game of technological adoption. In a dynamic game, not only will the decisionswhether to adopt the technologies jointly or separately be affected by the competitiveenvironment, but the decisions when to adopt them will as well. Consider the case of service-oriented technologies like SPECT and PET. A firm facing no rivals in either submarket mayhave an incentive to adopt one technology and wait on adopting another until its acquisitioncost falls below a threshold where the second adoption is profitable. This threshold willtake into consideration the self-cannibalization of revenues from the first technology. If arival adopts the first technology as well, then the reduction in potential self-cannibalizationmay induce the firm to adopt the second technology earlier than it otherwise would. Moreadoption of one technology would spill over into more (or at least quicker) adoption of theother, even though the technologies provide substitutable services. As a consequence, wemay witness different diffusion patterns among the technologies across markets with varyingcompetitive structures.
That market structure affects profit complementarity among adoption decisions alsoprovides a further link between competition policy and technological diffusion. Policies
29

that stimulate adoption of one technology by competing firms will also stimulate adop-tion of substitutable technologies, so long as price competition among adopters is not toointense. In the health care industry, policymakers often worry about adoption of duplica-tive technologies. While SPECT and PET each have clear advantages over each other forspecific diagnostic purposes, concern over redundancy arises because of the large overlapin their usage (as well as the high cost of PET). If the policy goal were to avoid jointadoption in these technologies, then the relative permissiveness of antitrust enforcementto hospital mergers may be further justified by this end. By reducing the set of potentialrivals, hospital consolidation may reduce the incentive to joint adoption by ensuring thatthe self-cannibalization effect will remain strong. On the other hand, the same end maypotentially be reached through policies that intensify price competition among hospitals.For example, policies conducive to greater HMO penetration may serve this end. Whileone should doubt that hospitals will act as aggressively as in the Bertrand example pre-sented, it is conceivable that with high HMO penetration, hospitals may compete in pricesaggressively enough so that rival entry actually exacerbates the self-cannibalization fromjoint adoption.
Beyond technological adoption, the framework presented here is useful for models of spa-tial competition and market entry. Firms that consider entry into multiple nearby marketsface self-cannibalization prospects that may be ameliorated by cross-firm cannibalizationfrom rival entry. While we have limited our attention to two submarkets for simplicity, theframework and intuition carry over to the larger choice sets that would likely be presentin spatial contexts. The decomposition introduced by Gentzkow (2005) for multivariatediscrete choice payoffs is valid for an arbitrary number of component choices; however, thenumber of terms grows substantially as the number of component choices increases. Onecould reduce the dimensionality by imposing distance bands, as in Seim (2004), so that allsubmarkets within a particular radius have the same coefficients. That we would be ableto consider centrally managed entry decisions by multi-market firms provides a promisingapplication of our approach.
7 Conclusion
This paper has investigated the effect of market structure on profit complementarity inthe context of adoption of substitutable service-oriented technologies. Factors influencingthese changes include the degree of price competition among firms and the substitutabil-ity of services. We first outlined a framework for analyzing profit complementarity in atechnological adoption or market entry context. We then examined how rival adoption canincrease profit complementarity when no pricing strategies exist. On the other hand, veryintense price competition among firms, as in a Bertrand setting, will lead to decreasingprofit complementarity from rival adoption. That rival adoption of one technology maydecrease the potential for self-cannibalization from joint adoption provides an importantsource of increasing profit complementarity; however, whether rival entry has this effectdepends on the intensity of price competition among firms.
To test whether profit complementarity changes based on rival adoption decisions, welooked to the case of SPECT and PET diagnostic imaging technologies. We tested thismodel on data of hospitals’ decisions to adopt these imaging technologies. We estimateda model of joint adoption of the two technologies in an oligopolistic setting, allowing fortechnology specific heterogeneity and strategic interaction among hospitals. Given possiblepatient-feeding motives in provision of these services, we also looked for the effect of the
30

number of hospitals in the market on adoption decisions.The results support patient feeding as the primary concern in the adoption of these
technologies. The number of hospitals in the market decreases the profitability of adoptionof the individual technologies and increases the profit complementarity between the adop-tion decisions. Furthermore, hospitals with related treatment services are significantly morelikely to adopt either technology. In contrast, expected rival adoption of the technologiesdoes not appear to have a significant effect on the adoption decisions.
Previous studies of multiple technological adoption decisions have treated the comple-mentarity among adoption decisions as constant. The primary contribution of this paper isin demonstrating how models of oligopoly competition would predict different levels of profitcomplementarity for different market environments. While we have focused our attentionon service-oriented technologies, where the associated services are viewed as substitutesby consumers, analogous effects of market structure on profit complementarity should begenerated in other contexts.
A Derivations and Examples
A.1 Profit Complementarity Decomposition
Let variable production costs for firm i when it produces qi1 of service 1 and qi
2 of service2 be given by Ci(qi
1, qi2), where Ci(0, 0) = 0. The firm incurs fixed costs of F i(ai) from
its adoption decision. The costs in F i include both actual costs of adoption and anyunsunk fixed costs in production of the associated service. Note that these fixed costsare assumed not to depend on rival decisions. We specify fixed costs as F i((0, 0)) = 0,F i((1, 0)) = F i
0 + F i1, F
i((0, 1)) = F i0 + F i
2, and F i((1, 1)) = F i0 + F i
1 + F i2, where all terms
are nonnegative. Note that F i0 represents a shared component of adoption costs that the
firm occurs only once when adopting one or both technologies. This shared adoption costbecomes an important source of profit complementarity, whereas the technology-specificadoption costs F i
1 and F i2 cancel out in the determination of profit complementarity.
Let pij(a
i, a−i) and qij(a
i, a−i) be firm i’s price and quantity of service j = 1, 2 in theequilibrium of the subgame generated by the adoption decisions (ai, a−i). If firm i doesnot adopt the technology for service j, then clearly it produces none of that service, andhence qi
1
((0, 1), a−i
)= qi
2
((1, 0), a−i
)= 0. Firm profits in the equilibrium of the (ai, a−i)
subgame are then:
πi(ai, a−i) = pi1(a
i, a−i) · qi1(a
i, a−i) + pi2(a
i, a−i) · qi2(a
i, a−i)
− Ci(qi1(a
i, a−i), qi2(a
i, a−i))− F i(ai)
Let Rij(a
i, a−i) denote the net revenues earned by firm i from its operations in servicej in the equilibrium of the (ai, a−i) subgame. These net revenues account for variableproduction costs specific to service j; however, they account for neither cost interactionsnor adoption costs. These net revenues are defined as:
Ri1(a
i, a−i) = pi1(a
i, a−i) · qi1(a
i, a−i)− Ci(qi1(a
i, a−i), 0)
Ri2(a
i, a−i) = pi2(a
i, a−i) · qi2(a
i, a−i)− Ci(0, qi
2(ai, a−i)
)Note that even with adoption of both technologies, the variable costs in Ri
1((1, 1), a−i)are evaluated with the quantity of the second service set at zero (and analogously for
31

Ri2((1, 1), a−i)). This feature allows for easier comparison of these service-specific net rev-
enues across decision profiles. We account for cost interactions with an economies of scopeterm SCi defined below.
The profits to specialized adoption reduce to πi((1, 0), a−i
)= Ri
1
((1, 0), a−i
)− F i
1 − F i0
and πi((0, 1), a−i
)= Ri
2
((0, 1), a−i
)− F i
2 − F i0. Profit complementarity is then decomposed
as:Γi(a−i) = ∆Ri
1(a−i) + ∆Ri
2(a−i) + SCi(a−i) + F i
0
where
∆Ri1(a
−i) ≡ Ri1
((1, 1), a−i
)−Ri
1
((1, 0), a−i
)∆Ri
2(a−i) ≡ Ri
2
((1, 1), a−i
)−Ri
2
((0, 1), a−i
)SCi(a−i) ≡ −
[Ci
(qi1((1, 1), a−i), qi
2((1, 1), a−i))
− Ci(qi1((1, 1), a−i), 0
)− Ci
(0, qi
2((1, 1), a−i))]
Note that the term SCi(a−i) is defined so that economies of scope in variable costs willcontribute positively to profit complementarity.
A.2 Details for Example 2.3.1
We demonstrate the result for the case of two firms and note that the argument extendseasily to the case of three or more firms. We denote the two firms as A and B and considerthe profit complementarity faced by firm A.
Assume that the cost functions of both firms exhibit constant marginal costs and noeconomies of scope or fixed costs. Assume further that the price of each service from eachfirm is invariant to the adoption decisions of the firms. We have then that if a firm adoptsthe technology for service j = 1, 2, it receives an average profit of ϕi
j = pij−cij , regardless of
quantity. We restrict attention to the case where each price is set above the correspondingmarginal cost so that ϕi
j > 0.Let A1 denote the option to buy service 1 from firm A and let A2, B1, and B2 represent
the analogous options. Let 0 denote the option not to consume any service. When bothfirms adopt both technologies, then the consumers face the budget set {0, A1, A2, B1, B2}.Under other adoption decisions, consumers face a nonempty subset of this budget set, whereoption 0 is always present.
Let qij(a
A, aB) denote the quantity demanded of service j from firm i when consumersare presented the budget set generated by the adoption decisions (aA, aB). The profits tofirm i under the adoption decisions (aA, aB) can be expressed:
πi(aA, aB) = ϕi1 · qi
1(aA, aB) + ϕi
2 · qi2(a
A, aB) = Ri1(a
A, aB) +Ri2(a
A, aB)
Using the decomposition of profit complementarity in Equation (2), we have that theself-cannibalization faced by A with respect to the first service as:
∆RA1 (aB) = ϕA
1 ·[qA1
((1, 1), aB
)− qA
1
((1, 0), aB
)]Consider the bracketed difference term: that is, the difference in quantity demanded
of service 1 when A provides both services and when A provides only service 1, given B’sadoption choices. By offering both services, firm A expands the choice set of consumers byadding to it A2. All consumers who would choose A1 when A2 is also available would also
32

choose A1 when A2 is not available, assuming that preferences satisfy the independenceaxiom. Hence, firm A can not increase the quantity demanded of service 1 by offeringservice 2 as well. For the quantity demanded to decrease requires only that there is at leastone consumer who prefers A2 to A1, but prefers A1 to 0 and to any service offered by firmB under aB. So long as there is at least one such consumer, and so long as ϕA
1 > 0, wehave that ∆RA
1 (aB) < 0. The analogous argument shows that ∆RA2 (aB) ≤ 0 and that the
inequality is strict if there is at least one consumer that prefers A1 to A2 and A2 to otheroptions in the budget set. Therefore, if either of these consumer types exist, then we have:
ΓA(aB) = ∆RA1 (aB) + ∆RA
2 (aB) < 0
To see that A’s profit complementarity increases asB adopts more technologies, compareΓA(1) to ΓA(0). We have:
∆RA1 ((1, 0))−∆RA
1 ((0, 0)) = ϕA1
·[[qA1
((1, 1), (1, 0)
)− qA
1
((1, 0), (1, 0)
)]−
[qA1
((1, 1), (0, 0)
)− qA
1
((1, 0), (0, 0)
)]]The second difference, qA
1
((1, 1), (0, 0)
)− qA
1
((1, 0), (0, 0)
), is composed of those con-
sumers with preferences that satisfy A2 � A1 � 0. The first difference is composed ofthose consumers with preferences that satisfy A2 � A1 � 0, and A1 � B1. Notice that thesecond group of consumers contains the first, and hence ∆RA
1 ((1, 0))−∆RA1 ((0, 0)) ≥ 0. If
there is at least one consumer for whom A2 � B1 � A1 � 0, then the first difference isstrictly smaller in absolute value than the second, and therefore ∆RA
1 ((1, 0))−∆RA1 ((0, 0))
is strictly positive. By the analogous argument, ∆RA2 ((1, 0))−∆RA
2 ((0, 0)) is nonnegative,and is strictly positive if there exists at least one consumer for whom A1 � B1 � A2 � 0.We then have that ΓA((1, 0))− ΓA((0, 0)) ≥ 0, where the inequality is strict if at least oneof the consumers types discussed are present.
Similar reasoning shows that the complementarity differences ΓA((0, 1)) − ΓA((0, 0)),ΓA((1, 1)) − ΓA((1, 0)), and ΓA((1, 1)) − ΓA((0, 1)) are all nonnegative and that sufficientheterogeneity in consumer preferences would make them positive. Note, however, thatadditional restrictions would be necessary to establish the sign of ΓA((0, 1))− ΓA((1, 0)).
A.3 Details for Example 2.3.2
While consumers have heterogeneous preferences over services, they view firms providinga particular service as homogeneous. To keep the example tractable, we model productdifferentiation between the two services via the linear city with linear travel costs. We fixthe locations of the two services at the endpoints of the city, whose length is normalized tounity. If both firms offer a service, all consumers purchase from the one offering the lowerprice. Demand is split evenly if the firms offer the same price. The consumer at locationx ∈ [0, 1] that faces market prices (p1, p2) for the two services receives the following netutilities from purchasing one unit of the services:
u1(x, p1, p2) = v1 − p1 − τx u2(x, p1, p2) = v2 − p2 − τ(1− x)
where v1 > 0 and v2 > 0 are the consumers’ valuations of the services if there were notravel costs and where τ > 0 is the marginal disutility of travel to consumers. We reiteratethat the heterogeneity here is in the two types of services, not in the firms.
Firms again have no fixed costs and constant marginal costs, and we assume that thesecosts are identical over firms for a given service; however, they may differ across the two
33

services. Since we allow the two services to have different valuations, we normalize the coststo zero and interpret the valuations and equilibrium prices as net of marginal costs. Theresults presented here are robust to the inclusion of positive marginal costs so long as thesecosts do not exceed the valuations of the services.
We deal only with the case where travel costs are not so high relative to the valuationsthat the two service markets are effectively isolated. However, we assume that travel costsare high enough so that a monopolist, having adopted both technologies, would not wantto cover the market with only one of the services. We satisfy both these conditions byrestricting the travel cost to the range
∣∣v1 − v2∣∣ < τ < 1
2
[v1 + v2
]. We also assume that
τ > 12v1 and τ > 1
2v2 to avoid multiple forms of the equilibrium profit functions; however,these are technical restrictions that do not affect the qualitative results.
The consumer at location x ∈ [0, 1] that faces market prices (p1, p2) for the two servicesreceives the following net utilities from purchasing one unit of the services:
u1(x, p1, p2) = v1 − p1 − τx u2(x, p1, p2) = v2 − p2 − τ(1− x)
Let pA1 (aA, aB) denote firm A’s price of service j in the equilibrium of the subgame
generated by the adoption decisions (aA, aB). If firm A adopts only the first technologyand B does not adopt either technology, then A will charge a price of pA
1
((1, 0), (0, 0)
)= 1
2v1and will earn profits of πA
((1, 0), (0, 0)
)= v2
1/(4τ). Likewise, if A adopts only the secondtechnology and B adopts neither, then pA
2
((0, 1), (0, 0)
)= 1
2v2 and πA((0, 1), (0, 0)
)=
v22/(4τ). If A adopts both technologies and B adopts neither, then with travel costs in the
assumed range, the monopolist will serve the entire market and will sell positive quantities ofboth services. We have pA
1
((1, 1), (0, 0)
)= 3
4v1+ 14v2−
12τ , p
A2
((1, 1), (0, 0)
)= 3
4v2+ 14v1−
12τ ,
and πA((1, 1), (0, 0)
)= 1
2(v1 + v2 − τ) + (v1 − v2)2/(8τ). The profit complementarity facedby the monopolist is then:
ΓA((0, 0)) =−(2τ − v1 − v2)2
8τ(16)
Now suppose that B adopts the first technology. If A adopts only the the first technol-ogy, then the Bertrand result will prevail: price will be driven down to marginal cost, or zeroin this case. Hence, we have πA
((1, 0), (1, 0)
)= 0. If A adopts only the second technology,
then the Hotelling duopoly equilibrium results. We have pA2
((0, 1), (1, 0)
)= τ + 1
3(v2 − v1)and πA
((0, 1), (1, 0)
)= (3τ + v2 − v1)2/(18τ).
If A adopts both technologies and B adopts only the first, then one may questionwhether A’s incentive to out-bid B in the price of service 1 is as strong as if A wereproviding only that service. Even though A is aware of the substitution effect that a pricewar in the first service will have on its service 2 business, it will still compete as a Bertrandcompetitor in service 1 if it has already adopted that technology. To see this, consider anycandidate equilibrium where 0 < pB
1 < pA1 : that is, where B charges a lower service 1 price
than does A and hence captures the entire market demand for service 1. By undercuttingpB1 by an infinitesimal amount, as in the standard Bertrand model, firm A will steal the
demand for service 1 without effectively changing the relative market prices of the twoservices, and hence not affecting the demand for service 2. So long as pB
1 > 0, A hasan incentive to undercut B’s price, regardless of whether or not A also offers the secondservice. We therefore have pA
1
((1, 1), (1, 0)
)= 0. Given this result, the pricing decision for
the second service may take the equilibrium price of the first service as exogenous. We thenhave that pA
2
((1, 1), (1, 0)
)= 1
2(τ +v2−v1) and πA((1, 1), (1, 0)
)= (τ +v2−v1)2/(8τ). The
34

profit complementarity faced by A when B adopts the first technology is therefore:
ΓA((1, 0)) =5(v2 − v1)2
72τ− v2 − v1
12− 3τ
8(17)
From Equations (16) and (17), we derive the change in profit complementarity as:
ΓA((1, 0))− ΓA((0, 0)) =7v112
+5v212
− 7τ8− v2
1
18τ− v2
2
18τ− 7v1v2
18τ(18)
Transforming Equation (18) into a quadratic in τ , we can see that the parabola opensdownward. Inspection of the quadratic shows that it becomes positive for some τ only ifv1 is very large relative to v2 (or the reverse if ΓA((0, 1))− ΓA((0, 0)) is analyzed).14 Evenwhere this is true, visual inspection has failed to locate cases where the positive portionoverlaps with the range of τ for which the derivations are valid. At least for cases wherethe two service valuations are in the same ballpark, profit complementarity decreases withrival adoption.
A.4 Details for Example 2.3.3
For simplicity, we assume that hospitals care only about indirect profits from feeding pa-tients into treatment services and do not value direct profits from diagnostic service pro-vision. The combination of this case with that of Example 2.3.1 is straightforward andgenerates the same qualitative results.
Suppose that there are n hospitals in the hospital market that provide treatment servicesfor a particular disease for which SPECT and PET are appropriate diagnostic technologies(e.g. non-pulmonary lung cancer). All hospitals provide both diagnostic and treatmentservices for this disease, even if they do not adopt SPECT or PET.15 However, a hospitalthat has a SPECT or PET facility is able to attract more patients for diagnosis. Weassume that patients are more likely to consume treatment service from a hospital if theywere diagnosed at that hospital than if they were not.
Let qij
(ai, a−i, n
)denote the quantity of patients that elect to use hospital i’s SPECT
(j = 1) or PET (j = 2) diagnostic service in the equilibrium under the adoption profile(ai, a−i). Note that unlike in the previous examples, we allow the equilibrium quantities todepend on the number of hospitals in the market, not just the adoption decisions. Sinceall hospitals provide at least a primitive diagnostic service, patients in markets with morehospitals have more diagnostic options, so we assume that qi
j
(ai, a−i, n+1
)≤ qi
j
(ai, a−i′, n+
1).16
Let ψij(n) denote the expected profit in treatment service for each patient scanned by
i’s SPECT or PET machine. This expected per-patient treatment profit accounts for theprobability that a scanned patient is diagnosed with the disease, the probability that thediagnosed patient returns to i for treatment, and the profit to i from the patient’s use of itstreatment service. Note that this term depends on the number of hospitals in the market,but does not depend on adoption decisions. In particular, we assume that ψi
j(n+1) < ψij(n)
for all n ∈ N. As the number of hospitals in the market increases, diagnosed patients have14Specifically, in order for the parabola to have real roots, we must have v1(v1 − 42v2) > v2
2 , whichnecessitates that v1 be much larger than v2.
15One can suppose that all hospitals have a less effective diagnostic technology for the disease, such as aCT scanner.
16If the inequality holds when the additional hospital does not adopt either technology, then it holds forall decisions of that hospital.
35
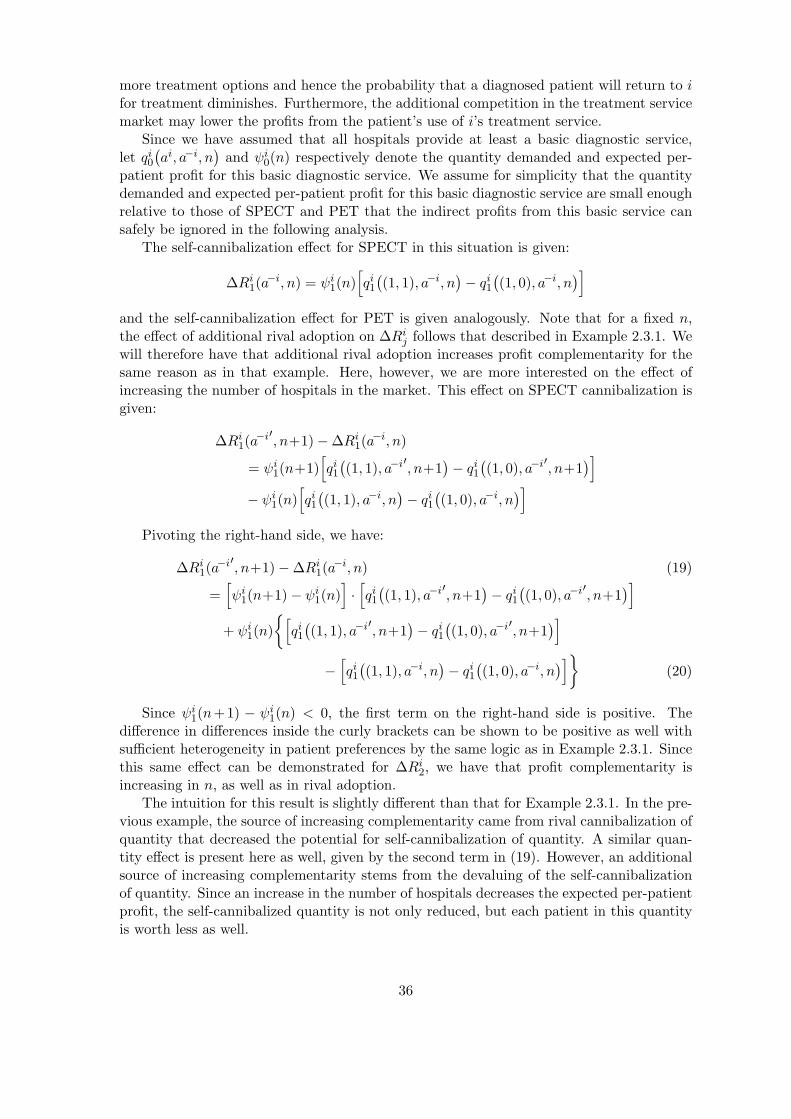
more treatment options and hence the probability that a diagnosed patient will return to ifor treatment diminishes. Furthermore, the additional competition in the treatment servicemarket may lower the profits from the patient’s use of i’s treatment service.
Since we have assumed that all hospitals provide at least a basic diagnostic service,let qi
0
(ai, a−i, n
)and ψi
0(n) respectively denote the quantity demanded and expected per-patient profit for this basic diagnostic service. We assume for simplicity that the quantitydemanded and expected per-patient profit for this basic diagnostic service are small enoughrelative to those of SPECT and PET that the indirect profits from this basic service cansafely be ignored in the following analysis.
The self-cannibalization effect for SPECT in this situation is given:
∆Ri1(a
−i, n) = ψi1(n)
[qi1
((1, 1), a−i, n
)− qi
1
((1, 0), a−i, n
)]and the self-cannibalization effect for PET is given analogously. Note that for a fixed n,the effect of additional rival adoption on ∆Ri
j follows that described in Example 2.3.1. Wewill therefore have that additional rival adoption increases profit complementarity for thesame reason as in that example. Here, however, we are more interested on the effect ofincreasing the number of hospitals in the market. This effect on SPECT cannibalization isgiven:
∆Ri1(a
−i′, n+1)−∆Ri1(a
−i, n)
= ψi1(n+1)
[qi1
((1, 1), a−i′, n+1
)− qi
1
((1, 0), a−i′, n+1
)]− ψi
1(n)[qi1
((1, 1), a−i, n
)− qi
1
((1, 0), a−i, n
)]Pivoting the right-hand side, we have:
∆Ri1(a
−i′, n+1)−∆Ri1(a
−i, n) (19)
=[ψi
1(n+1)− ψi1(n)
]·[qi1
((1, 1), a−i′, n+1
)− qi
1
((1, 0), a−i′, n+1
)]+ ψi
1(n){[qi1
((1, 1), a−i′, n+1
)− qi
1
((1, 0), a−i′, n+1
)]−
[qi1
((1, 1), a−i, n
)− qi
1
((1, 0), a−i, n
)]}(20)
Since ψi1(n+1) − ψi
1(n) < 0, the first term on the right-hand side is positive. Thedifference in differences inside the curly brackets can be shown to be positive as well withsufficient heterogeneity in patient preferences by the same logic as in Example 2.3.1. Sincethis same effect can be demonstrated for ∆Ri
2, we have that profit complementarity isincreasing in n, as well as in rival adoption.
The intuition for this result is slightly different than that for Example 2.3.1. In the pre-vious example, the source of increasing complementarity came from rival cannibalization ofquantity that decreased the potential for self-cannibalization of quantity. A similar quan-tity effect is present here as well, given by the second term in (19). However, an additionalsource of increasing complementarity stems from the devaluing of the self-cannibalizationof quantity. Since an increase in the number of hospitals decreases the expected per-patientprofit, the self-cannibalized quantity is not only reduced, but each patient in this quantityis worth less as well.
36

B Estimation Details
B.1 Consistency of the NPL Estimator
Let lnL Pn be the pseudo-likelihood function for a sample of n observations and let lnL P
∞be the limiting counterpart as n → ∞. The estimator (θn, Pn) converges to an estimator(θ, P ) that satisfies the following properties. First, θ ∈ argmaxθ∈Θ lnL P
∞(θ, P ). Secondly,P = Ψ(P ; θ). Finally, ln L P
∞(θ, P ) ≥ lnL P∞(θ, P ) for all (θ, P ) that satisfy the first two
properties. Note that the true parameters and choice probabilities (θ∗, P ∗) satisfy thesethree properties. Furthermore, the true parameters and choice probabilities are the onlyones that satisfy these three properties. Too see this, suppose (θ, P ) 6= (θ∗, P ∗). If P =P ∗, then by Assumption 3, θ = θ∗ because P ∗ is an equilibrium only under θ∗. Hence,(θ, P ) 6= (θ∗, P ∗) necessitates that P 6= P ∗. The Kullback-Leibler Information Inequalitythen implies that lnL P
∞(θ, P ) < lnL P∞(θ∗, P ∗). Hence, even if (θ, P ) satisfy the first two
properties, they will not satisfy the last.
B.2 Implementation of the NPL Method
B.2.1 Equilibrium Search
Given a parameter vector θ and sample characteristics X, we find an equilibrium for eachmarket l using the method of successive approximations. To reduce the chance that thesearch bounces between choice probabilities without settling on an equilibrium, we iteratethrough the firms in a market and immediately update the best response choice probabilitiesof each firm for use in the best response computation of later firms in the sequence. Theapproach is analogous to the Gauss-Seidel method for solving systems of linear equations.
With a market of n firms with characteristics given by X l, we initialize the choiceprobabilities with those resulting from the search during the previous NPL iteration. Withthese choice probabilities P l
0,0, we compute the first firm’s best response choice probabilitiesas pi
0,1 = ψ(P l−i,0,0;xi, θ) and replace firm i’s entries in P l
0,0 with those from pi0,1 to get P l
0,1.We then do the same for each subsequent firm, again updating the choice probabilities assoon as new guesses are available. After completing the sequence of firms, we have P l
1,0 asthe new candidate equilibrium. If the change in choice probabilities falls within the desiredtolerance, then we use P l
1,0 as the equilibrium. If not, then we repeat the procedure untilsuch convergence is achieved.
While we have found aberrant cases where the search did not converge, the methodoverall provides a reliable means of locating a market equilibrium. Of course, neither thismethod nor any other search method guarantees that the equilibrium found is unique.
B.2.2 Computation of Expectations
Given rival choice probabilities P−i for a firm with n rivals, we need to compute the expectedlog number of entrants that the firm expects in each submarket. For each rival, we firsttransform the choice probabilities over the four bundles into simple Bernoulli probabilitiesof entry into each submarket. Let pk
1 denote rival k’s probability of entering the firstsubmarket. The density function of the random variable r giving the number of rivals thatfirm i would face in the first submarket is that of a sum of independent but heterogeneousBernoulli random variables. The density function is given by:
Pr{r1 = m} =1∑
a1=0
· · ·1∑
an=0
1{∑n
k=1 ak = m}
}∏nk=1(p
k1)
ak(1− pk
1)1−ak
37

where 1{·} is the indicator function.With this density computed, the expected log number of firms operating in the first
submarket (conditional on firm i operating in that submarket) is simply:
E[ln(1+r1)
]=
n∑m=0
Pr{r1 = m} ln(1+r1)
B.2.3 Monte Carlo Integration
In both the equilibrium search and the evaluation of the log-likelihood function, the integralin (8) is computed via simulation. To simulate the integral, we need to draw S realizationsof the random variables (νi
1, νi2) for each realization. This pair of random variables follows
the bivariate normal distribution with mean zero and covariance matrix:
Σ =(
σ21 σ1σ2ρ
σ1σ2ρ σ22
)Bivariate normal random variables have the convenient property that if u1 and u2 are
two independent draws from the standard normal distribution, then (ν1, ν2)′ = Σ1/2(u1, u2)′,where Σ1/2 is the Cholesky root of the covariance matrix, will follow the desired bivariatenormal distribution.
To implement the simulation, we replicate each observation S times and augment itscharacteristics matrix with two columns, filled with independent draws from the standardnormal distribution. The coefficients on these characteristics will be the entries in theCholesky root of the covariance matrix. Once these coefficients are estimated, we undothe Cholesky decomposition to obtain the estimated standard deviation and correlationparameters. The standard errors on these estimators are computed via the delta method.Note that the standard errors of all parameter estimators are computed using the actualsample size, not the replicated sample size.
References
Aguirregabiria, Victor. 2004(a). “Pseudo Maximum Likelihood Estimation of StructuralModels Involving Fixed-Point Algorithms,” Economic Letters, v.84, pp.335-340.
Aguirregabiria, Victor. 2004(b). “Alternative Estimators of Parametric Models where theDistribution of Endogenous Variables is Implicitly Defined as a Fixed-Point,” mimeo,Boston University.
Aguirregabiria, Victor and Mira, Pedro. 2004. “Sequential Estimation of Dynamic DiscreteGames,” mimeo, Boston University.
American Hospital Association. 1999. AHA Guide to the Health Care Field, Chicago: Amer-ican Hospital Association.
Area Resource File. February 2004. US Department of Health and Human Services, HealthResources and Services Administration, Bureau of Health Professions, Rockville, MD.
Athey, Susan and Stern, Scott. 1998. “An Empirical Framework for Testing Theories AboutComplementarity in Organizational Design,” NBER Working Paper 6600.
38

Augereau, Angelique; Greenstein, Shane; and Rysman, Marc. 2005. “Coordination vs. Dif-ferentiation in a Standards War: 56K Modems,” RAND Journal of Economics, forth-coming.
Bairey Merz, C.N. and Berman, D.S. 1997. “Imaging Techniques for Coronary Artery Dis-ease: Current Status and Future Directions,” Clinical Cardiology, v.20, n.6, pp.526-532.
Baker, Laurence. 2001. “Managed Care and Technology Adoption in Health Care: Evidencefrom Magnetic Resonance Imaging,” Journal of Health Economics, v.20, pp.395-421.
Berger, Magdalena; Gould, Michael; and Barnett, Paul. 2003. “The Cost of Positron Emis-sion Tomography in Six United States Veterans Affairs Hospitals and Two AcademicMedical Centers,” American Journal of Roentgenology, v.181, pp.359-365.
Berry, Steven. 1992. “Estimation of a Model of Entry in the Airline Industry,” Economet-rica, v.60, n.4, pp.889-917.
Berry, Steven; Levinsohn, James; and Pakes, Ariel. 1995. “Automobile Prices in MarketEquilibrium,” Econometrica, v.63, n.4, pp.841-890.
Bulow, Jeremy; Geanakoplos, John; and Klemperer, Paul. 1985. “Multimarket Oligopoly:Strategic Substitutes and Complements,” Journal of Political Economy, v.93, n.3, pp.488-511.
Burgess, James; Carey, Kathleen; and Young, Gary. 2005. “The Effect of Network Arrange-ments on Hospital Pricing Behavior,” Journal of Health Economics, v.24, pp.391-405.
Curran, Colleen. 2003. “Dollars and Sense: The Economics of PET,” Medical Imaging, June2003.
Dafny, Leemore. 2003. “Entry Deterrence in Hospital Procedure Markets: A Simple Modelof Learning-by-Doing,” Working Paper #0037, Center for the Study of Industrial Orga-nization.
Dranove, David; Shanley, Mark; and Simon, Carol. 1992. “Is Hospital Competition Waste-ful?” RAND Journal of Economics, v.23, n.2, pp.247-262.
Dye, Mark. 2005. “PET & SPECT: Happy Together,” Medical Imaging, June 2005.
Gaynor, Martin and Vogt, William. 2003. “Competition Among Hospitals,” RAND Journalof Economics, v.34, n.4, pp.764-785.
Gentzkow, Matthew. 2005. “Valuing New Goods in a Model with Complementarity: OnlineNewspapers,” mimeo, University of Chicago GSB.
Gorman, Ian. 1985. “Conditions for Economies of Scope in the Presence of Fixed Costs,”RAND Journal of Economics, v.16, n.3, pp.431-436.
Gourieroux, Christian and Monfort, Alain. 1996. Simulation-Based Econometric Methods.New York: Oxford University Press.
Judd, Kenneth. 1985. “Credible Spatial Preemption,” RAND Journal of Economics, v.16,n.2, pp.153-166.
39

Keppler, Jennifer and Conti, Peter. 2001. “A Cost Analysis of Positron Emission Tomog-raphy,” American Journal of Roentgenology, v.177, pp.31-40.
Spetz, Joanne and Baker, Laurence. 1999. Has Managed Care Affected the Availability ofMedical Technology. San Fransisco, CA: Public Policy Institute of California.
Lopes, M.I. and Chepel, V. 2004. “Detectors for Medical Radioisotope Imaging: Demandsand Perspectives,” Radiation Physics and Chemistry, v.71, pp.683-692.
Luft, Harold; Robinson, James; Garnick, Deborah; Maerki, Susan; and McPhee, Stephen.1986. “The Role of Specialized Clinical Services in Competition Among Hospitals,” In-quiry, v.23, pp.83-94.
Makuc, Diane; Haglund, Bengt; Ingram, Deborah; Kleinman, Joel; Feldman, Jacob. 1991.“Health Care Service Areas for the United States,” Vital Health Statistics, Series 2,No.112, PHS 92-1386. Washington, DC: National Center for Health Statistics.
Manski, Charles. 1993. “Identification of Endogenous Social Effects: The Reflection Prob-lem,” v.60, n.3, pp.531-542.
McFadden, Daniel and Train, Kenneth. 2000. “Mixed MNL Models for Discrete ChoiceResponse,” Journal of Applied Econometrics, v.15, n.5, pp.447-470.
McKelvey, Richard and Palfrey, Thomas. 1995. “Quantal Response Equilibria for NormalForm Games,” Games and Economic Behavior, v.10, pp.6-38.
Milgrom, Paul and Roberts, John. 1990. “The Economics of Modern Manufacturing: Tech-nology, Strategy, and Organization,” American Economic Review, v.80, n.3, pp.511-528.
Milgrom, Paul and Roberts, John. 1990. “Rationalizability, Learning, and Equilibrium inGames with Strategic Complementarities,” Econometrica, v.58, n.6, pp.1255-1277.
Milgrom, Paul and Roberts, John. 1994. “Comparing Equilibria,” American EconomicReview, v.84, n.3, pp.441-459.
Nevo, Aviv. 2001. “Measuring Market Power in the Ready-to-Eat Cereal Industry,” Econo-metrica, v.69, n.2, pp.307-342.
Noether, Monica. 1988. “Competition Among Hospitals,” Journal of Health Economics,v.7, pp.259-284.
Panzar, John and Willig, Robert. 1981. “Economies of Scope,” American Economic Review,v.71, n.2, pp.268-272.
Robert, G. and Milne, R. 1999. “Positron Emission Tomography: Establishing Prioritiesfor Health Technology Assessment,” Health Technology Assessment, v.3, n.16.
Robinson, Joan. 1953. “Imperfect Competition Revisited,” Economic Journal, v.63, pp.575-593.
Robinson, James and Luft, Harold. 1985. “The Impact of Hospital Market Structure onPatient Volume, Average Length of Stay, and the Cost of Care,” Journal of HealthEconomics, v.4, pp.333-356.
40

Schmalensee, Richard. 1978. “Entry Deterence in the Raedy-to-Eat Breakfast Cereal In-dustry,” Bell Journal of Economics, v.9, pp.305-327.
Schmidt-Dengler, Philipp. 2005. “The Timing of New Technology Adoption: The Case ofMRI,” mimeo, Yale University.
Seim, Katja. 2004. “An Empirical Model of Firm Entry with Endogenous Product-TypeChoices,” mimeo, Stanford University GSB.
Shaked, Avner and Sutton, John. 1990. “Multiproduct Firms and Market Structure,”RAND Journal of Economics, v.21, n.1, pp.45-62.
Smith, Rick. 2000. “PET and SPECT: Partners in the Battle Against Cancer,” Decisionsin Imaging Economics, September/October 2000.
Spencer, Susan; Theodore, William; and Berkovic, Samuel. 1995. “Clinical Applications:MRI, SPECT, and PET,” Magnetic Resonance Imaging, v.13, n.8, pp.1119-1124.
Topkis, Donald. 1979. “Equilibrium Points in Nonzero-Sum n-Person Submodular Games,”SIAM Journal of Control and Optimization, v.17, pp.773-787.
Train, Kenneth. 1999. “Halton Sequences for Mixed Logit,” mimeo, Department of Eco-nomics, Univeristy of California at Berkeley.
Trajtenberg, Manuel. 1989. “The Welfare Analysis of Product Innovation, with an Appli-cation to Computed Tomography Scanners,” Journal of Political Economy, v.97, n.2,pp.444-479.
Villas-Boas, Miguel. 1997. “Comparative Statics of Fixed Points,” Journal of EconomicTheory, v.73, n.1, pp.183-198.
Vives, Xavier. 1990. “Nash Equilibrium with Strategic Complementarities,” Journal ofMathmatetical Economics, v.19, n.3, 305-321.
Wolinksy, Asher. 1986. “The Nature of Competition and the Scope of Firms,” Journal ofIndustrial Economics, v.34, n.3, pp.247-259.
41