market strategy 2014content.icicidirect.com/.../idirect_marketstrategy_2014.pdf2 market strategy...
TRANSCRIPT

Market Strategy 2014
December 26, 2013
December 27, 2013

2
Deal Team – At Your ServiceMarket Strategy 2014
Where are the markets headed in 2014?1
How would general elections influence the markets?2
Would the economy recover progressively?3
How would the FM bridge the fiscal gap?4
Has inflation peaked out to warrant a rate cut?5
Is the worst over for the rupee?6
What next as tapering begins?7
What are the potential speed breakers for the markets?8
Are cyclicals a good bet this year?9
Which sectors and stocks will find favour?10

3
• The market performance has been in line with Sensex earnings in the past year. After declining 9% in the middle of the year led by a slew of negative news flows on both the global and domestic front, markets are up 8% this year. After two subdued years with negligible growth, Sensex earnings are expected to grow 17–18% in FY14 and FY15 primarily due to the low base effect and earnings upgrades in select stocks
• Though sentiments have already rebounded, an economic recovery and broad based earnings improvement will take time. Though some of the economic data points have shown signs of bottoming out, an all-round improvement in the macro situation still seems distant
• With limited number of potential alliance partners, a Modi-led NDA may find it difficult to corner a majority to form a government. We would witness an increasing dominance of regional parties, which may render the eventual alliance weaker, and puncture positive sentiments. Nonetheless, the market reaction to election results may be a short-term phenomena. Sentiments would pick up with implementation of positive and growth oriented reforms, along with improvement in other macroeconomic factors
• The government may be able to restrict the fiscal deficit to the 4.8% of GDP target by cutting plan expenditure by around 19% (| 1.04 lakh crore, ~ 1% of GDP) in FY14. However, even as non-plan expenditure continues to rise on the back of various social benefit schemes & subsidies and a challenging economic environment weighs on receipts, fiscal deficit challenges may resurface in FY15
• We expect WPI to come off by around 100 bps and CPI by 200 bps from current levels to 6.5% and 8-9%, respectively, for FY15. However, the pullback in inflation may not be enough to bring it within RBI’s comfort zone. Hence, we do not expect rate cuts during majority of the next calendar year. We believe interest rates are nearing their peak, and we may witness one more rate hike of 25 bps if inflation does not soften as expected
• Domestic equity markets had reacted vigorously to initial talks of QE tapering. However, with a slew of measures from the RBI and government and receding current account deficit, India looks better prepared for eventual liquidity tapering. We believe QE tapering would eventually turn out to be a non-event
Deal Team – At Your ServiceWhere are the markets headed in 2014?
• On the global front, India could face stiff competition from China for global funds. Chinese markets are down 8% YTD, as there were apprehensions over leadership change. With a smooth transition in leadership, relatively higher economic growth and inexpensive valuations, China is better placed than India, which faces challenges on all three parameters in FY15
• We expect the Sensex to trade at 15x one year forward EPS of 1543 (25% of FY14E EPS | 1361 and 75% FY15E EPS of | 1603) at 23000 by December 2014. Correspondingly, we expect the Nifty to reach 6900. However, if corporate earnings and economic recovery do not pan out as expected, we will continue to see volatility ridden markets next year
FY14E FY15ESensex EPS 1361 1603Weightage 25% 75%Target MultipleSensex / Nifty Target
15x23000 / 6900
Strategy 2014 - Sensex & Nifty Target
• Since we do not expect the economy to rebound meaningfully in the near future, we continue to favour defensive & quasi defensive sectors, which have healthy balance sheets. We like FMCG (growth to inch up, valuation modest in select pockets); auto (attractive valuation, good earnings delta in case of recovery). Also, we like private banks (sustained growth, better asset quality), telecom (higher regulatory clarity, de-leveraging) & cement (positive operating leverage, limited capacity addition)
• We are neutral on IT (demand intact, rich valuation), pharma (rich valuation, tepid domestic growth), oil & gas (earnings dependent on deregulation, limited volume growth) & media (earnings visibility intact, rich valuation)
• We remain negative on capital intensive sectors like PSU banks (asset quality concerns, earnings volatility), capital goods & infra (capex yet to revive, policy challenges to remain), power (regulatory overhang, uncertain demand), metals (low domestic growth, price volatility), real estate (muted earning cycle, leverage remains high), shipping (earnings stressed, increased tonnage capacity)
• Our top picks for the year are ITC, Bajaj Auto, Idea Cellular IndusInd Bank & Titan Industries in the large cap space and Marico, Shree Cement and Oberoi Realty in the midcap space.

4
Deal Team – At Your ServiceSensex weightage rebalancing: Sectoral earnings leaders and laggards
Source: Bloomberg, ICICIdirect.com Research(Top) Others represents FMCG, Power, Pharma, Telecom Real Estate; (Bottom) Defensives represents FMCG and Auto, Financial represents Banks and NBFCs, Export oriented represents IT and Pharma, Industrials represents Oil and Gas, Capital Goods, Metals, Power, Telecom and Real Estate
Sectoral Contribution to Sensex EPS
7.7 14.9 20.1 21.6 19.921.4
20.7 20.8 23.9 29.014.112.6 12.0 13.8 17.9
56.8 51.8 47.1 40.7 33.1
0%
20%
40%
60%
80%
100%
FY09 FY10 FY11 FY12 FY13
Defensives Financials Export oriented Industrials
Sectoral EPS CAGR over FY09-13 (%)
42.7%
21.6% 19.7%
-1.6%
-10%
0%
10%
20%
30%
40%
50%
Defensives Financials Export oriented Industrials
Sensex EPS Breakup
155 191 227 278 338 374 43896 107 123 139168 201
225
152217 189
235225
252281
5680 76
7979
6973
88 161182 153
193229
88
66157
124 3894
130
166
174
157127 164
179
226
724
9231,090
1,165 1,165
1,3611,603
11
0
200
400
600
800
1,000
1,200
1,400
1,600
FY09 FY10 FY11 FY12 FY13 FY14E FY15E
(|)
Banking and NBFC IT Oil and Gas Capital Goods Auto Metals and Mining Others* Total
EPS CAGR (FY09-13): 12.6%

5
Deal Team – At Your ServiceMarket Strategy 2014
Where are the markets headed in 2014?1
How would general elections influence the markets?2
Would the economy recover progressively?3
How would the FM bridge the fiscal gap?4
Has inflation peaked out to warrant a rate cut?5
Is the worst over for Rupee?6
What next as tapering begins?7
What are the potential speed breakers for the markets?8
Are cyclicals a good bet this year?9
Which sectors and stocks will find favour?10

6
• A lot of factors like demographics, voter-turnout, results in important states, vote share swings, caste based politics, social media, etc. will play an important role in the 2014 general elections. This makes the outcome highly unpredictable. Hence, we believe the opinion poll numbers should be taken with a pinch of salt. The opinion polls in 2004 and 2009 elections were way off the mark
• In the recent state elections in four major states, BJP won in Chhattisgarh, MP & Rajasthan and emerged as the largest party in Delhi. Although the victory of BJP does show anti-incumbency, we believe it would be imprudent to draw conclusions about national elections from these state
Deal Team – At Your Service
Year 2013
UPA NDA UPA NDA UPA NDA UPA NDA UPA NDA
Times Now-C Voter 128 184 134 156 117 186
Headlines Today-C Voter 132 179
ABP News-Nielsen 136 206
The Week-Hansa Research 184 197
CNN-IBN/The Hindu-CSDS 149-157 172-180
CNN-IBN/The Week-CSDS 134-142 187-195
Outcome of various opinion polls OctJan-Mar Apr-May May Jul
Chhattisgarh (90) Chg Delhi (70) Chg MP (230) Chg Rajasthan (200) Chg
INC 39 +1 8 -35 58 -13 21 -75
BJP 49 -1 32 +9 165 +22 162 +84
Others 2 0 30 +26 7 -9 16 -10
State Election: BJP sweeps 3 states; emerges largest party in Delhi
2004 results BJP Congress 2009 results BJP CongressAC Nielsen 200 100 Star Nielsen survey 153 155Outlook 197 101 CNN-IBN 135-150 145-160Actual 138 145 The Week 140 144
Business Standard 137 119TOI 135 154Actual 115 204
Opinion Polls - Historically way of the mark
How would general elections influence the markets?
Political Landscape – Is NDA’s resurgence enough for 2014 elections?
• A series of opinion polls conducted by different media houses in January-October 2013 suggest a sharp increase in the number of seats for the BJP led NDA, with most gains coming from the anti-incumbency facing Congress led UPA losing seats. While we do believe the NDA will gain from the anti-incumbency factor and projection of a popular prime-ministerial candidate, it may be difficult to achieve the majority number of 272 post elections, given the limited number of potential alliance partners.
Non-NDA parties dominating in larger constituency• The six major states, which constitute ~54% of the total Lok Sabha seats
are largely dominated by either UPA or regional parties. NDA has only 58 seats out of 291 Lok Sabha seats from these regions with no major allies from Andhra Pradesh (AP), Uttar Pradesh (UP) and West Bengal (WB). UPA, which formed the government in 2004 and 2009, has major allies and seat counts from these states. On the other hand, it will be difficult to draw any conclusions from the outcome of the recent state elections where the BJP has outperformed their close opponents as these four states constitutes only 13% of the total Lok Sabha seats. We believe the performance of regional parties would be a decisive factor in the upcoming elections where historically UPA has a clear edge over NDA in terms of coalition.
Source: Media sources, ECI, ICICIdirect.com Research
election results as these states contribute 72 seats (13% of the total number of Lok Sabha seats) and historically BJP had been strong in two out of the four states (MP and Chhattisgarh)

7
Increasing role of alliance• Indian politics in the last 15 years has evolved around alliances with
regional parties. Alliances played a major role for the BJP during 1999 government formation wherein it retained its quota of 182 seats despite a drop in vote share against the Congress. In 2004, the Congress realised that and pooled alliance partners and formed the government despite a decline in its vote share compared to 1999. Moreover, the BJP also lost its important allies between 1999 and 2009 (JDU, BJD, TMC, etc.) as well as vote share
Deal Team – At Your Service
Election Year Government BJP/INC seats Partners seats Partner seats as % of Alliance1998 NDA 181 73 28.71999 NDA 182 116 38.92004 UPA 145 129 47.12009 UPA 206 80 28.0
Increasing role of alliance partners
Election YearVote% Seats Vote% Seats
1998 25.8 141 25.6 1811999 28.3 114 23.8 1822004 26.5 145 22.2 1382009 28.6 206 18.8 116
Vote share of Congress and BJPCongress BJP
NDA allies 1999 2004 2009
JD(U) 18 8 20
Shiv Sena 21 12 11
DMK 15 - -
BJD 12 11 -
TMC 10 - -
PMK 8 - -
Indian National Lok Dal 5 - -
MDMK 5 - -
National Conference 4 - -
SAD 4 8 4
BJP Alliance partners
Political landscape – Is NDA’s resurgence enough for 2014 elections???
• The six major states, which constitute ~54% of the total Lok Sabha seats, are largely dominated by either UPA or regional parties. NDA has only 58 out of 291 Lok Sabha seats from these regions with no major allies from Andhra Pradesh (AP), Uttar Pradesh (UP) and West Bengal (WB).
• We believe the performance of regional parties would be a decisive factor in the upcoming elections where historically UPA has a clear edge over NDA in terms of collaborations.
• NDA has lost almost all its major allies except SAD and Shiv Sena. This implies that UPA still commands an edge in terms of coalition
Source: Media sources, ECI, ICICIdirect.com Research
Andhra Pradesh 2004 2009 Bihar 2004 2009BJP 0 0 BJP 5 12INC 29 33 JD (U) 6 20TDP 5 6 RJD 22 4TRS 5 2 INC 3 2Others 3 1 Others 4 2Total 42 42 Total 40 40
Maharashtra 2004 2009 TamilNadu 2004 2009BJP 13 9 BJP 0 0INC 13 17 INC 10 8Shiv Sena 12 11 DMK 16 18NCP 9 8 AIADMK 0 9Others 1 3 Others 13 4Total 48 48 Total 39 39
West Bengal 2004 2009 UP 2004 2009BJP 0 1 BJP 10 10INC 6 6 INC 9 21TMC 1 19 SP 35 23CPM 26 15 BSP 19 20CPI 3 0 RLD 0 5Others 6 1 Others 7 1Total 42 42 Total 80 80
Major Lok Sabha constituencies where regional parties have significant presence

8
Deal Team – At Your ServicePolitical landscape – Is NDA’s resurgence enough for 2014 elections???
However, economic reforms to take their own due course• Historically, the impact of general elections has been very less on the
economy as any economic reforms are a long term process to be implemented at the ground level. Therefore, the market reaction to the election would be a short-term phenomenon
• We highlight that market sentiments could improve only with the start of the positive outcome of economic reforms coupled with other economic factor (such as crude price, gold import, higher tax revenues)
Year Real GDP growth (%) Fiscal Deficit % GDP CAD% GDP31 Mar 15E 5.4 5.0 2.331 Mar 14E 4.8 4.8 2.631-Mar-13 5.0 5.2 4.831-Mar-12 6.2 5.8 4.231-Mar-11 9.3 4.8 2.831-Mar-10 8.6 6.5 2.831-Mar-09 6.7 6.0 2.331-Mar-08 9.3 2.5 1.331-Mar-07 9.6 3.3 1.031-Mar-06 9.5 4.0 1.231-Mar-05 7.1 3.9 0.431-Mar-04 8.0 4.3 -2.331-Mar-03 3.9 5.7 -1.231-Mar-02 5.4 6.0 -0.731-Mar-01 4.1 5.5 0.631-Mar-00 8.0 5.2 1.031-Mar-99 6.7 6.3 131-Mar-98 4.3 5.7 1.431-Mar-97 8.0 4.7 1.231-Mar-96 7.3 4.9 1.6
Macro indicators show little/no correlation with election year
Year Pre Election Post Election Party Prime Minister1991 -38% 144% INC P.V. Narshimha Rao1996 -6% -10% BJP+ United Front A.B. Vajpayee, HD Deve Gowda, IK Gujral1998 7% -22% BJP+ United Front A.B. Vajpayee1999 -29% 1% NDA A.B Vajpayee2004 -17% 27% UPA Manmohan Singh2009 25% 33% UPA Manmohan Singh
Historical 6 months Sensex performance post/pre central election
Source: RBI, Bloomberg, ICICIdirect.com Research

9
Deal Team – At Your ServiceMarket Strategy 2014
Where are the markets headed in 2014?1
How would general elections influence the markets?2
Would the economy recover progressively?3
How would the FM bridge the fiscal gap?4
Has inflation peaked out to warrant a rate cut?5
Is the worst over for Rupee?6
What next as tapering begins?7
What are the potential speed breakers for the markets?8
Are cyclicals a good bet this year?9
Which sectors and stocks will find favour?10

10
• We don’t expect economy to recover progressively from current growth levels in CY14 and accordingly expect the nominal GDP (market price) and real GDP growth to improve to 13% i.e. | 126.5 lakh crore and 5.4% i.e. | 60.8 lakh crore respectively in FY15E as against expected decade low growth of 4.8% in FY14. Our confidence stems from the facts that most of the lead economic indicators like IIP, M3, CV sales, etc not pointing towards near term recovery, Agri and Exports growth have helped Q2FY14 overall growth pickup however uptick in manufacturing yet not significant, GFCF’s (proxy for investment) incremental contribution (~21%) to growth is at its lowest level since 2004, thereby pointing towards poor capacity creation for future growth
• Agriculture which contributes ~14% of our GDP and provides employment to almost half of its work force , is expected to aid overall economic growth though not with the same intensity in FY15 as its growth is expected to come down to 3% from 4.5% growth estimate of FY14E. However, higher than expected Agri growth in FY14 can turn out to be a positive surprise and can be expected to spur the ‘slowing down’economy with its wide backward and forward linkages.
Deal Team – At Your Service
(%) FY12 FY13 FY14E FY15EReal GDP 6.5 5.0 4.8 5.4Nominal GDP (MP) 15.0 11.7 11.7 13.0Real GDP (| bn) 52436 55054 57722 60831Nominal GDP (MP) (| bn) 89749 94610 106420 120254Inflation WPI (Average) 8.9 7.4 6.8 6.2Repo rate (March) 8.5 7.5 8.0 7.5G-Sec (March) 8.5 8.1 8.6 8.0INR (Avg | / $) 47.9 54.4 60.2 60.0Trade Deficit (% of GDP) -10.1 -10.6 -8.6 -7.7Current account deficit (% of GDP) -4.2 -4.8 -2.6 -2.3Capital account deficit/surplus 3.7 4.8 3.4 3.1Fiscal deficit (% of GDP) 5.8 5.2 4.8 4.8
Key Parameters
Leading Indicators
80
120
160
200
240
280
H1FY
06
H2FY
06
H1FY
07
H2FY
07
H1FY
08
H2FY
08
H1FY
09
H2FY
09
H1FY
10
H2FY
10
H1FY
11
H2FY
11
H1FY
12
H2FY
12
H1FY
13
H2FY
13
H1FY
14
(%)
Real GDP Agri GDP WPI primaryReal credit Real Deposit Real corp salesCommercial Vehicles IIP manufacturing M3
Would the economy recover progressively?
• We have evaluated key lead indicators (mentioned in the chart) that provide early signals about the movement in the economy. For thepurpose of assessment, we have deflated these indicators to real terms and further indexed from FY06. As seen in the Leading Indicators chart, till H1FY14, none of the readings have provided any signals of recovery. Real growth has been higher and consistent only across financial services segments like credit, deposit growth. However, Commercial Vehicles (CV) sales volume and IIP manufacturing are yet to show signs of revival. WPI primary article is depicting high inflation in food prices every quarter. Agri GDP growth came strong at 4.8% in Q2FY14, but still remains a small contributor on absolute basis and has not grown in real terms over the years as seen in the indexed chart above
Source: RBI, ICICIdirect.com Research
Real GDP (%) FY13 FY14E FY15EAgri 1.9 4.5 3.0Services 7.1 6.2 6.8Industry 2 2 3
Real GDP growth (%)

11
• The share of GFCF towards GDP growth has dipped to ~21% in FY13 and is still lower in H1FY14 compared to periods of sustained growth during FY04-08 where it contributed more than 40% to overall growth. The capex cycle is still struggling as indicated by jump in projects stalled as a % of implemented projects, cost escalations, decline in capex based funding through banks/FIs. Revival of GFCF is crucial for growth sustenance which in-turn requires stable savings to fund future growth
• Domestic savings which feeds the investment, has also taken a knock declining to 29.6% respectively in FY13 compared to an average savings rate of 34% over FY05-FY11. Within overall savings, net financial Savings (% of GDP) has declined to 7.7% in FY13 from 12% earlier. The recent efforts by RBI signal a higher focus to curtail inflation by raising interest rates in the system. This would likely have a positive impact on deposit growth (8%- YTD FY14), which can eventually lead to money moving into financial savings (currently at 7.7% of GDP in FY12) and thereby capital formation via credit.
• Accordingly, we believe the focus of the policymakers would be to revive financial savings though deposits and other long term financial savings instruments which can be channelized through credit for capacity creation.
Deal Team – At Your ServiceGFCF contribution incrementally declining in GDP
31
58
4237
43
28 2832
23 2113
186
0
1020
30
40
5060
70
80
FY03 FY04 FY05 FY06 FY07 FY08 FY09 FY10 FY11 FY12 FY13 Q1FY14
Q2FY14
(%)
Gross fixed capital formation
Still time to see revival in GFCF…
Source: RBI, ICICIdirect.com Research(Top Left) Financial Savings data available only till FY12
Savings Rate in India
29.8
7.7
31.833.8
32.3
36.933.4 34.6
30.8
9.112.210.211.711.3
11.9
29.631.7 30.631.7
32.432.931.3
30.3
5
1015
20
25
3035
40
FY06 FY07 FY08 FY09 FY10 FY11 FY12 FY13
(%)
Savings % GDP Financial Savings % GDP GFCF % GDP

12
Deal Team – At Your Service
In | crore FY06 FY07 FY08 FY09 FY10 FY11 FY12 FY13 FY14 Beyond FY14
Banks/FIs 972 1,653 2,091 2,768 3,079 3,367 3,290 2,374 1,388 724
ECB/FCCB 220 459 373 417 288 318 383 535 227 77
Total 1,192 2,112 2,464 3,185 3,367 3,685 3,673 2,909 1,615 801
Declining capex based on funding by banks / FIs / ECB
Project implementation & growth
0.0
1000.0
2000.0
3000.0
4000.0
5000.0
FY05 FY06 FY07 FY08 FY09 FY10 FY11 FY12 FY13
(000
' cro
res)
020406080100120
(%)
Govt. projects under implementation Pvt. projects under implementation
% Govt project growth % Pvt. Project growth
Stalled projects as a % of implemented projects
1.9
0.1
2.6
0.9 0.71.6
2.8
0.8
4.8
1.0 0.80.9
1.8
0.9 0.4
1.21.6
0.2 0.40.9 1.1
1.71.41.1
1.71.1
3.4
-1.00.01.02.03.04.05.06.0
FY05 FY06 FY07 FY08 FY09 FY10 FY11 FY12 FY13
(%)
Government Private Total
When do we expect the economy to revive?
Source: RBI, CMIE, ICICIdirect.com Research
• The recent efforts by RBI signal a higher focus to curtail inflation by raising interest rates in the system. This would likely have a positive impact on deposit growth (8%- YTD FY14), which can eventually lead to money moving into financial savings (currently at 7.7% of GDP in FY12) and thereby capital formation via credit. This has ability provide a much needed boost to the economy for revival.
• Analysing the funding by banks and Financial institutions and via ECB/ FCCB for capital expenditure by Indian industries, there is a clear declining trend.
• We don’t see major change in the current tepid capex scenario till H1FY15, primarily due to general election being scheduled in May-June2014. Also, for any progress to be visible post new government, it can be seen only by H2FY15.
Contribution of sectors in incremental real GDP
• For FY14, Incremental GDP is expected to be supported by financial and agri section contributing 34.4% and 12.8% respectively. Whereas FY15 is expected to see marginal revival in industrial growth contributing 8.1% vs2.3% in FY14, (assuming marginal uptick in IIP) which shall lead Real GDP to grow at 5.4% in FY15
• So overall, for FY14E real agriculture gdp is expected to grow by 4.5% better than previous year, services at 6.2% and Industry at 1.9% taking overall growth to 4.8%.
Real GDP (%) FY13 FY14E FY15EAgri 13.7 13.6 13.3Services 67.4 68.1 68.8Industry 18.9 18.2 17.8
Contribution to Real GDP

13
Deal Team – At Your ServiceMarket Strategy 2014
Where are the markets headed in 2014?1
How would general elections influence the markets?2
Would the economy recover progressively?3
How would the FM bridge the fiscal gap?4
Has inflation peaked out to warrant a rate cut?5
Is the worst over for Rupee?6
What next as tapering begins?7
What are the potential speed breakers for the markets?8
Are cyclicals a good bet this year?9
Which sectors and stocks will find favour?10

14
Particulars FY14BE FY14IE Difference CommentsRevenue ReceiptsNet Tax revenue 884,078 844,434 (39,644) Tax revenue to fall short of budgeted target led by poor macro environmentNon Tax RevenuesDividend 73,866 83,000 9,134 Higher dividend boosted by superior RBI dividend in FY14Economic services 62,973 54,013 (8,960) Expect shortfall in spectrum revenues Others 35,413 35,413 - Total 1,056,330 1,016,860 (39,471) Capital ReceiptsRecovery of Loans 10,654 10,654 - Disinvestments 55,814 36,266 (19,548) Expect shortfall of ~| 19500 crore in disinvestment proceeds given the tough capital market conditions and delay in disinvesment processTotal 66,468 46,920 (19,548) Total Receipts [A] 1,122,798 1,063,780 (59,019) Non plan ExpenditureSubsidiesFertilizer 65,972 75,972 10,000 Food 90,000 100,000 10,000 Petroleum 65,000 92,298 27,298 Rupee depreciation and spill over effect of last year would lead to an additional burden of ~| 27,300 crore Other subsidies 10,112 10,112 - Other expenditure 878,891 871,364 (7,527) Total 1,109,975 1,149,746 39,771 Plan Expenditure 555,322 450,646 (104,676) Expect 19% cut in plan expenditure Total Expenditure [B] 1,665,297 1,600,393 (64,904) Fiscal deficit [B-A] 542,499 536,613 (5,886) GDP estimates 11,371,886 11,223,094 NAFiscal deficit as % of GDP 4.8% 4.8% Govt. to meet its fiscal deficit target albeit at a cost of lower future growth
Government Revenue & Expenditure
Deal Team – At Your ServiceHow would the FM bridge the fiscal gap?
Maneuvering the fiscal target through rationalisation of Plan Expenditure• A sustained cut in Plan expenditure (at the cost of growth) would be the key lever for the govt. to attain its budgeted fiscal deficit target of 4.8% in FY14,
given the weaker revenue receipts, delay in disinvestment process and higher subsidy burden (food & petroleum).
• We anticipate a sharp cut of ~19% in Plan expenditure (| 1.05 lakh crore or 0.9% of GDP ) by the govt. in FY14E. However, the challenges are expected to resurface again in FY15E as the slower growth would continue to weigh on receipts, along with higher subsidies (mainly food).
Source: Budget Documents, MoF, ICICIdirect.com Research

15
MGNREGA allocation could go up ...
2970039060 40095
33000 33000
0
9000
18000
27000
36000
45000
FY10 FY11 FY12 FY13 FY14E
| cr
ore
MGNREGA Increase
Increase of |3465 crore due to indexation with CPI (Rural)
Deal Team – At Your ServiceAdditional fiscal burden and key challenges before the government
No respite from Non Plan Expenditure• Looking at the current fiscal position (till October, 2013), non-plan
expenditure has already been reached close to 60% of total budgeted target (includes various social schemes & subsidies) implying that FY14 could again see a higher non-plan expenditure largely contributed by subsidies.
Subsidy pain not to subside…• Among the non-plan expenditure, subsidies have been a significant drain,
which are further likely to go up to 2.4% of GDP (from earlier estimates of 2.0% of GDP) on account of higher food prices and weak rupee.
• Fuel subsidies were budgeted to fall by 30% to | 65,000 crore but rupee depreciation and spill over effect of earlier budget would lead to an additional burden of | 27,300 crore in this fiscal.
Linking MGNREGA with inflation could increase the cost further…• The government is likely to link the wages under MGNREGA (Mahatma
Gandhi National Rural Employment Guarantee Act) with the consumer price inflation index in lieu of the rising food inflation in the country.
Particulars | croreMGNREGA FY14E Budget (| crore) 33,000IndexCPI (AL) 12.5%CPI (Rural) 10.5%Additional Burden (| crore)CPI (AL) 4,125CPI (Rural) 3,465Revised Allocation (FY14E Budget) (| crore)CPI (AL) 37,125CPI (Rural) 36,465
Revised Allcation of MGNREGA
Source: Economic Advisory Council Discussion Paper, Ministry of Agriculture, Budget Documents, MoF, ICICIdirect.com Research
Lower growth, challenging economic environment to weigh on receipts• Amid slowing economy growth and upcoming elections, the growth in tax
revenues is expected to moderate further to 13.1% (net | 8,39,000 crore) vs. projected net tax revenue growth of 19.1% (i.e. net | 8,84,000 crore).
• We expect revenue shortfall of ~|14,880 crore from the telecom sector. The government had initially budgeted for |40847 crore from “Other communication Services”. In the first quarter of the fiscal, government has collected | 4556 crore in form of license fees and spectrum usage charges. In FY14E, we expect the government to collect about |17,975 crore in form of recurring revenue and | 7992 from spectrum auction to be held in January 2014. Hence the total revenue from telecom sector would be close to | 25967 crore in FY14E.
This would increase government’s burden further by 10-13% (CPI-rural is 10.5% and CPI-Agricultural labour (CPI-AL) is 12.5%), that is |3465 - |4125 crore, on the current year’s allocation of |33,000 crore towards the scheme.

16
Deal Team – At Your Service
Disinvestment proceeds could again miss its target…• Due to the challenging equity market conditions and delays in the
disinvestment process by the government we expect a shortfall of~|19500 crore from disinvestment proceeds. The government could resort to higher dividend income from the PSU’s in order to compensate for the shortfall in disinvestment target.
Additional fiscal burden and key challenges before the government
Achieving 4.8% Fiscal deficit target in FY14E comes with riders• Despite this, we believe there will be a need for successful upcoming
spectrum auction and speeding up in disinvestment process to meet the deficit target. In addition, the government will have to take anti-growth steps to rein in spending cuts majorily in plan expenditure (we build in 19% cut from the budgeted target in plan expenditure). Given thechallenging macro & time constraints, the government is also weighing an option of taking higher dividends from PSUs to meet up the shortfall of disinvestment target. Taking these in to our consideration, we project 4.8% fiscal deficit in FY14E.
Revenues from Disputed tax cases could be a saviour• The government is also aggressively pursuing settlement of outstanding
tax claims against MNCs, ~|52800 crore (refer to table on top right), to make up a revenue shortfall and circumvent the threat of credit rating downgrade. We believe that any inflow from this source could be a kicker for the budget.
Particulars | croreDisinvestment Target (FY14E) 55,814Expected disinvestment proceedsPSU's Power Grid 1,666 Coal India 8,500 Indian Oil 4,500Divestment of stake in non govt. cos. 21,600Expected disinvestment by March,2014 36,266Shortfall in target 19,548
Disinvestment Proceeds hinges on non-govt divestment
MNC's tax disputes Amt. (| crore)Nokia 21,000Vodafone 11,200IBM 5,357Royal Dutch Shell 15,220
Disputed Tax cases
Source: Trai, Budget Documents, MoF, ICICIdirect.com Research
Further strain on FY15E budget due to NFSB• Food subsidy bill will leg-up by ~|10,000 crore in the FY14E budget
(~|50,000 crore in the FY15E budget) following the implementation of the National Food Security Bill (NFSB) and rising food prices.
Offtake of 100% As per current MSPSubsidy burden due to NFSB 92060 106446Other ExpenditureExp. To procure extra food grains 22120 22120Cost of Handling Grains, Logistics, PDS reforms etc. 15000 15000Total Expenditure 129180 143566
Expenditure for NFSB
Increase in MSP further in FY15E could swell up this figure further straining the fiscal deficit target
Particulars | croreExpected revenue from spectrum auction 7,992Other recurring revenue 17,975Total Revenue from Telecom Sector 25,967Estimated revenue from telecom (FY14BE) 40,847Shortfall from telecom revenue 14,880
Revenue from Telecom to fall short of target

17
Deal Team – At Your ServiceHow would FY15 budget look like?
FY14BE FY14IE FY15IE YoY (%) CommentsRevenue ReceiptsNet Tax revenue 884,078 844,434 964,443 14.2 We estimate 14.2% YoY growth in FY15's net tax collection led by ~15% & 18% growth in corporate tax and service tax
respectively. Custom duty and excise duty collection is estimated at ~7% given the modest import and manufacturinggrowth respectively.
Non Tax RevenuesDividend 73,866 83,000 65,000 (21.7) We budget | 65000 crore of dividend receipts in FY15 adjusting for higher RBI dividend which govt. received in FY14.Economic services 62,973 54,013 54,013 - We build in similar economic services receipt based on flattish spectrum & other receiptOthers 35,413 35,413 38,051 7.5 Total 1,056,330 1,016,860 1,121,507 10.3 Capital ReceiptsRecovery of Loans 10,654 10,654 11,719 10.0 Disinvestments 55,814 36,266 30,000 (17.3) We build in disinvestment proceeds of ~| 30,000 crore in FY15Total 66,468 46,920 41,719 (11.1) Total Receipts 1,122,798 1,063,780 1,163,227 9.3
Non plan ExpenditureSubsidiesFertilizer 65,972 75,972 75,972 - Food 90,000 100,000 143,566 43.6 Food subsidy is expected to grow by ~42% YoY assuming the full implementation of food subsidy bill.Petroleum 65,000 92,298 71,538 (22.5) Petroleum subsidy is expected to decline by ~23% assumping monthly diesel price price hike of 50p/lt and full
implementation of LPG susidy cap.Other subsidies 10,112 10,112 10,515 4.0 Other expenditure 878,891 871,364 971,239 11.5 Total 1,109,975 1,149,746 1,272,831 10.7 Plan Expenditure 555,322 450,646 518,243 15.0 We budget a 15% YoY growth in Plan expenditure given the lower base since the last 2 years.Total Expenditure 1,665,297 1,600,393 1,791,074 11.9
Fiscal deficit 542,499 536,613 627,847 GDP estimates 11,371,886 11,223,094 12,682,097 13.0
Fiscal deficit as % of GDP 4.8% 4.8% 5.0% We expect the fiscal deficit at 5% in FY15 as we believe that slower growth would continue to weigh on receipts.
Government Revenue & Expenditure
Source: Budget Documents, MoF, ICICIdirect.com Research

18
Deal Team – At Your ServiceMarket Strategy 2014
Where are the markets headed in 2014?1
How would general elections influence the markets?2
Would the economy recover progressively?3
How would the FM bridge the fiscal gap?4
Has inflation peaked out to warrant a rate cut?5
Is the worst over for Rupee?6
What next as tapering begins?7
What are the potential speed breakers for the markets?8
Are cyclicals a good bet this year?9
Which sectors and stocks will find favour?10

19
.... Core WPI can be a major contributor FY15E inflation
Other Primary articles
2%
Fuel14%
Core 49%
Food35%
• Core inflation (Weight: 55%) may scale up to 3.8% from 2.6% currently primarily on account of waning high base effect (Core inflation peaked at 6% in August 2012 and since then has seen a slide for consecutive 10 months) leading to Manufactured goods inflation to move up from average 3.30% in CY13 to 4.20%. Also, further upside risk to the same remains if pick up in growth leads to higher pass on of increased raw material cost and a wage price spiral
• Similarly, CPI may also come down from current high of 11.24% onsoftening of food prices but may stay elevated at 8-9% FY15E
We believe, RBI may maintain status quo on the benchmark Repo rate for the majority part of the next calendar year as we do not expect headline inflation (both WPI and CPI) to come down “significantly”. For FY15, we expect WPI inflation to average 6.5% and Consumer Price Inflation (CPI) to come in the 8-9% range, lower from the current levels but expected to be above the RBI comfort zone. Also, if the fall in food inflation fails to bring down the headline inflation significantly as is expected by RBI, a marginal 25bps repo rate hike in the near term cannot be ruled out taking repo rate to the 8% mark
Deal Team – At Your Service
Wholesale price inflation % (WPI)
7.31
7.28
5.65
4.77
4.58
5.16
5.85
6.99
7.05
7.00 7.
52
6.50 7.
00
6.50
4.04.55.05.56.06.57.07.58.0
Jan-
13
Feb-
13
Mar
-13
Apr
-13
May
-13
Jun-
13
Jul-1
3
Aug
-13
Sep-
13
Oct-1
3
Nov
-13
Dec-
13
Mar
-14
FY15
Food was a major contributor to current inflation ...
Other Primary articles
2%
Fuel26%
Core 17%
Food55%
Has inflation peaked out to warrant a rate cut?
Source: CSO, Bloomberg, ICICIdirect.com Research
• For FY15, we expect WPI to average at 6.5%, a decline of 100bps from current level due to softening of food inflation (weight 24%) and fuel inflation (weight 14.9%). However core inflation (weight: 55%) is expected to inch up from current 2.6% levels by around 120 bps to 3.8% keeping headline WPI sticky
• Food inflation is at 19.9% (November 2013) on account of unusual spurt in price of vegetables. Once this fades off, food price inflation may come down to 12% by March 2014 and further move downwards given the lower MSP hikes and a bumper harvest this year.
• Diesel price hike added 100 bps to CY13 inflation on direct basis and in CY14 it may add another 60bps (direct impact) to the headline WPI inflation if | 0.50 hike continues (factored in our estimate). However, range bound global crude price may lead to stable prices of freely priced fuels which can drag fuel inflation lower to 4-5% from current 11%

20
Deal Team – At Your Service
Real interest rates (%)
-10.0
-5.0
0.0
5.0
10.0
15.0
20.0
Apr
-05
Apr
-06
Apr
-07
Apr
-08
Apr
-09
Apr
-10
Apr
-11
Apr
-12
Apr
-13
Real Interest Rate* Reverse Repo CPI IW
When would inflation, interest rates come down?
RBI needs to address negative real interest rate environment
• Real interest rates have been negative for investors since March 2009, discouraging them from financial savings. Since inflation is sticky, nominal interest rates needs to be higher to encourage financial savings.
• Although inflation is likely to be lower in 2014 from the elevated levels witnessed in 2013, it will still be higher and may not lead to meaningful positive real rate of return so as to encourage financial savings. RBI may also consider this aspect while considering any rate cuts and would want to encourage financial savings by providing impetus in terms of higher nominal interest rates and improve financial savings over a medium term
Source: RBI, Bloomberg, ICICIdirect.com Research(Right) Physical and Financial savings data available only till April 2012
Financial savings as % of GDP
-15-10-505
101520
Apr
-05
Oct-0
5
Apr
-06
Oct-0
6
Apr
-07
Oct-0
7
Apr
-08
Oct-0
8
Apr
-09
Oct-0
9
Apr
-10
Oct-1
0
Apr
-11
Oct-1
1
Apr
-12
Oct-1
2
Apr
-13
Oct-1
3
02468101214
SBI deposit rate-CPI Physical Savings(% of GDP)RHS
Financial Savings(% of GDP) RHS
• Total Savings have dropped from 37% of the GDP in FY2008 to less 30% currently. In FY12, financial savings have fallen to 8% of the GDP from 12% in FY06. Physical savings during the same period has increased to 14.3% from 11.7%.
• Despite muted returns in physical asset (Gold -3% while property prices down from the levels at the start of the year), major indicators indicate no signs of improvement in financial savings.

21
Deal Team – At Your ServiceMarket Strategy 2014
Where are the markets headed in 2014?1
How would general elections influence the markets?2
Would the economy recover progressively?3
How would the FM bridge the fiscal gap?4
Has inflation peaked out to warrant a rate cut?5
Is the worst over for the rupee?6
What next as tapering begins?7
What are the potential speed breakers for the markets?8
Are cyclicals a good bet this year?9
Which sectors and stocks will find favour?10

22
Deal Team – At Your ServiceIs the worst over for the rupee?
Rupee to have an appreciating bias as CAD situation & BOP improves
• We expect the rupee to have an appreciating bias in CY14E on account of improvement in current account balance and RBI's effective intervention to handle capital flows. Increase in India’s Balance of Payments surplus (forex reserves) owing to an improved CAD situation from 4.8% in FY13 to 2.3% in FY15E is likely to lead to strengthening of the Indian Rupee in the forthcoming year.
• Reduced gold imports due to government restrictions, increase in exports due to better competitiveness and stable invisibles (software services and remittances) will ease India’s CAD, going forward. It may also enable the government to loosen its curbs on gold import (likely to contribute ~65% towards reduction in trade deficit in FY14E)
• The capital flows hold the key in improving India’s BOP as it has remained volatile over the past two years. Considering that the US fed tapering might now happen in a staggered manner, we believe India now is better placed to withstand the volatility of currency as it is likely to keep its CAD in check
• India’s option to enter global emerging markets bond index may bring additional capital flows of $14-18 billion initially, thereby improving the rupee
Source: RBI Handbook, Commerce Ministry, ICICIdirect.com Research
($ billion) FY10 FY11 FY12 FY13 FY14E FY15ETrade Balance (a) -118.4 -130.5 -189.8 -195.7 -159.1 -161.5As a % of GDP 8.7 7.6 10.1 10.6 8.6 7.7Invisiblies (b) 80.0 84.7 111.6 107.5 109.9 113.0-Software services 48.2 53.3 61.0 63.5 67.3 71.4-Transfers 52.0 53.1 63.5 64.3 65.0 66.3-Others -20.3 -21.8 -12.9 -20.4 -22.4 -24.6Current Account (c=a+b) -38.4 -45.8 -78.2 -88.2 -49.1 -48.4As a % of GDP 2.8 2.7 4.2 4.8 2.6 2.3Foreign Investment (i) 50.4 39.7 39.2 46.7 20.5 36.6-FDI 18.0 9.4 22.1 19.8 22.4 24.6-FII 32.4 30.3 17.2 26.9 -1.9 12.0Loans (ii) 12.4 28.4 19.3 31.1 18.2 19.9Bank Capital (iii) 2.1 5.0 16.2 16.6 31.5 16.4Rupee Debt Service (iv) -0.1 -0.1 -0.1 -0.1 -0.1 -0.1Other Capital (v) -13.2 -11.0 -6.9 -5.0 -7.0 -7.0Capital Account (i-v) (d) 51.6 62.0 67.8 89.3 63.2 65.9As a % of GDP 3.8 3.6 3.6 4.8 3.4 3.1Errors and Omissions (e) 0.0 -3.0 -2.4 2.7 -1.0 -1.0Balance of payments (c+d+e) 13.3 13.2 -12.8 3.8 13.0 16.5
Current Account Balance
Indian petroleum and gold imports
5.7
35.8
10.0 11.0 11.5 11.06.4
36.333.431.728.730.2
0
50
100
150
200
FY10 FY11 FY12 FY13 FY14E FY15E
US$
billio
n
0
10
20
30
40
50
(%)
Gold import (LHS) Petroleum pdts import (LHS)
Gold import as % of total import (RHS) PP import as % of total import (RHS)

23
Deal Team – At Your Service
($ billion) FY10 FY11 FY12 FY13 FY14E FY15EImports 288.4 369.8 489.3 490.7 466.3 497.1Petroleum Products 87.1 106.0 155.0 164.0 169.1 178.1Gold 28.8 40.7 56.5 53.8 29.9 28.4Electronic Goods 21.0 26.6 32.7 31.4 33.7 35.7Machinery(Excl. Electronic Goods) 19.7 23.9 30.1 27.6 23.9 25.3Pearls & Precious stones 16.3 34.6 28.2 22.7 24.0 25.2Others 115.5 138.1 186.9 191.2 185.7 204.3Exports 178.8 251.1 306.0 300.4 313.3 341.6Petroleum Products 28.2 41.5 56.0 60.9 66.2 70.7Gems & Jewellery 29.1 40.5 44.9 43.3 42.1 44.2Transport Equipments 9.8 16.0 21.4 18.4 21.9 24.5Machinery and Instruments 9.6 11.9 14.3 15.3 15.7 17.2Pharmaceuticals & Chemicals 9.0 10.7 13.2 14.7 15.2 17.5Others 93.2 130.5 156.1 147.9 152.2 167.4Trade Balance -109.6 -118.6 -183.4 -190.3 -153.1 -155.5
India's trade account balance
How would the currency fare?
• We believe there will be an improvement in trade deficit (difference between merchandise imports and exports) from 10.6%of GDP in FY13 to 8.6% and 7.7% of GDP in FY14E and FY15E, respectively, owing to curtailed gold imports and pick-up in exports (India’s enhanced competitiveness due to weaker currency)
• Reduced gold imports are expected to contribute ~65% towards reduction in the trade deficit. As per our sensitivity analysis, a 20% increase in gold imports could push the CAD higher to 2.6% (US$54.1 billion) of GDP in FY15E
Source: RBI Handbook, ICICIdirect.com ResearchNote: The commerce ministry data varies marginally from that stated in RBI Handbook
($ billion) Bear Base BullGoldImport value 34.1 28.4 22.7CAD -54.1 -48.4 -42.7CAD as a % of GDP 2.6 2.3 2.0Petroleum productsCrude ($/barrel) 120.0 110.0 100.0Import value 194.3 178.1 161.9CAD -58.2 -48.4 -38.7CAD as a % of GDP 2.8 2.3 1.8
Sensitivity of CAD to gold/crude oil imports
Elections, government finances and currency
4.85.8
6.55.4 5.7 6.2 5.9
4.5 4.0 4.13.3
2.5
6.0 6.5
4.95.8
4.9
-4
-2
0
2
4
6
8
FY97
FY98
FY99
FY00
FY01
FY02
FY03
FY04
FY05
FY06
FY07
FY08
FY09
FY10
FY11
FY12
FY13
(%)
-32
-16
0
16
32
48
64
(|/$
)
Fiscal Deficit to GDP CAD to GDP |/$
• While CAD continues to remain one of the key determinants of thecurrency movement, the fiscal situation is also important in determination of the direction of the currency movement. A higher than budgeted fiscal deficit might weigh on the domestic liquidity and may limit RBI's capacity to handle the forex stress

24
Deal Team – At Your ServiceMarket Strategy 2014
Where are the markets headed in 2014?1
How would general elections influence the markets?2
Would the economy recover progressively?3
How would the FM bridge the fiscal gap?4
Has inflation peaked out to warrant a rate cut?5
Is the worst over for Rupee?6
What next as tapering begins?7
What are the potential speed breakers for the markets?8
Are cyclicals a good bet this year?9
Which sectors and stocks will find favour?10

25
Tapering could be non-event as growth recovery on radar• After almost three years of anxiety over the ever boiling European
sovereign debt crisis (which it was feared would culminate into eurozone disintegration) the world seemed to have fathomed the issue and had some different aspects to discuss for CY13. The year saw a preconceived obsession towards the US Federal Reserve’s decision to taper (which starts at last) its expansive policy as the agency kept investors across-the-globe on tenterhooks with it’s ‘Catch me if you can’ approach. The unprecedented rift in the US between the Democrats and Republicans and geopolitical issues such as the island row between China and Japan remained in the limelight as did Iran’s isolation and subsequent settlement. Another over-emphasised issue like the Chinese hard landing also faded in due course as the recovery momentum in the economy was slightly stronger and more sustainable than what many had expected
• CY14 is likely to carry forward the apprehensions of liquidity squeeze on the back of a resumption of US tapering as most market players will try to weigh the benefits of higher US growth against the inevitable reduction in unhindered liquidity. With the passage of time, the world is likely to digest these apprehensions while it is also expected to have positive repercussions in the nature of growth. Suffice to say this event may also turn out to be a non-event as the Fed has vowed to keep interest rates at the current level beyond tapering
• After going through the motions for the better part of 2013, India looks better prepared for a possible tapering off (and its impact on the currency) as the government has taken scores of measures such as curbs on gold imports, opening of special window for OMCs, attracting FCNR (B)deposits, hike in bond limits, etc. Concerns regarding overshooting of the current account deficit (CAD), which overshadowed the real concern of fiscal deficit in mid-year, are clearly showing signs of waning
• Europe finally had something to cheer about with the second and third quarter GDP (sequential) growth picking up across Europe, ending an 18-month economic decline. This, along with re-election of German
Deal Team – At Your ServiceWhat next as tapering begins?
Chancellor Angela Merkel, a firm advocate of eurozone integrity, augurs well for the region as it will provide more breathing space to the periphery
• The Chinese economy defied the prediction of hard landing at the start of the year after the leadership change as GDP growth was in line in two out of three quarters. The Chinese government unwrapped its boldest set of economic and social reforms in nearly three decades in order to put the world's second-largest economy on a more stable footing. With this, the new regime has already made clear its intention to bring the economy to its normalised growth path. What may bother investors are its geopolitical ambitions as it has intensified its rift with Japan over the Senkaku islands in East China Sea and with scores of nations over some more islands in the South China Sea
Source: IMF, ICICIdirect.com Research
CY12 CY13P CY14PWorld 3.2 2.9 3.6Advanced Economies 1.5 1.2 2.0 United States 2.8 1.6 2.6 Euro -0.6 -0.4 1.0 Germany 0.9 0.5 1.4 France 0.0 0.2 1.0 Italy -2.4 -1.8 0.7 Japan 2.0 2.0 1.2BRIC nations Brazil 0.9 2.5 2.5 Russia 3.4 1.5 3.0 India 3.2 3.8 5.1 China 7.7 7.6 7.3
IMF world economic outlook

26
S&P 500
1,000
1,200
1,400
1,600
1,800
2,000
2,200
2,400
Jan-
12
Mar
-12
May
-12
Jul-1
2
Sep-
12
Nov
-12
Jan-
13
Mar
-13
May
-13
Jul-1
3
Sep-
13
Nov
-13
Deal Team – At Your Service
US unemployment rate & non-farm payroll
-400
-300
-200
-1000
100
200
300
400
Dec-
10
Mar
-11
Jun-
11
Sep-
11
Dec-
11
Mar
-12
Jun-
12
Sep-
12
Dec-
12
Mar
-13
Jun-
13
Sep-
13
5
6
7
8
9
10
%
Non Farm Payroll (LHS) Unemployment Rate
US Cons. sentiments & housing starts
5060
7080
90
Sep-
10
Jan-
11
May
-11
Sep-
11
Jan-
12
May
-12
Sep-
12
Jan-
13
May
-13
Sep-
13
x
500
700
900
1100
Uni.Mic.Consumer Sentiment (LHS)
Housing starts ('000)
US GDP Growth & ISM Mfg PMI
1.4
4.9
3.7
1.2
2.8
1.1 2.
5
4.1
0.1
53.2 52.9
56.2
0
1
2
3
4
Sep-
11
Dec-
11
Mar
-12
Jun-
12
Sep-
12
Dec-
12
Mar
-13
Jun-
13
Sep-
13
(%)
48
5052
5456
58
(x)
GDP Growth (LHS) ISM Mfg PMI
US tapering makes landfall…only surprise, no shock
Though modest tapering will start in January 2014; the Fed has assured of near zero interest rates beyond the initial stated period. On the brighter side, the Fed panel seems to have been convinced that the US economy is on the recovery path
Source: Federal Reserve, Bloomberg, Reuters, ICICIdirect.com Research
Apr-12 Jun-12 Sep-12 Dec-12 Mar-13 Jun-13 Sep-13 Dec-132012 3 3 12013 3 3 3 2 1 12014 7 7 2 3 4 3 3 22015 4 6 12 13 13 14 12 122016 1 1 1 1 2 3
FOMC participants’ assessments of appropriate timing of monetary policy firming
Date Event
♦ Sep-12 Fed to launch QE3 by buying US$40 billion each month
♦ Dec-12 Fed to buy more bonds worth US$45 billion per month as it sets jobless target♦ Jan-13 Bernanke signals tapering could begin at end of 2013♦ May-13 Bernanke tells Congress possible slowdown in bond buying
♦ Jun-13 Bernanke says it could begin tapering later this year subject to economic improvement
♦ Sep-13 Fed decides not to taper and continues bond buying
♦ Dec-13 Fed starts taperering by $10 bn to $75 bn from January, 2014
Chronology of Fed events

27
FTSE Eurofirst 300
800
1,000
1,200
1,400
1,600
1,800
Apr
-11
Jun-
11
Aug
-11
Oct-1
1
Dec-
11
Feb-
12
Apr
-12
Jun-
12
Aug
-12
Oct-1
2
Dec-
12
Feb-
13
Apr
-13
Jun-
13
Aug
-13
Oct-1
3
Dec-
13
Eurozone PMI
40
45
50
55
60
Nov
-10
Mar
-11
Jul-1
1
Nov
-11
Mar
-12
Jul-1
2
Nov
-12
Mar
-13
Jul-1
3
Nov
-13
x
Deal Team – At Your ServiceEurope: Disintegration ghost exorcised; some light at the end of the tunnel…
Anxiety over the European sovereign debt crisis and fears of a likely breakup seem to have subsided helped by unlimited QE by ECB. The focus is back on the macro – the euro region came out of recession after six quarters
Source: Bloomberg, Reuters, ICICIdirect.com ResearchLTRO : Long term refinancing operation, ESM: European Stability Mechanism, EFSF: European Financial Stability Facility
Eurozone Unemployment rate (%)
9.5
10.5
11.5
12.5
Oct-1
0
Feb-
11
Jun-
11
Oct-1
1
Feb-
12
Jun-
12
Oct-1
2
Feb-
13
Jun-
13
Oct-1
3
%
Eurozone GDP growth (%)
0.1
-0.2 -0
.1
-0.3 -0
.1
-0.5
-0.2
0.3
0.1
-1.0
-0.5
0.0
0.5
Sep-
11
Dec-
11
Mar
-12
Jun-
12
Sep-
12
Dec-
12
Mar
-13
Jun-
13
Sep-
13
%
Date Event♦ May-11 Portugal becomes second country to seek EFSF bailout to which Eurogroup agrees ♦ Oct-11 Eurozone leaders agree to amend EFSF mechanism to €780 billion and boost ESM
firepower to €1 trillion♦ Dec-11 LTRO 1, worth €489 billion to 523 banks, announced
♦ Mar-12 LTRO 2, worth €530 billion to 800 banks announced♦ Jun-12 Spain requests banking bailout even as Cyprus joins countries with bailout requests♦ Sep-12 ECB cuts interest rates to 0.75% in July 2012 and announces bond-buying sterilisation♦ Sep-12 German court okays ESM participation while eurozone, IMF agree to bail out Greece♦ Dec-12 Eurozone finance ministers agree to have single banking regulator♦ Feb-13 European Union agree to cut spends by €34 billion over seven years♦ Mar-13 Fresh crisis as Cyprus rejects eurozone bailout deal terms ♦ May-13 Eurozone unemployment hits new high of 12.2% vs, 11.8% (also a high) in January 2013♦ Aug-13 Eurozone hauled out of 18-month recession by Germany and France♦ Sep-13 Angela Merkel wins Geman federal elections♦ Dec-13 German Social Democrats vote to join Merkel coalition
Chronology of major Eurozone events

28
GDP growth (%)
9.8
9.7
9.5
9.1
8.9
8.1
7.6
7.4
7.9
7.7
7.5
7.8
6
8
10
Dec-
10
Mar
-11
Jun-
11
Sep-
11
Dec-
11
Mar
-12
Jun-
12
Sep-
12
Dec-
12
Mar
-13
Jun-
13
Sep-
13
%
China Mfg PMI & IIP
49
50
51
52
53
Dec-
10M
ar-1
1Ju
n-11
Sep-
11
Dec-
11M
ar-1
2Ju
n-12
Sep-
12
Dec-
12M
ar-1
3Ju
n-13
Sep-
13
x
8
10
12
14
16
%Manf. PMI IIP, YoY growth
China loan outstanding (YoY%)
10
15
20
25
30
35
Mar
-09
Sep-
09
Mar
-10
Sep-
10
Mar
-11
Sep-
11
Mar
-12
Sep-
12
Mar
-13
Sep-
13
%
Shanghai Composite
1,500
2,000
2,500
3,000
3,500
Apr
-11
Jun-
11
Aug
-11
Oct-1
1
Dec-
11
Feb-
12
Apr
-12
Jun-
12
Aug
-12
Oct-1
2
Dec-
12
Feb-
13
Apr
-13
Jun-
13
Aug
-13
Oct-1
3
Dec-
13
Deal Team – At Your ServiceChina hard landing fears unfounded – regime change steam rolls reforms
Chinese government unwrapped its boldest set of economic and social reforms in nearly three decades easing hard landing concerns. That said, what could bother investors are its geopolitical ambitions including rift with Japan and other neighboring nations and increasing militarization of the zone.
Source: Bloomberg, Reuters, ICICIdirect.com Research
Date Event♦ Mar-12 Bo Xilai scandal unfolded♦ Apr-12 China ups the limit for Yuan fluctuation to 1% in trading against the US dollar, from 0.5%♦ Sep-12 Tension rises between China and Japan over islands in East China Sea ♦ Sep-12 China launches first aircraft carrier in South China Sea♦ Feb-13 Tension rises again with Japan after a ship row near disputed islands♦ Mar-13 Newly elected President Xi Jinping lauches efficiency and anti-corruption drive ♦ Nov-13 Communist Party leadership announced scores of labour reforms♦ Dec-13 China unfolds economic reforms including likely change in one child policy
Chronology of major Chinese events

29
Petroleum products
87.1
106.
0
155.
0
164.
0
169.
1
178.
1
30.228.7
31.733.4
36.3 35.8
0
50
100
150
200
FY10 FY11 FY12 FY13 FY14E FY15E
US$
billio
n
20
25
30
35
40
%
Petroleum Pdts Import (LHS) PP Import as % of Total Import (RHS)
To overcome currency volatility and CAD concerns, a series of measures were taken, namely: 1. gold import duty hike, 2. special swap window to attract FCNR (B) deposits and foreign currency borrowings, 3. special window for oil marketing companies to help meet their daily forex requirement, and 4. hike in FII investment limit in government securities & corporate bonds by U$5 billion to US$75 billion. These measures coupled with likely inclusion of Indian G-Secs into the global indices could have appreciating bias on INR
Deal Team – At Your Service
Gold imports
28.8
40.7
56.5
53.8
29.9
28.4
10.011.0
6.4 5.7
11.011.5
0
1020
30
4050
60
FY10 FY11 FY12 FY13 FY14E FY15E
US$
billio
n
0
4
7
11
14
%
Gold Import (LHS) Gold Import as % of Total Import (RHS)
Shock absorbers in place – India better prepared than last time…
Source: Bloomberg, Reuters, ICICIdirect.com Research
Current account deficit
38.445.8
78.288.2
49.1 48.4
0
20
40
60
80
100
FY10 FY11 FY12 FY13 FY14E FY15E
US$
billio
n
0
12
3
45
6%
CAD (LHS) CAD as % of GDP (RHS)
FII flows in emerging countries17.9
-1.5
0.8
5.88.1
-5.6
5.0
-10
0
10
20
Indi
a
Indo
nesi
a
Philip
pine
s
Sout
hKo
rea
Taiw
an
Thai
land
Braz
il
$ bi
llions

30
Deal Team – At Your ServiceOil flare up cooled off by embargo; breathing space for India…
Source: Bloomberg, Reuters, EIA, ICICIdirect.com Research
Oil flare-up led by Iran’s rhetoric to destabilise Opec production seems to have cooled off led by landmark accord providing some breathing space to India
Brent Crude ($/bbl)
60
80
100
120
140
160
Apr
-10
Jul-1
0
Oct-1
0
Jan-
11
Apr
-11
Jul-1
1
Oct-1
1
Jan-
12
Apr
-12
Jul-1
2
Oct-1
2
Jan-
13
Apr
-13
Jul-1
3
Oct-1
3
Shale gas production in US
22.8 36
.8
41.5
44.9
47.6
48.9
50.4
95.9 77
.2 63.2
58.5
55.1
52.4
51.1
49.6
4.1
0
20
40
60
80
100
2005 2010 2015E 2020E 2025E 2030E 2035E 2040E
%
15
20
25
30
35
40
Trilli
on c
ubic
feet
Shale gas Others Production (RHS)
Despite multiple confirmations, finally the US and Iran took a step forward to resolve bilateral issues
On a different tangent, US shale gas discovery could be the potential game changer in the longer run as it will not only attract investment in the US (US$90 billion already announced largely in petrochemicals) but also reduce its dependency on oil imports leading to a lower import bill
Date EventJul-10 The US enacts the comprehensive Iran Sanctions, Accountability and Divestment Act
targeting Iran's energy & financial sectors Nov-11 The US designates Iran as primary money-laundering concern, limiting Iranian banks'
access to US financial sectorDec-11 US imposes sanctions on foreign banks that transact with Iran's central bankJan-12 EU oil embargo: EU bans shipping insurance for oil, precious metal trade from IranFeb-12 US signs executive order freezing Iranian assets in USMay-12 Talks between Iran and six world powers on its disputed nuclear programme fail to
produce breakthroughJul-12 Iran announces legislation intended to disrupt traffic in Strait of Hormuz following EU
embargoOct-12 EU toughens sanctions against Iran, banning trade in industries like finance, metals and
natural gasFeb-13 US mandates that any countries buying Iranian oil must put purchase money into local
bank accountApr-13 Israel stresses its readiness for lone strike on IranMay-13 US imposes sanctions on those violating Iran sanctionsJun-13 Iran elects new President who advocates more conciliatory approach to the worldSep-13 First direct US-Iran talks since 1979Nov-13 The US and five other world powers announce landmark accord that would temporarily
freeze Iran’s nuclear programme
Chronology of major events related to crude

31
Deal Team – At Your ServiceMarket Strategy 2014
Where are the markets headed in 2014?1
How would general elections influence the markets?2
Would the economy recover progressively?3
How would the FM bridge the fiscal gap?4
Has inflation peaked out to warrant a rate cut?5
Is the worst over for Rupee?6
What next as tapering begins?7
What are the potential speed breakers for the markets?8
Are cyclicals a good bet this year?9
Which sectors and stocks will find favour?10

32
AA rated bonds vis-a-vis S&P 500
0
100
200
300
400
500
600
700
Jan-
86Ja
n-87
Jan-
88Ja
n-89
Jan-
90Ja
n-91
Jan-
92Ja
n-93
Jan-
94Ja
n-95
Jan-
96Ja
n-97
Jan-
98Ja
n-99
Jan-
00Ja
n-01
Jan-
02Ja
n-03
Jan-
04Ja
n-05
Jan-
06Ja
n-07
Jan-
08Ja
n-09
Jan-
10Ja
n-11
Jan-
12Ja
n-13
0
200
400
600
800
1000
1200
1400
1600
1800
Baa spread (LHS) S&P 500
AA rated bonds close correlation with S&P 500 in recent past
0
100
200
300
400
500
600
700
Dec-
99
Dec-
00
Dec-
01
Dec-
02
Dec-
03
Dec-
04
Dec-
05
Dec-
06
Dec-
07
Dec-
08
Dec-
09
Dec-
10
Dec-
11
Dec-
12
0
200
400
600
800
1000
1200
1400
1600
1800
Baa spread (LHS) S&P 500
Are we seeing a reversal in spreads as taper fears turn into reality?
“Baa spreads”* have historically been a coincident or leading indicator towards equity markets fall• Spreads rising beyond “300 bps” has usually caused panic and led to equity declines e.g in June 2002, June 2008 and April 2010. Rising spreads through 300
bps coincided with equity declines in September 2001 and August 2011 as shown below. Spreads are currently hovering at levels of ~260 bps
Deal Team – At Your ServiceA Bull Run in Wall Street or insanity on back of limitless printing?
Source: Bloomberg, ICICIdirect.com Research*Baa spreads reflect the gap between 10-year treasury yield and AA rated bonds in US. The premise of using this lies in the fact that empirical analysis shows this indicator tends to react early to unknown credit risk events earlier than stock markets and spread of 300 has been like a warning bell for investors

33
Market believes taper means GDP growth! Could it go wrong as it ignores deflation risk?
• The FED while starting QE knew some of the speculative risks attached with it. The lack of investment demand in US caused carry flows moving to emerging markets and causing various asset class distortions
• The US economy now seems to be responding and consumption demand(PCE) continues to spearhead the growth with consistency spends by consumers as investments lag .
• The Fed though remains uncertain about effects of reducing assetpurchases as it fears that liquidity unwinding could turn into an avalanche starting from developing markets. Even as Fed’s has tried to downplay its impact on yields the US yield has climbed to unnervingly high levels of ~3% even with no sign of inflation expectations
• Since QE and easy monetarist era began the markets have felt “nothing can bring down markets-we are in a bull run” as central banks have created this sense of misplaced comfort on just optical GDP growth
Growth without Inflation something's wrong? Key indicators signal deflation• Five year implied inflation via US treasury inflation protected securities
(TIPS) is at ~1.9%. It has fallen significantly from ~2.5% last year. Historically, whenever it has fallen to ~1.5% it has led to sharp equity falls
• The 10-years TIPS inflation expectation fell below its 200-day moving average signalling a serious threat towards low inflation, if not deflation
• Though commodities have also seen QE driven price speculation, gold and copper remain unique materials as one is looked as an alternative currency/inflation hedge while the latter is a basic commodity in terms of real economic activity
• The prices of gold and copper have fallen sharply, which could be signals towards inherent risks of deflation. For a decade and dot com bubble, gold prices have been early indicators towards significant market movements as is evident from the graph below. Copper prices have been more coincident in nature towards price movements
Deal Team – At Your ServiceA Bull Run in Wall Street or insanity on back of limitless printing?
Can the Lack of fiscal union in the EU region come back to haunt?• The recurrence of political fracas as EU members go for elections remains
a simmering risk at this time. The growing German dissonance towards further debt to struggling nations could cause lead to yield spikes
• We were looking at the euro region and felt that the staggering debt servicing burden in place may percolate into one of the unknowns, which the market is not yet factoring considering that large countries like France and Italy’s growth is not only stalling but also turning negative rapidly
• There can always be a reason maybe a “Black Swan” which shrugs off this drugged market back into reality and could cause “Lehmanesque” pain
Source: Bloomberg, ICICIdirect.com ResearchWhat are TIPS? “It’s a treasury security that is indexed to inflation in order to protect investors from the negative effects of inflation. TIPS are considered an extremely low-risk investment since they are backed by the U.S. government. It is also used as an indicator to forecast inflation expectations.
bn $ 2014E 2015EItaly 534 347France 454 286Spain 285 186Greece 33.2 9.1Germany 306 242UK 153 121Portugal 37 20Total 1800 1211
Major Euro nations debt servicing burden
Can crude come back to old ways and be volatile? OPEC loses oil hegemony
• US pumps petroleum product exports and displaces Russia as No. 1 net exporter in the world causing balance of "oil" shift towards the Pacific from the Middle East and Central Asian region. 2013 also witnessed Mexico opening up itself to global oil majors and end of Iranian conflict.
• Along with this, demand scenario might remain similar at best and start of tapering could cause downward spiral in prices.
• This could in turn cause trouble for OPEC nations as they could start running into fiscal deficits if Brent crude prices fall below $90

34
Copper price trend more coincident historically
0.0
1.0
2.0
3.0
4.0
5.0Ju
n-90
Jun-
91Ju
n-92
Jun-
93Ju
n-94
Jun-
95Ju
n-96
Jun-
97Ju
n-98
Jun-
99Ju
n-00
Jun-
01Ju
n-02
Jun-
03Ju
n-04
Jun-
05Ju
n-06
Jun-
07Ju
n-08
Jun-
09Ju
n-10
Jun-
11Ju
n-12
Jun-
13
(%)
-100
-50
0
50
100
150
200
(%)
PCE (LHS) Copper price growth
0
0.5
1
1.5
2
2.5
3
3.5
Jul-9
7
Jul-9
8
Jul-9
9
Jul-0
0
Jul-0
1
Jul-0
2
Jul-0
3
Jul-0
4
Jul-0
5
Jul-0
6
Jul-0
7
(%)
0
400
800
1200
1600
20005-year implied inflation TIPS (LHS) S & P 500
Deal Team – At Your Service
Gold price movement tends to lead inflation
0.0
1.0
2.0
3.0
4.0
5.0
Jun-
90Ju
n-91
Jun-
92Ju
n-93
Jun-
94Ju
n-95
Jun-
96Ju
n-97
Jun-
98Ju
n-99
Jun-
00Ju
n-01
Jun-
02Ju
n-03
Jun-
04Ju
n-05
Jun-
06Ju
n-07
Jun-
08Ju
n-09
Jun-
10Ju
n-11
Jun-
12Ju
n-13
(%)
-40-30-20-100102030405060
(%)
PCE (LHS) Gold price growth
A Bull Run in Wall Street or insanity on back of limitless printing?
Source: Bloomberg, ICICIdirect.com ResearchThe 5-year TIPS implied inflation is perilously close to ~2% with a downward bias while the equities have shot up. Historically such divergences have not sustained and with deflation risks stoking globally this divergence could end in pain for equities ; (Bottom Left) PCE refers to Personal consumption expenditures price index which is the preferred measure of core inflation in USA
-1
-0.5
0
0.5
1
1.5
2
2.5
3
3.5
May
-08
Nov
-08
May
-09
Nov
-09
May
-10
Nov
-10
May
-11
Nov
-11
May
-12
Nov
-12
May
-13
Nov
-13
(%)
0
400
800
1200
1600
20005-year implied inflation TIPS (LHS) S & P 500
A: QE1 starts, B: QE1 endsC: QE2 starts D: QE2 ends
A
B
C
D
E
Divergence ! Whats going to happen?

35
Industry (27%):
• Probability of weak contribution to GDP can run high, atleast in H1CY14, as interest rate cycle reversal might not happen that soon and revival in capex cycle will gather steam post the election of the new government.
• However, downside risks to GDP is not that high as manufacturing GDP is at worst but only elongated time of manufacturing recovery can pose risks to GDP.
Investment side GDP
• The chart below suggests that GFCF has been on declining trend post FY11 as capex cycle has almost stalled. The GFCF cycle may be near to bottom but is expected to pick pace only post the election period.
• Persistent high inflation may curb consumer spending and compel them to cut-back their expenses which may lead to moderation in growth of PFCE.
Deal Team – At Your Service
Service GDP consistently gaining market share
18.3 17.4 16.8 15.8 14.6 14.5 14.1 13.7 13.2 10.8
28.0 28.7 28.7 28.1 28.3 28.2 27.5 26.7 26.2 26.3
53.7 54.0 54.4 56.1 57.1 57.3 58.4 59.6 56.8 59.3
0
20
40
60
80
100
FY06
FY07
FY08
FY09
FY10
FY11
FY12
FY13
Q1FY
14
Q2FY
14
(%)
Agriculture Industry Service
T
Major components of investment side GDP
10.9 10.3 10.3 10.9 11.9 11.4 11.6 11.8 12.7 11.0
58.3 57.7 57.0 57.7 57.2 55.8 56.3 56.8 56.5 56.6
30.3 31.3 32.9 32.3 31.7 31.7 30.6 29.6 28.6 29.4
0
20
40
60
80
100
FY06
FY07
FY08
FY09
FY10
FY11
FY12
FY13
Q1FY
14
Q2FY
14
(%)
GFCE PFCE GFCF
What are risks related to GDP?
Source: Mospi, ICICIdirect.com Research
• We have analysed the correlation between the two variables over a period of 8 years and we observe that 63.2% behavior of Agri GDP is explained by volatility in the monsoon performance of that respective fiscal.
• One of the best monsoons was experienced by India in CY13 as it was better by ~7% over its long term average. This led to improvement in agri GDP from 1.4% YoY growth in Q4FY13 to 4.6% in Q2FY14.
• However, risks are too high if monsoon may fail to deliver similar strong growth as witnessed in CY13. Also, there will be high base impact next year as CY13 is delivering decent agriculture GDP growth.
AGRI GDP vis-à-vis monsoon performance FY07 FY08 FY09 FY10 FY11 FY12 FY13 FY14EDeviation from LTA -0.4 5.7 -1.7 -21.8 2.0 2.0 -7.0 6.9Agri GDP growth (YoY) 4.2 5.8 0.1 0.8 7.9 3.6 1.9 4.5
Monsoon deviation from long term average does make agri GDP lumpy
Agriculture (14%):
Services (59%):
• This has been the pillar of GDP growth so far but high base effect can pose a minor risks to GDP growth.

36
Primary and fuel segment have caused WPI to remain sticky8.
1
3.9
9.6
8.9
7.4
4.8
6.6
7.0
7.5
-5
0
5
10
15
20
FY09
FY10
FY11
FY12
FY13
Q1FY
14
Q2FY
14
Oct-1
3
Nov
-13
(%)
WPI Manufactured goods Primary articles Fuel Group
One or the other component has kept food inflation high
0
10
20
30
40
50
60
FY07 FY08 FY09 FY10 FY11 FY12 FY13 H1FY14 Oct-13 Nov-13
(%)
Cereals & Pulses Fruits & Vegetables Milk Egg, Meat & Fish
These four components together have weightage of 94.8% in food inflation and 13.6% in total inflation
Classic case being onion and tomato prices have witnessed volatility of high magnitude
-100
0
100
200
300
400
Nov
-05
May
-06
Nov
-06
May
-07
Nov
-07
May
-08
Nov
-08
May
-09
Nov
-09
May
-10
Nov
-10
May
-11
Nov
-11
May
-12
Nov
-12
May
-13
Nov
-13
(%)
Onion price inflation Tomato price inflation
• Primary Inflation (20.1%): It has been the major culprit for the rise in overall inflation levels. Currently, it is hovering at ~16% led by food inflation of 19.9%. We believe the primary inflation may come off from their current peak levels as local food prices have corrected but sudden erratic price of certain food items cannot be ruled out, which can push up primary inflation in CY14E/FY15E.
• Fuel Inflation (14.9%): The major positive step taken by Government to de-regulate petrol and diesel prices has led to spiral in fuel inflation (currently at 10-11% range). Further routine 50 paisa hike per month for diesel prices will have both direct (~60 bps impact on CY14E inflation) and indirect impact on fuel based inflation.
• Manufactured good Inflation (65%): We believe the manufactured good inflation may remain at current modest levels of ~3% considering lower industrial activity and elevated interest rates, atleast in the H1CY14.
Deal Team – At Your ServiceWhat are the risks related to Inflation?
Source: Mospi,, IMD, ICICIdirect.com Research
• Just an unexpected rainfall at the end of season and probability of hoarding had caused the onion prices to spike so sharply in H2CY13.
• However, prices have corrected in local markets lately and hence primary inflation may improve in 2014 albeit still staying in uncomfortable zone.

37
China available at relatively compelling valuations
0
10
20
30
40
50
60
Dec-
04
Dec-
05
Dec-
06
Dec-
07
Dec-
08
Dec-
09
Dec-
10
Dec-
11
Dec-
12
Dec-
13
(x)
Sensex TTM P/E Shanghai TTM P/E
17.8 10.5
GDP growth rate between India and China has widened
0246
8101214
Sep-
05
Mar
-06
Sep-
06
Mar
-07
Sep-
07
Mar
-08
Sep-
08
Mar
-09
Sep-
09
Mar
-10
Sep-
10
Mar
-11
Sep-
11
Mar
-12
Sep-
12
Mar
-13
Sep-
13
(%)
India GDP growth China GDP growth
7.8% 4.8%
Risk of liquidity: Portfolio flows too swift and unpredictable
• India depends significantly on portfolio flows to fund its current account deficits. However, this exposes India to significant risks as these flows are swift and unpredictable in nature
Can China be a party spoiler???
• China has clearly avoided a hard landing of its economy and the new power at the centre does talk of a secular and structural growth trajectory for China in years to come.
• This coupled with a better growth rate of >7% can be a compelling factor for China to attract global liquidity as from a 5 year perspective.
• The GDP growth of India has tapered off while China’s GDP growth is still holding at decent level of 7.8%. On the other hand, the valuation gap between the two has widened with China’s valuation at compelling 10.5x P/E on TTM basis compared to 17.8x for India.
• The Chinese equities has gone nowhere (up by only 23.4% from itsrecession low of 2009) and can be a compelling story at 9.3x one year forward P/E when compared to India’s dynamics of 4-5% GDP growth and 14x one year forward P/E
• Thus, there is a significant risk that FII’s might desert Indian equity market and hence risk of correction can then loom large.
Deal Team – At Your ServiceWhat are the risks due to FII flows – Is China a threat?
Source: Bloomberg, ICICIdirect.com Research
• In the last year, the Sensex has given a return of 8.3% while Shanghai has recorded a return of -4.8%. Thus, India faces a risk of lower FII equity inflow as China is better placed on growth and valuations

38
Deal Team – At Your ServiceMarket Strategy 2014
Where are the markets headed in 2014?1
How would general elections influence the markets?2
Would the economy recover progressively?3
How would the FM bridge the fiscal gap?4
Has inflation peaked out to warrant a rate cut?5
Is the worst over for Rupee?6
What next as tapering begins?7
What are the potential speed breakers for the markets?8
Are cyclicals a good bet this year?9
Which sectors and stocks will find favour?10

39
Defensives to outperform cyclicals…• In terms of sectoral preference, we believe that defensives (IT, pharma,
FMCG) and quasi defensives (auto and cement) will fare better than cyclicals (metals, capital goods & infrastructure and power)
• The dimensions of performance can be looked upon from two perspectives i.e. financial performance and stock price performance. On the whole, the better financial performance (stable sales & PAT growth visibility, robust cash flows, asset light business and minimal regulatory hindrances) will help defensives to also outperform cyclicals (lower visibility owing to regulatory hindrances, highly levered balance sheets and feeble cash flows), even though there may be a short-term bout of bounce back in cyclicals
• The above point helps in equating with our view as to why we have classified cement and auto as quasi defensives and not entirely as cyclicals. We believe balance sheet strength and cash flows are key variables that one should look at in a world where “de-levered” or “deleveraging” has found flavour. Though cement volumes and auto sales volumes are cyclical in nature, the balance sheets of companies in those sectors are pretty robust and growth can bounce back for such companies once the economy gathers steam (benefits of positive operating leverage)
• In terms of valuation, it is generally argued that defensives are trading at “rich valuations” or “above historical standards”, which takes into account all positive attributes while record low valuations of cyclicals do take into account all the possible negatives. However, we would reiterate that “earnings” are a moving target based on which various valuations metrics are computed. The key advantage of defensives is that their earnings profile has higher degree of visibility and consensus is still upgrading their forward earnings cycle, which implies that “optically rich valuations” in hindsight may appear to be fair once earnings come through. On the other hand, earnings profile/recovery of cyclicals is based on various permutations and combinations. Still, these sectors are facing earnings downgrades, which implies higher than expected multiples that these sectors are still commanding.
Deal Team – At Your ServiceAre cyclicals a good bet this year?
• Even quasi defensives like cement and auto are commanding rich valuations on the basis of the strong balance sheet, robust cash flows and the lever of positive operating leverage that these companies can pull during the resumption of the upturn
• Polarization of valuations will be skewed in favour of defensives: Time and again the markets have witnessed this kind of euphoria wherein the sector in flavour (defensives this time around) do reach euphoric valuations and get all kind of investor/liquidity attention. This certainly goes beyond business fundamentals. On the other hand, out of flavour sectors exhibit zigzag rallies thereby oscillating in a range. Classic instances would be the Tech Bubble of 2000 wherein IT stocks went to dizzying heights and more recently the bull run of 2005-08 wherein sectors in vogue like capital goods, metals and power saw a massive expansion in their multiples over the cycle even though the earnings velocity came down during the same period
• Defensives are yet to witness frenzy and hence would continue to find favour.

40
• Headwinds such as rapid depreciation of the currency are a boon for defensives (significant export driven sectors) while cyclicals are at risk (raw material import/foreign loans)
Deal Team – At Your Service
Revenue growth of defensives vis-à-vis nominal GDP growth
0
10
20
30
40
50
2013
2012
2011
2010
2009
2008
2007
(%)
FMCG IT Pharma Automobiles GDP (N)
Revenue growth of Cyclicals vis-à-vis nominal GDP growth
-20
-10
0
10
20
30
4020
13
2012
2011
2010
2009
2008
2007
(%)
Power Cap Goods Metals GDP (N)
Recent depreciation of rupee positive for defensives
30354045505560657075
Dec-
05
Jun-
06
Dec-
06
Jun-
07
Dec-
07
Jun-
08
Dec-
08
Jun-
09
Dec-
09
Jun-
10
Dec-
10
Jun-
11
Dec-
11
Jun-
12
Dec-
12
Jun-
13
Dec-
13
(|/$
)
Defensives like pharma, IT and auto have significant exports to global markets. Even sustenance of |/$ in | 60-63 range will keep realisations and margins robust
Macros: Boon for defensives and bane for cyclicals
Source: Bloomberg, Capitaline ,ICICIdirect.com ResearchAll sectors represent respective BSE sectoral indices
Forex revenues as % of total revenues
01020304050607080
2006
2007
2008
2009
2010
2011
2012
2013
(%)
Pharma IT
Revenue growth for defensives continuously outpacing nominal GDPgrowth as they are commanding better pricing power coupled with stable volume growth

41
Steady or rising margins for defensives/quasi defensives
0
5
10
15
20
25
Automobiles FMCG IT Pharma
(%)
2009 2010 2011 2012 2013
Deal Team – At Your ServiceTrends in operating margins of defensives and cyclicals
Source: Capitaline ,ICICIdirect.com ResearchAll sectors represent respective BSE sectoral indices
Catalyst CommentsHigh competition New product innovations/launches mainly in FMCG and auto space.
Brand buyoutsIncrease in raw material prices
Power of passing on prices with slight/moderate impact on volume
Exchange rate fluctuations Positive for margins as sectors like pharma, IT and auto are favourably influenced
Catalyst for margin consistency/improvement
Operating margins have been under pressure for Cyclicals
0
5
10
15
20
25
30
Capital GoodsMetals and MiningPower
(%)
2009 2010 2011 2012 2013
Catalyst CommentsHigh competition Sporadic ordering opportunity, uneconomical price bidding mainly in
capital goods and power segment. Lower metal prices owing to soft global outlook
Negative operating leverage Slower execution, low capacity utilisation and high manpower & administration costs impact margins negatively
Exchange rate fluctuations Negative for power and metal companies as they significantly import inputs like thermal and coking coal
Catalyst for margin decline/pressure

42
Interest cover (as explained by interest to EBITDA ratio) has been fairly high and stable for defensives as their balance sheets are
characterised by no or low leverage
01020304050
2008
2009
2010
2011
2012
2013In
tere
st c
over
age
ratio
(x)
Automobiles FMCG IT Pharma
Deal Team – At Your ServiceLeverage: Key differentiator between defensives and cyclicals
Source: Capitaline ,ICICIdirect.com ResearchAll sectors represent respective BSE sectoral indices
Interest cover deteroriated sharply for cyclicals as aggressive expansion led to rise in debt, hardening of interest costs
0
2
4
6
8
2008
2009
2010
2011
2012
2013In
tere
st c
over
age
ratio
(x)
Capital Goods Metals and Mining Power
Defensives have been exhibiting decling/low or no leverage over FY06-13
0.0
0.3
0.6
0.9
1.2
1.5
1.8
Auto Pharma FMCG IT
Gros
s De
bt/E
quity
(x)
2006 2007 2008 2009 2010 2011 2012 2013
Balance sheet of cyclicals saddled with huge debt over FY06-13
0.0
0.5
1.0
1.5
2.0
Capital Goods Metals PowerGr
oss
Debt
/Equ
ity (x
)
2006 2007 2008 2009 2010 2011 2012 2013

43
Defensives still exhibiting rising RoEs and adding substantial shareholder value
0
10
20
30
40
50
BSE Auto BSE IT BSE FMCG BSE Healthcare
RoE(
%)
2009 2010 2011 2012 2013E 2014E
Deal Team – At Your ServiceEVA by defensives far greater and superior to cyclicals
Source: Bloomberg, ICICIdirect.com Research*EVA: EVA is the profit earned by the firm less the cost of financing the firm's capital. The idea is that value is created when the return on the firm's economic capital employed is greater than the cost of that capital In our case, Defensives have consistently created positive EVA and hence positive shareholder returns while Cyclicals owing to huge leverage and uncertain economic environment have been generating negative EVA.
Cyclicals have started creating negative EVA* as RoE< WACC, going ahead
0
5
10
15
20
25
BSE Cap Goods BSE Metals and Mining BSE Power
RoE
(%)
2009 2010 2011 2012 2013E 2014E
Quality of earnings of defensives superior as RoA=RoE and no dependence on leverage
0
5
10
15
20
25
30
2009
2010
2011
2012
2013
E
2014
E
RoA
(%)
BSE Auto BSE IT BSE FMCG BSE Healthcare
Cyclicals have to resort to debt in order get better RoEs and, hence, higher financial leverage
0
2
4
6
8
10
2009
2010
2011
2012
2013
E
2014
E
RoA
(%)
BSE Cap Goods BSE Metals and Mining BSE Power

44
DLF (Consensus EPS)
0
5
10
15
20
25
30
Mar
-11
Jul-1
1
Nov
-11
Mar
-12
Jul-1
2
Nov
-12
Mar
-13
Jul-1
3
Nov
-13
EPS
(|)
2014 2015 2016
SAIL (Consensus EPS)
0
5
10
15
20
25
30
May
-11
Sep-
11
Jan-
12
May
-12
Sep-
12
Jan-
13
May
-13
Sep-
13
EPS
(|)
2014 2015 2016
Bhel (Consensus EPS)
5
15
25
35
45
Apr
-11
Aug
-11
Dec-
11
Apr
-12
Aug
-12
Dec-
12
Apr
-13
Aug
-13
EPS
(|)
2014 2015 2016
Deal Team – At Your Service
Sun Pharma (Consensus EPS)
10
15
20
25
30
35
Feb-
11
Jun-
11
Oct-1
1
Feb-
12
Jun-
12
Oct-1
2
Feb-
13
Jun-
13
Oct-1
3
EPS
(|)
2014 2015 2016
ITC (Consensus EPS)
5
7
9
11
13
15
17
Jun-
11
Oct-1
1
Feb-
12
Jun-
12
Oct-1
2
Feb-
13
Jun-
13
Oct-1
3
EPS
(|)
2014 2015 2016
TCS (Consensus EPS)
455565758595
105115125135
Apr
-11
Aug
-11
Dec-
11
Apr
-12
Aug
-12
Dec-
12
Apr
-13
Aug
-13
EPS
(|)
2014 2015 2016
Earnings trajectory still up for defensives, hazy for cyclicals
Defensives still enjoying earnings upgrades in environment where things are getting murkier
Source: Bloomberg, ICICIdirect.com Research
Outlook on cyclicals in terms of earnings hazy; calling a bottom for earnings decline depends on many permutations

45
Trend of L&T EPS growth vis-à-vis P/E re-rating over FY03-09
0
10
20
30
40
50
60
Jun-
02
Dec-
02
Jun-
03
Dec-
03
Jun-
04
Dec-
04
Jun-
05
Dec-
05
Jun-
06
Dec-
06
Jun-
07
Dec-
07
Jun-
08
(x)
EPS CAGR over:FY03-07:: 30.3%Average P/E FY03-07:: 15.7x
EPS CAGR over:FY07-09:: 35%Average P/E FY07-09:: 29x
Deal Team – At Your Service2007: Expansion of multiples for cyclicals, 2014: Can same happen in defensives?
Source: Bloomberg, ICICIdirect.com ResearchNote: During 2007, there was a massive expansion of multiples of the Cyclicals, which were in their multi year Bull Run. The same can happen with Defensives over 2014 can be a million dollar question.
Trend of Reliance EPS growth vis-à-vis P/E re-rating over FY03-09
0
5
10
15
20
25
Apr
-02
Oct-0
2
Apr
-03
Oct-0
3
Apr
-04
Oct-0
4
Apr
-05
Oct-0
5
Apr
-06
Oct-0
6
Apr
-07
Oct-0
7
(x)
EPS CAGR over:FY03-07:: 30.7%Average P/E FY07-09:: 7.3x
EPS CAGR over:FY07-09:: 14%Average P/E FY07-09:: 15.7x
Trend of Sun Pharma EPS growth vis-à-vis P/E re-rating over FY08-14
0
5
1015
20
25
30
May
-08
Nov
-08
May
-09
Nov
-09
May
-10
Nov
-10
May
-11
Nov
-11
May
-12
Nov
-12
May
-13
Nov
-13
(x)
EPS CAGR over:FY08-12:: 13.7%Average P/E :FY08-12:: 19.6x
EPS CAGR in FY12-14::34%Average P/E FY12-14::24.1x
Trend of TCS EPS growth vis-à-vis P/E re-rating over FY08-14
0
5
10
15
20
25
30
Apr
-08
Oct-0
8
Apr
-09
Oct-0
9
Apr
-10
Oct-1
0
Apr
-11
Oct-1
1
Apr
-12
Oct-1
2
Apr
-13
Oct-1
3
(x)
EPS CAGR over: FY08-12:: 20%Average P/E :FY08-12:: 18.4x
EPS CAGR over:FY12-14:: 33%Average P/E FY12-14:: 19x
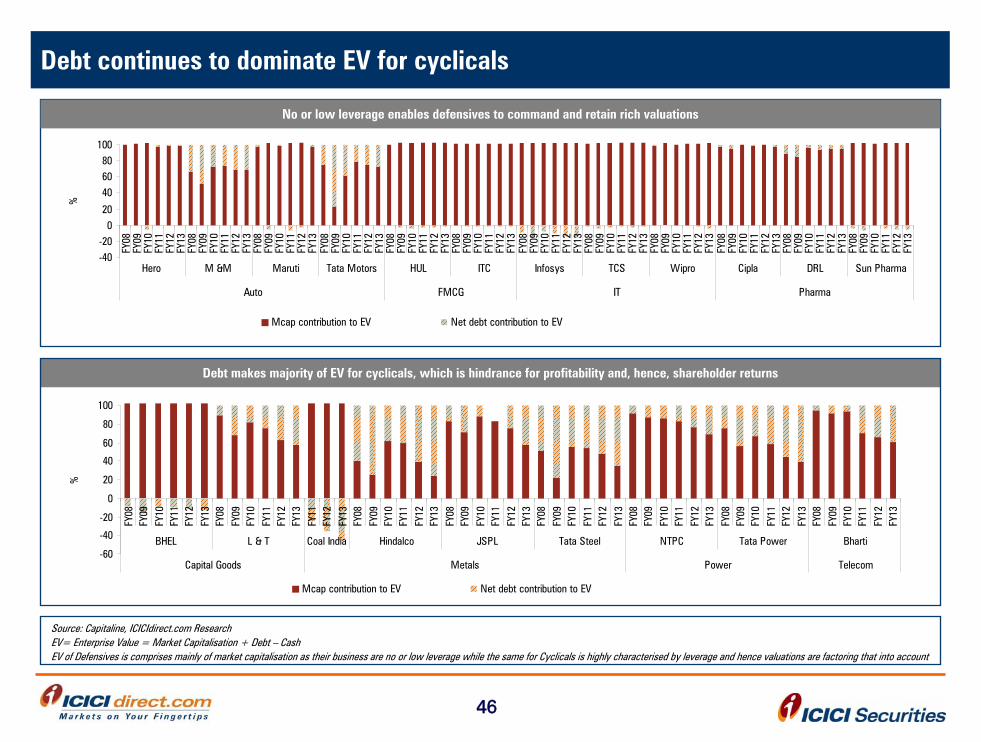
46
-60
-40
-20
0
20
40
60
80
100
FY08
FY09
FY10
FY11
FY12
FY13
FY08
FY09
FY10
FY11
FY12
FY13
FY11
FY12
FY13
FY08
FY09
FY10
FY11
FY12
FY13
FY08
FY09
FY10
FY11
FY12
FY13
FY08
FY09
FY10
FY11
FY12
FY13
FY08
FY09
FY10
FY11
FY12
FY13
FY08
FY09
FY10
FY11
FY12
FY13
FY08
FY09
FY10
FY11
FY12
FY13
BHEL L & T Coal India Hindalco JSPL Tata Steel NTPC Tata Power Bharti
Capital Goods Metals Power Telecom
%
Mcap contribution to EV Net debt contribution to EV
-40-20
020
406080
100
FY08
FY09
FY10
FY11
FY12
FY13
FY08
FY09
FY10
FY11
FY12
FY13
FY08
FY09
FY10
FY11
FY12
FY13
FY08
FY09
FY10
FY11
FY12
FY13
FY08
FY09
FY10
FY11
FY12
FY13
FY08
FY09
FY10
FY11
FY12
FY13
FY08
FY09
FY10
FY11
FY12
FY13
FY08
FY09
FY10
FY11
FY12
FY13
FY08
FY09
FY10
FY11
FY12
FY13
FY08
FY09
FY10
FY11
FY12
FY13
FY08
FY09
FY10
FY11
FY12
FY13
FY08
FY09
FY10
FY11
FY12
FY13
Hero M &M Maruti Tata Motors HUL ITC Infosys TCS Wipro Cipla DRL Sun Pharma
Auto FMCG IT Pharma
%
Mcap contribution to EV Net debt contribution to EV
Deal Team – At Your ServiceDebt continues to dominate EV for cyclicals
No or low leverage enables defensives to command and retain rich valuations
Source: Capitaline, ICICIdirect.com ResearchEV= Enterprise Value = Market Capitalisation + Debt – CashEV of Defensives is comprises mainly of market capitalisation as their business are no or low leverage while the same for Cyclicals is highly characterised by leverage and hence valuations are factoring that into account
Debt makes majority of EV for cyclicals, which is hindrance for profitability and, hence, shareholder returns

47
Deal Team – At Your ServiceEuphoric valuation part & parcel of markets: Defensives yet to enter that phase
Source: Bloomberg, Capitaline, ICICIdirect.com ResearchAll P/E ratios on one year forward basis
Cyclicals P/E on March 2007 P/E on December 2007 % rise in P/E Sector Benchmark P/E on March 2007 P/E on December 2007 % rise in P/ECapital Goods 20.6 33.5 62.6 L&T 32.3 53.1 64.4Power 32.7 NTPC 18 28 55.6Metals 6.7 12.4 85.1 SAIL 7.5 15.5 106.7Oil & Gas 12.6 20.4 62.0 Reliance Industries 16.5 21.5 30.3
DefensivesFMCG 18.2 23.0 26.4 ITC 20.6 24.9 20.9IT 21.9 18.0 -17.8 TCS 28.7 21.1 -26.5Pharma 19.5 20.8 6.7 Sun Pharma 23.5 16.1 -31.5
BSE Sensex 16.0 20.0 25.0
How have P/E multiples expanded for cyclicals during 2007
Historically it has been observed that large caps have outperformed midcaps and small caps across various financial parameters be it revenue, operating and PAT growth over FY06-13
2317
2924
14 13
22 20
35
2115
9
18 17
31
20
6
-26-30
-20
-10
0
10
20
30
40
Reve
nue
Oper
atin
gPr
ofit
Inte
rest
Depr
ecia
tion
Othe
rIn
com
e
PAT
(%)
BSE Sensex CAGR 2006-13 BSE Midcap CAGR 2006-13 BSE Smallcap CAGR 2006-13

48
Large caps relatively immune owing to low leverage, strong balance sheet
1.8
4.65.1
0.71.2 1.3
0123456
BSE Sensex BSE Midcap BSE Smallcap
(x)
Debt by EBITDA (Average 2006-13) Debt Equity (Average 2006:13)
…and simultaneous change of ownership patterns
-550
465
712657 672
-325
-800-600-400-200
0200400600800
Sens
ex
BSE
Mid
cap
BSE
Smal
lcap
bps
FII holding bps change 2006-08 FII holding bps change 2008-13
Profitability growth profile over comparable periods …
274249
7 -44
-2
-60
-40
-20
0
20
40
60
Sens
ex
BSE
Mid
cap
BSE
Smal
lcap
(%)
PAT CAGR 2006-08 PAT CAGR 2008-13
Deal Team – At Your Service
Large caps have high, consistent dividend payouts
27.0
2118
0
510
15
2025
30
BSE Sensex BSE Midcap BSE Smallcap
(%)
Average dividend payout - 2006-13 (profit making companies)
Financial parameters: Large cap leads mid caps and small caps
Source: Capitaline, ICICIdirect.com Research
• During FY06-08, ownership of small caps and midcaps was in vogue as they exhibited stupendous PAT CAGR while large caps were relatively out of flavour as the earnings profile was moderate compared to the former
• The trend has reversed during FY08-13, where consistency of earnings has taken centre stage. On the same lines, large caps have found flavour. Hence, their ownership has increased 657 bps while the same for small caps has declined 325 bps owing to their dismal performance and outlook

49
Deal Team – At Your ServiceMarket Strategy 2014
Where are the markets headed in 2014?1
How would general elections influence the markets?2
Would the economy recover progressively?3
How would the FM bridge the fiscal gap?4
Has inflation peaked out to warrant a rate cut?5
Is the worst over for Rupee?6
What next as tapering begins?7
What are the potential speed breakers for the markets?8
Are cyclicals a good bet this year?9
Which sectors and stocks will find favour?10

50
Deal Team – At Your ServiceWhich sectors and stocks will find favour?
Apparels
• Apparel players have grown at 17% in FY13 led by the shift from the unorganised to the organised segment. For the forthcoming year as well, we remain positive on this segment considering the rising preferences for branded products. We expect apparel players to grow revenues and PAT at 20.0% and 23.0% in FY15E, respectively
• This growth is likely to be largely volume led owing to increased distribution networks and entry into new markets. The women’s segment is likely to outpace the men’s wear segment, especially in the innerwear category. The increasing exports also augur well for apparel players. Considering the ability to pass on cost increases, we expect operating margins to improve marginally to 20.0% in FY15E
• The apparel players are better placed than the pure play textile companies as they (a) are less capital intensive; (b) earn better margins and (c) enjoy superior return ratios. We are, hence, positive on apparel players
Source: ICICIdirect.com Research
Banking
• We have a cautious view on the sector with a negative view on PSU banks and relative preference for private banks as they have remained resilient on earnings growth despite rising NPA provisions, mainly on account of a diversified income and lower restructured and NPA portfolio
• As GDP growth expectations remain muted at 5.4% in FY15E, we do not see NPA and restructured assets cycle turning in the next couple of quarters. System GNPA has doubled in two years to | 236000 crore (4.2% of advances in Sep ‘13), whereas RA has been ~6% of advances
• For our coverage universe, we expect PAT to grow at 7.6% CAGR over FY13-15E to | 57662 crore from | 49796 crore in FY13 and absolute GNPA and NNPA to rise 23% and 28% CAGR, respectively, over FY13-15E
• IndusInd Bank, with 26% profit CAGR and reasonable valuation of 2.3x P/ABV is our top pick among private banks. Within PSU banks, we prefer SBI due to its strong liability franchise and better NIM than peers
Auto
• We favour the auto space considering its relative resilience in earnings/modest valuations even with subdued volume growth. Empirical analysis of down cycles highlight that volume recovery plays are swift; earnings witness ~2x multiplier effect in next years as capacity utilisation increases from ~65% to ~80%. Thus, we feel this time an urban recovery coupled with rural demand could create similar earnings multiplier effect
• On sectoral positioning we feel comfortable on the consumer side i.e. PVs/2Ws would be the first beneficiaries of recovery as the infra-led CV recovery may be slightly protracted
• Another argument for preference lies in the margin of relative safety on valuations as leading automakers are available at ~14x PE FY15E (below long term average) even though these franchises are no lesser than say other pure play consumers (at ~30x PE FY15E) on the earnings quality, balance sheet and corporate governance front
Capital Goods
• H1CY14 is likely to witness sporadic ordering opportunities (bidding out of 8000 MW of BTG ordering opportunity, NTPC tenders & PGCIL capex of | 22000 crore ). However, recent run up in valuations of capital goods index from 12x to 19x does make us cautious/sceptical given valuations have priced in all positives in form a positive outcome of elections, peaking of rate cycle and policy reforms and there is little room for complacency.
• CY14 strategy for the capital goods space would be to stick to large caps like L&T (15% and 13% revenue & PAT CAGR, respectively; comfortable D/E of 0.4x, diversity in geography, efficient working capital and focus on enhancing RoEs by monetising strategic subsidiaries)
• For CY14/FY15E, we expect our coverage to report 8% growth in revenues while profitability is expected to remain flattish YoY owing to muted but flattish margins and 6.4% YoY growth in interest costs for the sector, as a whole
Positive Outlook on Sector Neutral Outlook on Sector Negative Outlook on Sector

51
Deal Team – At Your ServiceSectoral Outlook
Cement
• After two years of slowdown and absorbing high cost pressure, the sector is heading towards a recovery phase. We expect growth to pick up at CAGR of 6.2% to 276 MT during FY13-16E vs. CAGR of 5.5% during FY11-13. North and West would continue to perform better than east and central regions due to lower capacity additions while South is likely to see stabilisation in capacity additions with marginal recovery in demand
• Given the lower pace of capacity additions (i.e. at CAGR of 6% over FY13-15E vs. FY10-13 CAGR of 11%) led by current surplus capacity of 35 MT, utilisation levels of industry are likely to stabilise at 75%. Further, we expect some recovery in prices after remaining stagnant for the last year. Assuming 4% net increase in prices, we expect EBTDA/tonne to improve by 11% to | 990/tonne in FY15E due to operating leverage benefit
• We prefer Shree Cement given its presence in strong regions (i.e. North-70%), better cost efficiency coupled with a strong balance sheet
Source: ICICIdirect.com Research
FMCG
• After an unpredicted slowdown in FMCG revenue growth to ~12% in CY13E (~16% in 2012) due to weak macros, we expect the sector’s growth to recover to ~15% in CY14E. Growth would be led by a revival in volumes (7-12%), changing product mix and higher pricing power
• We expect rural sales (~40% of FMCG revenues) growth (1.3-1.5x of urban sales growth) to be the key volume growth driver in CY14E with urban demand recovering at a slower pace. Further, rural growth would be supported by a trickle down effect of higher pre-election spending in H1CY14 and better yields due to favourable monsoon in CY13.
• The unfolding rural demand keeping abreast of the Indian consumption story has significantly pushed valuations of FMCG companies with higher rural exposure (HUL, Dabur). Hence, we prefer ITC and Marico, which are actively expanding their rural reach and are available at relatively cheaper valuation of 19x (FY16E EPS) and 22x (FY15E EPS), respectively
Consumer Discretionary
• Sustained demand outlook from tier-II, tier-III cities would be key drivers for CD companies. Electrical goods companies expected to record double digit volume growth (10-15%) supported by new product launches and expansion in new geographies. Further, paint companies are expected to record high single digit volume growth(6-8%), despite GDP growth slipping to 10 year low ~5%, supported by sustained repainting demand
• We believe higher advertisement expenditure and lower operating leverage would keep EBITDA margins under check for electrical goods companies. Paint & chemical companies will find it difficult to improve current elevated margins (~15%) due to higher raw material prices and adverse currency movements
• We are positive on midcap electrical goods manufacturers with double digit volume growth and attractive valuation. We prefer Bajaj Electricals on account of its robust lighting & CD segment and compelling multiples
Healthcare
• We expect temperance in buying in the pharma space after yet another outperformance (fourth in a row) as premium valuations in most cases have little leg room left for further upsides. Structural strongholds such as manufacturing fungibility, geographical diversification, product approvals/ pipeline and, hence, clear visibility will, however, keep the sector in focus for corrective buying. We remain neutral on the sector
• On the exports front, domestic generic companies witnessed 25-30% growth in the US market in CY13 (till date) on the back of new product launches coupled with a favourable currency. We expect 15-20% growth in dollar terms as most players have developed a rich product pipeline over the last three or four years
• On the domestic front, after passive growth in 2013 is likely to accelerate to 8-10% in CY14 (on a lower base) driven by mid-teens growth in chronic therapies such as anti-dietetic, cardiology & neurology
Positive Outlook on Sector Neutral Outlook on Sector Negative Outlook on Sector

52
Deal Team – At Your ServiceSectoral Outlook
Hotel
• The growth in room demand has consistently remained subdued in the past three or four years due to challenging macroeconomic conditions. We expect the same trend to continue further with the industry’s FY13-15E sales CAGR of 8.4% vs. FY10-13 sales CAGR of 13.2%
• We expect competition to intensify with an additions of 10,400 premium hotel rooms to the existing inventory of 51,600 premium segment rooms, which will cause room rates to remain stagnant. In addition, a high debt burden would be further likely to dent the net margins of companies. However, possible floating of REITs could only be a positive trigger for the sector to de-leverage
• Given the challenges, EIH and IHCL remain in better position. While EIH has given a stable performance in the subdued environment, IHCL has shelved its major capex plans and cleaned up its notional losses, although a turnaround of subsidiary companies remains a challenge for it
Source: ICICIdirect.com Research
IT
• FY15E key positives include 1) demand recovery in the US, 2) penetration in Europe, 3) improvement in discretionary spends, 4) encouraging CY14E IT budgeting environment, 5) improvement in deal closure velocity and 6) large deal ramp-ups. Negatives could be cost pressures due to onsite hiring, visa regulation, pricing, wage inflation and rupee appreciation
• Rupee revenue growth for the sector could moderate to ~12-13% in FY15E vs. expected 26.5% in FY14E (12-14% in dollars and ~12% YoY depreciation in the average rupee). Tier-I EBIT margins could decline 39 bps YoY (23.3%) in FY15E vs. 80 bps (23.7%) improvement in FY14E as we expect 80 bps appreciation in the average rupee rate in FY15E. We expect 11.7% PAT growth (tier-I) in FY15E vs. 28.4% in FY14E
• At 22% premium to the Sensex, IT index valuations (16.5x vs. 13.5x) are demanding & suggest incremental returns could align to earnings growth
Infrastructure
• On the construction front, we do not expect any big bang projectawarding or revival in capex with the election code of conduct coming into force in H1CY14 and elevated interest rate throughout CY14 causing key downgrade risk to 18.4% YoY growth in bottomline
• On the infrastructure front, our coverage is expected to remain subdued in FY15E. The key theme for CY14 is likely to be progress towards policy reforms such as AERA ruling for aero charges for the next regulatory period – a key determinant for profitability for players like GMR & GVK -and monetisation of assets to de-leverage their balance sheet given the net debt to equity of 2.5x for our coverage
• In a scenario of stressed balance sheet and elevated interest rate cycle, we prefer Sadbhav Engineering whose projects are well funded and have strong visibility over the order book. We also like JP Associates, which would be focusing on de-leveraging its balance sheet
Logistics
• Container cargo growth at major ports remained flattish during CY13 and significant freight rate hike (~18%) by railways adversely impacted the volumes of domestic logistics companies. However, owing to relatively stable margins and low leverage (FY15E debt equity: 0.1x), the sector has an opportunity to benefit from positive operating leverage. Hence, we maintain a neutral stance on the sector
• We expect the I-direct logistic universe to report a CAGR of 6%, 8% and 4% in revenue, EBITDA and PAT, respectively, over FY13-15E. Furthermore, over two or three years, with the expectation of GST being implemented and partial operation of dedicated freight corridor, a major turnaround is expected in the sector
• We prefer Container Corporation and BlueDart Express due to their leadership in the respective segment along with superior infrastructure and healthy financials
Positive Outlook on Sector Neutral Outlook on Sector Negative Outlook on Sector

53
Deal Team – At Your ServiceSectoral Outlook
Media
• In the print space, ad growth is expected to slow down in FY15 as compared to last year (15-20%) due to reduced FMCG spends on the back of an economic slowdown. However, upcoming general elections would aid double digit (12-14%) growth in regional print. Profitability across the board is expected to improve on account of a stabilising currency leading to reduced newsprint costs
• We expect broadcasters to be major beneficiaries of digitisation and see a spurt in their subscription revenues with an impressive growth of ~37% in FY15E. However, ad growth is likely to remain flattish. Seeding of STBs would help subscription revenues (ex-activation income) growth of ~49% and 11% in Hathway and Dish, respectively
• In the multiplex space, PVR is expected to post revenue & PAT growth of 15% & 56%, respectively, in FY15. Aggressive rollout, on time execution and dominant market position would help it sustain rich valuations
Source: ICICIdirect.com Research
Oil & Gas
• Given the upcoming Lok Sabha elections, we believe there will beuncertainty in implementation of reforms, which will offset the opportunity from cheap valuations. Given the status quo, we would place our bet on upstream companies (ONGC and Oil India), given the fact that they are factoring in most negatives. We estimate the profitability of PSU oil companies will increase 36.6% in FY15E on account of lower underrecovery and APM gas price hike ($ 6.3/mmbtu). However, the upside will only be available once the trigger in the form of reforms plays out
• For gas utility companies, we expect volume growth to be subdued due to low growth in domestic production and no major RLNG capacity coming on stream in FY15E. Also, we expect demand concerns to remain due to higher LNG prices. We estimate the earning estimates of gas utility companies to decline 4.2% to | 59.5 billion in FY15E. Hence, lower earning growth will limit the upside potential of stocks
Metals
• We are underweight on the metals space on the back of subdued demand growth and overcapacity scenario (global steel utilisation levels stagnated at ~75-78%), thereby marring the profitability of metal manufacturers. Adding fuel to global demand concerns has been relatively muted GDP growth in China (accounts for ~45% of overall metal consumption)
• Domestic GDP growth rate is likely to remain subdued. Hence, we expect domestic steel demand growth to remain sluggish in FY14E (1% YoY) with a likely rebound only in H2FY15 once some clarity emerges on government policies post general elections in 2014. For FY15, we expect demand growth of ~4.5%, predominantly back-ended
• In our coverage, we like NMDC (low cost structure, healthy EBITDA margins; dividend yield of ~5%, cash per share of | 57; available at 5.2x FY15EV/EBITDA) and Hindustan Zinc (low cost structure, healthy EBITDA margins, cash per share of | 56; available at 4.4x FY15E EV/EBITDA)
Power
• In CY14, we would be cautious on the power sector, even though CY13 saw positive reforms taken by the GoI (FRP, SBD’s FSAs and coal pass through). However, our caution stems from upcoming elections andimplementation of tariff order (2014-19), that can spring negative surprises. What will be crucial to watch is the discipline of SEBs in maintaining commitments of FRP (tariff hikes/reducing AT&C losses)
• We expect ~15 GW to be added in CY14 (22 GW added in CY13) but the financial performance of the sector is expected to be muted. Sales are expected to grow 10.3% YoY (10% YoY in CY13) with PAT growth limited to 7.8% YoY (up 34% in CY13) as higher interest cost (up 29% YoY) would weigh as capacities come on stream
• In terms of stock selection, in CY14, we would stick to Power Grid (robust earnings profile as capitalisation of assets is robust) and CESC (stable base business, improving retail business & BPO investment)
Positive Outlook on Sector Neutral Outlook on Sector Negative Outlook on Sector

54
Deal Team – At Your ServiceSectoral Outlook
Real Estate
• A challenging macro environment, elevated interest rate cycle ahead, and peak level of property prices impacting affordability for buyers are expected to pose a significant challenge for developers, going ahead
• While some developers have managed to buck this trend so far through new launches in certain pockets, the build up of high level of inventory in existing projects may force developers to reduce new launches, going ahead. This would pose a key risk to our coverage assumption of 21% YoY jump to 7.0 mn sq ft in sales volume and 40% growth in the bottomline in FY15E.
• We remain selective in stock picking based on balance sheet comfort, quality of land bank and management. Consequently, ORL is our top pick with an anticipated pick-up in sales volume with new launches such as Mulund and Worli along with attractive valuation (1.4x FY15E P/BV and 0.7x its NAV)
Source: ICICIdirect.com Research
Shipping
• Though the Baltic Dry Index recovered towards end of CY13, freight rates continue to remain subdued (~ 20% of historical highs) and are unlikely to significantly improve the earnings of shipping companies. A substantial increase in tonnage supply over next two years (16% and 9% of current global fleet for dry bulk carriers and tankers, respectively) is expected to keep freight rates capped. We maintain a negative stance on the sector owing to depressed freight rates and muted global cargo movement
• We expect total revenue for the I-direct shipping universe to grow at a CAGR of 6.6% over FY13-15E to | 11968 crore. However, PAT is expected to decline from | 666 crore in FY13 to | 391 crore in FY15E on account of increased net loss by SCI (due to higher depreciation and interest cost)
• Among shipping stocks, we prefer GE Shipping owing to its low leverage (D/E of 0.9) and strong presence in the lucrative offshore segment
Retail
• After a couple of years of aggressive space addition, we expect relatively lower space addition in the forthcoming year. We expect retailers to aim at profitable growth in FY15. Hence, the focus will be on enhancing same store sales growth (SSSG). We expect the apparel segment to outperform. However, as the value retail format is likely to witness a lukewarm year, we remain neutral on the retail sector
• We expect SSSG of 6-8% and 8-12% for Future Retail and Shoppers Stop, thereby leading to a 8% and 17% revenue growth, respectively. Space addition is likely to be ~0.5 mn sq ft (earlier average of 1 – 2 mn sq ft). The EBITDA margin is likely to remain flattish with a positive bias
• In our retail pack, we like Titan Company. A lower base and increased market share is likely to aid revenue and PAT growth of 23-24% (FY15E). A likely reversal of gold import norms (with comfortable CAD) will benefit Titan. Otherwise also, it is better placed to raise working capital
Telecom
• The regulatory scenario has eased considerably, with several pro industry policies (M&A guidelines, spectrum sharing and trading, high quantum of spectrum put up for auction and reduced spectrum reserve price)
• The voice segment could see modest volume growth of 5.5% for thethree large listed operators in FY15 while ARPM would continue to improve on the back of reduced discounts and offers. Realisation in the voice segment may reach 37 paisa/minute in FY15 from 35 paisa in FY13
• Telcos may introduce further disruptive pricing in data. Though overall data consumption would grow 42%, per subscriber data consumptionwould grow 17% while realisation could decline 5% to 25 paisa/MB
• Declining capex intensity and improving operating performance will aid free cash flow, enabling debt repayment. We expect all listed telcos to collectively post 9.1% and 59.1% revenue and PAT growth in FY15 led by reduced interest outgo. We remain bullish on the sector
Positive Outlook on Sector Neutral Outlook on Sector Negative Outlook on Sector

55
Deal Team – At Your ServiceStock Picks
Bajaj Auto (BAAUTO) Target Price: |2450
• The BAL management’s highly focused approach towards motorcycles on a global scale differentiates it from its domestic peers. The stock has witnessed tremendous growth in the last five years with ~23% revenue CAGR. Also, owing to its nimble low cost structure, profits have witnessed CAGR of ~47%
• BAL remains poised to witness richer ASPs as the product mix improves in coming years as new product launches gain traction and urban demand revives. Also, export profitability is set to improve on better $/| realisation going on in the coming periods. Thus, the financial performance would continue to remain above its competitors
• We feel BAL is factoring in a lot of concerns and provides a good case for re-rating considering a strong franchise with high RoEs and good dividend payouts are available at attractive valuations of ~13x FY15E EPS
Source: ICICIdirect.com Research
IndusInd Bank (INDBA) Target Price: |510
• IndusInd Bank has advances & deposits market share of ~0.8%. In the past 22 quarters, it has augmented itself from low & volatile B/S growth to steady & sustainable growth with strong profitability (70% CAGR in past five years to | 1061 crore in FY13). IIB earns one of the best RoAs in the industry at ~1.6% and has a high yield loan portfolio of 50% commercial finance including CV and 50% corporate finance. Strong management remains a key strength of the bank since it took over in FY08
• The bank aims to achieve loan growth of 25-30% CAGR, double the branch network to 1000, make fee income exceed loan growth & CASA to be in the mid 30s over the next three years (FY14-16). We believe IIB is well poised for another phase of healthy business, PAT growth of 20%, 26% CAGR, respectively, over FY13-15E with healthy Tier I of 13%. Return ratios with RoE of 17-18% and RoA of ~1.6% provide comfort. We value IIB at 2.7x FY15E ABV and assign TP of | 510, providing an upside of 21%
Idea Cellular (IDECEL) Target Price: |193
• Idea would benefit from increasing data penetration and reducingdiscounts in voice. With 60% increase in data consumption to 123 million GB & 25% increase in data subscribers to 49 million in FY15, data revenue would grow at 55% contributing 13% to revenue up from 5% in FY13
• Aided by industry wide curb on discounts, Idea’s ARPM may expand 3.2% to 38.7 paisa, up from 35.4 paisa in FY13. Led by higher operating leverage in both data & voice, margins may expand 548 bps YoY to 32%. We expect revenue & PAT to grow at 11% & 40%, respectively, in FY15E
• Idea does not have any license coming up for renewal in CY14, which would curtail capex in the next year. Also, higher FCF generation would aid debt repayment and interest saving. Idea is at most comfortable leverage levels (net debt to EBITDA at 1.1x vs. 2.0x for Airtel and 4.5x for RCom) and remains the most attractive operator for a possible acquisition by a foreign telco. We value Idea at | 193 using the DCF methodology
ITC (ITC) Target Price: |387
• ITC is our top pick in the FMCG segment considering its pricing power in cigarettes, extensive distribution network and product launches in FMCG keeping FMCG revenue growth at high teens, improvement in RoE from hotel business and improving margins from paperboards business
• Led by the company’s strong pricing power in cigarettes, we believe EBIT growth of cigarettes would continue to grow in mid teens (~80% of ITC’s EBIT) through FY16E. Further, with not more than 10% excise hikeexpected in the FY15 Budget, we expect cigarette volume growth to revive to 1% in FY15E and 2.5% in FY16E (-4% in FY14E)
• Currently, the stock is trading near its five-year average P/E multiple (one-year forward) of 22x FY16E EPS. With cigarettes EBIT growth remaining at mid-teens and FMCG business to breakeven by FY14E, we expect multiples to expand from hereon. We have valued the stock on an SOTP basis assigning it a target price of | 387 (~22% upside)

56
Deal Team – At Your ServiceStock Picks
Marico (MARIN) Target Price: |262
• We prefer Marico over other FMCG peers led by its ability to strengthen market share in hair oils (Parachute), increasing presence in high growth healthy foods portfolio (oats & muesli) and revival in edible oil (Saffola) sales. Further, led by the initiative to increase presence in rural market we expect revenues to post strong growth of ~19% CAGR (FY13-15E)
• Within our coverage universe, we believe Marico would post the highest margin expansion of ~280 bps to 16.4% (FY15E) led by the strong pricing power in the hair oils segment, increasing revenue contribution from higher margin youth brands (Livon, Set Wet, Zatak) and cross pollination of brands across geographies
• With the stock currently trading below its five-year average P/E (one-year forward) of 23x and earnings expected to post robust growth of 25.8% CAGR (FY13-15E), we have valued the stock at 27x FY15E EPS of | 9.7 arriving at a target price of | 262
Source: ICICIdirect.com Research
Shree Cements (SHRCEM) Target Price: |5080
• Shree Cement is the largest regional player in North India. Being also one of the most efficient players with highest EBITDA/tonne in the industry, it has been least impacted by the ongoing slowdown with sales and PAT CAGR of 15.3% and 14.2% over FY10-13 (June year ending)
• The company is on track on the capacity expansion front. Cement capacity of 13.5 MT is likely to increase to 21.5 MT by FY16E. Hence, volume growth momentum is expected to continue, backed by an improvement in the pricing scenario in the north. Also, the company has 560 MW for the power plant for captive consumption and external sales
• Although challenges in terms of slowdown would remain in the near term, a strong balance sheet and better efficiency in terms of cost remain key positives for the company. The stock is trading at attractive valuations (i.e. at $106/tonne (on full expanded capacity of 21.5MT) and FY15E EV/EBITDA of 7.7x (vs. two year average trailing EV/EBITDA of 9.5x)
Oberoi Realty (OBEREA) Target Price: |285
• Oberoi Realty (ORL) is our top pick in the sector given the quality of land bank, cash rich balance sheet (cash and cash equivalent currently at ~10% of market cap), prudent land acquisition strategy and management bandwidth to execute projects
• We anticipate a pick-up in sales volume with new launches such as Mulund and Worli lined up in FY15. Consequently, we expect salesvolume of 1.1 mn sq ft in FY15E vs. 0.5 mn sq ft in FY13. Furthermore, with Esquire expected to reach revenue threshold in FY15, we expect a healthy 16.8% and 23.3% YoY growth in revenues and PAT, respectively, in FY15E
• Available at an attractive valuation (1.4x FY15E P/BV and 0.7x its NAV), we believe key launches such as Mulund and Worli along with a pick-up in sales volume will hold the key for CY14. We have a target price of | 285/share(0.8x its FY15E NAV)
Titan Industries (TITIND) Target Price: |280
• Titan will continue to maintain its leadership in the domestic jewellery market driven by its strong brand equity, pan-India presence and superior financial structure. We expect revenues, PAT to grow at a CAGR of 19%, 16% (FY13-16E), respectively, bearing in mind the current regulatory framework. It is likely to gain market share as its unorganised peers are likely to find it difficult to survive in the current regulatory situation
• Owing to the strong balance sheet (cash of | 800 crore), Titan is better placed to fund its working capital requirements. Being one of the least leveraged (0.3x) against the industry range of 0.3-2.0x, it is likely to continue to enjoy better interest rates. The EBITDA margin is likely to have a positive bias (~10.5%) as operations under the new regime stabilise
• Considering the comfortable CAD situation, we believe the norms relating to gold imports could be relaxed. At ~18x FY16E EPS, Titan looksattractive and the risk-return trade-off works in favour of investors

57
Deal Team – At Your ServiceStrategy 2013 Stock Performance
Source: ICICIdirect.com ResearchStrategy 2013 stocks recommended on December 27, 2012
Scrip Name Rec Buying Range Exit price/CMP* (|) Return (%)Balkrishna Industries 255-275 265 0.0Cadila Healthcare 840-880 787* -8.5Heidelberg Cement 50-53 38* -26.1Idea Cellular 97-98 120 23.1Info Edge 330-350 394 15.9Kansai Nerolac 1040-1100 1081* 0.9Mahindra Lifespace 380-410 404* 2.3Page Industries 3210-3320 3965 21.4TCS 1210-1260 1430 15.8Tata Motors 290-305 360 21.0Tech Mahindra 880-915 1182 31.7Zee Entertainment 180-200 268 40.8
Strategy 2013 Stock Performance

DisclaimerThe report and information contained herein is strictly confidential and meant solely for the selected recipient and may not be altered in any way, transmitted to, copied or distributed, in part or in whole, to any other person or to the media or reproduced in any form, without prior written consent of ICICI Securities Ltd (I-Sec). The author may be holding a small number of shares/position in the above-referred companies as on date of release of this report. I-Sec may be holding a small number of shares/position in the above-referred companies as on date of release of this report. This report is based on information obtained from public sources and sources believed to be reliable, but no independent verification has been made nor is its accuracy or completeness guaranteed. This report and information herein is solely for informational purpose and may not be used or considered as an offer document or solicitation of offer to buy or sell or subscribe for securities or other financial instruments. Nothing in this report constitutes investment, legal, accounting and tax advice or a representation that any investment or strategy is suitable or appropriate to your specific circumstances. The securities discussed and opinions expressed in this report may not be suitable for all investors, who must make their own investment decisions, based on their own investment objectives, financial positions and needs of specific recipient. This report may not be taken in substitution for the exercise of independent judgment by any recipient. The recipient should independently evaluate the investment risks. I-Sec and affiliates accept no liabilities for any loss or damage of any kind arising out of the use of this report. Past performance is not necessarily a guide to future performance. Actual results may differ materially from those set forth in projections. I-Sec may have issued other reports that are inconsistent with and reach different conclusion from the information presented in this report. This report is not directed or intended for distribution to, or use by, any person or entity who is a citizen or resident of or located in any locality, state, country or other jurisdiction, where such distribution, publication, availability or use would be contrary to law, regulation or which would subject I-Sec and affiliates to any registration or licensing requirement within such jurisdiction. The securities described herein may ormay not be eligible for sale in all jurisdictions or to certain category of investors. Persons in whose possession this document may come are required to inform themselves of and to observe such restriction.
Pankaj Pandey Head – Research [email protected]
ICICIdirect.com Research Desk,ICICI Securities Limited,1st Floor, Akruti Trade Centre,Road No 7, MIDCAndheri (East)Mumbai – 400 [email protected]