market statistics 2016 - hkex · market statistics 2016 ... h-shares index options: 15,304,245...
TRANSCRIPT

Market Statistics 2016Page
1. Records Set in 2016 1
2. Securities Market Statistics 2 - 14
3. China Dimension 15 - 16
4. Derivatives Market Statistics 17 - 20
5. LME Statistics 21

1
RECORDS SET IN 2016
Securities Market
(HK$)
Debt securities turnover $20.9 bil $9.4 bil (Year 2015)Real Estate Investment Trust turnover $87.9 bil $82.4 bil (Year 2013)
Derivatives Market
Trading Turnover (Contracts)
Total Futures 73,462,212 (Year 2015)
Hang Seng Index Futures 23,085,833 (Year 2011)
Mini Hang Seng Index Futures 10,294,537 (Year 2011)
HSCEI Dividend Point Index Futures 240,572 (Year 2014)
RMB Currency Futures - USD/CNH Futures 262,433 (Year 2015)
Mini Hang Seng Index Options 1,230,997 (Year 2012)
H-shares Index Options 15,304,245 (Year 2015)
After-Hours Trading Session 5,255,464 (Year 2015)
HSCEI Dividend Point Index Futures (13 Dec 2016) 101,430 (30 Dec 2015)
RMB Currency Futures - USD/CNH Futures (13 Dec 2016) 23,887 (14 Feb 2014)
H-shares Index Options (15 Dec 2016) 2,618,350 (25 Sep 2015)
184,626
Open Interest
3,111,821
8,959,961
44,033
80,950,484
583,609
495,925
18,663,764
31,232,595
1,362,955
12,108,320
(Contracts)
As at 15 Dec 2016 Pre-2016 Record
As at 15 Dec 2016 Pre-2016 Record

2
SECURITIES MARKET (Main Board and GEM)Market Performance
2015 year end % Change
Market capitalisation (HK$bil) 24,713.2 24,683.7 0.12
Number of listed companies * 1,968 1,866 5.47
Number of newly listed companies for the year * 121 ** 138 ^ -12.32
Total equity funds raised (HK$mil) 462,381.8 1,115,642.7 -58.55 - IPO funds raised 193,580.4 263,089.2 -26.42 - Post IPO funds raised 268,801.4 852,553.5 -68.47
Average daily turnover (HK$mil) 67,396 105,630 -36.20
The figures represent the total market capitalisation of all equity securities and exclude other listed securities such as REITs and bonds.
* Excludes listed securities other than equities such as REITs and bonds
** Includes 6 companies which moved their listings from GEM to the Main Board ^ Includes 14 companies which moved their listings from GEM to the Main Board
Funds raised in 2016 are provisional figures
Percentage changes are calculated based on rounded figuresIndividual figures for Main Board and GEM are on page 3 and page 4
Up to 15 Dec 2016As at

3
SECURITIES MARKETMarket Performance
Up to 15 Dec 2016 2015 year end % Change Up to 15 Dec 2016 2015 year end % Change
Market capitalisation (HK$bil) 24,420.7 24,425.6 -0.02 292.5 258.2 13.28
Number of listed companies * 1,711 1,644 4.08 257 222 15.77
Number of newly listed companies for the year * 79 ** 104 ^ -24.04 42 34 23.53
Number of delistings 12 8 50.00 7 ** 16 ^ -56.25
Number of listed securities 8,483 8,792 -3.51 258 223 15.70 - Equities 1,722 1,653 4.17 257 222 15.77 - Warrants ▪ Equity warrants 8 12 -33.33 1 1 0.00 ▪ Derivative warrants 3,750 4,590 -18.30 NA NA - - Callable Bull / Bear Contracts 1,955 1,630 19.94 NA NA - - Debt securities 882 762 15.75 NA NA - - Unit trusts and mutual funds ▪ Exchange Traded Funds (ETFs) + 142 133 6.77 NA NA - ▪ Leveraged and Inverse Products (L&I) ++ 12 - - NA NA - ▪ REITs 11 11 0.00 NA NA - ▪ Others 1 1 0.00 NA NA -
The figures represent the total market capitalisation of all equity securities and exclude other listed securities such as REITs and bonds
* Excludes listed securities other than equities such as REITs and bonds
** Includes 6 companies which moved their listings from GEM to the Main Board ^ Includes 14 companies which moved their listings from GEM to the Main Board + Excludes two iShares of ETF under pilot programmes++ Trading commenced on 13 June 2016
Percentage changes are calculated based on rounded figures
Main BoardAs at
GEMAs at

4
Market Performance (continued)
Up to 15 Dec 2016 2015 year end % Change Up to 15 Dec 2016 2015 year end % ChangeTotal funds raised (HK$mil) 1,648,321.6 2,510,205.2 -34.34 18,235.1 22,091.3 -17.46 Total equity funds raised (HK$mil) 444,146.6 1,093,551.5 -59.38 18,235.1 22,091.3 -17.46 - IPO funds raised 189,187.1 260,348.4 -27.33 4,393.3 2,740.8 60.29 - Post IPO funds raised 254,959.5 833,203.1 -69.40 13,841.8 19,350.4 -28.47
Funds raised by other newly listed securities (HK$mil) - Warrants ▪ Equity warrants 0 0 - 0 0 - ▪ Derivative warrants 100,761 182,370 -44.75 NA NA - - Callable Bull / Bear Contracts 350,332 483,527 -27.55 NA NA - - Debt securities 753,082 750,757 0.31 NA NA - - Unit trusts and mutual funds ▪ Exchange Traded Funds (ETFs) NA ^ NA ^ - NA NA - ▪ REITs 0 0 - NA NA -
Total turnover (HK$mil) 15,792,771 25,835,958 -38.87 112,744 254,663.3 -55.73 - Equities 10,704,524 17,227,618 -37.86 112,701 254,618 -55.74 - Warrants ▪ Equity warrants 305 3,936 -92.25 42.7 45.7 -6.56 ▪ Derivative warrants 2,654,641 4,504,079 -41.06 NA NA - - Callable Bull / Bear Contracts 1,339,404 1,836,854 -27.08 NA NA - - Debt securities 20,944 9,381 123.26 NA NA - - Unit trusts and mutual funds ▪ Exchange Traded Funds (ETFs) 984,497 2,170,959 -54.65 NA NA - ▪ Leveraged and Inverse Products (L&I) * 484 - - NA NA - ▪ REITs 87,865 82,028 7.12 NA NA - ▪ Others 107 1,104 -90.31 NA NA -Average daily turnover (HK$mil) 66,919 104,599 -36.02 478 1,031 -53.64Number of trading days 236 247 236 247 ̂ Figure is not available as the ETFs were not issued through IPOs
* Trading commenced on 13 June 2016Funds raised in 2016 are provisional figuresIncludes non-HKD securities. Fundraising and turnover figures have been converted into HKDPercentage changes are calculated based on rounded figures. Numbers may not add up to the totals due to rounding
GEM Main Board

5
Stock Connect Statistics
Shanghai-Hong Kong Stock Connect (1 Jan - 15 Dec 2016)
Northbound Trading Southbound TradingHighest trade value (Buy + Sell) RMB 7.4 bil (18 Mar 2016) HK$ 12.0 bil (9 Sep 2016)
Average daily trade value (Buy + Sell) RMB 3,211 mil HK$ 3,573 mil
Total trade value (Buy + Sell) RMB 719 bil HK$ 783 bil
Average daily no. of trades (Buy + Sell) 135,714 59,341
Highest daily quota usage RMB 5.0 bil (39% usage) was used on 16 Aug 2016
RMB 6.1 bil (39% usage) was used on 9 Sep 2016
No. of trading days 224 days 219 days
Northbound Trading Southbound TradingHighest trade value (Buy + Sell) RMB 3.6 bil (9 Dec 2016) HK$ 923 mil (5 Dec 2016)
Average daily trade value (Buy + Sell) RMB 2,101 mil HK$ 565 mil
Total trade value (Buy + Sell) RMB 19 bil HK$ 5.1 bil
Average daily no. of trades (Buy + Sell) 88,511 18,777
Highest daily quota usage RMB 2.7 bil (21% usage) was used on 5 Dec 2016
RMB 850 mil (8% usage) was used on 5 Dec 2016
No. of trading days 9 days 9 days
Shenzhen-Hong Kong Stock Connect (5 Dec - 15 Dec 2016)

6
Closing Indices
15 Dec 2016 31 Dec 2015 % Change
Hang Seng Index 22059.40 21914.40 0.66
Hang Seng China Enterprises Index (H Shares) 9479.16 9661.03 -1.88
Hang Seng China-Affiliated Corporations Index (Red Chips) 3621.92 4052.12 -10.62
S&P/HKEX LargeCap Index 27953.20 27007.12 3.50
S&P/HKEX GEM Index 344.87 476.79 -27.67
CES China 120 Index 5061.45 5044.06 0.34
CES China A80 Index 5980.53 6296.47 -5.02
CES China HK Mainland Index 5473.25 5418.21 1.02
As at

7
IPO Equity Funds Raised (1 Jan - 15 Dec 2016)
Rank Exchange
1 HKEX 24,8172 Shanghai Stock Exchange 14,9563 NYSE (includes NYSE Arca + NYSE MKT LLC) 14,0684 Japan Exchange Group Inc 7,7115 NASDAQ 7,5726 LSE (excludes Borsa Italiana) 7,4287 Shenzhen Stock Exchange 6,8948 Copenhagen (NASDAQ OMX Nordic) 5,8909 Deutsche Borse 5,78710 Korea Exchange 5,400
Source : HKEX and Bloomberg
Figures are provisional
IPO Equity Funds Raised(US$ million)

8
Total Equity Funds Raised (Jan - Nov 2016)
Rank Exchange
1 Shenzhen Stock Exchange 144,739.52 Euronext 132,081.63 Shanghai Stock Exchange 114,490.04 NYSE 106,380.05 HKEX 53,698.86 TMX Group 42,795.37 LSE Group 30,981.18 BME Spanish Exchanges 28,071.79 Australian Securities Exchange 26,128.710 Japan Exchange Group Inc 21,662.0
Source : World Federation of Exchanges (WFE) Monthly Statistics (not including exchanges for which statistics are not available)
Figures are provisional
Total Equity Funds Raised(US$ million)

9
Market Value of Shares of Domestic-listed Companies (Main and Parallel Markets)
November 2016 December 2015Exchange Rank Market value Rank Market value % Change
(US$ million) (US$ million)
NYSE 1 18,992,349.9 1 17,786,787.4 6.8Nasdaq - US 2 7,686,225.3 2 7,280,752.2 5.6Japan Exchange Group Inc 3 4,987,478.2 3 4,894,919.1 1.9Shanghai Stock Exchange 4 4,281,986.1 4 4,549,288.0 -5.9Shenzhen Stock Exchange 5 3,412,904.5 6 3,638,731.3 -6.2Euronext 6 3,311,994.5 7 3,305,901.4 0.2LSE Group 7 3,294,827.5 5 3,878,774.2 -15.1HKEX 8 3,291,144.8 8 3,184,874.2 3.3TMX Group 9 1,961,397.8 10 1,591,928.6 23.2Deutsche Boerse AG 10 1,616,278.1 9 1,715,800.5 -5.8
Source : World Federation of Exchanges (WFE) Monthly Statistics (not including exchanges for which statistics are not available)
Market value excludes investment funds
TMX Group includes TSX Venture market cap
Percentage changes are calculated based on rounded figures

10
Value of Share Trading (Main and Parallel Markets) (Jan - Nov 2016)
Rank Exchange
1 Nasdaq - US 29,264,086.92 NYSE 18,229,585.53 BATS Global Markets 12,650,359.94 Shenzhen Stock Exchange 10,896,673.75 BATS Chi-x Europe 7,156,263.66 Shanghai Stock Exchange 6,887,211.87 Japan Exchange Group Inc 5,776,493.28 LSE Group 3,103,626.99 Euronext 2,552,256.1
10 Korea Exchange 1,572,369.611 HKEX 1,318,492.9
Source: World Federation of Exchanges (WFE) Monthly Statistics (not including exchanges for which statistics are not available)
Figures are the sum of the values of electronic order book (EOB) trades, negotiated deals and reported trades as reported separately in WFE statisticsThey are not entirely comparable across exchanges because of different reporting rules and calculation methods
Value of Share Trading(US$ million)

11
Total Turnover of Securitised Derivatives, including Warrants and CBBCs (Jan - Nov 2016)
Rank Exchange
1 HKEX 494,878.3 2 Deutsche Boerse AG 37,772.0 3 Tel-Aviv Stock Exchange 31,778.3 4 LSE Group 24,131.8 5 The Stock Exchange of Thailand 17,416.2 6 Korea Exchange 16,828.2 7 SIX Swiss Exchange 14,002.0 8 Taiwan Stock Exchange 12,312.8 9 Euronext 9,722.8
10 Singapore Exchange 4,722.7
Source: World Federation of Exchanges (WFE) Monthly Statistics (not including exchanges for which statistics are not available)
Due to different reporting rules & calculation methods, turnover figures are not entirely comparable
Figures include the turnover of structured products such as derivative warrants, equity warrants, callable bull/bear contracts and equity linked instruments
Turnover(US$ million)

12
Total Turnover of ETFs (Jan - Nov 2016)
Rank Exchange
1 Nasdaq - US 7,583,321.22 NYSE 4,846,873.73 Japan Exchange Group Inc 533,809.94 LSE Group 476,279.55 Deutsche Boerse AG 167,979.16 Korea Exchange 155,627.77 Euronext 147,676.78 HKEX 121,247.59 Shenzhen Stock Exchange 99,057.510 Shanghai Stock Exchange 86,280.5
Source: World Federation of Exchanges (WFE) Monthly Statistics (not including exchanges for which statistics are not available)
Due to different reporting rules & calculation methods, turnover figures are not entirely comparable
Turnover(US$ million)

13
Ten Largest IPO Funds Raised by Newly Hong Kong Listed Companies in 2016
Rank Company Name
1 Postal Savings Bank of China Co Ltd - H Shares (1658) 59.15
2 China Resources Pharmaceutical Group Ltd (3320) 15.06
3 China Zheshang Bank Co Ltd - H Shares (2016) 15.03
4 China Merchants Securities Co Ltd - H Shares (6099) 10.70
5 Everbright Securities Co Ltd - H Shares (6178) 8.93
6 BOC Aviation Ltd (2588) 8.74
7 DFZQ - H Shares (3958) 8.37
8 CSC Financial Co Ltd - H Shares (6066) 7.70
9 Bank of Tianjin Co Ltd - H Shares (1578) 7.68
10 China Development Bank Financial Leasing Co Ltd - H Shares (1606) 6.28
IPO Funds Raised(HK$ billion)

14
Ten Largest IPO Funds Raised by Newly Hong Kong Listed Companies since 1986
Rank Company Name
1 AIA Group Ltd (1299) 159.08
2 Industrial and Commercial Bank of China Ltd - H Shares (1398) 124.95
3 Agricultural Bank of China Ltd - H Shares (1288) 93.52
4 Bank of China Ltd - H Shares (3988) 86.74
5 Glencore International plc (805) 77.75
6 China Construction Bank Corporation - H Shares (939) 71.58
7 Postal Savings Bank of China Co Ltd - H Shares (1658) 59.15
8 China Unicom (Hong Kong) Ltd (762) 43.61
9 Huatai Securities Co Ltd - H Shares (6886) 38.76
10 China CITIC Bank Corporation Ltd - H Shares (998) 32.92
IPO Funds Raised(HK$ billion)
15
CHINA DIMENSION
Mainland Enterprises refer to the following:
H-Share Companies
Red Chip Companies
Mainland Private Enterprises
H-share companies are enterprises that are incorporated in the Mainland which are either controlled by Mainland Government entities or individuals.
Red chip companies are enterprises that are incorporated outside of the Mainland and are controlled by Mainland Government entities.
Mainland private enterprises are companies that are incorporated outside of the Mainland and are controlled
by Mainland individuals.

16
MAIN BOARD and GEM
Performance of Mainland Enterprises
% ChangeNumber of listed companies 999 (51 %) 951 (51 %) 5
Number of newly listed companies for the year 54 # (45 %) 75 ^ (54 %) -28
Market capitalisation (HK$bil) 15,518.69 (63 %) 15,319.82 (62 %) 1
% Change
Average daily equity turnover (HK$mil) 32,337.1 (71 %) 51,439.4 (73 %) -37
Total equity funds raised (HK$bil) 325.4 * (70 %) 658.1 (59 %) -51
▪ IPO funds raised (HK$bil) 181.3 * (94 %) 242.8 (92 %) -25
▪ Post IPO funds raised (HK$bil) 144.1 * (54 %) 415.3 (49 %) -65
Total equity funds raised since Jan 1993 (HK$bil) 5,421.0 * (61 %) 5,095.6 (60 %) 6
The share of Mainland enterprises of the equity market total is presented as a percentage in brackets# Includes 14 H-share companies, 3 red chips and 37 Mainland private enterprises (Among which 3 Mainland private enterprises moved their listings from GEM to the Main Board)^ Includes 31 H-share companies, 2 red chips and 42 Mainland private enterprises (Among which 5 Mainland private enterprises moved their listings from GEM to the Main Board)
* Provisional figuresPercentage changes are calculated based on rounded figuresNumbers may not add up to the totals due to rounding
As at
31 Dec 201515 Dec 2016
31 Dec 201515 Dec 2016
As of

17
DERIVATIVES MARKETDerivatives Market Statistics of Key Products
Volume Period-end Volume Period-end(Contracts) Open Interest (Contracts) Open Interest
Futures and Options 180,915,667 12,790,504 189,824,363 7,266,980
Futures 80,950,484 748,515 73,462,212 617,026
Hang Seng Index Futures 31,232,595 146,790 21,239,775 97,118
Mini-Hang Seng Index Futures 12,108,320 14,193 10,046,556 7,556
H-shares Index Futures 31,509,398 337,596 33,379,310 384,767
Mini H-shares Index Futures 4,750,743 7,304 7,506,543 6,088
HSI Dividend Point Index Futures 16,066 7,381 9,573 2,581
HSCEI Dividend Point Index Futures 583,609 184,337 205,269 75,426
HSI Volatility Index Futures 87 0 464 1
CES China 120 Index Futures 577 20 27,427 5
CES Gaming Top 10 Index Futures* 0 0 - -
Hang Seng Mainland Oil & Gas Index Futures* 5 5 - -
Hang Seng Mainland Banks Index Futures* 239 29 - -
Hang Seng Mainland Healthcare Index Futures* 0 0 - -
Hang Seng Mainland Properties Index Futures* 5 5 - -
Hang Seng IT Hardware Index Futures* 0 0 - -
Hang Seng Software & Services Index Futures* 0 0 - -
Stock Futures 218,714 5,682 729,013 20,088
Three-month HIBOR Futures 12 0 90 0
One-month HIBOR Futures 0 0 6 0
Three-year Exchange Fund Note Futures# - - - -
* Trading commenced on 09 May 2016# Trading suspended with effect from 14 Sep 2015
Up to 31 Dec 2015Up to 15 Dec 2016

18
DERIVATIVES MARKETDerivatives Market Statistics of Key Products (continued)
Volume Period-end Volume Period-end(Contracts) Open Interest (Contracts) Open Interest
Futures and Options 180,915,667 12,790,504 189,824,363 7,266,980
RMB Currency Futures - USD/CNH Futures 495,925 43,641 262,433 23,046
RMB Currency Futures - EUR/CNH Futures^ 853 69 - -
RMB Currency Futures - JPY/CNH Futures^ 382 2 - -
RMB Currency Futures - AUD/CNH Futures^ 81 4 - -
RMB Currency Futures - CNH/USD Futures^ 3,794 1,363 - -
London Aluminium Mini Futures 1,827 4 11,554 75
London Zinc Mini Futures 12,387 12 16,654 109
London Copper Mini Futures 3,351 5 27,388 16
London Lead Mini Futures† 7 0 0 0
London Nickel Mini Futures† 11,470 73 155 150
London Tin Mini Futures† 37 0 2 0
Options 99,965,183 12,041,989 116,362,151 6,649,954
Hang Seng Index Options 8,990,547 402,503 7,515,466 172,564
Mini-Hang Seng Index Options 1,362,955 23,329 1,033,813 4,945
Flexible Hang Seng Index Options 560 2,975 5,300 2,975
H-shares Index Options 18,663,764 3,111,821 15,304,245 1,625,661
Mini H-shares Index Options†† 179,761 12,701 - -
Flexible H-shares Index Options 16,086 18,749 39,848 16,131
Stock Options 70,751,510 8,469,911 92,463,479 4,827,678
^ Trading commenced on 30 May 2016† Trading commenced on 14 Dec 2015
†† Trading commenced on 05 Sep 2016
Up to 15 Dec 2016 Up to 31 Dec 2015

19
Turnover in the Derivatives Markets (Jan - Nov 2016)
Rank Exchange
1 National Stock Exchange of India 1,252.02 EUREX 1,072.53 BM&FBOVESPA 813.44 Chicago Board Options Exchange 731.95 CME Group 710.56 Korea Exchange 519.67 Moscow Exchange 487.98 Nasdaq - US 474.79 NYSE 342.3
10 Japan Exchange Group 301.5••
•••
•••
14 HKEX 169.2
Source: World Federation of Exchanges (WFE) Monthly Statistics (not including exchanges for which statistics are not available)
Figures include turnover in stock options, single stock futures and stock index options and futures.
It should be noted that contracts vary in size
Figures are provisional
Contracts (million)

20
Notional Turnover in the Derivatives Markets (Jan - Nov 2016)
Rank Exchange
1 CME Group 77,192,700.02 Korea Exchange 37,459,102.13 EUREX 34,076,338.04 National Stock Exchange of India 11,488,280.05 Japan Exchange Group 9,500,570.06 HKEX 8,731,956.17 TAIFEX 4,234,391.18 ICE Futures US 3,938,879.09 Euronext 3,020,973.810 Australian Securities Exchange 1,610,183.4
Source: World Federation of Exchanges (WFE) Monthly Statistics (not including exchanges for which statistics are not available)
Some exchanges provide information regarding turnover in terms of number of contracts traded only but the corresponding turnover in terms of notional value is not available. Readers should exercise caution when comparing performance
Figures include turnover in stock options, single stock futures and stock index options and futures.
The notional value of derivatives is the number of contracts traded multiplied by the contracts’ underlying value. The contracts’ underlying value is calculated by multiplying the market price of the underlying asset for each contract times the contract’s multiplier. It is an approximate measure of the underlying value of the number of contracts traded.
Figures are provisional
Notional Turnover
(US$ million)
21
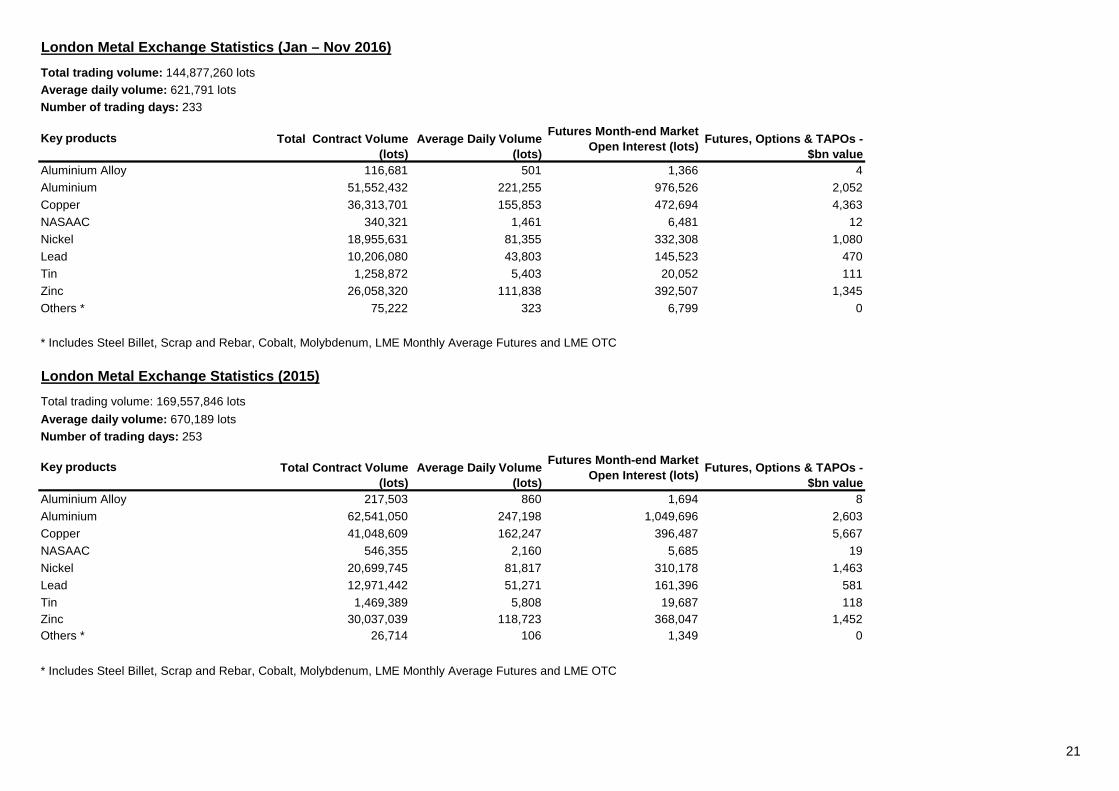
London Metal Exchange Statistics (Jan – Nov 2016)Total trading volume: 144,877,260 lots Average daily volume: 621,791 lotsNumber of trading days: 233
Total Contract Volume (lots)
Average Daily Volume (lots)
Futures Month-end Market Open Interest (lots) Futures, Options & TAPOs -
$bn valueAluminium Alloy 116,681 501 1,366 4Aluminium 51,552,432 221,255 976,526 2,052Copper 36,313,701 155,853 472,694 4,363NASAAC 340,321 1,461 6,481 12Nickel 18,955,631 81,355 332,308 1,080Lead 10,206,080 43,803 145,523 470Tin 1,258,872 5,403 20,052 111Zinc 26,058,320 111,838 392,507 1,345Others * 75,222 323 6,799 0
* Includes Steel Billet, Scrap and Rebar, Cobalt, Molybdenum, LME Monthly Average Futures and LME OTC
London Metal Exchange Statistics (2015)
Average daily volume: 670,189 lotsNumber of trading days: 253
Total Contract Volume (lots)
Average Daily Volume (lots)
Futures Month-end Market Open Interest (lots) Futures, Options & TAPOs -
$bn valueAluminium Alloy 217,503 860 1,694 8Aluminium 62,541,050 247,198 1,049,696 2,603Copper 41,048,609 162,247 396,487 5,667NASAAC 546,355 2,160 5,685 19Nickel 20,699,745 81,817 310,178 1,463Lead 12,971,442 51,271 161,396 581Tin 1,469,389 5,808 19,687 118Zinc 30,037,039 118,723 368,047 1,452Others * 26,714 106 1,349 0
* Includes Steel Billet, Scrap and Rebar, Cobalt, Molybdenum, LME Monthly Average Futures and LME OTC
Key products
Total trading volume: 169,557,846 lots
Key products