market risk analysis prof ian giddy stern school of business new york university lib
Post on 22-Dec-2015
215 views
TRANSCRIPT

Market Risk Analysis
Prof Ian Giddy
Stern School of Business
New York University
LIB

Copyright ©1998 Ian H. Giddy Risk Analysis 5
Risk Management is a Process
Risk Management
DefineDefine MeasureMeasure ManageManage MonitorMonitor

Copyright ©1998 Ian H. Giddy Risk Analysis 6
Market Risk Measurement
VolumetricVolumetric Duration/ Duration/ PVof01PVof01
Option Option Sensitivity Sensitivity MeasuresMeasures
SimulationsSimulationsValueValue
atatRiskRisk
• Notional Amounts
• Linear risk measures
• Swap/ bond equivalents
• Non-linear risk measures
• Delta, gamma, vega, theta, rho
• No aggregation of risk measures across asset classes or instruments
• Limited market scenarios that could include market correlations
• Reprice portfolio• Parallel and non-
parallel curve shifts
• Aggregate portfolio risk per scenario
• Distribution of market moves and portfolio values
• Includes market correlations
• Reprice portfolio• Aggregate risk
measures within confidence interval
Where are we now? Where do we need to be?

Copyright ©1998 Ian H. Giddy Risk Analysis 7
An Overview of Corporate VAR
Mean
Estimates of Cash Flow Distribution
• Volatilities• Correlations
Base rates/ Currency market conditions
Historical rates/ Discrete scenarios
Model 1
Model 2
Model 3
Model 4
Interest Rates
Currencies
Equities
Commodities Impact on Earnings
Business 2
Business 1
Business 3
Transactional Database
Projected Revenues
Projected Operating Costs
PortfolioDatabase

Copyright ©1998 Ian H. Giddy Risk Analysis 8
Summary of “Value at Risk” Reporting
“At close of business each day tell me what the market risks are across all businesses and locations.”
Dennis Weatherstone, JP Morgan
Logical steps:Economic-value accounting (need market prices
or models)Volatilities and correlations of market pricesMeasurement of Risk ExposureManagement of riskMarket-price based performance measurement

Copyright ©1998 Ian H. Giddy Risk Analysis 9
Portfolio Diversification
DM position A$ position S$ position FIM position
Net effect?
Copyright ©1998 Ian H. Giddy Risk Analysis 10
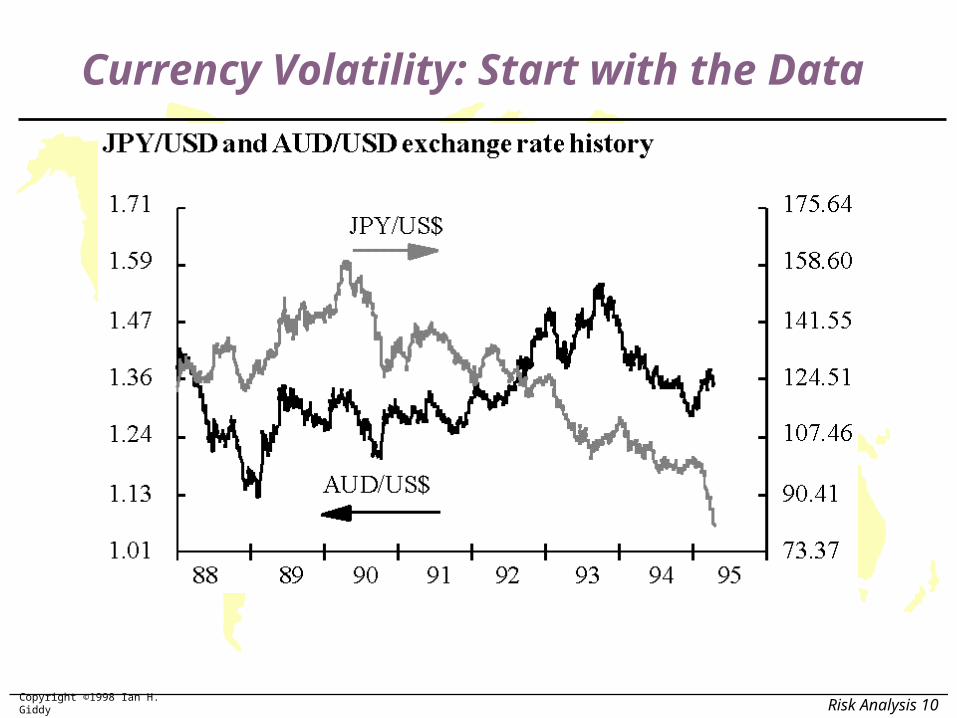
Currency Volatility: Start with the Data

Copyright ©1998 Ian H. Giddy Risk Analysis 11
Calculate Daily % Changes
%
S
S1

Copyright ©1998 Ian H. Giddy Risk Analysis 12
Predict Volatilities
RiskMetrics
(exponential smoothing)
BIS
(rolling historicals)

Copyright ©1998 Ian H. Giddy Risk Analysis 13
RiskMetrics Method Compared
RM
BIS
n
t t
t jj
n
21
21
2
2 2
1
1
0 94
1
( )
.

Copyright ©1998 Ian H. Giddy Risk Analysis 14
RiskMetrics Method Compared
Other methods include: Implied volatility from option prices Structured volatility models (ARCH, GARCH,
EGARCH) Stochastic volatility
The task of most models is to find
some historical pattern of volatility
and to use this to forecast volatility,
which seems to “cluster

Copyright ©1998 Ian H. Giddy Risk Analysis 15
Get Volatility and Correlation Estimates...eg from RiskMetrics
On the World Wide Web, RiskMetrics publications and data may be found at:
http://www.jpmorgan.com and http://www.riskmetrics.reuters.com

Copyright ©1998 Ian H. Giddy Risk Analysis 16
RiskMetrics Coverage
...plus about a dozen
commodities,term structure
of yields, more exotics...
each day, about 450
volatilities and 100,000
correlations.

Copyright ©1998 Ian H. Giddy Risk Analysis 17
Now More...(and Later, Customizable)

Copyright ©1998 Ian H. Giddy Risk Analysis 18
Estimated Volatilities
AUD
BEF
CAD
DKK
FFR
DEM
ITL
JPY
NLG
ESB
SEK
CHF
GBP
XEU
0.0% 0.5% 1.0% 1.5% 2.0% 2.5% 3.0% 3.5% 4.0% 4.5%
Standard Deviation
AUD
BEF
CAD
DKK
FFR
DEM
ITL
JPY
NLG
ESB
SEK
CHF
GBP
XEU
Cu
rren
cy
Currency Volatilities
Copyright ©1998 Ian H. Giddy Risk Analysis 19
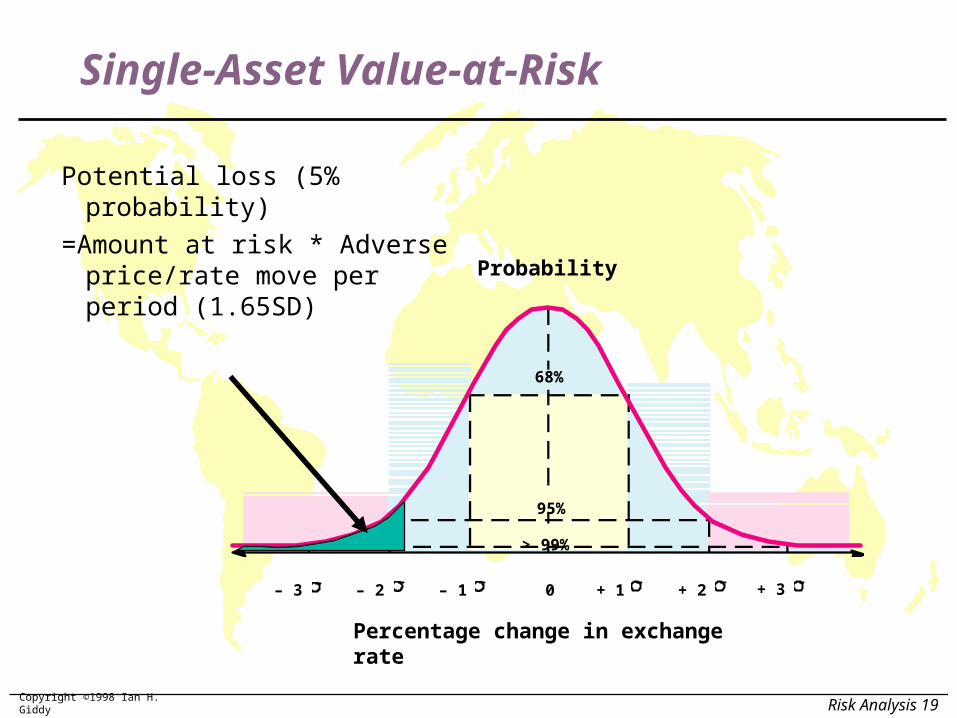
Single-Asset Value-at-Risk
Probability
Percentage change in exchange rate
68%
95%
> 99%
– 3 – 2 – 1 0 + 1 + 2 + 3
Potential loss (5% probability)
=Amount at risk * Adverse price/rate move per period (1.65SD)
Copyright ©1998 Ian H. Giddy Risk Analysis 20
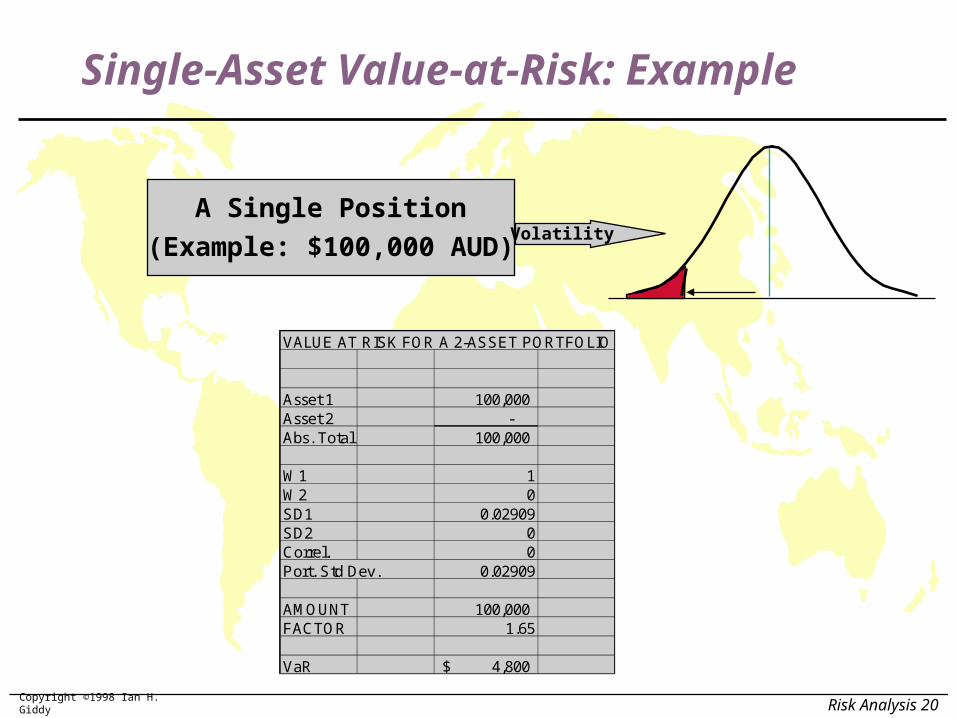
Single-Asset Value-at-Risk: Example
A Single Position
(Example: $100,000 AUD)Volatility
VALUE AT RISK FOR A 2-ASSET PORTFOLIO
Asset 1 100,000 Asset 2 - Abs. Total 100,000
W1 1W2 0SD1 0.02909SD2 0Correl. 0Port. Std Dev. 0.02909
AMOUNT 100,000 FACTOR 1.65
VaR 4,800$

Copyright ©1998 Ian H. Giddy Risk Analysis 21
Estimated Correlations
CAD AUD DEM JPY GBP ZAR
CAD
AUD
DEM
JPY
GBPZAR
-0.2
0
0.2
0.4
0.6
0.8
1
CO
RR
EL
AT
ION
Copyright ©1998 Ian H. Giddy Risk Analysis 22
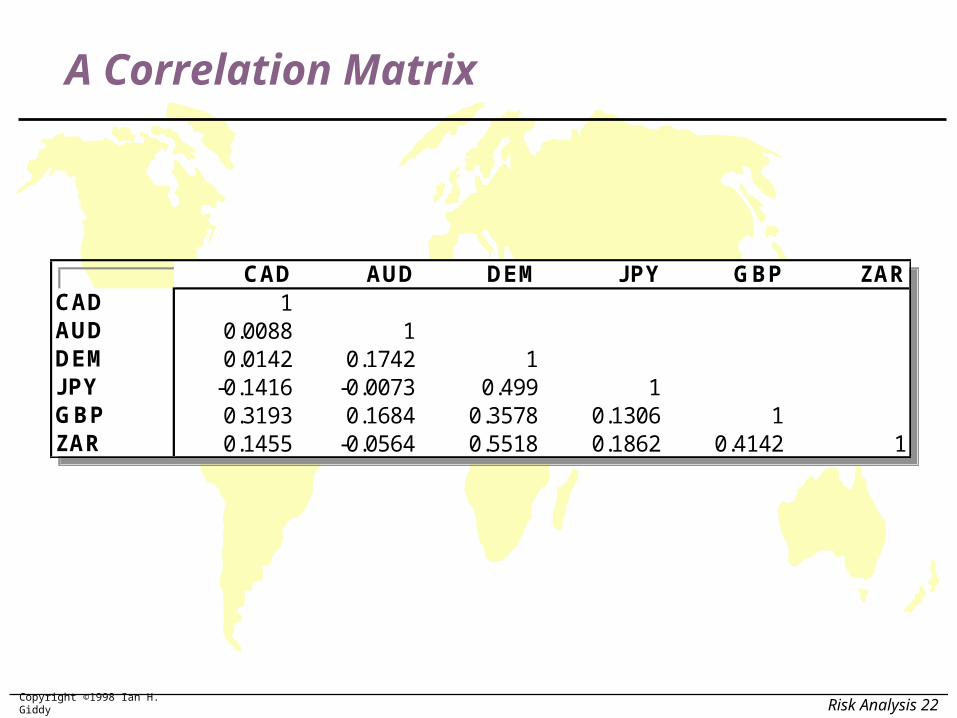
A Correlation Matrix
CAD AUD DEM JPY GBP ZARCAD 1AUD 0.0088 1DEM 0.0142 0.1742 1JPY -0.1416 -0.0073 0.499 1GBP 0.3193 0.1684 0.3578 0.1306 1ZAR 0.1455 -0.0564 0.5518 0.1862 0.4142 1
CAD AUD DEM JPY GBP ZARCAD 1AUD 0.0088 1DEM 0.0142 0.1742 1JPY -0.1416 -0.0073 0.499 1GBP 0.3193 0.1684 0.3578 0.1306 1ZAR 0.1455 -0.0564 0.5518 0.1862 0.4142 1

Copyright ©1998 Ian H. Giddy Risk Analysis 23
Measuring Portfolio Exposure: Two Assets
The variance of a 2-asset portfolio, :
where wA and wB are the weights of A and B in the portfolio.
To evaluate the gains and structure of a portfolio, we need a variance-covariance matrix:
$ AT RISK VOL. AUD BEF
AUD $50,000 2.909% 1
BEF $50,000 4.573% -0.273 1
P2
A2
A2
B2
B2
A B A B A B = w + w + 2 w w

Copyright ©1998 Ian H. Giddy Risk Analysis 24
Two-Asset Value-at-Risk: Example
Two Positions
(Example: $100,000 AUD & BEF)Volatility &
Correlation
VALUE AT RISK FOR A 2-ASSET PORTFOLIO
Asset 1 50,000 Asset 2 50,000 Abs. Total 100,000
W1 0.5W2 0.5SD1 0.02909SD2 0.04573Correl. -0.273Port. Std Dev. 0.02351
AMOUNT 100,000 FACTOR 1.65
VaR 3,879$

Copyright ©1998 Ian H. Giddy Risk Analysis 25
Return and Risk, Generalized
Portfolio return:
where wi are the weights of each asset in the portfolio. (Expected return is simply the weighted sum of the individual asset returns.)
Portfolio variance:
When i = j, the term wiwj becomes wi2
E(R ) = w E(R )pi=1
n
i i
P2
i=1
n
j=1
n
i j ij i j = w w
ij i j i 2

Copyright ©1998 Ian H. Giddy Risk Analysis 26
Portfolio Value at Risk
Mean
Value-at-RiskValue-at-Risk
+
=
EXPOSURES AND HEDGESCURRENCY Po s itio n Hedg e
1 CAD 460 -1382 AUD - 305 91.53 DEM 425 -127.54 JPY - 220 665 GBP 735 -220.56 ZAR 295 -88.5
EXPOSURES AND HEDGESCURRENCY Po s itio n Hedg e
1 CAD 460 -1382 AUD - 305 91.53 DEM 425 -127.54 JPY - 220 665 GBP 735 -220.56 ZAR 295 -88.5

Copyright ©1998 Ian H. Giddy Risk Analysis 27
A Management-Friendly Report
An example is FourFifteen™, named after J.P. Morgan's market risk report produced at 4:15 p.m. each day.
The "4:15 Report," a single sheet of paper, summarizes the Daily Earnings at Risk for J.P. Morgan worldwide.
Portfolio Risk Simulation USD Base. Vols. & correls. as of May 04, 1995.
AUD BEF CAD DKK FFR DEM ITL JPY NLG ESB SEK CHF GBP XEU USD Total
1 Mo 15 22 37
3 Mo -200 20 -30 160 - 50
6 Mo 25 -5 20
12 Mo -105 - 105
2 Yr 0
3 Yr 0
4 Yr 0
5 Yr 0
7 Yr 0
9 Yr 0
10 Yr 0
15 Yr 0
20 Yr 0
30 Yr 0
Equity 0
Implied - 196.1 59 22 -29 54 -145
Spot 23 23
Net - 196.1 82 22 -29 -122
Int. 502 262 5 139 400 740
Eq.
Fx 5,048 4265 1383 1820 8516
divers. -200 -347 -6 -83 -451
Net 5,350 4181 1383 1876 400 8805
R
ISK
($00
0)
RiskMetricsª
G
ov'
t B
on
ds
Zer
o C
ash
flo
w
FX

Copyright ©1998 Ian H. Giddy Risk Analysis 28
Exposure Report: Example
Portfo lio Ris k S imulationUSD Base. Vols. & correls . as of May 04, 1995.
AUD BEF CAD DKK FFR DEM ITL JPY NLG ESB SEK CHF GBP XEU USD Total
1 Mo 15 22 37
3 Mo -200 20 -30 160 - 50
6 Mo 25 -5 20
12 Mo -105 - 105
2 Yr 0
3 Yr 0
4 Yr 0
5 Yr 0
7 Yr 0
9 Yr 0
10 Yr 0
15 Yr 0
20 Yr 0
30 Yr 0
Equity 0
Implied - 196.1 59 22 -29 54 -145
Spot 23 23Net - 196.1 82 22 -29 -122
Int. 502 262 5 139 400 740
Eq.
Fx 5,048 4265 1383 1820 8516
divers . -200 -347 -6 -83 -451
Net 5,350 4181 1383 1876 400 8805
RIS
K ($
000)
RiskMetricsª
Gov
't B
onds
Zer
o C
ashf
low
FX
Copyright ©1998 Ian H. Giddy Risk Analysis 29
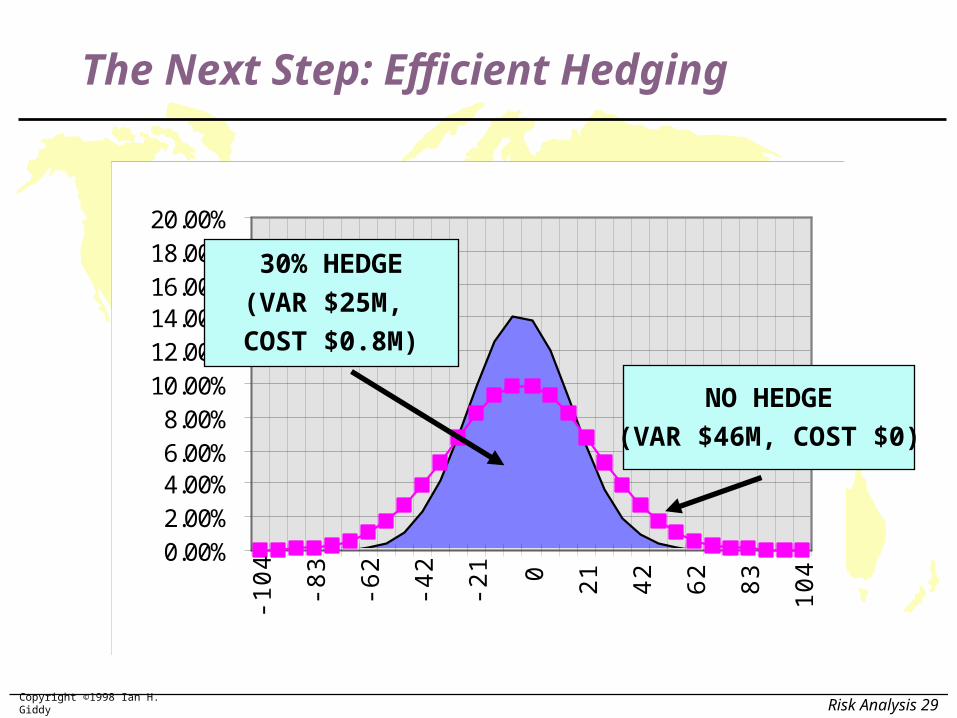
The Next Step: Efficient Hedging
0.00%2.00%4.00%6.00%8.00%
10.00%12.00%14.00%16.00%18.00%20.00%
-104 -83
-62
-42
-21 0 21 42 62 83 104
30% HEDGE
(VAR $25M,
COST $0.8M)
NO HEDGE
(VAR $46M, COST $0)

Copyright ©1998 Ian H. Giddy Risk Analysis 30
Efficient Hedging, Constrained
FX Hedging: Cost and Risk Computation (monthly data)EXPOSURES AND HEDGES POSITION RISKS CORRELATION MATRIXCURRENCY Pos ition Hedge WEIGHTCOST PREMIUM STD DEV VaR CAD AUD DEM JPY GBP ZAR
1 CAD 460 -138 0.01% 0.18% 0.99% 5.24 12 AUD - 305 91.5 0.00% 0.07% 2.52% 8.88 0.009 13 DEM 425 -127.5 0.01% 0.21% 2.84% 14 0.014 0.17 14 JPY - 220 66 -0.01% 0.43% 3.27% 8.32 -0.14 -0.01 0.499 15 GBP 735 -220.5 -0.01% -0.12% 2.56% 21.7 0.319 0.17 0.358 0.131 16 ZAR 295 -88.5 -0.02% -0.78% 1.21% 4.13 0.146 -0.06 0.552 0.186 0.414 1
TOTAL 2440 732 62.3Hedge% 30%Currency Portfo lio "return" -0.02% ($0.8) Portfo lio Std Deviation 0.61%
nhVAR (95%)= 25 46
HEDGE COST= ($0.8) $0
0.00%2.00%4.00%
6.00%8.00%
10.00%12.00%14.00%
16.00%18.00%20.00%
-104 -83
-62
-42
-21 0 21 42 62 83 104
NO HEDGE

Copyright ©1998 Ian H. Giddy Risk Analysis 31
Efficient Hedging, Constrained
FX Hedging: Cost and Risk Computation (monthly data)EXPOSURES AND HEDGES POSITION RISKS CORRELATION MATRIXCURRENCY Pos ition Hedge WEIGHTCOST PREMIUM STD DEV VaR CAD AUD DEM JPY GBP ZAR
1 CAD 460 -460 0.02% 0.18% 0.99% 0 12 AUD - 305 305 0.00% 0.07% 2.52% 0 0.009 13 DEM 425 -425 0.02% 0.21% 2.84% 0 0.014 0.17 14 JPY - 220 113.23 -0.01% 0.43% 3.27% 5.77 -0.14 -0.01 0.499 15 GBP 735 -735 -0.02% -0.12% 2.56% 0 0.319 0.17 0.358 0.131 16 ZAR 295 803.22 0.12% -0.78% 1.21% 22 0.146 -0.06 0.552 0.186 0.414 1
TOTAL 2440 2841.5 27.7Hedge% 75%Currency Portfo lio "return" 0.12% $6.4 Portfo lio Std Deviation 0.25%
nh optVAR (95%)= 10 46 10
HEDGE COST= $6.4 $0 $6.40
0.00%2.00%4.00%6.00%8.00%
10.00%12.00%14.00%16.00%18.00%20.00%
-104 -83
-62
-42
-21 0 21 42 62 83 104
NO HEDGE

Copyright ©1998 Ian H. Giddy Risk Analysis 32
FIRM'S INT'LBUSINESS
BOOKED &ANTICIPATED
TRANSACTIONS
REPORTINGSYSTEM
SCHEDULE OFFX FLOWS
PORTFOLIOANALYSIS OF
FX EXPOSURE
NETEXPOSURESIN FOREIGN
CURRENCIES
MEASUREMENTOF FX RISK BY
CURRENCY
RISKMANAGEMENT
DECISIONS
CORRELATIONDATA
VOLATILITYDATA
HEDGINGTRANSACTIONS
The VaR Management Cycle
This process can be undertaken on a monthly cycle basis, as the institution revises its estimates of future business and as new data on volatilities and correlations are acquired.

Copyright ©1998 Ian H. Giddy Risk Analysis 33
Value at Risk: Assessment
Value at Risk and RiskMetrics: A method for quantifying risk in dynamic,
uncertain environments Based on the observation that volatilities
and correlations are somewhat persistent The RiskMetrics estimates are in the
ballpark of other, more sophisticated, methods

Copyright ©1998 Ian H. Giddy Risk Analysis 34
Value at Risk: Assessment

Copyright ©1998 Ian H. Giddy Risk Analysis 35
Value at Risk: Assessment
Copyright ©1998 Ian H. Giddy Risk Analysis 36
Is VAR Valid?
Are we measuring the right thing for our purpose?
Since we are measuring deviations from expected, do we have a good approximation of the distribution of changes?
How good are our forecasts of volatilities and correlations?
How good are our exposure measures? How good are our valuation models?

Copyright ©1998 Ian H. Giddy Risk Analysis 37
Alternatives
Worst-case analysis Scenario analysis Historical simulation Monte-Carlo simulation Sensitivity measures

Copyright ©1998 Ian H. Giddy Risk Analysis 38
Mean
What Happens in the Tails?
For credit and capital purposes, we want to know about the probability, size and impact of extreme events.
Worst-Case Analysis:How skewed?How many?How large?Probability of extreme events?

Copyright ©1998 Ian H. Giddy Risk Analysis 39
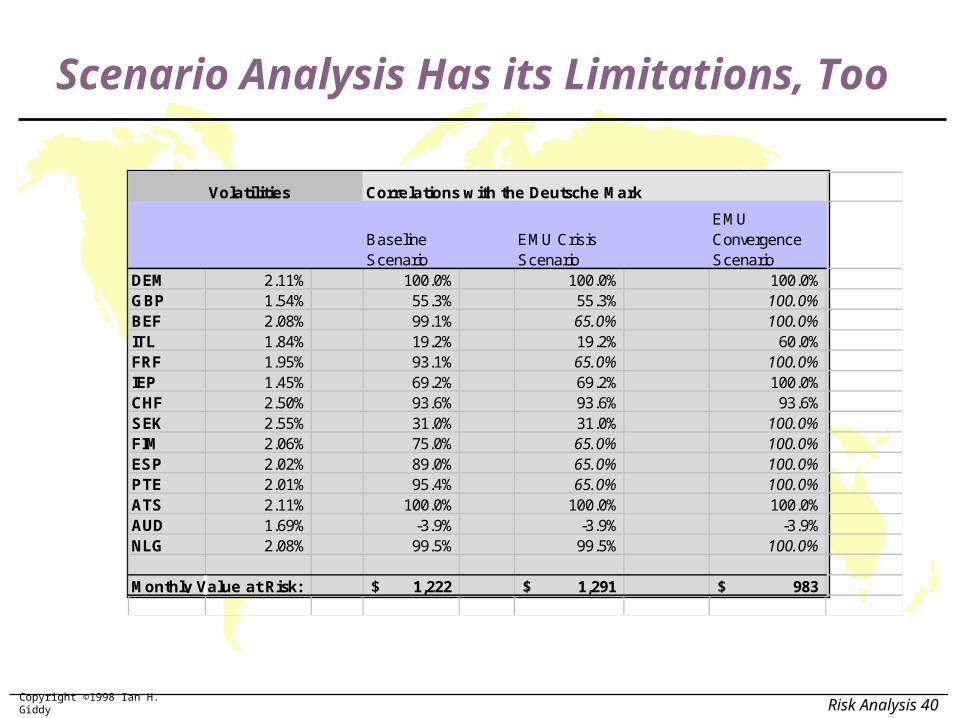
Baseline ScenarioThis scenario assumes that current predictions of volatilities and correlations are valid for Publicorp’sFX risk management horizon. As is shown in the table below, the monthly volatility -- defined asthe standard deviation of percentage changes in the dollar value of foreign currencies -- rangesfrom 1.69% for the Canadian dollar to 2.55%% for the Swedish Krona. The correlations betweenthe DM and the core European currencies are very high - for example, the French franc has a 98%correlation with the DM - while the other European currencies have a positive but lowercorrelation coefficient. In particular, the British pound’s correlation with the DM is 55%. Thetable shows that the Value-at-Risk (VaR) for Publicorp’s existing, unhedged positions is $1.222million.
EMS Crisis ScenarioUnder this scenario, we assume that the “inner core” European currencies, the mark, guilder andAustrian schilling, remain closely linked, but that the correlations between German mark and theBelgian franc, the French franc, Finnish markka, Spanish peseta and Portuguese escudo all fall to65%. The result of this is to increase the VaR to $1.291 million -- not a dramatic increase.
EMS Convergence ScenarioThe third scenario is one in which the correlations among all the major European Unioncurrencies rise to 100%. This could be regarded as the “single currency in Europe” scenario.Because of Publicorp’s offsetting long and short positions in these currencies, the result is a reductionin currency exposure: the monthly VaR drops to below $1 million.
EMU Scenario Analysis for Publicorp
Copyright ©1998 Ian H. Giddy Risk Analysis 40
Volatilities Correlations with the Deutsche Mark
Baseline Scenario
EMU Crisis Scenario
EMU Convergence Scenario
DEM 2.11% 100.0% 100.0% 100.0%GBP 1.54% 55.3% 55.3% 100.0%BEF 2.08% 99.1% 65.0% 100.0%ITL 1.84% 19.2% 19.2% 60.0%FRF 1.95% 93.1% 65.0% 100.0%IEP 1.45% 69.2% 69.2% 100.0%CHF 2.50% 93.6% 93.6% 93.6%SEK 2.55% 31.0% 31.0% 100.0%FIM 2.06% 75.0% 65.0% 100.0%ESP 2.02% 89.0% 65.0% 100.0%PTE 2.01% 95.4% 65.0% 100.0%ATS 2.11% 100.0% 100.0% 100.0%AUD 1.69% -3.9% -3.9% -3.9%NLG 2.08% 99.5% 99.5% 100.0%
Monthly Value at Risk: 1,222$ 1,291$ 983$
Scenario Analysis Has its Limitations, Too

Copyright ©1998 Ian H. Giddy Risk Analysis 41
The Alternative: Full-Valuation Methods
Prices, rates, and
estimated variances
and covariances
Monte Carlo
Simulation
Generate
Scenarios
Full
Valuation
Distribution of
Values
Distribution of
Values
Delta-Gamma
Valuation
Estimated value
changes
Estimated value
changes
MODELS

Copyright ©1998 Ian H. Giddy Risk Analysis 42
The Sharpe ratio.(actual return relative to actual risk)
The risk ratio.(actual return relative to prospective risk)
The efficiency ratio.(actual risk relative to prospective risk)
Use risk-return performance measures to evaluate individual trader performance.
Using a VaR Measure for Trading-Portfolio Performance Evaluation

Copyright ©1998 Ian H. Giddy Risk Analysis 46
Performance Evaluation: ExampleFARMCO: PERFORMANCE EVALUATIONOct. 1 1995
Predicted exposures Spot Forward
Expected Return Volatility Hedge
CAD -200758 1.3374 1.3405 1.0% 1.79 150000DEM 22365 1.4288 1.4165 2.5% 3.82 0JPY -15688 100.39 97.83 2.0% 3.71 10000Portfolio expected profit 1,180 Portfolio total VaR 9,337 Portfolio diversified VaR 5,210 Expected gain, relative to risk (VaR) 23%April 1 1996
Actual Exposures
Actual Spot
Actual Return
Actual Volatility Hedge
CAD -220400 1.3736 2.5% 2.1 150000DEM 24000 1.3901 1.9% 4.2 0JPY -11500 97.00 -0.8% 5.3 10000Portfolio actual profit 1,278 Portfolio total VaR 11,251 Portfolio diversified VaR 5,913 Actual gain, relative to actual risk (VaR) 22%
Adjusted gain, based on predicted exposures 788 Adjusted gain, relative to actual risk (VaR) 13.3%Adjusted gain, relative to ex-ante risk (VaR) 15.13%

Copyright ©1998 Ian H. Giddy Risk Analysis 47
Performance Measurement: Roadmap
FINANCIAL SIDE
OPERATIONAL SIDE
EXPOSURES Known Anticipated
Map exposures
Map risks
Manage risks
Measure performance Take actions to improve
performance
MARKET PRICES
MARKET VOL & CORR.
RISK MEASUREMENT VaR Worst-case scenario, etc.
RISK MANAGEMENT Hedging Investment or trading
PERFORMANCE MEASUREMENT Relative return Relative risk.
INCENTIVES ALLOCATION OF RESOURCES.

Copyright ©1998 Ian H. Giddy Risk Analysis 48
Performance evaluation: “the science of attribution”
Why did we make/lose money?The market; the FX manager; my
lousy instructions? How much should I tip this FX
manager? Would I use this method again? How good is my performance
measurement system?
Treasury Performance Measurement: Conclusion

Copyright ©1998 Ian H. Giddy Risk Analysis 49
Summary: Market Risk Management is a Process
Risk Management
DefineDefine MeasureMeasure ManageManage MonitorMonitor

Copyright ©1998 Ian H. Giddy Risk Analysis 55
Ian H. Giddy
Professor of Finance
Stern School of Business
New York University
44 West 4th Street, New York, NY 10012, USA
Tel 212-998-0332; Fax 212-995-4233
Email: [email protected]
World Wide Web: http://giddy.org