market report for november, 2017 - sbi japannext co., ltd. · sbi japannext is a nancial...
TRANSCRIPT

Market Report for November, 2017
Trading Summary
Total Monthly Value (JPY) 2,085,017,001,959 Total Monthly Volume 1,606,119,403
Average Daily Value (JPY) 104,250,850,097 Average Daily Volume 80,305,970
Average PI (bps) 4.49 Average Traded Symbols 2534
Average Daily Turnover Daily Turnover
Average Market Share Daily Market Share
Top Stocks by TurnoverStock Value (JPY) Share PI (bps)
1570 NIKKEILV 58,663,507,207 1.57% 1.20
6502 TOSHIBA 40,830,636,000 11.76% 9.37
6506 YASKAWA 29,514,714,750 5.62% 4.77
7974 NINTEND 22,877,317,000 0.84% 1.55
4689 YAHOO J 18,963,838,950 10.62% 5.98
Top Stocks by Market ShareStock Value (JPY) Share PI (bps)
9318 ASIADEVE 733,384,480 25.19% 321.53
8922 JAM 457,965,950 13.47% 20.98
3647 GTHREEHD 441,904,970 12.88% 14.47
8925 ARDEPRO 646,703,290 12.18% 28.11
5703 NLM HD 4,324,663,540 12.02% 9.33
Top Stocks by Price ImprovementStock Value (JPY) Share PI (bps)
9318 ASIADEVE 733,384,480 25.19% 321.53
8918 LAND 481,014,000 3.61% 319.56
3250 ADWORKS 410,577,530 0.69% 92.07
3528 PROSPECT 2,332,549,000 9.82% 49.40
2315 CAICA 1,101,595,180 9.62% 48.35
Top Stocks by SavingsStock Value (JPY) Share Savings
6502 TOSHIBA 40,830,636,000 11.76% 31,283,200
9318 ASIADEVE 733,384,480 25.19% 12,310,500
8918 LAND 481,014,000 3.61% 9,949,890
4689 YAHOO J 18,963,838,950 10.62% 8,219,130
6506 YASKAWA 29,514,714,750 5.62% 8,156,800
I Analysis is based on SBI Japannext and Thomson Reuters data. Large Cap = TPX100, Mid Cap = TPX500 excl. TPX100,Small Cap = All Names excl. TPX500.. All Japannext markets (J, X, U, and N) are included.
I Price Improvement (PI) and Savings (PI*volume) are calculated by comparing the execution price against the primarymarket’s best bid for each sell or best offer for each buy at the point of execution from the taker’s perspective. Reported PI isa value-weighted average. Names with monthly traded value less than 400,000,000 JPY are excluded from the rankings tables.
c©2017 SBI Japannext. All rights reserved. SBI Japannext is a financial instruments business operator registered to FSA and also a PTS operator authorizedby FSA under the Financial Instruments and Exchange Act in Japan. This material is provided for an informational purpose only. SBI Japannext has noresponsibilities or warranties and excludes all liability (including for negligence) in relation to its content to the extent allowed by applicable laws.
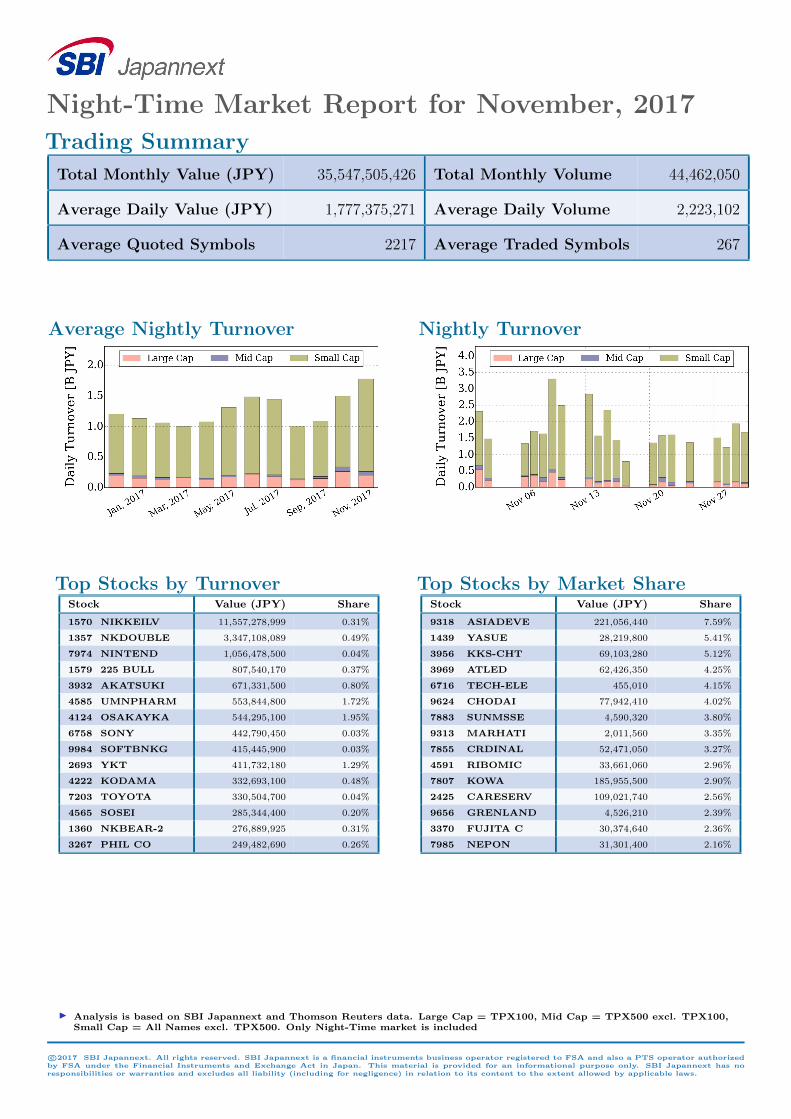
Night-Time Market Report for November, 2017
Trading Summary
Total Monthly Value (JPY) 35,547,505,426 Total Monthly Volume 44,462,050
Average Daily Value (JPY) 1,777,375,271 Average Daily Volume 2,223,102
Average Quoted Symbols 2217 Average Traded Symbols 267
Average Nightly Turnover p Nightly Turnover
Top Stocks by TurnoverStock Value (JPY) Share
1570 NIKKEILV 11,557,278,999 0.31%
1357 NKDOUBLE 3,347,108,089 0.49%
7974 NINTEND 1,056,478,500 0.04%
1579 225 BULL 807,540,170 0.37%
3932 AKATSUKI 671,331,500 0.80%
4585 UMNPHARM 553,844,800 1.72%
4124 OSAKAYKA 544,295,100 1.95%
6758 SONY 442,790,450 0.03%
9984 SOFTBNKG 415,445,900 0.03%
2693 YKT 411,732,180 1.29%
4222 KODAMA 332,693,100 0.48%
7203 TOYOTA 330,504,700 0.04%
4565 SOSEI 285,344,400 0.20%
1360 NKBEAR-2 276,889,925 0.31%
3267 PHIL CO 249,482,690 0.26%
Top Stocks by Market ShareStock Value (JPY) Share
9318 ASIADEVE 221,056,440 7.59%
1439 YASUE 28,219,800 5.41%
3956 KKS-CHT 69,103,280 5.12%
3969 ATLED 62,426,350 4.25%
6716 TECH-ELE 455,010 4.15%
9624 CHODAI 77,942,410 4.02%
7883 SUNMSSE 4,590,320 3.80%
9313 MARHATI 2,011,560 3.35%
7855 CRDINAL 52,471,050 3.27%
4591 RIBOMIC 33,661,060 2.96%
7807 KOWA 185,955,500 2.90%
2425 CARESERV 109,021,740 2.56%
9656 GRENLAND 4,526,210 2.39%
3370 FUJITA C 30,374,640 2.36%
7985 NEPON 31,301,400 2.16%
I Analysis is based on SBI Japannext and Thomson Reuters data. Large Cap = TPX100, Mid Cap = TPX500 excl. TPX100,Small Cap = All Names excl. TPX500. Only Night-Time market is included
c©2017 SBI Japannext. All rights reserved. SBI Japannext is a financial instruments business operator registered to FSA and also a PTS operator authorizedby FSA under the Financial Instruments and Exchange Act in Japan. This material is provided for an informational purpose only. SBI Japannext has noresponsibilities or warranties and excludes all liability (including for negligence) in relation to its content to the extent allowed by applicable laws.