market report european offices -...
TRANSCRIPT

Savills World Research European Commercial
Market reportEuropean Offices May 2018
savills.com/research 01
■ Prime CBD rents are on average 4% higher year-on-year and 2% above the 2007-2010 rental peak. Rental growth is slowing as fewer markets are seeing double digit growth compared to previous years.
■ Lack of affordable good quality space has pushed tenants into non-CBD locations where rents are rising fast. Non-CBD rents are on average 70% lower than the CBD and rents have risen 5.6% yoy and are 8% above the five-year average.
■ The average vacancy rate across our survey area fell 82 bps year-on-year to 6.4%. Few markets have a vacancy rate above 10.0% and just under one third of the markets are seeing the vacancy rate fall below 5.0%. Supply will continue to remain tight until 2020 at the earliest.
■ The total take-up across our survey area in Q1 2018 reached 2.6m sq m; slightly below the same period last year. Despite business expansion, take-up volumes were restrained as a result of limited options for occupiers.
SUMMARYBusiness expansion has been restrained by lack of supply
Graph source: Oxford Economics/Savills
Graph source: Savills
GRAPH 1
EU28 GDP growth Office rental growth ahead of GDP growth
GRAPH 2
Vacancy rate Q1 18 Below five-year average across all markets
“The volume of deliveries is not enough to meet current demand so tenants are
looking at another two years of supply shortage.” Alice Marwick, Savills European Research
0%
3%
6%
9%
12%
15%
18%
Berli
nPa
ris C
BDSt
ockh
olm
Mun
ich
Lond
on W
EC
olog
neZu
rich
Ham
burg
Vien
naPa
ris L
DC
open
hage
nLo
ndon
City
Prag
ueO
slo
Amst
erda
mD
usse
ldor
fFr
ankf
urt
Lisb
onBr
usse
lsD
ublin
Mad
ridM
ilan
War
saw
Q1 18 Q1 17 5y average
-10%
-8%
-6%
-4%
-2%
0%
2%
4%
6%
2008
2009
2010
2011
2012
2013
2014
2015
2016
2017
2018
EU28 GDP growth Prime CBD rental growth

May 2018
savills.com/research 02
Market report | European offices
EU growth remains stableThe Eurozone economy decelerated in Q1 2018 from 0.7% in Q4 2017 to 0.4%, caused in part by temporary factors such as industrial action and cold weather. Nevertheless, EU growth is set to remain stable overall thanks to the falling unemployment rate which at 8.7% is the lowest since 2009. In April, consumer confidence unexpectedly rose from 0.1 in March to 0.4 in April according to Reuters and business activity continued to rise into Q2 2018, albeit modestly compared to the start of the year.
The Economic Sentiment Indicator (ESI) remained unchanged in the euro area (at 112.7 points) and is stable across the EU (-0.3 points to 112.3).
On the political agenda, Italy was without a government two months after the general election failed to produce an overall majority for any party and it remains to be seen when and how it will overcome this political deadlock. Ongoing industrial action in France has been causing disruption for the transport industry. Reforms by Emmanuel Macron foresee months of continued disorder as his party dispute with rail workers, civil servants, Air France staff and utility workers, however spurred on from his successful labour reforms in 2017, Macron has no plans to back down.
Strong demand - but where is the space?The continued fall in unemployment across the EU led to strong office demand across our survey area in the first quarter of the year. In Q1 2018, the total take-up in our survey area reached 2.8m sq m which is 2% above the same period in 2017 and 2% above the five-year quarterly average. However, strong polarisation remains between markets with Manchester, Vienna and Paris CBD experiencing exceptionally strong annual take-up increases of 110%, 69% and 49% respectively. These markets are also seeing the quarterly take-up exceed the five-year average. On the other end of the spectrum, Amsterdam, Brussels and Paris La Defense saw annual take-up levels fall 74%, 19% and 23% respectively, these markets also saw the Q1 take-up fall well below the annual and five-year average.
Across our survey area, the increase in demand from business expansion has been restrained by lack of supply. This has been a recurring theme since 2016 and does not show any signs of waning in the upcoming months and years. The volume of deliveries is not expected to meet demand until 2020 at the earliest so tenants are due for another two years of landlords holding the upper hand, tight supply and limited incentives.
Discrepancies between markets remain unchanged with the core markets seeing the average vacancy rate fall below 5%, and more markets seeing the vacancy rate falling to all time lows of 3% or lower such Berlin (1.9%), Paris CBD (2.3%), Stockholm (2.9%) and Munich (3.0%). The greatest year-on-year decreases in available space were noted in Paris La Defense (-294bps) and Amsterdam (-240bps) due to a pick-up in leasing activity across these markets last year. Until late 2015, Paris La Defense and Amsterdam were experiencing vacancy rates of above 10%. In Q1 2018, the Paris La Defense vacancy rate is already 104bps below the European average and the Amsterdam vacancy rate is only 34bps above the European average.
However, it is not all bad news for occupiers. In the ever-changing office environment, tenants are adapting and we are seeing an increase in the rise of the footloose occupier. Limited supply and rising rents have resulted in occupiers becoming more flexible in their demands; tenants are more willing to move from their preferred location within the core for a better building and cheaper rent in secondary locations.
Co-working spaces becoming the new norm In the core markets, mainly in London City and London West End, limited supply has led to a substantial increase in the number of pre-lets, particularly among the Tech and Serviced Offices sectors.
The evolution of the Tech industry has been changing in recent years and start-ups that were seen as risky are now stable companies looking for quality space in prime locations and are turning to serviced office providers for short term space. While serviced office providers didn’t make as much of an impact to Q1 take-up volumes as previously anticipated, we expect the number of pre-lets to serviced offices will drive the market throughout the rest of the year. In London for example, WeWork is not only the largest occupier
GRAPH 4
CBD rental growth Rising rents pushing tenants out of the CBD
Graph source: Savills
“Tenants are becoming more flexible in their demands in order to remain in their preferred location.” Alice Marwick, Savills European Research
-3%
-2%
-1%
0%
1%
2%
3%
4%
5%
6%
2011
2012
2013
2014
2015
2016
2017
2018
CBD Non-CBD

May 2018
savills.com/research 03
Market report | European offices
but is also the largest landlord with 35 offices in total. WeWork has expanded rapidly in recent years with over 75 offices across Europe. Outside of London, Berlin and Paris have seen the greatest expansion of WeWork with seven and six offices respectively which will offer short-term solutions to the chronic shortage of available space in prime locations.
Rental growth continues upwards Across our survey area, prime CBD rents are on average 4% higher year-on-year and 2% above the 2007-2010 rental peak. Fewer markets have seen double digit rental growth compared to previous years, yet the peripheral markets who have been behind in the rental cycle have been experiencing the strong rental growth which is likely to continue in the upcoming months. Lack of good quality stock remains a problem in the periphery and we will likely see rental growth surge across these markets as tenants compete for the limited quality assets available. Only Paris La Defense (-3%), London WE (-19%) and Zurich (-7%) have seen yoy falls in prime CBD rents.
Regarding the CBD, the only cities where rents are still significantly cheaper (more than 20%) than the previous peak are Athens (23%), Barcelona (29%), Madrid (29%) and Warsaw (43%). Elsewhere, cities which have significantly surpassed their previous rental peak are Stockholm (+44%), Berlin (+32%) and Oslo (+20%).
Non-CBD rents seeing faster rental increases than other locations. The rise in prime CBD rents and limited space
available has pushed tenants out to non-CBD locations where rents are on average 70% lower. However, non-CBD locations are seeing rents rising at a faster pace; non-CBD rents have risen 5.6% yoy and are 8% above the five-year average.
Who will be affected by the increase in rents?The increasing rents outside of the CBD will harm small to medium sized companies who will be unable to absorb the higher rents. Until rental corrections occur, we will continue to see a spike in non-CBD rents and these types of tenants are being pushed into secondary locations.
Few deliveries have come onto the market and tenants are being forced to wait, or move into sub standard, older office buildings which is becoming less attractive to tenants. Furthermore, older offices will soon need to comply with government regulations regarding energy; in Amsterdam for example, regulations require that as of 2023, office buildings will need to have at least an energy label of C. Therefore, older office buildings are becoming less favourable unless they are refurbished. ■
OUTLOOKMore tenants are turning to serviced office providers for prime space■ Political risks come from ongoing Brexit negotiations which continue to dominate news headlines. Until there is more clarity regarding how the UK will exit the EU, it is difficult to accurately predict how businesses and the property market will react. The results of the Italian election show that the rise of populism and anti-establishment parties is far from over.
■ Rents will continue to rise faster in non-CBD locations as tenants, despite willing to pay over and above for their preferred space, will be unable to find suitable office property in the CBD. Serviced office providers will continue to cushion the blow of lack of space and provide short term solutions for clients in need of prime space in central locations.
■ Savills expects office demand will continue to grow due to falling unemployment and continued business expansion yet this will be challenging due to the limited office supply. We expect take-up to be roughly in line with last year’s level.
■ According to our forecasts, the average vacancy rate will fall between 30-40bps next quarter. The average vacancy rate across our survey area will likely fall below 6.2% led by the continued squeeze in the German markets, Sweden and the Netherlands.
Graph source: Savills
GRAPH 6
-100%
-50%
0%
50%
100%
150%
Amst
erda
mH
ambu
rgD
usse
ldor
fPa
ris L
DO
slo
Brus
sels
Prag
ueM
unic
hLo
ndon
City
Lisb
onC
olog
neLo
ndon
WE
Mad
ridFr
ankf
urt
Paris
IDF
Berli
nBa
rcel
ona
Dub
linPa
ris C
BDVi
enna
Man
ches
ter
grow
th
Q1 17 - Q1 18 Q4 17 - Q1 18Take-up Q1 18 Take-up restrained by lack of space
0%
10%
20%
30%
40%
50%
60%
Amst
erda
mFr
ankf
urt
Ham
burg
Osl
oBe
rlin
War
saw
Düs
seld
orf
Mad
ridC
olog
neM
unic
hBr
usse
lsPr
ague
Paris
(ID
F)M
ilan
Lond
on W
ELo
ndon
City
Dub
lin
2018 pipeline vs. 2017 take-up Supply will remain tight
GRAPH 7
Graph source: Savills
May 2018
savills.com/research 04
Market report | European offices
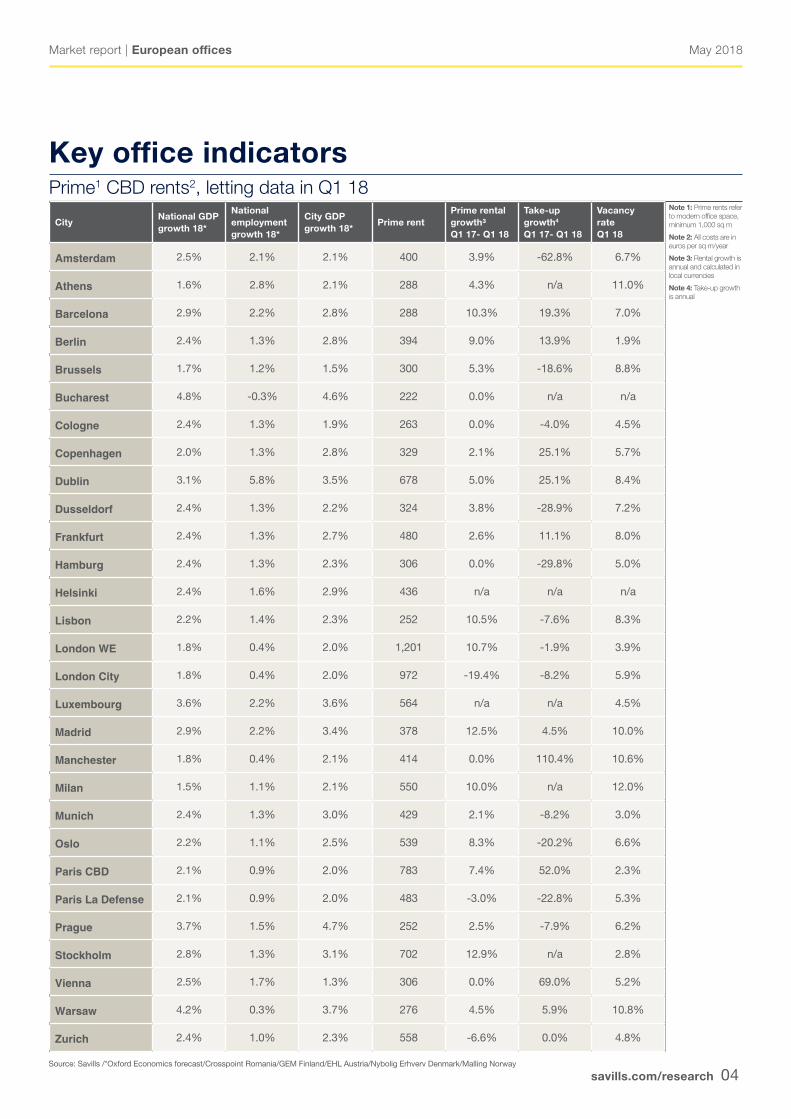
Key office indicatorsPrime1 CBD rents2, letting data in Q1 18
Note 1: Prime rents refer to modern office space, minimum 1,000 sq m
Note 2: All costs are in euros per sq m/year
Note 3: Rental growth is annual and calculated in local currencies
Note 4: Take-up growth is annual
CityNational GDP growth 18*
National employment growth 18*
City GDP growth 18*
Prime rentPrime rental growth³Q1 17- Q1 18
Take-up growth4 Q1 17- Q1 18
Vacancyrate Q1 18
Amsterdam 2.5% 2.1% 2.1% 400 3.9% -62.8% 6.7%
Athens 1.6% 2.8% 2.1% 288 4.3% n/a 11.0%
Barcelona 2.9% 2.2% 2.8% 288 10.3% 19.3% 7.0%
Berlin 2.4% 1.3% 2.8% 394 9.0% 13.9% 1.9%
Brussels 1.7% 1.2% 1.5% 300 5.3% -18.6% 8.8%
Bucharest 4.8% -0.3% 4.6% 222 0.0% n/a n/a
Cologne 2.4% 1.3% 1.9% 263 0.0% -4.0% 4.5%
Copenhagen 2.0% 1.3% 2.8% 329 2.1% 25.1% 5.7%
Dublin 3.1% 5.8% 3.5% 678 5.0% 25.1% 8.4%
Dusseldorf 2.4% 1.3% 2.2% 324 3.8% -28.9% 7.2%
Frankfurt 2.4% 1.3% 2.7% 480 2.6% 11.1% 8.0%
Hamburg 2.4% 1.3% 2.3% 306 0.0% -29.8% 5.0%
Helsinki 2.4% 1.6% 2.9% 436 n/a n/a n/a
Lisbon 2.2% 1.4% 2.3% 252 10.5% -7.6% 8.3%
London WE 1.8% 0.4% 2.0% 1,201 10.7% -1.9% 3.9%
London City 1.8% 0.4% 2.0% 972 -19.4% -8.2% 5.9%
Luxembourg 3.6% 2.2% 3.6% 564 n/a n/a 4.5%
Madrid 2.9% 2.2% 3.4% 378 12.5% 4.5% 10.0%
Manchester 1.8% 0.4% 2.1% 414 0.0% 110.4% 10.6%
Milan 1.5% 1.1% 2.1% 550 10.0% n/a 12.0%
Munich 2.4% 1.3% 3.0% 429 2.1% -8.2% 3.0%
Oslo 2.2% 1.1% 2.5% 539 8.3% -20.2% 6.6%
Paris CBD 2.1% 0.9% 2.0% 783 7.4% 52.0% 2.3%
Paris La Defense 2.1% 0.9% 2.0% 483 -3.0% -22.8% 5.3%
Prague 3.7% 1.5% 4.7% 252 2.5% -7.9% 6.2%
Stockholm 2.8% 1.3% 3.1% 702 12.9% n/a 2.8%
Vienna 2.5% 1.7% 1.3% 306 0.0% 69.0% 5.2%
Warsaw 4.2% 0.3% 3.7% 276 4.5% 5.9% 10.8%
Zurich 2.4% 1.0% 2.3% 558 -6.6% 0.0% 4.8%
Source: Savills /*Oxford Economics forecast/Crosspoint Romania/GEM Finland/EHL Austria/Nybolig Erhverv Denmark/Malling Norway

May 2018
savills.com/research 05
Market report | European offices
Savills European Research Team Please contact us for further information
Savills plcSavills is a leading global real estate service provider listed on the London Stock Exchange. The company established in 1855, has a rich heritage with unrivalled growth. It is a company that leads rather than follows, and now has over 600 offices and associates throughout the Americas, Europe, Asia Pacific, Africa and the Middle East.
This report is for general informative purposes only. It may not be published, reproduced or quoted in part or in whole, nor may it be used as a basis for any contract, prospectus, agreement or other document without prior consent. Whilst every effort has been made to ensure its accuracy, Savills accepts no liability whatsoever for any direct or consequential loss arising from its use. The content is strictly copyright and reproduction of the whole or part of it in any form is prohibited without written permission from Savills Research.
Eri MitsostergiouEuropean Research+40 (0) 728 205 626 [email protected]
Lydia BrissyEuropean Research +33 (0) 1 44 51 73 [email protected]
Alice MarwickEuropean Research+44 (0) 20 7016 3833 [email protected]
Savills Local Research Teams
Mat OakleyResearch EMEA & UK+44 (20) 7409 [email protected]
Matthias PinkGermany+49 (30) 726 165 [email protected]
Cyril RobertFrance+33 (0) 1 44 51 17 [email protected]
Gema de la FuenteSpain+34 (91) 310 [email protected]
Peter WimanSweden+46 (8) 545 85 [email protected]
Jordy Kleemans Netherlands+31 (0) 20 301 [email protected]
Maddalena PanuItaly+39 02 632814214 [email protected]
Wioleta WojtczakPoland+48 (22) 222 40 [email protected]
Associate Offices
Thomas SchandaEHL Immobilien GmbH+43 (0)1 512 7690 705 [email protected]
Henry ColleBelgium+32 2 542 40 [email protected]
John McCartneyIreland+353 1 618 [email protected]
Seppo KoponenGEM Property Oy+30 (0) 210 [email protected]
Stefanos GiannoulakisResearch Greece+30 210 [email protected]
Stig KjeldsenNybolig Erhverv+45 33 64 64 64 [email protected]
Haakon Ødegaard Malling & Co +47 24 02 80 00 [email protected]
Johannes FräulinH&B Real Estate +41 44 250 52 52 [email protected]
Jakub GajdošCzech Republic+420 220 413 [email protected]
Cosmin GrecuCrosspoint +40 21 232 45 40 [email protected]
Teresa CachadaPortugal+351 21 313 [email protected]
Sophie LeblonLuxembourg+352 20 60 65 [email protected]