market report - colliers international · colliers international | retail market report fall/winter...
TRANSCRIPT

MARKET REPORTNORTHERN CALIFORNIA | FALL/WINTER 2018

RETAIL MARKET REPORTCOLLIERS INTERNATIONAL
NORTHERN CALIFORNIAFALL/WINTER 2018

Northern California Overview 5
San Francisco Market 6
Peninsula Market 8
South Bay Market 10
East Bay Market 12
North Bay Market 14
Sacramento Market 16
Statistical Market Summary 18
Regional Office List 20
Table of Contents

COLLIERS INTERNATIONAL | RETAIL MARKET REPORT FALL/WINTER 20184

COLLIERS INTERNATIONAL | RETAIL MARKET REPORT FALL/WINTER 2018 5
NORTHERN CALIFORNIA
Nationally, consumer confidence remains at historically elevated levels, and it is no mystery why: unemployment is down, jobs are plentiful, wages and income are rising, and reduced income taxes are augmenting consumers’ purchasing power. This combination of factors translates to strong retail sales overall and expectations for strong gains in holiday sales this year. But perhaps the bigger – and somewhat surprising – news for retailers nationally: the pickup in both in-store and online sales. With the economic outlook looking to soften in 2019, retailers will want to capitalize on current consumer strength and continue innovating to bring shoppers back through the doors.
Nationwide one challenge that both landlords and retailers have been facing is the continued rise in construction costs. A shortage of skilled labor combined with rising material costs has driven construction costs up since shortly after the end of the recession. The Turner Building Cost Index, which tracks nonresidential construction costs in the U.S., reflects a 5.63 percent yearly increase in costs from the second quarter 2017.
While the Northern California region experienced total availability increasing by 19 basis points to 7.69 percent during the third quarter, vacancy fell and translated into nearly 322,000 square feet of positive net absorption. The South Bay accounted for over 66 percent of this positive net absorption posting more than 213,000 square feet of positive net absorption. The Sacramento region carried the most available retail space, with nearly 5.6 million square feet. Meanwhile, overall asking rents slightly softened during the third quarter to $22.89 per square foot. Northern California has shown very limited new construction underway, currently reporting 982,443 square feet of product under construction, with 79 percent in the South Bay and East Bay regions.
Retail Overview
Historical Availability vs. Asking Rate
Availability by Submarket
Asking Rents
“Although we have seen slight growth in retail
spend, 2019 may see another small increase and
may flatten out towards the end of the year based
on macroeconomics. However, an area of continued
growth will be in the food, fitness/wellness, and
entertainment space.”
-Anjee Solanki, National Director Retail Services, USA
Vacancy
Construction
Availability by Submarket
San FranciscoPeninsulaSouth BayEast BayNorth BaySacramento
Historical Availability Historical Asking Rate
Net Absorption

COLLIERS INTERNATIONAL | RETAIL MARKET REPORT FALL/WINTER 20186
SAN
FRAN
CISC
O
SAN FRANCISCO
FUNDAMENTALS SOUND. The overall vacancy rate inched up during the third quarter of the year and translated into negative net absorption of nearly 31,000 square feet. Overall availability grew by 30 basis points to 9.65 percent. Additionally, San Francisco and especially Union Square has seen an increase in requests for holiday space. Johnny Was has already claimed a spot at 222 Grant Avenue, and temporary tenant Sennheiser has extended their lease at 278 Post Street.
CLICK AND COLLECT. The share of consumers who regularly use in-store pickup for their online orders has nearly doubled over the past five years.. This trend started about ten years ago with various retailers, but the share of consumers who say they regularly use click and collect for their online orders has nearly doubled over the past five years. A contributing factor could be that many retailers offer discounts to encourage in-store pickup instead of delivery.
POP UPS. Short term pop-up stores remain popular not only in Union Square, but across the San Francisco market. Online brands continue to leverage pop-up stores as this allows them to test out a brick-and-mortar presence without risking a long-term lease. A recent example is Parachute Home opening a pop-up in Hayes Valley at 445 Hayes Street.
STOCKTON STREET. The excavation and construction for the Central Subway has seriously undermined retail activity throughout Union Square over the past several years. Adjacent retailers attribute lower sales to the dust and noise. Customers would rather shop online or in the neighborhoods than navigate a construction zone. The good news is that the construction on the first block of Stockton Street is almost complete and the street will be back to normal by February 2019.
MORE TO COME. Cosmetics, boutique fitness, accessories, and specialized wellness tenants continue to be very active in the market. Watch for more strong interest from food tenants in the Financial District. While the market was in a state of flux for the majority of 2017 and first half of 2018, we have seen an uptick in touring activity since the end of summer. Several online retailers, including Rent the Runway, Morphe, and The RealReal, are seeking traditional brick-and-mortar stores, while companies with historically smaller stores are now seeking flagships, such as Tory Burch and Kiehl’s. Tenants remain cautious but have used the last few years to re-evaluate their business models and re-focus their store strategies.
Tenant: Zara Address: 250 Post Street Size: 26,323 SFLease: Renewal
Tenant: Zadig & Voltaire Address: 49 Geary Street Size: 2,026 SFLease: Direct
Tenant: Theory Address: 55 Geary Street Size: 4,529 SFLease: Direct
Tenant: Anne Fontaine Address: 118 Grant Avenue Size: 1,190 SFLease: Direct
Tenant: Parachute Home Address: 445 Hayes Street Size: 1,000 SFLease: Direct
Tenant: Amazon 300 California Street Size: 2,300 SFLease: Direct
Leasing Activity Remains Steady
Recent Transactions
Asking Rate
Vacancy
Q2-Q3 2018 Indicators
Net Absorption
Construction

COLLIERS INTERNATIONAL | RETAIL MARKET REPORT FALL/WINTER 2018 7
SAN FRANCISCO
Historical Availability vs. Asking Rate
Shopping Center TypeTotal
Inventory
Available SF
Direct
Available SF
Sublease
Available SF
Total
Total Availability
(%)Gross
AbsorptionNet
Absorption
Total Under Const.
Asking Rates
($NNN/Year)
San Francisco
Strip Mall 8,600 1,164 0 1,164 13.53% 0 0 0 $0.00
Neighborhood & Community 0 0 0 0 0 0 0 0 $0.00
Power & Regional 0 0 0 0 0 0 0 0 $0.00
Other 5,922,591 541,649 29,321 570,970 9.64% 22,210 (30,616) 0 $43.26
San Francisco Total 5,931,191 542,813 29,321 572,134 9.65% 22,210 (30,616) 0 $43.26
Historical Availability
San Francisco 2016 3Q 2016 4Q 2017 1Q 2017 2Q 2017 3Q 2017 4Q 2018 1Q 2018 2Q 2018 3Q
Union Square 14.24% 14.11% 6.12% 6.33% 6.66% 14.48% 14.10% 6.70% 6.37%
Mid Market 81.33% 79.11% 77.41% 45.58% 42.05% 41.45% 41.45 41.97% 44.46%
SOMA 4.76% 4.34% 4.90% 4.91% 4.92% 4.62%% 3.76% 4.07% 4.64%
San Francisco Total 14.84% 14.47% 10.14% 9.84% 9.66% 13.64% 13.12% 9.35% 9.65%
Historical Asking Rate
San Francisco 2016 3Q 2016 4Q 2017 1Q 2017 2Q 2017 3Q 2017 4Q 2018 1Q 2018 2Q 2018 3Q
Union Square $58.35 $59.64 $59.21 $56.31 $56.26 $46.39 $45.40 $48.52 $48.52
Mid Market $39.90 $29.22 $27.87 $27.87 $29.88 $28.98 $32.83 $37.05 $39.81
SOMA $44.96 $42.09 $40.08 $38.15 $38.48 $39.86 $39.56 $40.14 $42.03
San Francisco Total $50.34 $47.50 $40.62 $40.99 $41.43 $40.15 $40.55 $40.80 $43.26
Availability by Submarket
Historical Market Statistics - San Francisco
Union SquareMid MarketSOMA
Historical Availability Historical Asking Rate
COLLIERS INTERNATIONAL | RETAIL MARKET REPORT FALL/WINTER 20188
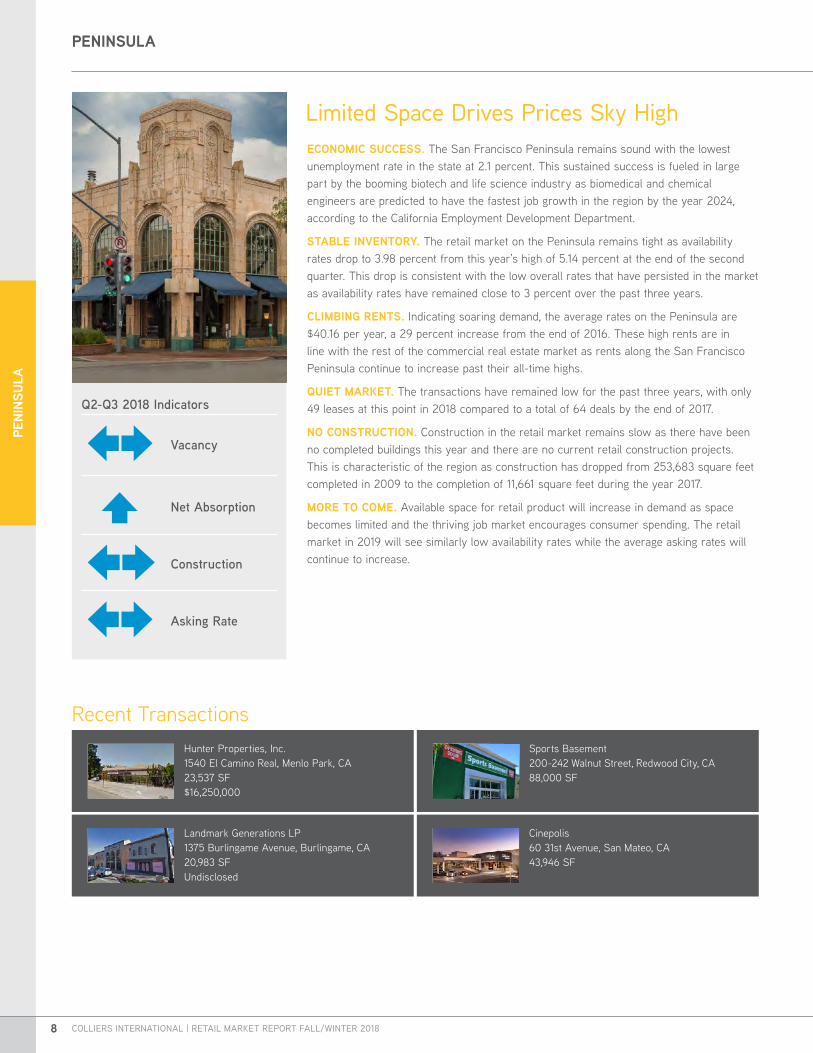
PENINSULAPE
NINS
ULA
ECONOMIC SUCCESS. The San Francisco Peninsula remains sound with the lowest unemployment rate in the state at 2.1 percent. This sustained success is fueled in large part by the booming biotech and life science industry as biomedical and chemical engineers are predicted to have the fastest job growth in the region by the year 2024, according to the California Employment Development Department.
STABLE INVENTORY. The retail market on the Peninsula remains tight as availability rates drop to 3.98 percent from this year’s high of 5.14 percent at the end of the second quarter. This drop is consistent with the low overall rates that have persisted in the market as availability rates have remained close to 3 percent over the past three years.
CLIMBING RENTS. Indicating soaring demand, the average rates on the Peninsula are $40.16 per year, a 29 percent increase from the end of 2016. These high rents are in line with the rest of the commercial real estate market as rents along the San Francisco Peninsula continue to increase past their all-time highs.
QUIET MARKET. The transactions have remained low for the past three years, with only 49 leases at this point in 2018 compared to a total of 64 deals by the end of 2017.
NO CONSTRUCTION. Construction in the retail market remains slow as there have been no completed buildings this year and there are no current retail construction projects. This is characteristic of the region as construction has dropped from 253,683 square feet completed in 2009 to the completion of 11,661 square feet during the year 2017.
MORE TO COME. Available space for retail product will increase in demand as space becomes limited and the thriving job market encourages consumer spending. The retail market in 2019 will see similarly low availability rates while the average asking rates will continue to increase.
Hunter Properties, Inc. 1540 El Camino Real, Menlo Park, CA23,537 SF$16,250,000
Landmark Generations LP1375 Burlingame Avenue, Burlingame, CA20,983 SF Undisclosed
Sports Basement200-242 Walnut Street, Redwood City, CA88,000 SF
Cinepolis60 31st Avenue, San Mateo, CA43,946 SF
Recent Transactions
Construction
Vacancy
Asking Rate
Net Absorption
Limited Space Drives Prices Sky High
Q2-Q3 2018 Indicators

COLLIERS INTERNATIONAL | RETAIL MARKET REPORT FALL/WINTER 2018 9
PENINSULA
Historical Availability vs. Asking Rate
Historical Market Statistics - Peninsula
Shopping Center TypeTotal
Inventory
Available SF
Direct
Available SF
Sublease
Available SF
Total
Total Availability
(%)Gross
AbsorptionNet
Absorption
Total Under Const.
Asking Rates
($NNN/Year)
Peninsula
Strip Mall 928,476 18,355 0 18,355 1.98% 500 (6,100) 0 $35.88
Neighborhood & Community 5,382,381 162,271 5,570 167,841 3.12% 39,222 1,469 0 $37.75
Power & Regional 2,810,633 177,531 0 177,531 6.32% 34,271 (14,441) 0 $54.00
Other 0 0 0 0 0.00% 0 0 0 $0.00
Peninsula Total 9,121,490 358,157 5,570 363,727 3.99% 73,993 (19,072) 0 $37.55
Historical Availability
Peninsula 2016 3Q 2016 4Q 2017 1Q 2017 2Q 2017 3Q 2017 4Q 2018 1Q 2018 2Q 2018 3Q
North Peninsula 2.50% 2.95% 5.55% 3.35% 3.13% 4.79% 7.05% 7.65% 6.74%
Mid Peninsula 2.80% 2.50% 2.50% 1.38% 3.56% 3.46% 3.80% 3.08% 3.11%
South Peninsula 6.30% 6.43% 1.82% 2.05% 1.15% 1.10% 1.72% 4.70% 1.28%
Peninsula Total 3.80% 3.90% 3.51% 2.38% 2.64% 3.26% 4.45% 5.41% 3.99%
Historical Asking Rate
Peninsula 2016 3Q 2016 4Q 2017 1Q 2017 2Q 2017 3Q 2017 4Q 2018 1Q 2018 2Q 2018 3Q
North Peninsula $34.16 $33.78 $31.45 $31.37 $32.89 $31.43 $34.51 $34.50 $35.31
Mid Peninsula $32.99 $29.30 $40.03 $40.20 $40.60 $37.02 $45.35 $51.32 $49.47
South Peninsula $27.76 $31.32 $30.16 $31.35 $29.11 $30.18 $36.66 $33.66 $33.99
Peninsula Total $33.40 $31.13 $32.55 $33.23 $33.82 $32.84 $38.66 $37.81 $37.55
Availability by Submarket
Historical Availability Historical Asking Rate

COLLIERS INTERNATIONAL | RETAIL MARKET REPORT FALL/WINTER 201810
SOUTH BAYSO
UTH
BAY
ECONOMICALLY SOUND. According to the State of California Employment Development Department, the unemployment rate in Santa Clara County stands at a vibrant 2.6 percent, 70 basis points below the national average of 3.7 percent. Due to the South Bay’s abundant tech population, it boasts one of the nation’s highest median household salary levels, measuring $122,600, translating to high disposable income for retail spending.
AVAILABILITY. The South Bay’s retail availability rate measured 5.95 percent in the third quarter of 2018, unchanged from the previous quarter. Not surprisingly, San Jose being the largest submarket in the South Bay, has the most available space measuring 890,000 square feet.
ESCALATING RENTS. Average rents in the South Bay are $33.36, reflecting a 10 percent increase from the previous quarter. The most in-demand submarkets are Mountain View and Palo Alto. The submarkets boast annual asking rents averaging $45.48 NNN, the third highest in the Bay Area, behind San Francisco’s Union Square and Mid Market.
CONSTRUCTION. There are currently two significant retail projects under construction in the South Bay; the 415,000 square foot Valley Fair Mall expansion in San Jose and the 275,000 square foot lifestyle center at 225 S Taaffe Street in Sunnyvale. Given the surging population and densification in the region, walkability and convenience will be major drivers for future retail developments.
MORE TO COME. The shift toward enjoying experiences more than purchasing items will continue to move retail stores toward selling experiences rather than selling goods. Retailers will need to be creative in reinventing the shopping experience to remain competitive in the post-Amazon world of convenience and scale. While online shopping continues to grow, brick-and-mortar locations will be an important retail component to any omni-channel strategy. In the short-term, there may be a rise in vacancy due to recent Chapter 11 filings from large retailers such as Orchard Supply Hardware, Toys-R-Us, and David’s Bridal, all of whom have a strong South Bay presence.
Volume Remains Stable
Argonaut InvestmentsAlmarida Place, Campbell, CA149,517 SF$20,200,000
Imperial Hornet Developers 4800 El Camino Real, Los Altos, CA54,125 SF$55,000,000
Office Depot 1761 E Bayshore Road, East Palo Alto, CA30,978 SFRenewal
The Market2170 W Bayshore Road, Palo Alto, CA17,233 SFSublease
Recent Transactions
“Given the surging population
growth in the region and
densification, walkability and
convenience will be major
drivers for future retail
developments.”
- Lena TutkoResearch Manager, Silicon Valley
Construction
Net Absorption
Vacancy
Asking Rates
Q2-Q3 2018 Indicators

COLLIERS INTERNATIONAL | RETAIL MARKET REPORT FALL/WINTER 2018 11
SOUTH BAY
Historical Availability vs. Asking Rate
Historical Market Statistics - South Bay
Shopping Center TypeTotal
Inventory
Available SF
Direct
Available SF
Sublease
Available SF
Total
Total Availability
(%)Gross
AbsorptionNet
Absorption
Total Under Const.
Asking Rates
($NNN/Year)
South Bay
Strip Mall 6,135,139 211,652 23,152 234,804 3.83% 65,294 7,725 28,329 $32.28
Neighborhood & Community 27,896,484 1,460,879 96,715 1,557,594 5.58% 378,919 175,230 52,926 $34.32
Power & Regional 5,689,199 328,406 2,908 331,314 5.82% 27,590 1,683 63,831 $42.12
Other 970,250 298,043 0 298,043 30.72% 30,490 28,560 276,500 $51.84
South Bay Total 40,691,072 2,298,980 122,775 2,421,755 5.95% 502,293 213,198 421,586 $33.40
Historical Availability
South Bay 2016 3Q 2016 4Q 2017 1Q 2017 2Q 2017 3Q 2017 4Q 2018 1Q 2018 2Q 2018 3Q
Palo Alto/Mt. View/Los Altos 4.02% 3.41% 3.61% 4.17% 4.48% 3.88% 4.13% 3.31% 2.17%
Sunnyvale/Santa Clara 3.89% 4.36% 3.59% 4.17% 4.36% 2.29% 6.87% 9.11% 9.31%
West Valley 4.64% 4.74% 4.57% 5.91% 5.46% 4.30% 4.63% 5.53% 5.21%
San Jose 6.28% 5.74% 5.22% 5.15% 4.94% 4.66% 4.51% 5.19% 5.08%
Fremont/Milpitas/Newark 7.44% 7.26% 7.94% 8.05% 8.09% 7.77% 6.72% 6.53% 7.19%
South Bay Total 5.90% 5.64% 5.44% 5.69% 5.60% 4.95% 5.32% 5.95% 5.95%
Historical Asking Rate
South Bay 2016 3Q 2016 4Q 2017 1Q 2017 2Q 2017 3Q 2017 4Q 2018 1Q 2018 2Q 2018 3Q
Palo Alto/Mt. View/Los Altos $39.36 $46.20 $49.44 $51.48 $44.76 $46.92 $47.88 $47.88 $45.48
Sunnyvale/Santa Clara $29.40 $28.44 $26.28 $26.04 $27.36 $30.60 $33.00 $32.88 $33.00
West Valley $36.00 $39.36 $39.96 $40.44 $41.64 $45.72 $44.52 $44.76 $43.92
San Jose $27.36 $27.12 $26.16 $26.52 $26.88 $29.40 $31.08 $31.92 $33.00
Fremont/Milpitas/Newark $25.56 $24.24 $24.00 $24.60 $24.60 $24.12 $24.48 $28.20 $29.64
South Bay Total $28.27 $28.25 $27.68 $28.56 $28.62 $29.98 $31.61 $33.02 $33.40
Availability by Submarket
Sunnyvale/Santa ClaraWest ValleySan JoseFremont/Milpitas/Newark
Palo Alto/Mt. View/Los AltosHistorical Availability Historical Asking Rate

COLLIERS INTERNATIONAL | RETAIL MARKET REPORT FALL/WINTER 201812
EAST BAYEA
ST B
AY
ECONOMICALLY SOUND. The retail market fundamentals for the East Bay continue to show signs of strengthening. Residential developments that are slated to be delivered in the coming months foster the critical mass of local consumers needed to support a flourishing retail environment. This is most prevalent around the metropolitan cores where food, fitness, entertainment, and finance are attracting a new audience eager to participate in the urban experience.
VARYING RENTS. The variance between retail asking rents is influenced by a broad breadth of factors, compounded by a diverse juxtaposition of urban centers to suburban retail centers. On average, rents have continued to climb slightly due to new inventory becoming available with steady development. The largest notable change was in Q2 to Q3 of 2018 in Oakland; where asking rents rose from $19.32 to $21.24.
CONSTRUCTION & INVENTORY. Urban retail inventory in the East Bay has been increasingly tied to mixed-use projects that require a residential component to support a growing housing demand; which helps to draw traffic toward newer developments, highlighting the revitalization of community investment. Suburban retail centers such as the newly opened Bishop Ranch shopping mall have been encompassing the experiential aspect of the retail outing.
UPCOMING TRENDS. Highly successful “public market” type developments, encompassing micro-retail locations, are gathering community support due to the feasibility for new market participants to offer goods and services to an enthusiastic audience.
RETAIL HORIZONS. Many of the retail markets within urban cores seem to be withstanding the so-called “Amazon effect” that has knowingly loomed over retail for some time now. Local focus has shifted away from the challenges of e-commerce toward the positivity of community brands that utilize omni-channels and who maximize community outreach. The launch of Bishop Ranch shopping mall has created a favorable buzz around the suburban retail centers, due to how they mimic urban traits for future success.
Leasing Volume Remains Strong
99 Ranch2200 Hilltop Mall Road, Richmond, CA35,000 SFNew Lease
Whole Foods5110 Telegraph Avenue, Oakland, CA28,800 SFNew Lease
Ashley Furniture HomeStore7885 Dublin Boulevard, Dublin, CA45,500 SFNew Lease
Touchstone Climbing1861-1877 Solano Avenue, Berkeley, CA21,578 SFNew Lease
Target2630 Broadway, Oakland, CA33,100 SFNew Lease
Grocery Outlet31045-31049 Mission Boulevard, Hayward, CA23,688 SFNew Lease
Recent Transactions
“East Bay retail remains
strong and Oakland has
attracted the eye of both
regional and national retail
players.”
- Nadine WhisnantSenior Vice President
Vacancy
Asking Rates
Net Absorption
Construction
Q2-Q3 2018 Indicators

COLLIERS INTERNATIONAL | RETAIL MARKET REPORT FALL/WINTER 2018 13
EAST BAY
Shopping Center TypeTotal
Inventory
Available Sq.FtDirect
Available Sq.Ft
Sublease
Available Sq.FtTotal
Total Availability
(%)Gross
AbsorptionNet
Absorption
Total Under Const.
Asking Rates
($NNN/Year)
East Bay
Strip Mall 1,851,431 77,297 1,200 78,497 4.24% 40,902 25,929 0 $24.12
Neighborhood & Community 20,672,955 1,341,352 100,599 1,441,951 6.98% 344,273 207,394 0 $19.20
Power & Regional 5,972,274 505,558 10,408 515,966 8.64% 53,391 (83,628) 0 $28.08
Other 2,906,486 98,810 25,993 124,803 4.29% 6,596 6,596 350,000 $22.44
East Bay Total 31,403,146 2,023,017 138,200 2,161,217 6.88% 445,162 156,291 350,000 $22.87
Historical Availability
East Bay 2016 3Q 2016 4Q 2017 1Q 2017 2Q 2017 3Q 2017 4Q 2018 1Q 2018 2Q 2018 3Q
Oakland/Alameda 12.38% 12.58% 11.77% 11.51% 11.55% 10.85% 10.77% 10.48% 11.20%
Berkeley/Emeryville 3.09% 4.24% 2.68% 2.27% 4.34% 4.11% 2.89% 5.86% 7.00%
Tri Valley 4.81% 8.66% 9.18% 9.02% 9.53% 8.91% 8.90% 5.58% 4.56%
West Contra Costa County 7.04% 6.55% 4.68% 4.94% 5.12% 5.27% 9.20% 7.67% 12.37%
Central Contra Costa County 6.30% 6.12% 5.25% 5.54% 6.24% 5.71% 5.68% 5.13% 4.07%
East Contra Costa County 9.06% 9.23% 9.78% 8.99% 8.51% 8.70% 9.10% 8.91% 7.78%
East Bay Total 7.27% 8.90% 8.29% 8.02% 7.91% 7.25% 8.34% 6.52% 6.88%
Historical Asking Rate
East Bay 2016 3Q 2016 4Q 2017 1Q 2017 2Q 2017 3Q 2017 4Q 2018 1Q 2018 2Q 2018 3Q
Oakland/Alameda $25.56 $24.24 $24.72 $24.84 $24.96 $30.12 $30.36 $19.32 $21.24
Berkeley/Emeryville $33.00 $31.80 $33.84 $33.84 $33.84 $36.00 $36.00 $36.00 $30.00
Tri Valley $22.68 $23.28 $22.92 $23.76 $23.04 $23.64 $21.72 $23.04 $21.62
West Contra Costa County $24.84 $24.84 $25.56 $25.68 $26.16 $27.72 $27.72 $28.68 $21.98
Central Contra Costa County $32.16 $31.68 $29.52 $30.36 $28.80 $25.08 $29.04 $27.96 $28.96
East Contra Costa County $17.40 $17.40 $17.16 $17.40 $16.92 $17.16 $17.16 $17.28 $15.97
East Bay Total $22.89 $22.77 $22.07 $22.71 $22.51 $22.97 $22.88 $21.82 $22.87
Historical Availability vs. Asking Rate
Historical Market Statistics - East Bay
Availability by Submarket
Historical Availability Historical Asking Rate
Central ContraCosta County
West ContraCosta County
East ContraCosta County
Berkeley/EmeryvilleOakland/Alameda
Tri Valley
*Please note these asking rents do not incorporate new retail development projects.

COLLIERS INTERNATIONAL | RETAIL MARKET REPORT FALL/WINTER 201814
NORTH BAY
VACANCY INCREASING. The North Bay’s retail market remained generally healthy in the third quarter of 2018 despite vacancy increasing slightly from 5.49 percent to 6.37 percent this quarter. This is well below the past decade’s peak level of 9.4 percent experienced in 2010.
RENTAL RATES TRENDING UPWARD. Average asking rental rates are trending upward as the Q3 2018 rate was $20.88 per square foot, up from $20.52 a year ago and $18.60 two years ago.
CLOUDS ON HORIZON. However, there are clouds on the horizon as the economy’s transition to the ever increasing e-commerce is leading to closures of some larger big box retailers’ stores, most notably Sears, Toys R Us and Orchard Supply Hardware recently. While the economy is currently healthy, the Dow Jones Industrial has declined by more than 10 percent in the past two months, which can portend a future decline in the health of the overall economy.
LONG TERM OUTLOOK. Despite the shifting economy, the long-term outlook for the North Bay remains strong given its two relative strengths of an affluent population and the tourism draw of the world famous wine country.
Vacancy and Rental Rates Trending Upward
UBS Realty Investors LLC 980 East Washington Place, Petaluma, CA203,403 SF $54,900,000
Chelsea Pacific Investments 75 Bellam Road, San Rafael, CA147,793 SF$29,875,000
Merlone Grier Partners 400 Las Galinas Avenue, San Rafael, CA71,268 SF$24,575,000
Sprouts 1031-1071 Helen Power Drive, Vacaville, CA25,000 SF
Caliber Collision 2353 Auto Mall Parkway, Fairfield, CA16,900 SF
FloresCorte Madera Town Center7,100 SF
Recent Transactions
NORT
H BA
Y
Construction
Net Aborption
Asking Rates
Market Vacancy
Q2-Q3 2018 Indicators

COLLIERS INTERNATIONAL | RETAIL MARKET REPORT FALL/WINTER 2018 15
Historical Availability vs. Asking Rate
Historical Market Statistics - North Bay
Shopping Center TypeTotal
Inventory
Available SF
Direct
Available SF
Sublease
Available SF
Total
Total Availability
(%)Gross
AbsorptionNet
Absorption
Total Under Const.
Asking Rates
($NNN/Year)
North Bay
Strip Mall 2,140,159 75,785 6,089 81,874 3.83% 16,671 988 0 $18.12
Neighborhood & Community 15,257,594 1,015,177 12,118 1,027,295 6.73% 77,241 (51,964) 0 $19.80
Power & Regional 6,234,809 202,243 194,905 397,148 6.37% 5,341 (39,434) 0 $27.72
Other 1,864,091 95,501 21,428 116,929 6.27% 4,500 (8,153) 0 $23.04
North Bay Total 25,496,653 1,388,706 234,540 1,623,246 6.37% 103,753 (98,563) 0 $20.88
Historical Availability
North Bay 2016 3Q 2016 4Q 2017 1Q 2017 2Q 2017 3Q 2017 4Q 2018 1Q 2018 2Q 2018 3Q
Marin County 4.71% 4.97% 5.55% 3.61% 3.77% 3.79% 3.43% 2.79% 3.00%
Napa County 2.38% 2.09% 2.72% 2.07% 3.15% 3.28% 2.46% 2.46% 4.28%
Solano County 8.07% 9.10% 8.14% 7.91% 7.65% 7.40% 8.80% 9.36% 9.48%
Sonoma County 5.36% 5.16% 5.41% 5.77% 5.54% 4.58% 4.60% 4.50% 6.12%
North Bay Total 5.82% 6.10% 6.06% 5.66% 5.62% 5.20% 5.50% 5.49% 6.37%
Historical Asking Rate
North Bay 2016 3Q 2016 4Q 2017 1Q 2017 2Q 2017 3Q 2017 4Q 2018 1Q 2018 2Q 2018 3Q
Marin County $23.76 $25.56 $27.96 $27.36 $27.72 $26.88 $33.48 $31.44 $31.32
Napa County $33.84 $34.44 $33.72 $37.68 $38.04 $29.88 $28.44 $33.96 $33.96
Solano County $15.48 $15.12 $17.28 $15.36 $15.00 $15.72 $15.72 $16.20 $15.96
Sonoma County $18.00 $17.76 $17.40 $21.24 $21.24 $21.72 $22.44 $23.04 $22.32
North Bay Total $18.60 $18.12 $19.68 $20.52 $20.52 $20.40 $20.40 $20.64 $20.88
Availability by Submarket
NORTH BAY

COLLIERS INTERNATIONAL | RETAIL MARKET REPORT FALL/WINTER 201816
SACRAMENTO
SOUND FUNDAMENTALS. Sacramento’s total retail vacancy and availability rates dropped to their lowest points since the start of 2008. An expanding population of relocating Bay Area households and Millennials has helped Sacramento’s retail market experience sustained growth. Third quarter net absorption recorded more than double the previous quarter as year-to-date absorption surpassed 253,000 square feet and rents continue to rise.
BARGAIN GROCERY’S EXPANSION. Grocery Outlet opened two new Sacramento locations in the third quarter, one in North Sacramento and another in Orangevale. It also has two more stores scheduled to open by the end of the year, bringing its new store total to 66,978 square feet this year and expanding its Sacramento regional footprint to approximately 320,000 square feet across 20 stores.
FITNESS AND HEALTH CLUBS IN GROWTH MODE. Planet Fitness leased 18,400 square feet and Orangetheory Fitness is opening a new location in the fourth quarter. More than 108,000 square feet of new fitness center and health club leases have been signed or locations opened in 2018. VillaSport Athletic Club & Spa is building a 130,000 square foot location in Roseville. LA Fitness is planning a 37,000 square foot gym in Elk Grove and another in South Sacramento; and 24 Hour Fitness is working on opening two more locations in the coming years.
BARS AND RESTAURANTS GALORE. There are now 68 bars and 139 restaurants in Downtown Sacramento alone. An estimated 49 new retail businesses have opened or are in the works since the Sacramento Kings’ Golden 1 Center completed in 2016. In the city of Sacramento, approximately 57 new bars and restaurants totaling more than 207,000 square feet of space have opened or are scheduled to open in 2018. Regional restaurant employment is expanding, increasing 2.6 percent year-over-year, adding 800 jobs in the last twelve months.
SOLID SALES ACTIVITY. Third quarter sales volume totaled $131.1 million from 65 transactions at an average price of $149.52 per square foot. Year-to-date sales volume of $461.4 million puts Sacramento on track to notch the fifth year in a row above $500 million as out-of-town buyers remain attracted to the Sacramento retail market.
FUTURE OUTLOOK ENCOURAGING. With an expanding population and much of the new construction lined up with signed tenants, expect upward pressure on rental rates and declining availability to continue over the next few quarters. One trouble spot remains the 58,700 square feet of available space at the under construction Downtown Commons. Sacramento has finally put itself on the map and its retail market is now enjoying a positive run of elevated demand from tenants in a number of growing industries, which should continue into 2019.
Acadia Realty Trust 9600 -9696 Bruceville Road, Elk Grove, CA241,926 SF $59,300,000
KC Holding Corporation 1588 E. Main Street, Woodland, CA116,288 SF$18,000,000
Grocery Outlet 1600 W El Camino Avenue, Sacramento, CA15,019 SF
Planet Fitness 4854 San Juan Avenue, Fair Oaks, CA18,400 SF
Demand Driven by Experiential Retail
Recent Transactions
“Bars and restaurants have
been replacing retail tenants in
shopping centers for a variety
of reasons. Currently it is
still difficult to purchase food
on the internet, restaurants
are experiential and because
of this, still attract on-site
customers, people are social
and restaurants provide a
gathering place.”
- Mark EngemannSenior Vice President
Asking Rates
Market Vacancy
Net Absorption
SACR
AMEN
TO
Construction
Q2-Q3 2018 Indicators

COLLIERS INTERNATIONAL | RETAIL MARKET REPORT FALL/WINTER 2018 17
Historical Availability vs. Asking Rate
Shopping Center TypeTotal
Inventory
Available SF
Direct
Available SF
Sublease
Available SF
Total
Total Availability
(%)Gross
AbsorptionNet
Absorption
Total Under Const.
Asking Rates ($NNN/Year)
Sacramento
Strip Mall 6,026,174 738,213 11,695 749,908 12.44% 144,569 41,250 10,072 $15.08
Neighborhood & Community 32,950,546 3,170,005 279,950 3,432,313 10.42% 264,386 41,538 113,145 $16.21
Power & Regional 11,172,876 1,032,722 43,604 1,052,713 9.42% 12,871 10,908 0 $16.37
Other 2,713,710 345,577 0 345,577 12.73% 8,727 6,977 87,640 $18.12
Sacramento Total 52,863,306 5,286,517 335,249 5,580,511 10.56% 430,553 100,673 210,857 $15.87
Historical Availability
Sacramento Area 2016 Q3 2016 Q4 2017 Q1 2017 Q2 2017 Q3 2017 Q4 2018 Q1 2018 Q2 2018 3Q
Arden 16.30% 18.00% 16.60% 16.80% 16.70% 14.10% 16.50% 16.40% 15.40%
Downtown/Midtown 3.50% 3.10% 2.70% 2.60% 3.80% 3.10% 2.90% 3.50% 2.90%
Elk Grove 5.80% 4.20% 4.40% 4.30% 4.10% 3.90% 3.70% 3.40% 3.40%
Folsom 7.30% 6.90% 6.60% 6.80% 6.80% 7.30% 7.20% 7.40% 7.10%
Roseville/Rocklin 8.80% 8.80% 7.70% 7.90% 7.20% 6.30% 6.40% 6.70% 6.60%
Natomas/Northgate 8.10% 8.90% 8.60% 8.10% 7.30% 7.30% 8.10% 8.70% 8.40%
South Sacramento 11.90% 11.60% 11.50% 10.60% 10.90% 10.50% 9.80% 9.70% 9.60%
Other Submarkets 10.20% 10.40% 9.30% 9.10% 8.70% 8.50% 8.80% 8.50% 8.60%
Sacramento Area Total 11.02% 11.26% 11.01% 10.87% 11.03% 10.40% 10.59% 10.39% 10.56%
Historical Asking Rate
Sacramento Area 2016 Q3 2016 Q4 2017 Q1 2017 Q2 2017 Q3 2017 Q4 2018 Q1 2018 Q2 2018 3Q
Arden $15.51 $15.78 $16.10 $15.49 $15.18 $15.29 $15.52 $15.26 $14.69
Downtown/Midtown $20.61 $20.64 $20.65 $20.60 $23.62 $21.71 $17.27 $17.96 $17.96
Elk Grove $19.24 $19.34 $19.02 $22.07 $22.01 $21.74 $22.12 $22.25 $22.36
Folsom $21.00 $21.46 $21.15 $21.15 $21.46 $21.29 $20.23 $20.70 $19.21
Roseville/Rocklin $16.66 $16.42 $16.12 $15.82 $16.50 $16.14 $16.18 $18.03 $17.51
Natomas/Northgate $17.71 $17.30 $17.32 $17.29 $17.10 $16.73 $15.46 $15.38 $15.46
South Sacramento $14.50 $14.85 $14.44 $15.74 $16.47 $16.21 $15.87 $15.78 $16.06
Other Submarkets $13.69 $15.69 $13.51 $13.76 $13.58 $13.89 $14.09 $14.37 $14.78
Sacramento Area Total $15.51 $16.48 $15.43 $15.50 $15.59 $15.63 $15.55 $16.00 $15.87
Availability by Submarket
Historical Market Statistics - Sacramento
$14.80
$15.00
$15.20
$15.40
$15.60
$15.80
$16.00
$16.20
$16.40
$16.60
0.00%
1.00%
2.00%
3.00%
4.00%
5.00%
6.00%
7.00%
2016 Q3 2016 Q4 2017 Q1 2017 Q2 2017 Q3 2017 Q4 2018 Q1 2018 Q2 2018 Q3
Historical Availability vs. Asking Rate - Sacramento
Historical Availability Historical Asking Rate
Availability by Submarket
ArdenDowntown/MidtownElk GroveFolsomRoseville/RocklinNatomas/NorthgateSouth SacramentoOther Submarkets
SACRAMENTO
Historical Availability Historical Asking Rate

COLLIERS INTERNATIONAL | RETAIL MARKET REPORT FALL/WINTER 201818
Market Summary
SubmarketTotal
Inventory
Available SF
Direct
Available SF
Sublease
Available SF
Total
Total Availability
(%)Gross
AbsorptionNet
Absorption
Total Under Const.
Asking Rates ($NNN/Year)
San Francisco
Union Square 3,154,216 187,678 13,389 201,067 6.37% 10,977 (10,977) 0 $48.52
Mid Market 608,018 264,325 6,000 207,325 44.46% 6,138 6,138 0 $39.81
SOMA 2,168,957 90,810 9,932 100,742 4.64% 5,095 5,095 0 $42.03
San Francisco Total 5,931,191 542,813 29,321 235,427 4.08% 22,210 (30,616) 0 $43.26
Peninsula
South Peninsula 2,838,927 36,214 0 36,214 1.28% 42,551 (16,404) 0 $33.99
Mid Peninsula 2,636,142 79,316 2,584 81,900 3.11% 2,100 (15,712) 0 $49.47
North Peninsula 3,646,421 242,627 2,986 245,613 6.74% 29,342 13,044 0 $35.31
Peninsula Total 9,121,490 358,157 5,570 363,727 3.99% 73,993 (19,072) 0 $37.55
South Bay
Palo Alto/Mt. View/Los Altos 2,741,629 59,626 0 59,626 2.17% 175,379 155,849 49,751 $45.48
Sunnyvale/Santa Clara 5,586,798 517,270 2,608 519,878 9.31% 72,154 (4,661) 275,000 $33.00
West Valley 4,254,792 197,796 23,887 221,683 5.21% 72,959 22,908 1,500 $43.92
San Jose 18,989,412 890,062 74,482 964,544 5.08% 150,606 54,183 88,655 $33.00
Fremont/Milpitas/Newark 9,118,441 634,226 21,798 656,024 7.19% 31,195 (15,081) 6,680 $29.64
South Bay Total 40,691,072 2,298,980 122,775 2,421,755 5.95% 502,293 213,198 421,586 $33.40
East Bay
Oakland/Alameda 3,130,031 350,694 0 350,694 11.20% 13,224 (14,399) 0 $21.24
Berkeley/Emeryville 1,412,884 62,835 36,104 98,939 7.00% 11,962 (2,872) 0 $36.00
Tri Valley 9,044,827 389,693 23,172 412,865 4.56% 204,684 116,371 350,000 $24.24
West Contra Costa County 2,492,391 299,207 9,128 308,335 12.37% 35,281 (16,784) 0 $28.68
Central Contra Costa County 5,436,449 215,606 5,796 221,402 4.07% 70,313 39,961 0 $28.32
East Contra Costa County 9,886,564 704,982 64,000 768,982 7.78% 109,698 34,014 0 $17.28
East Bay Total 31,403,146 2,023,017 138,200 2,161,217 6.88% 445,162 156,291 350,000 $22.87
North Bay
Marin County 5,247,744 150,551 7,101 157,652 2.90% 3,100 (21,626) 0 $29.88
Napa County 2,597,293 111,215 0 111,215 4.30% 25,988 877 0 $33.24
Solano County 8,157,192 639,557 133,583 773,140 9.50% 40,578 (31,547) 0 $15.84
Sonoma County 9,494,424 487,383 93,856 581,239 6.10% 34,087 (46,267) 0 $23.28
North Bay Total 25,496,653 1,388,706 234,540 1,623,246 6.37% 103,753 (98,563) 0 $21.06
RETAIL MARKET REPORT
2
1
3

COLLIERS INTERNATIONAL | RETAIL MARKET REPORT FALL/WINTER 2018 19
South Peninsula: Redwood City, Menlo Park, San Carlos & BelmontMid Peninsula: Burlingame, Foster City, Millbrae, Redwood Shores & San MateoNorth Peninsula: Brisbane, South San Francisco, Daly City & San Bruno
Other Submarkets: Auburn/Loomis, Carmichael, Davis, El Dorado, Highway 50 Corridor, Lincoln, Natomas, Orangeville/Citrus Heights, Rio Linda/North Highlands, West Sacramento, Woodland
Central Contra Costa County: Danville/Alamo, Lafayette, Moraga, Orinda, Pleasant Hill & Walnut Creek BART/DTEast Contra Costa County: Antioch, Brentwood, Concord & PittsburgWest Contra Costa County: Hercules, Martinez, Pacheco, Pinole & San PabloTri Valley: San Ramon, Dublin, Pleasanton & Livermore
West Valley: Campbell, Cupertino, Los Gatos & Saratoga
NORTHERN CALIFORNIA
Shopping Center TypeTotal
Inventory
Available SF
Direct
Available SF
Sublease
Available SF
Total
Total Availability
(%)Gross
AbsorptionNet
Absorption
Total Under Const.
Asking Rates ($NNN/Year)
Northern California
Strip Mall 17,089,979 1,122,466 42,136 1,164,602 6.81% 267,936 69,792 38,401 $13.72
Neighborhood & Community 102,159,960 7,149,684 494,952 7,626,994 7.47% 1,104,041 373,667 166,071 $15.01
Power & Regional 31,879,791 2,246,460 251,825 2,474,672 7.76% 133,464 (124,912) 63,831 $21.61
Other 14,377,128 1,379,580 76,742 1,456,322 10.13% 72,523 3,364 714,140 $25.92
Northern California Total 165,506,858 11,898,190 865,655 12,722,590 7.69% 1,577,964 321,911 982,433 $22.89
SubmarketTotal
Inventory
Available SF
Direct
Available SF
Sublease
Available SF
Total
Total Availability
(%)Gross
AbsorptionNet
Absorption
Total Under Const.
Asking Rates ($NNN/Year)
Sacramento
Arden 5,184,844 774,160 49,652 823,812 15.89% 90,866 53,211 0 $14.69
Downtown/Midtown 1,249,704 136,750 0 136,750 10.94% 6,552 6,552 87,640 $17.96
Elk Grove 3,761,498 158,594 0 158,594 4.22% 15,337 (1,048) 0 $22.36
Folsom 4,164,476 311,974 0 311,974 7.49% 52,550 11,398 10,072 $19.21
Roseville/Rocklin 8,657,480 681,651 25,982 684,020 7.90% 61,520 11,281 0 $17.51
Natomas/Northgate 2,542,037 187,830 19,991 207,821 8.18% 6,600 6,250 0 $15.46
South Sacramento 7,235,078 859,303 23,399 882,702 12.20% 37,849 6,386 102,145 $16.06
Other Submarkets 20,068,189 2,176,255 216,225 2,374,838 11.83% 159,279 6,643 11,000 $14.78
Sacramento Total 52,863,306 5,286,517 335,249 5,580,511 10.56% 430,553 100,673 210,857 $15.87
Northern California Total 165,506,858 11,898,190 865,655 12,722,590 7.69% 1,577,964 321,911 982,443 $22.89
Statistical Notes*Northern California retail statistics do not include mixed-use projects.*Total Availability = Includes existing and under construction inventory square feet.Sources: Colliers International Research, CoStar, GlobalData & Turner Building Cost Index
Submarket Clarification
3
4
2
4
1

R E G I O N A L O F F I C E S
San Francisco101 Second Street, Suite 1100San Francisco, CA 94105+1 415 788 3100
San Francisco Peninsula203 Redwood Shores Parkway, Suite 125Redwood City, CA 94065+1 650 486 2200
San Jose/Silicon Valley450 West Santa Clara StreetSan Jose, CA 95113+1 408 282 3800
Gilroy/South County8070 Santa Teresa Boulevard, Suite 220Gilroy, CA 95020+1 408 842 7000
Oakland/East Bay1999 Harrison Street, Suite 1750Oakland, CA 94612+1 510 986 6770
Walnut Creek/East Bay1850 Mt. Diablo Boulevard, Suite 200Walnut Creek, CA 94596+1 925 279 0120
Pleasanton/East Bay3825 Hopyard Road, Suite 195Pleasanton, CA 94588+1 925 463 2300
Fairfield/North Bay360 Campus Lane, Suite 101Fairfield, CA 94534+1 707 863 0188
Sacramento301 University Avenue, Suite 100 Sacramento, CA 95825+1 916 929 5999
Stockton3439 Brookside Road, Suite 108 Stockton, CA 95219+1 209 475 5100
colliers.com/retail
Colliers International is a global leader in real estate services with more than 13,500 professionals operating out of 482 offices in 62 countries. Colliers provides a full range of services to real estate users, owners and investors worldwide including: global corporate solutions; sales and lease brokerage; property and asset management; project management; hotel investment sales and consulting; property valuation and appraisal services; mortgage banking and insightful research. Colliers has 10 offices in Northern California and Nevada. CA License No. 00490878
Click Here to View the Winter 2018 Quarterly Retail Spotlight Report