market reaction to patent litigation verdicts and patent
TRANSCRIPT
Market Reaction to Patent Litigation Verdicts and
Patent Appeal Results
Lorna ZhangAdvisor: Professor Yeon-Koo Che
Senior Honors Thesis
April 18, 2013
Abstract
This paper examines the capabilities of markets in predicting the
probability that an intellectual property (IP) litigation verdict will
be later overturned upon appeal. Unlike prior research, which have
primarily focused on patent litigation cases where a settlement was
reached between the two parties, this study examines litigation cases
that went to trial. I find evidence of divergence between the ability
of the stock returns of claimant and defendant firms in predicting the
probability of reversal. In particular, defendant firm market movement
is significantly related to the probability of reversal, whereas claimant
firm market movement is almost completely insignificant. I also find
evidence that the probability of reversal significantly increases when
the claimant wins the initial trial. This is likely due to the way the
court system is designed to incentive firms to patent their innovations.
Additionally, my results suggest that publicly traded firms of differ-
ence sizes approach the litigation process differently. I also find that
when both the claimant and defendant firms are publicly traded, the
probability that the verdict will be overturned increases.
1
1 Introduction
Patents are one of the most significant legal instruments that protectintellectual property (IP) rights. A patent gives the inventor the exclusiverights to the patented idea for a limited period of time, typically 20 years fromthe date the patent was filed. A patentable invention must be new, usefuland nonobvious to a person skilled in the field of application at the time.Novel ideas that result in new, useful products have an obvious economicvalue. But, these ideas are also pure public goods, which can make themproblematic for a market system to handle and results in a market failurewhere too few innovations are made[1]. Patents help to alleviate this problemby creating a legal means of conferring excludability upon novel innovations.
Recently, we have seen a steady rise in patent litigation year after year.The number of patent litigations has risen from 2,281 in 2000 to 5,484 in2012, an increase of about 140%1. It is well documented that litigations arecostly affairs [20, 15, 18, 19, 6, 7, 22]. For example, a recent study relatedto patent litigation found that Research in Motion, the maker of Blackberryphones, incurred over $22 million in costs defending itself against a patentinfringement lawsuit [20]. An earlier study by Lerner [18], which looked atthe effect of litigation on firm value, found an average decrease in firm valueof -2% upon the initial litigation announcement for 26 biotechnology suits,representing a median shareholder value loss of $20 million. Mark Lemley,a Stanford Law professor, estimated in an interview with National PublicRadio (NPR) that Apple has already spent $700 million in legal fees on theongoing Apple vs. Samsung litigation [22]. Additionally, numerous studies([6, 19, 10]) have shown that two of the main reasons firms choose not toapply for a patent is that the expected cost of defending the patent in courtand the likelihood that the patent’s validity will be called into question whena firm tries to assert said patent in court are prohibitively high.
Given the high cost, for litigation to serve its purpose of protecting valu-able innovation, the court rulings must be accurate. However, the fact that116 of the 560 cases that went to trial in my sample set had verdicts that
1Statistic obtained from the Lex Machina intellectual property (IP) litigation database.
2
were later reversed or vacated upon appeal, a rate of about 20.7% 2, sug-gests that this might not be the case. Of course we cannot expect rulingsto be 100% accurate, and some would argue that 80% is acceptable. Oneway to test if there is room for improvement is to examine whether marketsare capable of indicating which cases are more likely to be overturned uponappeal. If markets are efficient in aggregating information, as is often argued[9], we would expect them to be able to accurately evaluate the outcome ofcourt verdicts, predicting when they are likely to be reversed or confirmedupon appeal.
A large number of studies on the economic impact of litigations ([21, 3,20, 2]) have utilized a market-based approach to quantify the significanceof these litigations. Bhagat and Romano [4] provide an extensive summaryof event study methodologies and how they are applied to assess the issuesof litigation and corporate law. While there has been extensive research toevaluate what information can be extracted from market reactions to eventsin the legal arena, relatively little research has dealt specifically with marketreactions to different events in patent litigations. There have only beentwo papers [21, 20] that have examined and analyzed the market responseat the announcement and settlement of a patent litigation within differentindustries, but there have been no prior studies examining the scenario wherethe case goes to trial.
Past studies have shown that markets view the commencement of patentlitigation as an economically significant event; however, the large majorityof these cases (about 65.5%3) are settled without going to trial or appearingbefore a judge. Of the 12.9% of cases where there was a winner, only 13.7%of these had gone to trial4. The rest were resolved either through a defaultjudgment, summary judgment or consent judgment. Nevertheless, despite
2Statistic calculated using data provided by the Lex Machina IP litigation database;this rate is likely to be even higher as firms involved in cases where judgements wererendered in late 2011 or 2012 have likely not yet had enough time to file an appeal, or, ifan appeal has been filed, the US Court of Appeals has likely not had the time to delivera final ruling.
3Statistic calculated using data provided by the Lex Machina IP litigation database.4Statistic calculated using data provided by the Lex Machina IP litigation database.
3

the relative paucity of cases that were litigated to their conclusion, these casesare usually more interesting because both parties must have felt stronglyabout their position and ability to win the litigation if they would rathertake the case to trial than settle [12].
Given the wealth of information embodied in market responses to events,we would suspect that market reaction might be an indicator as to whethera verdict will be overturned upon appeal, if one of the companies involvedis a publicly traded company. There is ample evidence to suggest that wecan assume that markets have already incorporated expectations about theoutcome of the litigation into stock prices well before a verdict is announced.However, regardless of market expectations, there is still a degree of uncer-tainty surrounding the outcome, which will also be reflected in stock prices.The premise of an event study is based on the assumption that financialmarkets are informationally efficient, and that we can therefore expect stockprices to reflect investors’ expectations of the results of the litigation wellbefore an official verdict is announced [9]. By extension then, if any newinformation is revealed in the commencement (or termination) of litigation,markets will revise their expectations to reflect their new expectations aboutcash flow and risk, thereby revaluing the firm accordingly.
Any changes in the stock prices of the companies involved in the liti-gation immediately after the verdict is publicized will consist of two com-ponents: an “uncertainty removal” component and a “surprise” component.The uncertainty removal portion arises from the fact that after the verdictis made public, the uncertainty surrounding the outcome of the litigationis removed. When uncertainty decreases, stock prices will shift to reflectthat. The surprise component of the stock price change measures whetheror not the verdict was in line with investor expectations. Raghu et al [21]finds that, at least for the defendant, the market reaction at the time ofa settlement/termination of the IP litigation largely reflects discrepanciesbetween the expectations of the investors and the actual outcome. If weassume that markets are capable of accurately assessing the optimal scopeand value of a patent, then any deviations from market expectations wouldsuggest a problematic ruling. The presence of a surprise component could
4

indicate that there is something troubling about the ruling and that it mightbe more likely to be overturned in the appeals process.
Studying the predictive power of this market response will allow us todetermine both whether or not market reaction is a potential indicator of thesuccess of a future appeal and to what extent markets accurately assess theoptimal scope and value of a patent, if at all. To date, there have been noevent studies done on whether market reaction to a verdict announcementor any other characteristics of the case have any predictive powers withregards to the probability of a successful appeal. Additionally, I am workingwith a new set of cases, as previous studies that have utilized the event studymethodology to measure how markets percieve the impact of patent litigationonly examined cases where a settlement was reached. I am examining casesthat went to trial and were litigated to their conclusion.
My results suggest that the impact of market reaction on the probabilityof reversal differs significantly between claimant and defendant firms. Specif-ically, markets do seem to have some predictive power in determining thelikelihood that an initial verdict will be overturned upon appeal when theevent study firm is the defendant. A simple OLS regression indicates that a1 unit increase in the deviation of actual market reaction from the expectedmarket value results in a 7.35% increase in the probability that the verdictwill be reversed upon appeal. The p-value on the coefficient in front of thisvariable is around 11%. While this value is not highly significant, neither isit trivial. The positive coefficient suggests that the larger the deviation ofthe actual stock return from the expected return, the more likely it is thatthe verdict will later be reversed, thus reaffirming the theory.
It is also possible that this reaction is a bit dampened because marketsmight be anticipating an appeal, and have therefore already factored some ofthat anticipation into the reaction. This is very plausible given the fact thatover 80% of the cases in my initial sample were later appealed. However,this is only the case when the event study is done on defendant firms. WhenI split my sample up into claimant and defendant firms and ran separate re-gressions for the two samples, the coefficient on the market reaction variablewhen the event study firm is the claimant is completely insignificant, with a
5
p-value of around 70%. This indicates that only market reaction for defen-dant firms has any relation with the probability of reversal. This is likely dueto the fact that defendant firms have a much larger downside than claimantfirms [3, 12]. A defendant firm may experience significant financial distress ifit is ruled to have infringed upon the claimant’s patents. A decrease in theirwealth and competitiveness is inevitable if the ruling is not later overturned.On the other hand, if the claimant loses, they do not have to cease productionof their product nor do they have to pay any royalties to the defendant firm.Thus, the claimant’s downside is essentially capped at the status quo. As aresult, it is unsurprising that market reactions are much larger for defendantfirms. Similarly, the effect of industry characteristics on the probability ofreversal is very significant for defendant firms (p-value around 1%), while ex-tremely insignificant for claimant firms (p-value around 94%). These resultssuggest that publicly traded claimant and defendant firms have markedlydifferent characteristics and very different reaction magnitudes to an unex-pected initial verdict. Additionally, I found that when the claimant wins thetrial, the verdict is significantly more likely to be overturned upon appeal.This result is very strong (p-value < 0.01 for most regressions) and consis-tent across regressions with different specifications. Similarly, when both theclaimant and defendant are publicly traded, the probability that the rulingwill be reversed is significantly higher.
While market reaction seems to have some success in indicating whichverdicts are more likely to be overturned upon appeal, it appears to haveno explanatory or predictive power in terms of forecasting the proportionof verdicts reversed per case. In fact, the p-value for the joint test thatall the coefficients are 0 ranges between 79.8% and 87.5%, indicating thatnone of the variables in the regression are significant. However, measuringthe degree of reversal by using the proportion of verdicts overturned uponappeal per case is slightly flawed. Cases that only asserted a single patentwill naturally have a 100% reversal proportion, but cases where multiplepatents were asserted will have a larger range of possible values. Anotherconsequence of using this measurement is that a case where 1 out of 1 patentsasserted were overturned would have the same calculated degree of reversal
6
as a case where 8 out of 8 patents were reversed; however, I would considerthe latter to have a larger degree of reversal but proportions do not reflectthis.
Thus, I also use an alternative variable to measure the degree of rever-sal. I decided to examine whether market reaction, along with my othercontrol variables, might be a better indicator of the number of verdicts over-turned per case. I find that this is indeed the case, and that the variablesI have chosen to use have a much stronger relationship with the number ofpatents overturned rather than with the proportion of patents overturned.The p-value for the joint null hypothesis test that all the coefficients are si-multaneously 0 ranges from 3% to 9%, suggesting that it is highly probablethat at least one of the variables is significant. Additionally, I find marketcapitalization to be significant at the 15% significance level.
Finally, I also regress the probability that an appeal is filed on the mag-nitude of the market reaction and other control variables. When using anOLS regression, the coefficient of the magnitude of the market reaction tohas a p-value of 14.4%. The regression indicates that a 1 unit increase inthe standardized difference between the actual and expected market returnsresults in an 2.6% increase in the probability that an appeal will be filed.Once again, as with my regressions on the probability of reversal, I find thatwhen the claimant wins, there is a significantly higher probability that thecase will be appealed (p-value < 0.01).
The rest of the paper is organized as follows. Section 2, provides back-ground information for the study. Section 3 is a literature review followed bya research hypothesis in section 4. Section 5 details the event study method-ology used for this analysis followed by a description of the data in section6. Section 7 gives an analysis of the results. Lastly, I conclude and presentconsiderations and suggestions for further research in section 8.
2 Background
Patent litigations are complicated proceedings with a significant amount ofvariation between cases. Figure 1 displays a timeline of events that can occur
7

during the course of litigation; at any point in this process, the litigation canbe terminated if the parties reach a settlement agreement. Additionally, thejudge can dismiss the case in a summary judgment if it is determined thateither side does not have enough evidence to argue the infringement casefurther, and both parties can file a motion for a summary judgment anytimebefore the commencement of the trial.
Figure 1: Patent Litigation Timeline.5
While summary judgment rulings can also be appealed, I chose to onlystudy cases that actually went to trial given that these cases would be ex-pected to be the most heavily contested. Additionally, there is evidence tosuggest that information is revealed during the fact discovery period and thetrial that helps the market form expectations regarding the final verdict. Ifmarkets adjust their expectations as new information comes to light duringthe litigation, then we would expect to see the market capitalizations of theclaimant and defendant firms moving opposite to each other as informationthat strengthens the claimant’s case will necessarily weaken the defendant’s.Figure 2 displays the movement in the market capitalization of two firms
5Timeline taken from http://iposgoode.ca/TheUSPatentLitigationProcess-IPOsgoodeDecember2010.pdf
8

involved in a patent litigation and reference lines have been placed at keypoints in the litigation process. It is clear from this graph that the movementin market capitalizations of the two firms almost exactly mirrors one anotherin the period between the commencment of the litigation and the delivery ofthe jury verdict. This suggests that markets are constantly adjusting theirexpectations throughout the litigation process and will have formed reason-able expectations of the outcome of the litigation before the actual verdict isannounced. These market cap adjustments imply that markets find patentlitigations to be economically significant events, which is consistent with paststudies on patent litigation [20, 21, 11, 16].
Figure 2: Movement in market capitalization of the claimant and defendantfirms during litigation. Graph created using stock price and shares outstand-ing data provded by the Center for Research in Security Prices
9

3 Literature Review
A rich set of literature exists that documents the economic significance ofpatents, and by extension, patent litigation [16, 11, 21, 20]. The economic ef-ficacy of acquiring a patent has been widely discussed. The issue of whetherpatents provide firms optimal returns to R&D investments has been ques-tioned by academics and businessmen alike. Evidence indicates that firmsoutside the field of pharmaceuticals rely more heavily on other mechanismsto generate returns to R&D investment [19, 6]. Additionally, reasons forpatenting differ significantly between industries. In particular, many papers[10, 6, 19, 14] have used the distinction between complex and simple tech-nologies to explain the differing goals of patenting across industries. Simpletechnology is generally defined as technology that can be understood by asingle individual, whereas complex technologies cannot be understood by asingle individual [10]. In the patent system, this difference translates intoa difference in the number of patents used by a commercialized product orprocess [6]. Simple technologies generally utilize a small, discrete numberof patents per product, while complex technologies often require hundredsof patents to produce even one product. Thus, complex technology indus-tries are more likely to patent not to protect returns to R&D but ratherto strengthen negotiating positions. One possible explanation as to whypatents are not more effective in inducing R&D investment is the potentiallyprohibitive cost of patent enforcement [17]. While the true cost of patentenforcement is unknown, event studies can provide a rough measure as tohow the markets assess the price of litigation.
Recently, there have been a couple of studies investigating market reac-tion to patent litigations. Raghu et al. [21] examined market response atboth the announcement of a litigation suit and at the settlement or termi-nation of the lawsuit in order to gauge the economic impact of intellectualproperty litigation on the plaintiff and defendant of information technology(IT) firms. They found that news of an IP lawsuit was viewed unfavorablyfor the defendant, as the best possible result for the defendant would beto not lose. However, even in this best-case scenario, significant direct and
10

indirect costs are still incurred by the firm and seem to be large enoughfor the overall reaction of the market to be negative. On the other hand,they found that the response for the plaintiff both at the announcement andtermination of the litigation was significantly positive. The fact that therewere significant movements in the stock prices of the firms involved in thelitigation at these announcement dates suggests that IP litigations are eco-nomically significant events. Following Raghu et al, Narayanamoorthy &Zhou (2010) [20] focused specifically on analyzing market responses to thenews of a settlement in IP litigation cases and how different characteristicsof the case and the companies involved affect the market reaction. The re-sults of their study suggest that markets form expectations about the lawsuitprior to termination of the case and react accordingly to new informationas it becomes available. If this is the case, then markets should also formexpectations about the verdict of the litigation should it proceed to trial,and react accordingly when said verdict is announced. This is not a novelidea. A 1998 paper by Bhagat, Bizjack and Coles [2] examined market re-actions around filings and settlement announcement of corporate lawsuits.The rationale provided for not including data on verdicts was that “therewere so few verdict (or dismissal) announcements and the market is likely tohave information about the case that could suggest the verdict in advanceof it.”
This assumption is predicated on the belief that financial markets are atleast semi-strong-form informationally efficient [4, 21], meaning that mar-kets incorporate all publicly available information. If this is the case, thenwe can expect the stock prices to have already incorporated investors’ ex-pectations for the outcome of the litigation well before an official verdict isannounced [9]. Event studies, which examine the movement of stock pricesdue to specific events, is the most common methodology used to evaluatethe significance of market reactions to said events. This methodology wasoriginally developed to test the efficient market hypothesis: that marketsimmediately incorporate newly released information into stock prices andthat therefore investors cannot earn abnormal profits by trading on pub-licly available information. These event studies suggest that markets are in-
11

deed semi-strong-form informationally efficient, and subsequently, that thismethodology can be used to assess the significance of the event under study[4].
4 Research Hypothesis
It is evident that intellectual property rights disputes greatly affect thepresent value of expected cash flows of the firms involved, thus resulting inchanges in the valuation(s) of said firm(s). Figure 2 illustrates a rudimentarydemonstration of this fact. Moreover, given that markets continuously ad-just their expectations as new information is revealed throughout the courseof litigation implies that markets will have formed expectations about theresult of the litigation before a verdict is reached [9]. If the final verdict isin line with market expectations, then we would expect to see a relativelysmall deviation from the expected stock return for both firms. On the otherhand, if the final verdict is not in line with expectations, then the deviationsshould be much larger. These predictions are summarized in the table below.
Scenario ExpectationEffect onClaimant
Effect onDefendant
Claimant wins Claimant wins + (slightly)Claimant wins Defendant wins + �Defendant wins Claimant wins � +
Defendant wins Defendant wins + (slightly)
Regardless of expectations, the announcement of a verdict will reduce theuncertainty surrounding the firms involved in the litigation. This will havean unambigously positive effect on all firms involved in the case because whenuncertainty decreases, the risk surrounding the projected future cash flowsof the firm also decreases. Thus, when the firm that the market expects towin wins, we would expect there to be a positive effect on that firm’s stockreturn. However, the effect on the other firm is ambiguous. On the one
12

hand, uncertainty has been reduced, but at the same time the firm has lostthe litigation suit. Investors’ expectations are not identical. Specifically, wewould expect those who invest in the defendant firm to be more optimisticabout the defendant’s position than those investing in the claimant, and viceversa (it should be noted that expectations of shareholders of either firm arenot necessarily the same as the market expectations as a whole). Thus, theshareholders of the losing firms are likely to experience a negative shock evenif the result is in line with market expectations. However, the magnitudeof this surprise component is likely to be much smaller than if the entiremarket were surprised by this ruling. The overall effect on the market valueof the firm will depend on the relative sizes of the two components. Thatthere is still some sort of negative shock is unsurprising for two reasons.First, when an infringement suit is litigated to its conclusion, this is usuallya signal that both sides feel strongly about their position given that theychose to go to trial rather than settling [12]. Thus, it is unlikely that a clearwinner will be evident at the conclusion of a trial. Secondly, there is alwaysvariation around expectations and those who invest in either the claimantor defendant are likely to be more optimistic about that firm’s chances ofwinning the litigation than the market as a whole. Therefore, regardless ofwhether the verdict was in line with the general market expectations, thereis likely to be at least some sort of shock, though the magnitude of this shockis likely to be fairly small. On the other hand, if the verdict is contrary tomarket expectations, there is likely to be a large surprise component to thestock movement, the sign of which will depend on which firm was expectedto win.
5 Event Study Methodology
The methodology for evaluating whether market response to a verdictannouncement can be used to assess the probability of an initial verdictbeing overturned in the appeals process is divided into two parts. The firstpart is an event study. The second part is a regression utilizing the resultsfrom the event study. As mentioned above, event studies are commonly
13

used to assess the significance of specific events. There are four parts toevery event study [4]:
1. Defining the event day(s).
2. Measuring the stock’s return during the event period.
3. Estimating the expected return of the stock during this period.
4. Computing the abnormal return (actual return minus expected return).
The announcement or event date was defined as the first date where theresult(s) of the litigation were accessible by the public. This does not nec-essarily coincide with the final judgment date, where the results are madeofficial. Sometimes a jury will deliver a verdict a couple of months before afinal judgment is issued by the judge. In those cases, the date of the juryverdict is used as the event date as it is the first date that the markets willreceive the news. Additionally, a window of two days, which includes the dayof the verdict announcement and the day after, was used to account for thefact that we do not know what time the ruling was released to the public.If it were after the markets had closed for the day, then the reaction wouldnot be seen until the next day. In order to ensure that the abnormal returnwe calculate embodies the market reaction to the verdict, we use a two-dayevent window.
The expected return, measured in step 3, is the return that would haveaccrued to shareholders in the absence of the event. There are several modelsto measure expected return. The most widely used model, and the one usedin this study, is the market model which states that,
Rit = ↵i + �i ⇤Rmt + eit
where,
Rit The expected return on the stock of firm i at time t.
↵i,�i Firm specific parameters measuring how the security varied withthe market portfolio
14

Rmt The market return for period t.
The firm-specific parameters, ↵i and �i; were calculated using 200 dailyreturns in the period leading up the announcement. This period of 200returns must be free of firm-specific shocks that might cause its returnsto deviate from its baseline level as these will resulted in biased estimatedparameters6. However, it is not necessary that the market as a whole befree of shocks. So long as the shock is not specific to the firm that the eventstudy is being conducted on, then we can expect that the market returnswill also reflect the effect of these events.
I used the estimated ↵i and �i along with the return on the marketportfolio to calculate an expected return on the event study firm’s stock.The abnormal return was calculated by subtracting the actual return fromthe expected return. As I used a two-day event window, for each event study,the abnormal returns for day 0 and day 1 were summed to give a cumulativeabnormal return (CAR). The standardized CARs were calculated using theformula CARit
sit, where sit is the standard deviation of the regression residuals
[21].
6 Data
This study examines both the claimants (i.e. the firm(s) seeking dam-ages for infringement) and the defendants (the firm(s) that have allegedlyinfringed) of a patent infringement litigation. In court documents, the firstfirm to file a lawsuit is labeled the “claimant” regardless of who owns thepatent.
However, sometimes a firm that has potentially infringed upon anotherfirm’s patent(s) will preemptively file a lawsuit claiming that the patent(s)they have potentially infringed upon are invalid. The patent holder will thenfile a counterclaim arguing that not only are their patents not invalid, butthat the other firm has also infringed upon the patents. In these cases, the
6This can be anything from the commencement of a litigation to a change in upperlevel management of the firm
15

firm that has allegedly infringed on another firm’s patent will be labeled the“claimant” and the patent holder the “defendant” in court documents. Forconsistency, I define the person or firm that owns the patent in question asthe “claimant” and the person or firm that has allegedly infringed on thepatent the “defendant”, regardless of who filed first. As we are interested inobserving the market reactions to the announcement of a verdict, in orderto be useable, at least one firm involved in the litigation must be a publiclytraded company. I have excluded subsidiaries of publicly traded companiesfrom this study as there is no data readily available that points to the im-portance of the subsidiary to the parent firm.
The data collection process was two-fold: first, litigation data was ob-tained and the characteristics of the case ascertained. Once a useable samplewas assembled by paring down the dataset to cases where an appeal was filedwith at least one publicly traded firm, an event study analysis was done foreach publicly traded company, for a total of 142 event studies. Litigationdata was provided by Lex Machina, formerly the Stanford IP LitigationClearinghouse. Since there was no consolidated list of appealed cases, Ihad to create my own dataset by using information from the Lex Machinadatabase. I looked only at cases that went to trial from 2000 to 2012, a totalof 562 cases and determined whether each case had been appealed or notand documented the outcome of the appeal by manually going through thedocket events of the case.
A large majority (81%) of cases that went to trial were appealed; this isunsurprising given that only cases where both firms felt strongly about theirpositions would go to trial [12]. The true value is actually probably evenhigher, as firms involved in cases resolved in 2012 likely have not had thetime file an appeal.
I have also chosen to only include cases where an appeal was filed for tworeasons. First, as litigation is a costly affair, only the wealthiest firms areable to afford to exhaustively litigate a case; thus, it is highly likely that whena firm chooses not to appeal, it is not based on the strength of their position,but rather due to financial considerations. Secondly, as mentioned earlier,cases that were concluded in 2012 will likely not have had the chance to file
16
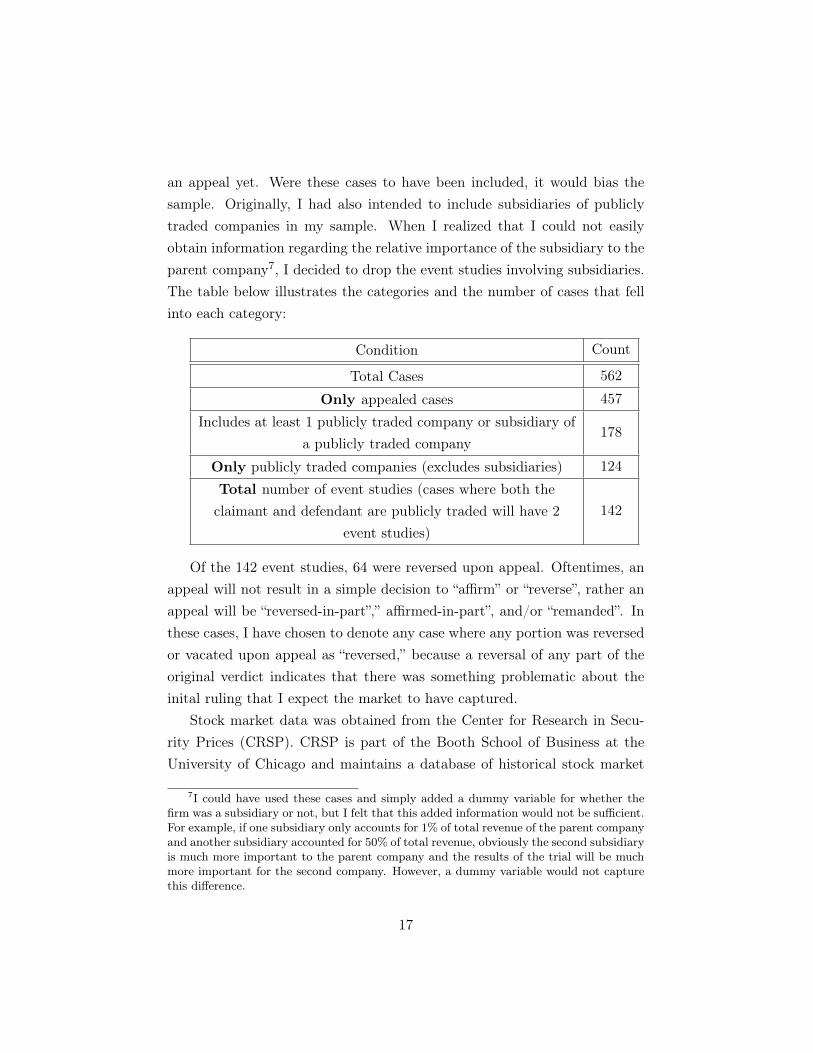
an appeal yet. Were these cases to have been included, it would bias thesample. Originally, I had also intended to include subsidiaries of publiclytraded companies in my sample. When I realized that I could not easilyobtain information regarding the relative importance of the subsidiary to theparent company7, I decided to drop the event studies involving subsidiaries.The table below illustrates the categories and the number of cases that fellinto each category:
Condition Count
Total Cases 562Only appealed cases 457
Includes at least 1 publicly traded company or subsidiary ofa publicly traded company
178
Only publicly traded companies (excludes subsidiaries) 124Total number of event studies (cases where both the
claimant and defendant are publicly traded will have 2event studies)
142
Of the 142 event studies, 64 were reversed upon appeal. Oftentimes, anappeal will not result in a simple decision to “affirm” or “reverse”, rather anappeal will be “reversed-in-part”,” affirmed-in-part”, and/or “remanded”. Inthese cases, I have chosen to denote any case where any portion was reversedor vacated upon appeal as “reversed,” because a reversal of any part of theoriginal verdict indicates that there was something problematic about theinital ruling that I expect the market to have captured.
Stock market data was obtained from the Center for Research in Secu-rity Prices (CRSP). CRSP is part of the Booth School of Business at theUniversity of Chicago and maintains a database of historical stock market
7I could have used these cases and simply added a dummy variable for whether thefirm was a subsidiary or not, but I felt that this added information would not be sufficient.For example, if one subsidiary only accounts for 1% of total revenue of the parent companyand another subsidiary accounted for 50% of total revenue, obviously the second subsidiaryis much more important to the parent company and the results of the trial will be muchmore important for the second company. However, a dummy variable would not capturethis difference.
17

prices. For each company, daily returns of the company’s stock were ob-tained for 200 days prior to the verdict announcement. If within these 200days there is another event, such as the commencement of the litigation,that could also result in an abnormal return, then I use daily returns start-ing from 2 days after the first event until the day before the verdict is issuedto estimate the firm specific parameters of the event study. Additionally,the market capitalization of the company was calculated by averaging themarket capitalizations for these 200 days as well.
7 Analysis
7.1 Reversal
The general probit regression model is as follows:
P (REV = 1) = �(�0 + �1|STDCAR|+ �2BOTH_PUB + �3CLAIM+
�4CAR_CLAIM + �5CWIN + �6MKTCAP + �7COMPLEX)
where,
REV a binary variable indicating whether the initial verdict was re-versed upon appeal
|STDCAR| the absolute value of the standardized cumulative abnormal re-turns
CLAIM a dummy variable indicating whether the firm used for the eventstudy was a claimant (claim = 1) or defendant (claim = 0)
CAR_CLAIM an interaction variable between the absolute value of thestandardized cumulative abnormal returns and
BOTH_PUB a dummy variable which indicates whether both companieswere publicly traded (both_pub = 1) or not (both_pub = 0)
18

CWIN a dummy variable which indicates whether the claimant (cwin =1) or defendant (cwin= 0) won the initial trial
MKTCAP the market capitalization of the event study firm, in millions
COMPLEX a dummy variable indicating whether the firm is in a complextechnology industry (complex = 1) or not (complex = 0)
�() the cumulative standard normal distribution function
As mentioned earlier, my dependent variable is a binary variable indicat-ing whether or not any portion of the initial ruling was overturned or va-cated upon appeal. The independent variables include the magnitude of thestandardized cumulative abnormal stock returns (CAR), whether both theclaimant and defendant firms were publicly traded, whether the firm is aclaimant or defendant, an interaction variable between whether the firm is aclaimant or defendant and the magnitude of the standardized CAR, whetherthe claimant or defendant won the initial trial, the market capitalization ofthe firm, and whether the industry of the firm is characterized as complexor not.
The dummy variable indicating whether or not the event study firm is theclaimant or defendant (CLAIM) is used because studies have shown that thereturns to winning an infringement case are asymmetric [3, 12]. Specifically,these studies show that wealth leakages occur such that defendant firmslose more wealth than claimant firms gain when the claimant firm files apatent infringement suit. This is in part due to the costs of the increasedprobability of financial distress that the defendant experience. By this logic,we might also expect the magnitude of the standardized CARs to dependon whether the firm was a claimant or defendant. This is also the reason Iinclude an interaction variable between the magnitude of the standardizedCARs and CLAIM as it is likely that the magnitude, and thus by extensionthe significance, of the standardized CARs differ between the claimant anddefendant for the same case. In particular, I would expect the reaction of
19
defendant firms to be much more extreme and perhaps a better measure ofthe probability of reversal upon appeal.
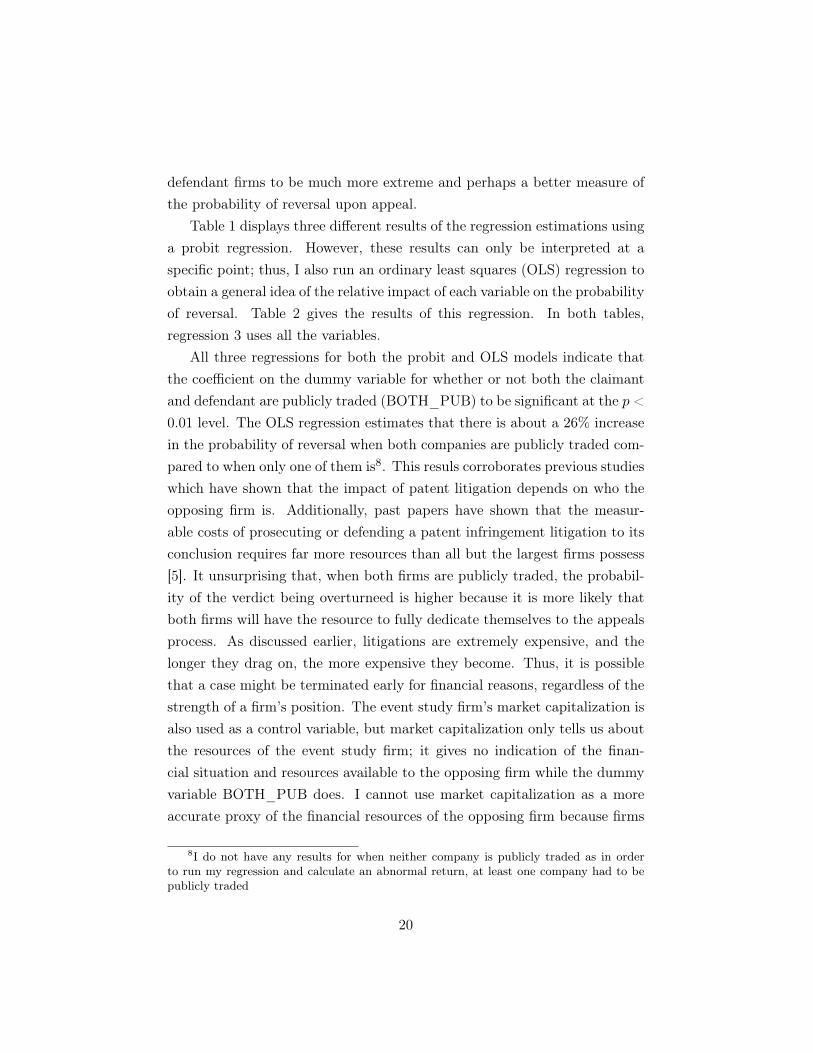
Table 1 displays three different results of the regression estimations usinga probit regression. However, these results can only be interpreted at aspecific point; thus, I also run an ordinary least squares (OLS) regression toobtain a general idea of the relative impact of each variable on the probabilityof reversal. Table 2 gives the results of this regression. In both tables,regression 3 uses all the variables.
All three regressions for both the probit and OLS models indicate thatthe coefficient on the dummy variable for whether or not both the claimantand defendant are publicly traded (BOTH_PUB) to be significant at the p <0.01 level. The OLS regression estimates that there is about a 26% increasein the probability of reversal when both companies are publicly traded com-pared to when only one of them is8. This resuls corroborates previous studieswhich have shown that the impact of patent litigation depends on who theopposing firm is. Additionally, past papers have shown that the measur-able costs of prosecuting or defending a patent infringement litigation to itsconclusion requires far more resources than all but the largest firms possess[5]. It unsurprising that, when both firms are publicly traded, the probabil-ity of the verdict being overturneed is higher because it is more likely thatboth firms will have the resource to fully dedicate themselves to the appealsprocess. As discussed earlier, litigations are extremely expensive, and thelonger they drag on, the more expensive they become. Thus, it is possiblethat a case might be terminated early for financial reasons, regardless of thestrength of a firm’s position. The event study firm’s market capitalization isalso used as a control variable, but market capitalization only tells us aboutthe resources of the event study firm; it gives no indication of the finan-cial situation and resources available to the opposing firm while the dummyvariable BOTH_PUB does. I cannot use market capitalization as a moreaccurate proxy of the financial resources of the opposing firm because firms
8I do not have any results for when neither company is publicly traded as in orderto run my regression and calculate an abnormal return, at least one company had to bepublicly traded
20
that are not publicly traded do not have market capitalizations; thus, inessence, a dummy variable on whether or not both firms are publicly tradedcaptures the exact same information but with much less variability.
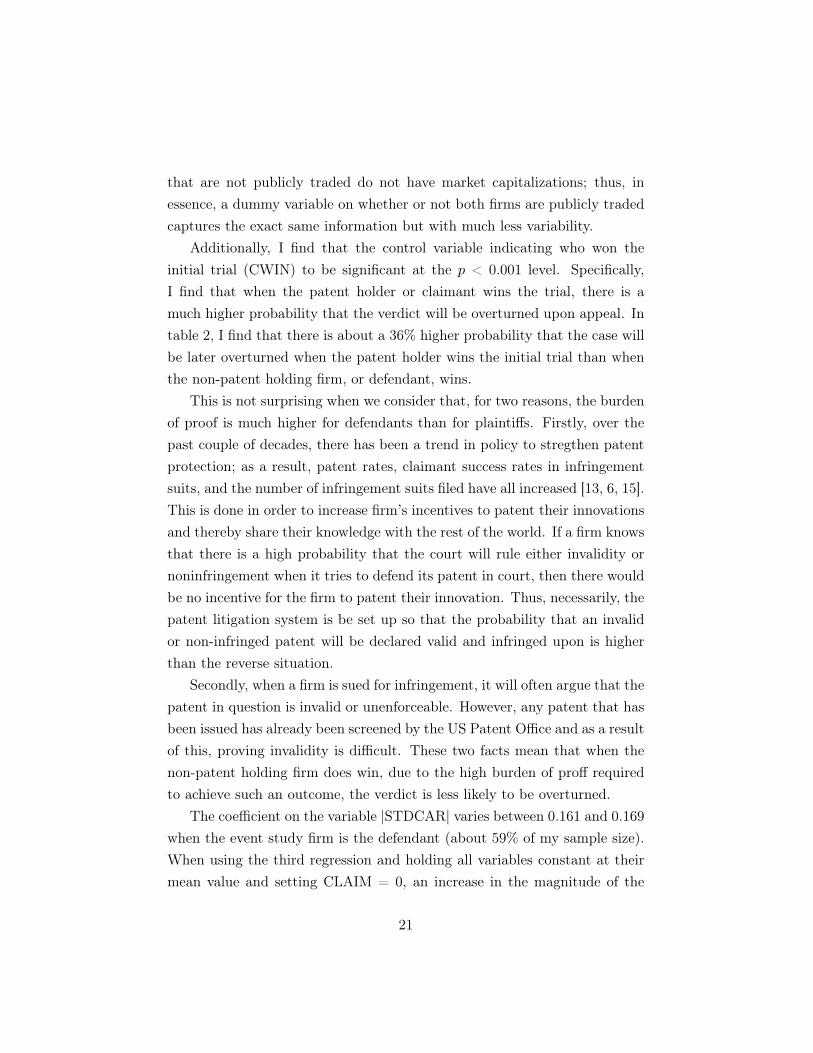
Additionally, I find that the control variable indicating who won theinitial trial (CWIN) to be significant at the p < 0.001 level. Specifically,I find that when the patent holder or claimant wins the trial, there is amuch higher probability that the verdict will be overturned upon appeal. Intable 2, I find that there is about a 36% higher probability that the case willbe later overturned when the patent holder wins the initial trial than whenthe non-patent holding firm, or defendant, wins.
This is not surprising when we consider that, for two reasons, the burdenof proof is much higher for defendants than for plaintiffs. Firstly, over thepast couple of decades, there has been a trend in policy to stregthen patentprotection; as a result, patent rates, claimant success rates in infringementsuits, and the number of infringement suits filed have all increased [13, 6, 15].This is done in order to increase firm’s incentives to patent their innovationsand thereby share their knowledge with the rest of the world. If a firm knowsthat there is a high probability that the court will rule either invalidity ornoninfringement when it tries to defend its patent in court, then there wouldbe no incentive for the firm to patent their innovation. Thus, necessarily, thepatent litigation system is be set up so that the probability that an invalidor non-infringed patent will be declared valid and infringed upon is higherthan the reverse situation.
Secondly, when a firm is sued for infringement, it will often argue that thepatent in question is invalid or unenforceable. However, any patent that hasbeen issued has already been screened by the US Patent Office and as a resultof this, proving invalidity is difficult. These two facts mean that when thenon-patent holding firm does win, due to the high burden of proff requiredto achieve such an outcome, the verdict is less likely to be overturned.
The coefficient on the variable |STDCAR| varies between 0.161 and 0.169when the event study firm is the defendant (about 59% of my sample size).When using the third regression and holding all variables constant at theirmean value and setting CLAIM = 0, an increase in the magnitude of the
21

standardized abnormal returns by 1 unit results in an increase in the prob-ability of reversal from 39.74% to 46.02%. The p-value on this coefficientis 13.8%. While the result is not extremely significant, neither is it trivial.It could be that this response is dampened due to the fact that the largemajority of verdicts (>80%) are appealed; thus, it is likely that markets as-sume that the litigation will be ongoing and, to some extent, are anticipatinga reversal. As a result, the market reaction will be subdued and might notreflect that true amount of shock. The OLS regression indicates that increas-ing the standardized CARs by 1 unit results in an increase of 5.21% in theprobability of reversal when using the specifications of the third regression.
However, when the event study firm is the claimant, the effective coef-ficient on the variable |STDCAR| is -0.057. The OLS regression in table 2estimates that an increase of 1 unit in the standardized CAR will result ina change of -1.35% in the probability of reversal. While the fact that thisnumber is negative seems to indicate that an increase in the magnitude ofthe CAR would actually result in a decrease in the probability of reversal,the proximity of this coefficient to zero would suggest that when the firm is aclaimant, the magnitude of the standardized CARs is virtually insignificantin predicting the probability that the ruling will be overturned upon appeal.
It is interesting that the defendant firm’s magnitude of the standardizedCAR is so much more effective in predicting the probability that a verdict willbe reversed than the claimant’s; however, this is not completely unexpected.As mentioned earlier, studies have shown that the defendant has much moreat stake in a patent infringement case than the claimant because there is amuch larger downside for the defendant [3, 12]. The worst case scenario forthe claimant is that their patent is declared invalid and they lose royalties,but they would not have to stop producing their product. Additionally, it isalso unclear whether the claimant will be able to take full advantage of thereduced competition should they win. Since there are usually more than twofirms competing in single market, it is highly likely that other firms mightcome in and take advantage of the reduced competition as well.
On the other hand, if the defendant loses, the firm could experiencesignificant financial distress due to the damages and royalties they would be
22

ordered to pay to the claimant firms. Even if the defendant could affordthese costs, they would probably have to cease producing and marketing theoffending product, which could significantly damage their long term profitprospects and cause them to lose market share if they are not able to reach alicensing agreement with the plaintiff. Thus, given that the defendants havemuch more at stake than the claimants, the stocks of defendant firms arelikely to react more strongly, both positively and negatively, to a surprisingverdict and would thereby be a better indicator than the reaction of theclaimant firms.
To explore this possibility, I split my sample based on whether the eventstudy firm was the claimant or defendant, and ran both probit and OLSregressions on each sample set. The results are displayed in table 3. Thep-value on the coefficient of |STDCAR| for the claimant sample is 66.6%for the probit regresion and 70% for the OLS regression, indicating that themagnitude of the standardized CARs is completely insignificant in predictingthe probablity that the initial verdict will be overturned upon appeal whenthe event study firm is the claimant. However, for the defendant, the p-values are 10.2% and 11%, respectively. As mentioned above, it is possiblethat this result is dampened by the market’s anticipation that an appeal willbe filed and that the true market movement is in reality much larger. Theseresults suggest that it is only in the case of defendant firm event studies thatmarket reaction is capable of providing us with a useable prediction of theprobability that the initial ruling will be overturned upon appeal.
Additionally, it also appears that the effect of whether or not the firm’sindustry is a complex technology industry on the probability of reversal dif-fers greatly between claimant and defendant firms. Specifically, the dummyvariable COMPLEX is very significant in predicting the probability of rever-sal for defendant firms with p-values of 0.8% and 1.1% for the probit and OLSregressions, respectively. The OLS regression indicates that when a firm ispart of an industry with complex technology, there is a 29.3% increase in theprobability of reversal when the firm is the defendant. However, when thefirm is a claimant, the coefficient on this variable is completely insignificant(p-value around 94%). One possible explanation for this discrepancy could
23

be due to the type of companies or individuals likely to sue large, publiclytraded firms. Aside from the 22 out of 83 firms where both the claimant anddefendant were publicly traded, it is possible that that claimant is a muchsmaller firm that is looking to capitalize on a larger firm infringing on one oftheir patents or a non-practicing entity (NPE). NPEs are patent owners whouse their patents solely for the purpose of suing infringers. It is much easierfor these plaintiffs to make a case when the defendant firm is in a complextechnology industry where the boundaries of a patented invention are lessclearly defined and where a single product can consist of hundreds, if notthousands, of different patented parts and processes. At the same time, dueto such complexities, it is also less difficult to make a compelling case fornon-infringement. These cases are thus much less clear cut. All these factorscombined make it much more likely that the initial verdict will be reversedupon appeal.
7.2 Degree of Reversal
I was also interested in measuring whether market reaction was a useful mea-sure of predicting the degree of reversal, given that a verdict is overturned. Iused a generalized linear model in order to deal with the fact that the degreeof reversal is a proportion between 0 and 1. As mentioned earlier, often-times, multiple patents are asserted in a single litigation; however, reversalis not an all or nothing game. Many times, cases will be reversed-in-part andaffirmed-in-part. In table 4, the degree of infringement reversal is definedas the proportion of the number of patent infringement rulings overturned.For example, if 5 patents were asserted and the ruling on 3 of them werereversed, then the degree of reveral would be 3/5.
Table 4 displays the results of this regression. As is immediately obvious,none of the variables included appear to have any impact on predicting thedegree of reversal. In fact, the p-value for the joint null hypothesis testthat the coefficients on all the variables are simultaneously 0 ranges from80% to 87%, suggesting that it is highly probable that all the coefficientsare 0. However, using the proportion of the patent rulings reversed is a
24

slightly flawed measure as cases which only asserted 1 patent will naturallyhave a 100% reversal proportion, while cases where multiple patents wereasserted will have a larger range of possible values. Thus, the range ofpossible proportions varies from case to case. Another consequence of usingthis measurement is that a case where 1 out of 1 patents asserted wereoverturned would have the same proportion of overturned verdicts as a casewhere 8 out of 8 patents were reversed; however, I would consider the latterto have a have a larger degree of reversal even though proportions do notreflect this.
In order to compensate for this, I also ran a linear OLS regression onthe number of patent rulings overturned per case and market reaction tothe initial verdict announcement. These results are much more significant.The p-value for the joint hypothesis test that all the coefficients are 0 rangesfrom around 1.6% to 10%; the results at least suggest that the variableshave some relation to the number of patent infringement verdicts overturnedper case despite being completely irrelevant when the proportion of verdictsoverturned is used as the dependent variable. The coefficient on |STDCAR|ranges from 0.174 to 0.2, with p-values ranging from 13% to 20%. It seemsto indicate that an increase in |STDCAR| by 1 unit will result in an increasein the number of patent rulings overturned by 0.174 to 0.2. It is not unusualthat this number is well below 1, because 39 out of the 59 event studies onlyhad 1 patent ruling reversed.
Additionally, the coefficient on the market capitalization of the firm isnegative and significant at the 10% significance level. This suggests thatmore patent infringement rulings are overturned when the market cap issmaller. This could be due to the fact that smaller firms have less resourcesavailable to them and are more likely to assert multiple patents in a singlelitigation case in order to cut costs. As it is impossible to overturn morepatent infringment rulings than the number of patents asserted, the thetwo numbers are necessarily positively correlated with each other. Finally,I also find that when both firms are publicly traded, 0.5 more rulings arelikely to be overturned. While this number is obviously not realistic, asyou cannot overturn half a ruling, it does suggest that when both firms are
25

publicly traded, the degree of overturning is likely to be higher. This valueis significant at the 15% significance level.
7.3 Probability of Appeal
Lastly, I decided to examine the relationship between the litigation casecharacteristics and the probability that the ruling will be appealed. I usedboth probit and OLS regressions to examine this relationship. My resultssuggest that the value of the coefficients in predicting the probability ofappeal do not vary significantly between claimant and defendant firms. Theprobit regression suggests that, when all values are held constant at theirmeans, an increase in the magnitude of the standardized CAR by 1 unitresults in a change in the probability of appeal from 77.34% to 84.13%; the p-value on the coefficient is 17.6%. This value, while not very significant, is nottrivial and it does seem to show that there might be a relationship betweenthe probability that an appeal is filed and the magnitude of the standardizedCAR. However, given that the large majority of verdicts are appealed at somepoint, this potential relationship may not be very meaningful in a real worldsense. Once again, as with the reversal regressions, I find that the coefficientfor the dummy variable on who won the initial trial indicates that when theclaimant wins, an appeal is about 17% more likely to occur, according tothe OLS regression. This value is significant at the 1% significance level forboth the probit and OLS regressions. The reasoning for this is the same aswith the reversal regressions analyzed above.
Finally, I find that when a firm is part of a complex technology industry,the initial verdict is less likely to be appealed; the p-value on this coefficientis around 10%. This is rather suprising given the fact that when the defen-dant is a publicly traded firm, the probability that the initial verdict will bereversed upon appeal increases when the firm’s industry is complex. How-ever, this result could be because my sample only includes publicly tradedfirms; thus, if a large publicly traded firm wins over a smaller firm withless resources, there is a lower probability than an appeal will be filed. Asmentioned earlier, the boundaries of complex patents are much less clearly
26

defined, making infringement cases less obvious than in the case of simpletechnology industries. When there is a large difference between the financialresources of the plaintiff and defendant, the winner of a litigation on patentswith complex technologies may be the firm with more resources to devote tothe litigation, as they will be able to hire lawyers and experts who are ableto argue their case more persuasively than a less well endowed firm or indi-vidual. These firms would also be the ones with the wherewithal to litigatethe case to its conclusion; however, if they win on the initial trial, there isno reason for them to file an appeal. Hence, the negative coefficient on theCOMPLEX dummy variable may be capturing this phenomenon. Addition-ally, simple technology industries, such as pharamaceuticals or chemicals,usually require a significant amount of research and development (R&D)before a patentable product is produced. As a result, small firms and indi-viduals are much less likely to hold patents in these types of industries andpatent litigation suits are much more likely to be between firms of relativelyequal resources, regardless of whether a firm is publicly traded or not. Whileit is true that the scope and boundaries of a simple technology patent aregenerally better defined, it is also a fact that only cases where both sides feelstrongly about their position will go to trial [12]. This might be another ex-planation for why cases with firms in simple technology industries are morelikely to be appealed than their complex counterparts.
8 Conclusion
Using a market based approach, I have studied the relationship between thecharacteristics of a patent litigation case and probability of reversal upon ap-peal. Previous works that have utilized the same approach have only focusedon cases where a settlement is reached, and these studies have shown thatmarkets view patent litigations as economically significant events. Based onthess results, I have chosen to look at a previously unexamined set of cases todetermine whether market reaction, along with other attributes of the case,are capable of predicting the probability of reversal upon appeal.
My results suggest that the impact of certain case characteristics is not
27

homogeneous across all publicly traded firms. In particular, the importanceof market reaction and industry type on the probability of reversal differssignificantly between publicly traded claimant and defendant firms. Theresults show that market reaction is related to the probability that the verdictwill be overturned upon appeal when the event study firm is the defendant,but is insignificant when the event study firm is the claimant. This differenceconfirms results from past studies that have shown there to be asymmetriceffects of litigation depending on whether a firm is a plaintiff or a defendant[3, 12].
Additionally, the effect of whether the event study firm is in a complextechnology industry also differs significantly between claimant and defendantfirms. This difference suggests that there might be a divergence in the waylarge, publicly traded defendant firms deal with claimant firms of differingsizes, especially within industries with complex technologies. Given that asingle product in a complex industry is likely to utilize hundreds, if not thou-sands, of different patents, when both firms are large and publicly traded,it is very probable that they both produce products that mutually infringeupon the other’s patents. Rather than going to trial, it is much more efficientand beneficial for both firms to enter into a cross-liscensing agreement witheach other. In fact, surveys have shown that firms in complex industriesoften patent their innovations for the sole purpose of strengthening their ne-gotiating power when forming these agreements [6, 13, 14, 17, 19]. However,when there is a significant discrepancy in the size and importance of thetwo firms, it is unlikely that the larger firm will have sufficient incentive toenter into a cross-liscensing agreement with the smaller one. Thus, whenthe smaller firm is the patent holder, it has no recourse but litigation9. Thesignificant difference in the coefficient on whether or not a firm is in a com-plex technology industry between the claimant and defendant firm samples,may in fact be capturing the divergence between how a large, publicly tradedfirm deals with other firms of varying sizes. Further work might look into
9When the larger firm is the patent holder, there is a higher possibility that it maydetermine that the costs of litigation outweigh the benefits and thus decide not to litigatethe infringed patent.
28
the magnitude and significance of these differences and whether smaller firmschoose to litigate because they have no other option or because they wantto take advantage of the potential royalties that would result from winninga patent litigation suit against a large, well-endowed firm.
My research also indicates that when the claimant wins the initial trial,there is a much higher probability that the verdict will be later overturned.Additionally, I looked at whether these same characteristics were related tothe degree of verdict reversal. My results show that the impact of marketcapitalization on the number of patents reversed is negative and significantat the 10% significant level. I argue that this result suggests that thatfirms with fewer resources are more likely to consolidate multiple relatedcases into one suit in order to save money; hence, they are more likely toassert mutliple patents in a single suit. The number of patents asserted ispositively correlated with the number of patents overturned upon appeal, asit is impossible to overturn more patents than are asserted. Due to this fact,the coefficient on market capitalization may in fact be due to a difference inthe way smaller firms approach litgations.
Finally, I examined whether the characteristics that are capable of pre-dicting the probability of reversal upon appeal are also related to the proba-bility that an appeal is filed. I found that the magnitude of the standardizedabnormal returns is positively related to the probability of that an appeal isfiled. However, the probability of appeal decreases when the publicly tradedfirm is in a complex technology industry.
These results help to further elucidate the relationship between patentlitigations and financial markets. I have shown that markets do exhibit somecapabilities in predicting whether an initial verdict will be overturned uponappeal. This suggests that in some cases market forces may be more capa-ble of rendering unbiased rulings than district courts. This is corroboratedby the fact that my results also show that courts are consistently handingdown too many initial rulings in favor of the patent holder. While this ispartly due to the way that the court system has been designed, it is in re-ality counter productive. If potential patent holders know that there is asignificantly higher probability that a ruling in their favor will be overturned
29

upon appeal than a ruling against them, there will still be incentives againstpatenting. I am not suggesting that the court system should be changedto be systematically biased in favor of patent holders, as this will result ina large increase in frivolous patent litigations suits. Rather, I would arguethat the slighter stricter requirements should be placed on claimant firms toprove that the patents in question have been infringed upon so that moreaccurate rulings will be given more often, thus reducing costs for all partiesinvolved and increasing overall welfare.
References
[1] Arrow, K.J. 1962. “Economic Welfare and the Allocation of Resourcesfor Inventions.” The Rate and Direction of Inventive Activity: Eco-nomic and Social Factors. Ed. R.R. Nelson. Princeton, NJ: PrincetonUniversity Press.
[2] Bhagat, S., Bizjak J., Coles, J., (1998). “The Shareholder Wealth Im-plications of Corporate Lawsuits.” Financial Management. 27, 5-27.
[3] Bhagat, S., Brickley, J. A., & Coles, J. L. (1994). “The Costs of In-efficient Bargaining and Financial Distress: Evidence from CorporateLawsuits.” Journal of Financial Economics, 35(2), 221–247.
[4] Bhagat, S., and Romano, R. (2002). “Event Studies and the Law: PartI: Technique and Corporate Litigation.” American Law and EconomicReview, 4(1), 141-167.
[5] Bouju, A. (1988). “Patent Infringement Litigation Costs” (Longman forthe Commission of the European Communities, London).
[6] Cohen, W. M., Nelson, R. R., & Walsh, J. P. (2000). “Protecting theirIntellectual Assets: Appropriability Conditions and Why US Manufac-turing Firms Patent (or Not).” NBER Working Paper #7522.
30

[7] Cutler, D. and Summers. L., (1988). “The Costs of Conflict Resolutionand Financial Distress: Evidence from the Texaco-Pennzoil Litigation.”Rand Journal of Economics. 19, 157-172.
[8] Dos Santos, B. L., Peffers, K., and Mauer, D. C. (1993). “The Impactof Information Technology Investment Announcements on the MarketValue of the Firm.” Information Systems Research, 4(1), 1–23.
[9] Fama, E. (1970). “Efficient capital markets: A Review of Theory andEmpirical Work”. Journal of Finance. 25(2), 383-417.
[10] Kash, DE and Kingston, W. (2000). “Patents in a World of ComplexTechnologies,” mimeo, George Mason University.
[11] Kitch, E.W. (1977). “The Nature and Function of the Patent System.”Journal of Law and Economics. 20, 265-90.
[12] Koku, P. S., Qureshi, A. A., & Akhigbe, A. (2001). “The Effects of Newson Initial Corporate Lawsuits.” Journal of Business Research. 53, 49–55.
[13] Kortum, S. & Lerner, J. (1999). “What is Behind the Recent Surge inPatenting?”. Research Policy, 28:1-22.
[14] Kusonaki, K.. Nonaka, I., and Nagata, A. (1998). “Organizational Ca-pabilities in Product Development of Japanese Firms.” OrganizationScience 9, 699 - 718.
[15] Lanjouw, J.O. and Lerner, J. (1997). “The Enforcement of IntellectualProperty Rights: A Survey of the Empirical Literature.” NBER WorkingPaper 6296
[16] Langinier, C., and Moschini, G. (2002). “The Economics of Patents: AnOverview.” Center for Agricultural and Rural Development Publications02-wp293, Center for Agricultural and Rural Development at Iowa StateUniversity.
31

[17] Lanjouw, J. O., and Schankerman, M. (2001). “Characteristics of PatentLitigation: A Window on Competition”. RAND Journal of Economics,32(1), 129–151, Spring.
[18] Lerner, Josh (1995) “Patenting in the Shadow of Competitors.” Journalof Law and Economics 38, 463-96
[19] Levin, R., Klevorick, A., Nelson, R.R., and Winter, S. (1987) "Ap-propriating the Returns from Industrial Research and Development."Brookings Papers on Economic Activity. 3, 783-820.
[20] Narayanamoorthy, G. & Zhou, H. (2010). “Market Reactions to An-nouncements of Patent Litigation Settlements.”
[21] Raghu T.S., Woo W., Mohan S.B., and Rao, H.R. (2007). “Market Re-action to Patent Infringement Litigations in the Information TechnologyIndustry”. Information Systems Frontiers. 10. 61-75.
[22] Sydell, L. (2012, July 30). “Samsung Fight AmongMany in Apple’s Patent War.” Retrieved fromhttp://www.npr.org/2012/07/30/157571532/samsung-fight-among-many-in-apples-patent-war
32

Table 1: Probit Regression for Reversal Upon AppealDependent Variable: Verdict Reversal
(1) (2) (3)|stdCAR| a 0.173+ 0.161 0.169+
(0.109) (0.113) (0.114)
claim b 0.582++ 0.569++ 0.581++
(0.308) (0.311) (0.313)
|stdCAR| x claim c -0.220+ -0.219+ -0.226+(0.145) (0.150) (0.150)
both_pub d 0.770⇤⇤ 0.776⇤⇤ 0.776⇤⇤(0.248) (0.243) (0.244)
claimant_wins e 1.085⇤⇤⇤ 1.116⇤⇤⇤ 1.102⇤⇤⇤(0.277) (0.288) (0.289)
mktcap f 0.00000101 0.000000778(0.00000168) (0.00000166)
complex g 0.382+ 0.372+(0.240) (0.241)
Constant -1.508⇤⇤⇤ -1.604⇤⇤⇤ -1.635⇤⇤⇤(0.334) (0.360) (0.371)
Observations 142 142 142p 0.0000372 0.0000412 0.000116chi2 30.13 29.90 29.53Standard errors in parentheses+ p < 0.15, ++ p < 0.1, ⇤ p < 0.05, ⇤⇤ p < 0.01, ⇤⇤⇤ p < 0.001
a The absolute value of the standardized cumulative abnormal return (CAR)b Dummy variable indicating whether the event study firm was the claimant or notc Interaction variable between the standardized CAR and the dummy variable onwhether the firm was a claimant or defendantd Dummy variable indicating whether both companies were publicly traded or note Dummy variable indicating if the claimant or defendant won the initial trialf Market capitalization, in millionsg Dummy variable indicating whether the firm was part of a complex or simple industry
33

Table 2: OLS Regression for Reversal Upon AppealDependent Variable: Verdict Reversal
(1) (2) (3)|stdCAR| a 0.0552+ 0.0496 0.0521
(0.0366) (0.0362) (0.0366)
claim 0.187++ 0.177++ 0.180++
(0.101) (0.102) (0.102)
|stdCAR| x claim -0.0687+ -0.0659+ -0.0678+(0.0460) (0.0450) (0.0452)
both_pub 0.265⇤⇤ 0.260⇤⇤ 0.261⇤⇤(0.0842) (0.0830) (0.0836)
claimant_wins 0.358⇤⇤⇤ 0.363⇤⇤⇤ 0.358⇤⇤⇤(0.0817) (0.0812) (0.0822)
mktcap 0.000000353 0.000000276(0.000000599) (0.000000601)
complex 0.119+ 0.115+(0.0788) (0.0795)
Constant 0.00458 -0.0146 -0.0244(0.0816) (0.0813) (0.0840)
Observations 142 142 142p 3.91e-09 5.58e-10 2.34e-09Standard errors in parentheses+ p < 0.15, ++ p < 0.1, ⇤ p < 0.05, ⇤⇤ p < 0.01, ⇤⇤⇤ p < 0.001
a See Table 1 for explanation of independent variables
34

Table 3: Probit Regression for Reversal Upon Appeal Divided by Claimantand Defendant Firms
Claimant Firms Defendant FirmsProbit OLS Probit OLS
(1) (2) (3) (4)|stdCAR| a -0.0450 -0.0114 0.256+ 0.0735+
(0.104) (0.0294) (0.157) (0.0456)
both_pub 0.834⇤ 0.272⇤ 0.877⇤ 0.277⇤(0.378) (0.118) (0.348) (0.118)
claimant_wins 1.242⇤⇤ 0.424⇤⇤ 0.842⇤ 0.255⇤(0.462) (0.139) (0.390) (0.107)
mktcap 0.00000206 0.000000709 -0.00000110 -0.000000309(0.00000286) (0.000000914) (0.00000209) (0.000000748)
complex -0.0263 -0.00929 0.946⇤⇤ 0.293⇤(0.379) (0.125) (0.357) (0.112)
Constant -1.100⇤ 0.126 -1.634⇤⇤⇤ -0.00536(0.537) (0.151) (0.464) (0.0994)
Observations 59 59 83 83p 0.0356 0.00117 0.00314 0.00000290chi2 11.94 17.85Standard errors in parentheses+ p < 0.15, ++ p < 0.1, ⇤ p < 0.05, ⇤⇤ p < 0.01, ⇤⇤⇤ p < 0.001
a See Table 1 for explanation of independent variables
35

Table 4: Degree of Infringement Reversal by ProportionShare of Patents For Which the Verdict Was Reversed
(1) (2) (3)|stdCAR| -0.0878 -0.0602 -0.0880
(0.231) (0.228) (0.229)
both_pub 0.00000920 0.0539 -0.0268(0.608) (0.639) (0.635)
|stdCAR| x both a 0.194 0.195 0.200(0.222) (0.224) (0.225)
claim_pub 0.142 0.166 0.121(0.655) (0.665) (0.671)
|stdCAR| x claim 0.0681 0.0456 0.0679(0.183) (0.178) (0.183)
claimant_wins -0.671 -0.726 -0.668(0.665) (0.653) (0.668)
mktcap -0.00000230 -0.00000230(0.00000276) (0.00000274)
complex -0.0863 -0.0856(0.426) (0.426)
Constant 0.789 0.709 0.834(0.797) (0.811) (0.841)
Observations 64 64 64p 0.798 0.875 0.871chi2 3.841 3.111 3.843Standard errors in parentheses⇤ p < 0.05, ⇤⇤ p < 0.01, ⇤⇤⇤ p < 0.001
a An interaction variable between |stdCAR| and whether both the claimant waspublicly traded or not. See Table 1 for explanation of the other independent variables
36
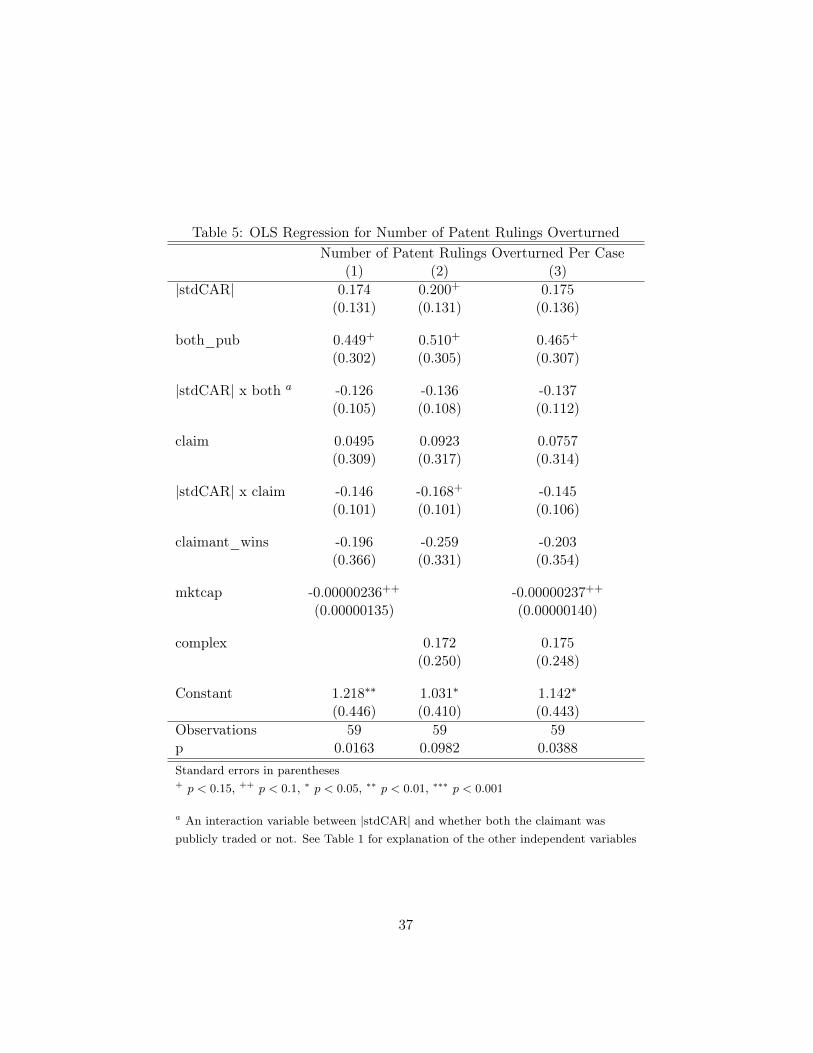
Table 5: OLS Regression for Number of Patent Rulings OverturnedNumber of Patent Rulings Overturned Per Case
(1) (2) (3)|stdCAR| 0.174 0.200+ 0.175
(0.131) (0.131) (0.136)
both_pub 0.449+ 0.510+ 0.465+(0.302) (0.305) (0.307)
|stdCAR| x both a -0.126 -0.136 -0.137(0.105) (0.108) (0.112)
claim 0.0495 0.0923 0.0757(0.309) (0.317) (0.314)
|stdCAR| x claim -0.146 -0.168+ -0.145(0.101) (0.101) (0.106)
claimant_wins -0.196 -0.259 -0.203(0.366) (0.331) (0.354)
mktcap -0.00000236++ -0.00000237++
(0.00000135) (0.00000140)
complex 0.172 0.175(0.250) (0.248)
Constant 1.218⇤⇤ 1.031⇤ 1.142⇤(0.446) (0.410) (0.443)
Observations 59 59 59p 0.0163 0.0982 0.0388Standard errors in parentheses+ p < 0.15, ++ p < 0.1, ⇤ p < 0.05, ⇤⇤ p < 0.01, ⇤⇤⇤ p < 0.001
a An interaction variable between |stdCAR| and whether both the claimant waspublicly traded or not. See Table 1 for explanation of the other independent variables
37

Table 6: Probit & OLS Regressions On The Probability Of An Appeal FiledDependent Variable: Probability of Appeal
Probit Regression OLS Regression(1) (2) (3) (4)
|stdCAR| a 0.223 0.114 0.0430++ 0.0263+(0.159) (0.0842) (0.0221) (0.0179)
claim -0.0835 -0.0303(0.325) (0.0803)
|stdCAR| x claim -0.159 -0.0284(0.183) (0.0338)
both_pub -0.242 -0.273 -0.0720 -0.0768(0.244) (0.246) (0.0634) (0.0638)
claimant_wins 0.658⇤⇤ 0.631⇤⇤ 0.179⇤⇤ 0.172⇤⇤(0.238) (0.234) (0.0659) (0.0654)
mktcap 0.00000175 0.00000179 0.000000370 0.000000366(0.00000196) (0.00000191) (0.000000390) (0.000000383)
complex -0.383++ -0.374+ -0.100++ -0.101++
(0.229) (0.228) (0.0602) (0.0598)
Constant 0.576⇤ 0.596⇤⇤ 0.726⇤⇤⇤ 0.724⇤⇤⇤(0.272) (0.222) (0.0694) (0.0635)
Observations 173 173 173 173p 0.0385 0.0249 0.0430 0.0337chi2 14.81 12.84Standard errors in parentheses+ p < 0.15, ++ p < 0.1, ⇤ p < 0.05, ⇤⇤ p < 0.01, ⇤⇤⇤ p < 0.001
a See Table 1 for explanation of independent variables
38