market orientation and its measurement in universities · market orientation and its measurement in...
TRANSCRIPT
AD
MI
NI
ST
RA
TI
VE
I
SS
UE
S
JO
UR
NA
L:
E
DU
CA
TI
ON
,
PR
AC
TI
CE
,
AN
D
RE
SE
AR
CH
Niculescu, Xu, Hampton, & Peterson DOI: 10.5929/2013.3.2.2
a
Market Orientation and its Measurement in Universities
Mihai Niculescu, Ph.D.New Mexico State University
Bing Xu, Ph.D.California State University – Dominguez Hills
Gerald M. Hampton, Ph.D.New Mexico State University
Robin T. Peterson, Ph.D.New Mexico State University
Historically, the measurement of market orientation has proved to be difficult, due to the low external validity of the concept. Existing scales exhibit acceptable properties in measuring market orientation in business organiza-tions, but are less accurate in the context of higher education institutions. This paper compares the performance of three scales – the MARKOR scale, the MKTOR scale, and the University MARKOR scale – in the context of aca-demic organizations. Results indicate that the MARKOR and the MKTOR scales need modifications, in order to accurately measure the construct in the new context. Evidence suggests that the student-oriented University MARKOR scale outperforms existing scales in predicting university performance.
Keywords: market orientation, higher education, MARKOR scale, MKTOR scale, University MARKOR
INTRODUCTION
Market orientation is a business philosophy directed toward employing all departments and subdivisions of the organization to discover and better serve consumer needs at a profit. It implies optimal implementa-tion of business activities and mechanisms that generate, disseminate, and respond to market intelligence
pertaining to the consumer (Kohli, Jaworski, & Kumar, 1993). Such a focus can allow organizations to increase their overall performance and, ultimately, achieve competitive advantages over rivals (Jaworski & Kohli, 1993; Kirca, Jay-achandran, & Bearden, 2005). Subsequently, the philosophy has been embraced by various organizations and ap-plied across cultures (e.g., Gray et al., 1998; Kirca & Hult, 2009) or in diverse settings – such as healthcare (White, Thompson, & Patel, 2001), tourism (Greenley & Matcham, 2001), retail banking (Papasolomou-Doukakis, 2002), or manufacturing (Anderson, Fornell, & Rust, 1997), among others. Its wide applicability has also stimulated scale devel-opment to address measurement inconsistencies across contexts, either by adapting existing scales to new contexts (e.g., MARKOR; Kohli, Jaworski, & Kumar, 1993), or by creating new context-specific scales (e.g.: Hampton, 2007), with no consensus regarding the superiority of one strategy over the other (Matsuno, Mentzer, & Rentz, 2005). In this con-text, the purpose of this paper is to examine the role of market orientation in a non-business context—that is, higher education—and to assess the relative merit of three scales in this role.
LITERATURE REVIEWThere is probably no one universally accepted and fully definitive conception of the market orientation concept (Kirca, Jayachandran, & Bearden, 2005; Kohli, Jaworski, & Kumar, 1993). For example, Avlonitis and Gounaris (1999) have suggested that this orientation should include both attitudinal and behavioral aspects. On the other hand, Lado, Maydeu-Olivares, and Rivera (1998) have emphasized the influence of distributors and environments on mar-ket orientation and defined it as a two-dimensional structure, including an overall market orientation and a country-specific residual. Meanwhile, Sharp (2001) has argued that market orientation should consider both the customer and product development, while Hult, Cravens, and Sheth (2001) regard market orientation as a phenomenon that

AD
MI
NI
ST
RA
TI
VE
I
SS
UE
S
JO
UR
NA
L:
E
DU
CA
TI
ON
,
PR
AC
TI
CE
,
AN
D
RE
SE
AR
CH
Niculescu, Xu, Hampton, & PetersonDOI: 10.5929/2013.3.2.2
VOLUME 3, ISSUE 2
b
describes elements in the “market value chain” of “culture–behaviors–processes–actions–performance.” Finally, Mat-suno, Mentzer, and Rentz (2005) posit that the perception of market orientation should embody influencing factors such as social, regulatory, and macroeconomic factors. The above-cited perceptions are indicative and by no means exhaustive of the diversity in views that exist (see Lings & Greenley, 2009).
Among all of the studies, market orientation theories set forth by Kohli, Jaworski, Narver, and Slater may be the most widely-accepted (Kohli & Jaworski, 1990; Narver & Slater, 1990). Their definitions of “market orientation” are extensions of the ‘marketing concept’—defined as a set of values and beliefs that always consider customers first and foremost (Webster, 1994, p. 203). According to them, marketing orientation is a process of continuous creation of superior value for customers. More specifically, Kohli and Jaworski (1990) view market orientation as the implementation of the marketing concept philosophy, which is centered on customer needs and organization profits. This view includes the generation of need- related intelligence on consumers, the dissemination of this intelligence to management, and the responsiveness to this intelligence in an organization, as well. However, Narver and Slater (1993, p. 243; 1990, p. 21) describe market orientation through a different perspective: as a type of business culture. They have noted that culture creation is the indispensable element for creating continuous superior value for customers and for obtaining sustainable competitive advantage. Hence, they have proposed that the marketing orientation is comprised of three components – customer orientation, competitor orientation, and inter-functional coordination. These considerations lead to a discussion of the merits of market orientation.
Advantages of Market Orientation Why has market orientation been studied by so many scholars? Why has the strategy been widely accepted by both practitioners and researchers in recent years? Previous studies outline and demonstrate its advantages.
Perhaps most importantly, market orientation can work—it often produces notable business performance. Some researchers have uncovered a robust positive relationship between market orientation and business performance (Jaworski & Kohli, 1993; McNaughton, Osborne, & Imrie, 2002; Noble, Sinha, & Kumar, 2002). Further, Dawes (2000) has deconstructed market orientation and found that one element – the competitor orientation component – is positively correlated to company profitability. He also has noted that customer orientation and responsiveness were important ingredients to business success. This finding was corroborated by Zhou, Brown, and Dev (2009). Finally, Brown et al. (2002) analyzed the customer orientation component of market orientation and found that it exerted a positive impact on overall customer performance ratings. Similar results have emanated from the work of Ledwith and O’Dwyer (2009).
There are other advantages forthcoming from the application of market orientation. Some studies show that this orientation can increase customer perceived value, and as a corollary, result in customer satisfaction and loyalty (McNaughton, Osborne, & Imrie, 2002; Reichheld & Sasser, 1990). In turn, this orientation is correlated with firm’s growth objectives driven by the identification and subsequent exploitation of untapped market opportunities (Baker & Sinkula, 2009). It also can lead to coordinated decision making and action between different organization depart-ments and divisions (Lings & Greenley, 2009), and may serve as a means of more adequately uncovering customer needs in e-business (Borges, Hoppen, & Luce, 2009). In addition, some researchers have found that it can create ef-fective means of achieving competitive advantages (Hunt & Morgan, 1995; Morgan, Vorhies, & Mason, 2009), more effective service innovation (Ordanini & Maglio, 2009), improved organizational commitment in the public sector (Ca-ruana, Ramaseshan, & Ewing, 1999, p. 65), wealth for the owners of a firm (McNaughton, Osborne, & Imrie, 2002), and an increase in new product success (Slater & Narver, 1994). Others have reported that market orientation can induce superior customer value and assist the organization in achieving effective and efficient experiential learning and enhanced supplier partnership status (Soehadi, Hart, & Tagg, 2001). Further, this strategy can lead and motivate front line employees to more adequately serve customers (Herington & Weaven, 2009). Finally, market orientation can assist in enhancing necessary leadership capabilities, and in attracting and retaining profitable customers (Narver & Slater, 1990). Given these advantages to business firms, can this orientation serve non-businesses, in general, and higher education institutions, in particular, in a beneficial manner?
AD
MI
NI
ST
RA
TI
VE
I
SS
UE
S
JO
UR
NA
L:
E
DU
CA
TI
ON
,
PR
AC
TI
CE
,
AN
D
RE
SE
AR
CH
Niculescu, Xu, Hampton, & Peterson DOI: 10.5929/2013.3.2.2
a
Applications of the Marketing Orientation to UniversitiesThere are a number of indications that suggest that a marketing orientation has potential benefit for universities. Studies have indicated that this philosophy may be applicable to nonprofit organizations and that it may also be re-lated to superior organization performance (Duque-Zuluaga & Schneider, 2008). In this regard, managerial ideology has provided a range of discourses and practices originating in the corporate world to higher education. Kolsaker (2008) has conducted research that suggests that managerial modes of operation can be beneficial to academia, provided that autonomous niches can be protected.
Of course, it is well-recognized that students are the primary focus of the university. That is, university education should aid in fulfilling their significant needs and not be directed merely toward immediate popularity with those students who enroll in individual professors’ classes. This latter process can be counter-productive to effective teach-ing and learning core values (Schuck, Gordon, & Buchanan, 2008). These needs include both immediate skills required for the first job, and philosophies, perceptions, insights, motivations, and other mental capabilities that are useful throughout one’s career (Walkenhorst, 2008). In turn, a true student-oriented marketing effort places the university ideology at the center of its efforts and uses marketing-specific tools to communicate such ideologies. In this case, a market orientation is closely related to relationship learning in much the same way as relationship development is in the corporate domain (Lai et al., 2009).
The benefits of applying market orientation in university settings include creating an environment that is student ori-ented. Customer orientation, competitor orientation, and inter-functional coordination are values that can help ad-ministrators and instructors to better understand and structure the school environment (Oplatka & Hemsley-Brown, 2007). For this orientation to be effective, however, both administrators and instructors must be convinced that the impact upon students will be favorable. The results of implementing this philosophy are likely to include better ser-vice for customers (i.e., students) and competitive advantage over rival institutions (Voon, 2007). In turn, evaluations of market orientation require measuring instruments, usually scales, either adapted from the business environment (e.g., MARKOR; Kohli, Jaworski, & Kumar, 1993), or created for the higher education specific context (e.g., Hampton, 2007). Next, we summarize the most popular scales developed to measure market orientation.
Marketing Orientation ScalesAlthough most researchers understand the nature of market orientation and are aware of the probable benefits, the cognitions on how to best measure market orientation are diverse. Kohli and Jaworski’s (1990) seminal article that defined market orientation was followed by more same-author research to construct a market orientation scale and its corresponding business performance measurement scale. This scale is labeled as the “MARKOR” scale and contains 32 items. At the same time, Narver and Slater (1990) created a competing scale based on their understanding of market orientation and its components. This new measurement device was entitled the “MKTOR” scale, and included 15 refined items that captured three dimensions. Deng and Dart (1994) expanded Narver and Slaver’s conceptualiza-tion to incorporate profitability as the fourth component of market orientation, and then produced another market orientation scale with 30 items. Later, Matsuno, Mentzer, and Rentz (2005) extended the scope of market orientation and created an expanded scale (EMO) embodying 22 purified items. Finally, Lado, Maydeu-Olivares, and Rivera (1998) generated a two-dimensional structure scale with 30 items as components.
Obviously, there are diverse outlooks on market orientation measurement, as well as the effectiveness and efficiency of each scale. On the one hand, some researchers (Siguaw & Diamantopoulos, 1995) have questioned the authentic-ity of Narver and Slater’s MKTOR instrument. They conducted an exploratory research and found that Narver and Slater’s original items were just partially related to the proposed dimensions, and illustrated that the scale did not fit the data well.
On the other hand, research by Chakrabarty and Roge (2003) and Han, Kim, and Srivastava (1998) have supported the Narver and Slater’s MKTOR scale and argued that individual dimensions of this scale fit the data adequately. Addition-ally, Mavondo and Farrell (2000) compared the reliability of the MARKOR and the MKTOR scales and suggested that the MKTOR scale was superior to the MARKOR instrument in cross-culture, cross-industry studies. Finally, Soehadi, Hart, and Tagg (2001) contrasted the MARKOR and Deng & Dart (1994) scales and found that the latter of the two
AD
MI
NI
ST
RA
TI
VE
I
SS
UE
S
JO
UR
NA
L:
E
DU
CA
TI
ON
,
PR
AC
TI
CE
,
AN
D
RE
SE
AR
CH
Niculescu, Xu, Hampton, & PetersonDOI: 10.5929/2013.3.2.2
VOLUME 3, ISSUE 2
b
exhibited higher reliability and validity.
Although there have been numerous studies relating to market orientation scales, these studies have focused more on business than on nonprofit organizations. In particular, few studies have emphasized the university context and its unique needs. An exception, the University MARKOR scale (Hampton, 2007; Hampton et al., 2009), described below, was generated to fulfill this gap.
The University MARKOR scale measuring student-focused market orientation is based on previous works designed to measure market orientation (Caruana, Ramaseshan, & Ewing, 1998, 1999; Kohli, Jaworski, & Kumar, 1993) and cus-tomer orientation (Brady & Cornin, 2001; Saxe & Weitz, 1982). The scale development resulted in a focus shift from an organizational and top management level to a faculty level perspective. The purpose was to concentrate on those market oriented activities faculty commonly engage in when they interact with students. The 44-item instrument assesses several dimensions of student orientation (see Appendix). Intelligence generation and responsiveness are similar to the dimensions in the MARKOR scale. In addition, the intelligence dissemination dimension in MARKOR was replaced with two new factors: 1) advising and mentoring of students, and 2) department head role or leadership, as these two were important activities of professors in their educational service delivery. While similar to items in the market orientation scales, the new factors are clearly student-oriented and pertain to faculty activities.
The development of this student-oriented scale may be the result of inconsistent measurement via traditional mar-ket orientation scales and suggests that research analyzing the performance of adapted and context-specific market orientation scales in universities is at the point where further progress is needed. This leads us to an examination of the unique needs of these institutions.
Market Orientation Scales in the Context of Universities – A ComparisonUniversities have different features from those found in business enterprises. For example, university activities are related to and heavily dependent upon a knowledge-based culture. Thus, existing marketing orientation scales may not have the capability to appreciate the nature of university goals and functions. Therefore, market orientation scales suitable to businesses may not be entirely appropriate for universities.
In order to be of assistance to institutions of higher learning, an assessment of competing university scales is vital. The authors modified the original 32 items of the MARKOR scale and the 15 items of the MKTOR scale to adapt them to the university context (see Appendix). Then, a comparison was made of these two scales and the student-directed University MARKOR scale (Hampton, 2007). The aim of this research is to evaluate the effectiveness of the three scales in the context of universities and to find out which best predicts university performance. The methodology involved survey research and structural equation modeling, as discussed below.
METHODSample and ProcedureThree hundred randomly chosen faculty members of a southwestern U.S. university were invited to participate in vol-untary field surveys over an eight month period. One hundred and eighty of these professors responded positively to the invitation and were periodically given a set of questionnaires on several topics, including the measurement of marketing orientation via three independently developed scales: (1) MARKOR (Kohli & Jaworski, 1993), (2) MKTOR (Narver & Slater, 1990), and (3) University MARKOR (Hampton, 2007; Hampton et al., 2009) scales. In addition, we sepa-rately measured perceived organization performance. Tenured and tenure-track faculty from 45 different segments of the university completed the surveys, and yielded a total of 122 usable questionnaires.
MeasurementThe sample respondents were asked to complete paper-and-pencil surveys. In turn, they read a set of instructions, and then completed multi-item measures of the various constructs of interest. Next, the sample members provided general comments relating to their department’s performance over the last five years in an open-ended section. The final portion of the survey constituted requests for demographic information.
AD
MI
NI
ST
RA
TI
VE
I
SS
UE
S
JO
UR
NA
L:
E
DU
CA
TI
ON
,
PR
AC
TI
CE
,
AN
D
RE
SE
AR
CH
Niculescu, Xu, Hampton, & Peterson DOI: 10.5929/2013.3.2.2
a
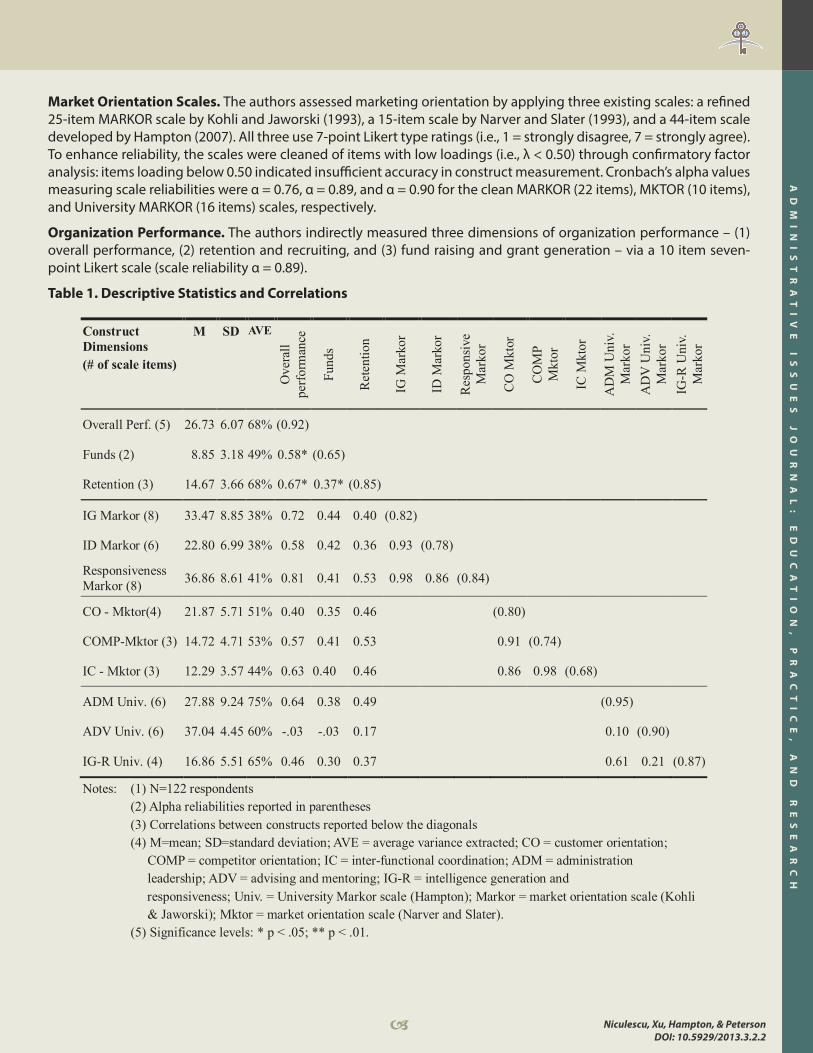
Market Orientation Scales. The authors assessed marketing orientation by applying three existing scales: a refined 25-item MARKOR scale by Kohli and Jaworski (1993), a 15-item scale by Narver and Slater (1993), and a 44-item scale developed by Hampton (2007). All three use 7-point Likert type ratings (i.e., 1 = strongly disagree, 7 = strongly agree). To enhance reliability, the scales were cleaned of items with low loadings (i.e., λ < 0.50) through confirmatory factor analysis: items loading below 0.50 indicated insufficient accuracy in construct measurement. Cronbach’s alpha values measuring scale reliabilities were α = 0.76, α = 0.89, and α = 0.90 for the clean MARKOR (22 items), MKTOR (10 items), and University MARKOR (16 items) scales, respectively.
Organization Performance. The authors indirectly measured three dimensions of organization performance – (1) overall performance, (2) retention and recruiting, and (3) fund raising and grant generation – via a 10 item seven-point Likert scale (scale reliability α = 0.89).
Table 1. Descriptive Statistics and Correlations Construct Dimensions (# of scale items)
M SD AVE
Ove
rall
perf
orm
ance
Fund
s
Ret
entio
n
IG M
arko
r
ID M
arko
r
Res
pons
ive
Mar
kor
CO
Mkt
or
CO
MP
Mkt
or
IC M
ktor
AD
M U
niv.
M
arko
r A
DV
Uni
v.
Mar
kor
IG-R
Uni
v. M
arko
r
Overall Perf. (5) 26.73 6.07 68% (0.92)
Funds (2) 8.85 3.18 49% 0.58* (0.65)
Retention (3) 14.67 3.66 68% 0.67* 0.37* (0.85)
IG Markor (8) 33.47 8.85 38% 0.72 0.44 0.40 (0.82)
ID Markor (6) 22.80 6.99 38% 0.58 0.42 0.36 0.93 (0.78)
Responsiveness Markor (8) 36.86 8.61 41% 0.81 0.41 0.53 0.98 0.86 (0.84)
CO - Mktor(4) 21.87 5.71 51% 0.40 0.35 0.46 (0.80)
COMP-Mktor (3) 14.72 4.71 53% 0.57 0.41 0.53 0.91 (0.74)
IC - Mktor (3) 12.29 3.57 44% 0.63 0.40 0.46 0.86 0.98 (0.68)
ADM Univ. (6) 27.88 9.24 75% 0.64 0.38 0.49 (0.95)
ADV Univ. (6) 37.04 4.45 60% -.03 -.03 0.17 0.10 (0.90)
IG-R Univ. (4) 16.86 5.51 65% 0.46 0.30 0.37 0.61 0.21 (0.87)
Notes: (1) N=122 respondents (2) Alpha reliabilities reported in parentheses (3) Correlations between constructs reported below the diagonals (4) M=mean; SD=standard deviation; AVE = average variance extracted; CO = customer orientation; COMP = competitor orientation; IC = inter-functional coordination; ADM = administration leadership; ADV = advising and mentoring; IG-R = intelligence generation and responsiveness; Univ. = University Markor scale (Hampton); Markor = market orientation scale (Kohli & Jaworski); Mktor = market orientation scale (Narver and Slater). (5) Significance levels: * p < .05; ** p < .01.

AD
MI
NI
ST
RA
TI
VE
I
SS
UE
S
JO
UR
NA
L:
E
DU
CA
TI
ON
,
PR
AC
TI
CE
,
AN
D
RE
SE
AR
CH
Niculescu, Xu, Hampton, & PetersonDOI: 10.5929/2013.3.2.2
VOLUME 3, ISSUE 2
b
ANALYSIS AND RESULTSThe authors adopted a two-step approach, as described in Anderson and Gerbing (1982, 1988) to evaluate the com-peting models. This procedure generated the assessment and refinement of the measurement models, followed by a separate estimation of the structural models.
Measurement ModelsThe items in the measurement models were refined via confirmatory factor analysis. The item loadings exceeding the recommended 0.5 threshold level suggest acceptable convergent validity (Anderson & Gerbing, 1982). In turn, all of the final scales included in the study displayed evidence of convergent validity. Table 2 presents a summary of fit indices and the results of confirmatory factor analysis.
Table 2. Summary of Measurement Models
MARKOR MKTOR
UNIVERSITY
MARKOR
Organization
Performance
Convergent validity Yes Yes Yes Yes
Discriminant validity No No Yes Yes
Dimensions 3 3 3 3
Model fit χ2 (204) = 486.3
CFI = 0.78 NFI = 0.68 TLI = 0.75
RMSEA = 0.107
χ2 (30) = 49.5
CFI = 0.96 NFI = 0.92 TLI = 0.95
RMSEA = 0.073
χ2 (101) = 156.3
CFI = 0.96 NFI = 0.90 TLI = 0.95
RMSEA = 0.067
χ2 (32) = 61.6
CFI = 0.95 NFI = 0.91 TLI = 0.92
RMSEA = 0.087 Notes: Sample size N = 122.
The authors tested for discriminant validity by comparing the average variance extracted (AVE) against a recom-mended 50% threshold level (i.e., the variance explained by the items should be higher than the variance due to uniqueness). Next, we investigated whether correlations between constructs were significantly different from 1 (For-nell & Larcker, 1981); in this case, a lower correlation indicated that each dimension measured different aspects of the construct and suggested discriminant validity. The authors found evidence of discriminant validity in the University MARKOR and Organization Performance scales, only. The MARKOR and MKTOR scales passed the convergent valid-ity tests, but failed to produce sufficient discriminant validity, as the construct dimensions almost completely over-lapped (see also Table 1 for correlations between construct dimensions).
Structural ModelsThe authors made use of structural equation modeling to assess inter-construct relationships between market orien-tation and organization performance. Standard practice suggests that accounting for measurement error before the estimation of structural coefficients abates interpretational confounding (Anderson & Gerbing, 1988). The procedure implies that (a) setting the measurement error to (1-α) x (variance of the sum of items) for each construct dimension and (b) using the sum of the scale items as the construct measure – are appropriate. Significantly, inadequate psycho-metric properties in the MARKOR and MKTOR scales resulted in impossible estimates in the structural models. Lack of convergence was not a factor when market orientation was operationalized via the University MARKOR scale; the structural model testing the relationships between market orientation and organization performance exhibited ad-equate fit, with χ2(6) = 6.57 (n.s.), CFI = 0.99, NFI = 0.97, TLI = 0.99, AGFI = 0.93, and RMSEA = 0.03. The reduced model with path coefficients corrected for attenuation is shown in Figure 1.
Finally, the authors tested for common method variance. As per Podsakoff et al. (2003), they separately loaded all items in the model on a first-order factor to account for same-source common variance. Re-estimated loadings sug-

AD
MI
NI
ST
RA
TI
VE
I
SS
UE
S
JO
UR
NA
L:
E
DU
CA
TI
ON
,
PR
AC
TI
CE
,
AN
D
RE
SE
AR
CH
Niculescu, Xu, Hampton, & Peterson DOI: 10.5929/2013.3.2.2
a
gest that common method bias is unlikely to play a significant role, as the pattern of relationships remained consis-tent with initial results even after accounting for common variance.
FIGURE 1. University MARKOR – Standardized Structural Estimates
Market orientation Performance Measures
Structural model: χ2
(6) = 6.57 (n.s.), CFI=0.99, NFI=0.97, TLI=0.99, AGFI=0.93, and RMSEA=0.03 Note: Significance levels – ** p < .01, and * p < .10
β4= -0.18**
β5=0.17*
β3=0.58**
β2=0.44**
β1=0.64** ADMINISTRATION LEADERSHIP
(University ADM)
ADVISING & MENTORING
(University ADV)
INTELLIGENCE GENERATION &
RESPONSIVENESS (University IG-R)
Funding
Retention
Overall Performance
The Impact of Market Orientation on University Performance Figure 1 shows that market orientation significantly impacts university performance through its three components measured via the University MARKOR scale: administration leadership (University ADM), advising and mentoring (University ADV), and intelligence generation and responsiveness (University IG-R), respectively. First, administration leadership significantly drives all performance measures (overall performance, β1 = 0.64, p < 0.01; funding, β2 = 0.44, p < 0.01; student retention, β3 = 0.58, p < 0.01). These results suggest that market orientation should focus on strong leadership to make impacts in the competitive market place. It also seems that administration leadership may be an overlooked component that other market orientation scales could adopt to improve their predictive power in the business sectors. While research in the non-profit sector is frequently driven by findings in the business areas, there is no reason to believe that aspects of non-profit business research cannot be transferred to the business sector.
Second, advising and mentoring (University ADV) has a significant impact on overall performance (β4 = – 0.18, p < 0.01). While the negative effect may come as a surprise, we recognize that advising and mentoring takes valuable time. An increase in time spent on advising and mentoring comes at a cost, as this time would otherwise be spent on teaching, an activity that is arguably more beneficial to students.
Third, intelligence generation and responsiveness (β5 = 0.17, p < 0.10) only has a positive effect on overall perfor-mance. The weaker effect relative to that of the other two market orientation dimensions on overall performance may (1) be a particular aspect of the non-profit sector, and (2) explain the poor predictive power of the competing MARKOR scale that shares this component with University MARKOR, but not the components of administration lead-
AD
MI
NI
ST
RA
TI
VE
I
SS
UE
S
JO
UR
NA
L:
E
DU
CA
TI
ON
,
PR
AC
TI
CE
,
AN
D
RE
SE
AR
CH
Niculescu, Xu, Hampton, & PetersonDOI: 10.5929/2013.3.2.2
VOLUME 3, ISSUE 2
b
ership and intelligence generation and responsiveness. The effect also suggests that context-specific scales (e.g., university settings) may be more appropriate to measure market orientation than adaptations of no context-specific scales.
DISCUSSIONStrong evidence in the literature suggests that market orientation often engenders business enterprise profitability and superior performance. It would seem that the strategy could be equally beneficial to nonprofit organizations. In-stitutions that pursue this game plan can benefit through the usage of marketing orientation assessments. However, the construct can suffer from deficient measurement outside business contexts. Questionable measurement validity is especially prevalent in higher education applications. In this context, the present work compares three scales to assist universities in tracking market orientation with minimal measurement error.
The authors have uncovered evidence that popular scales in the business-to-business sector – such as the MARKOR (Kohli & Jaworski, 1990) and MKTOR (Narver & Slater, 1990) scales – are not appropriate for the assessment of market orientation in universities. The authors contrast the two established scales against a recently generated scale specifi-cally developed for higher education (Hampton, 2007; University MARKOR). In turn, the results of this comparison suggest that a university-specific scale may be more useful in higher education settings, as it was found to outper-form established scales in predicting university performance, while exhibiting superior psychometric properties.
From a practical standpoint, administrators in universities are in a position to utilize the market orientation strategy to guide various consequential policy decisions. They may use it to determine superior approaches to the achieve-ment of student satisfaction and educational accomplishment, as well as subsequent improvements in enrollment, prestige, and student retention rates. Such goals are aligned to any university’s mission and highly dependent on market orientation in the university. Universities operate in a competitive environment and the market orientation may allow institutions that adopt it to achieve comparative advantages over rivals that do not.
A market orientation stipulates that the university focuses its efforts on students. Of course, these institutions have a number of constituencies, including legislators, employers, students’ parents, and the public at large. These cannot be ignored. But a market orientation does not require this. It does stipulate, however, that students are the most im-portant constituent, and that efforts should be extended to satisfy their needs. Failure to do this is likely to result in failure to satisfy needs of the other important publics.
Some university studies may find market orientation in universities, especially their own institution, to be unrelated to performance, and may, in turn, trace inconclusive or even negative results to inefficient measurement. We suggest an instrument that is specifically adapted to the higher education context that may capture aspects otherwise omit-ted by traditional (i.e., non-specific) or business-based measurement tools.
Finally, this study provides a theoretical and practical foundation to expand research on further applications of mar-ket orientation in nonprofit organizations outside academia, such as charitable, religious, and governmental orga-nizations. Some of these possess properties, bearing on top management decision-making, that are analogous to universities.
LIMITATIONS AND FURTHER RESEARCHSeveral constraints of the study may pose limitations and conditions upon the generalizability of the findings. First, the study data originated from respondents in one university. This places constraints on external validity findings, and recommendations should pertain mainly to universities of similar size and student population. Second, our sample size – while justified by standard practice “from the perspective of accurate parameter estimation” in the population (Fabrigar, Porter, & Norris, 2010) – may have resulted in missing of other interesting effects, had its size been larger. Some effects may have been omitted from the analysis as they did not reach traditional significance levels. Third, col-lecting within-subject data at different points in time raises several issues. For example, the findings may be subject to order effects, as scales were completed in the same sequence. However, if sufficient time was allowed to erase this possible bias between surveys, a change in respondents’ perceptions about the university from one survey to another would deem the impact of market orientation on organizational performance measures less relevant.
AD
MI
NI
ST
RA
TI
VE
I
SS
UE
S
JO
UR
NA
L:
E
DU
CA
TI
ON
,
PR
AC
TI
CE
,
AN
D
RE
SE
AR
CH
Niculescu, Xu, Hampton, & Peterson DOI: 10.5929/2013.3.2.2
a
Scale validation and refinement is a never-ending process. This being the case, the authors suggest that further stud-ies should be undertaken to evaluate the market orientation scales in other higher education-related contexts. Fu-ture studies could use hierarchical linear modeling to analyze responses to market orientation within and between universities, and at the same time producing higher response rates and bigger sample sizes. Another research route could focus on measuring the impact of market orientation in universities on student-related outcomes, such as stu-dent recruitment, student quality, learning outcomes, student turnover, graduation rates, and job placement, or on university fundraising efforts and financial help from donors.
REFERENCESAnderson, E. W., Fornell, C., & Rust R. T. (1997). Customer satisfaction, productivity, and profitability: Differences be-tween goods and services. Marketing Science, 16(2), 129–145.
Anderson, J. C., & Gerbing, D. W. (1982). Some methods for respecifying measurement models to obtain unidimen-sional construct measurement. Journal of Marketing Research, 19, 453-460.
Anderson, J. C., & Gerbing, D. W. (1988). Structural equation modeling in practice: A review and recommended two-step approach. Psychological Bulletin, 103, 411-423.
Avlonitis, G. J. & Gounaris, S. P. (1999). Marketing orientation and its determinants: An empirical analysis. European Journal of Marketing, 33(11/12), 1003-1037.
Baker, W. E., & Sinkula, J. M. (2009). The complementary effects of market orientation and entrepreneurial orienta-tion on profitability in small business. Journal of Small Business Management, 47(4), 443-464.
Borges, M., Hoppen, N., & Luce, F. B. (2009). Information technology impact on market orientation in e-business. Journal of Business Research, 62(9), 883-890.
Brady, M. K., & Cornin, J. (2001). Customer orientation: Effects on customer service perceptions and outcome behav-iors. Journal of Service Research, 3(3), 241 - 252.
Brown, T. J., Mowen, J. C., Donavan, D. T., & Licata, J. W. (2002). The customer orientation of service workers: Personal-ity trait effect on self- and supervisor performance ratings. Journal of Marketing Research, 39(1), 110-119.
Caruana, A., Ramaseshan, B., & Ewing, M.T. (1998). Do universities that are more market oriented perform better? International Journal of Public Sector Management, 11(1), 55 - 70.
Caruana, A., Ramaseshan, B., & Ewing, M. T. (1999). Market orientation and performance in the public sector: The role of organizational commitment. Journal of Global Marketing, 12(1), 59- 79.
Chakrabarty, S., & Roge, J. N. (2003). Measuring market orientation: Further evidence on Narver and Slater’s three-component scale. Psychological Reports, 93, 1070-1072.
Dawes, J. (2000). Market orientation and company profitability: Further evidence incorporating longitudinal data. Australian Journal of Management, 25(2), 173-199.
Deng, S., & Dart J. (1994). Measuring market orientation: A multi-factor, multi-item approach. Journal of Marketing Management, 10, 725-742.
Duque-Zuluaga, L. C., & Schneider, U. (2008). Market orientation and organizational performance in the nonprofit context: Exploring both concepts and the relationship between them. Journal of Nonprofit & Public Sector Marketing, 19(3), 25-47.
Fabrigar, L. R., Porter, R. D., & Norris, M. E. (2010). Some things you should know about structural equation modeling but never thought to ask. Journal of Consumer Psychology, 20, 221-225.
Fornell, C., & Larcker, D. F. (1981). Evaluating structural equation models with unobservable variables and measure-ment error. Journal of Marketing Research, 18(February), 39-50.

AD
MI
NI
ST
RA
TI
VE
I
SS
UE
S
JO
UR
NA
L:
E
DU
CA
TI
ON
,
PR
AC
TI
CE
,
AN
D
RE
SE
AR
CH
Niculescu, Xu, Hampton, & PetersonDOI: 10.5929/2013.3.2.2
VOLUME 3, ISSUE 2
b
Gray, B., Matear, S., Boshoff, C., & Matheson, P. (1998). Developing a better measure of market orientation. European Journal of Marketing, 32(9/10), 884-903.
Greenley, G. E., & Matcham, A. S. (1986). Marketing orientation in the service of incoming tourism. European Journal of Marketing, 20(7), 64-73
Hampton, G.M. (2007). Exploring market orientation and performance in the university. Proceedings of the Marketing Educators’ Association, San Antonio, TX, 43-48.
Hampton, G. M., Wolfe, M., Albinsson, P. A., & McQuitty, S. (2009). Market orientation and professionalism in higher education. Academy of Educational Leadership Journal, 13(1), 87-102.
Han, J. K., Kim, N., & Srivastava, R. K. (1998). Market orientation and organization performance: Is innovation a miss-ing link. Journal of Marketing, 62(4), 30-45.
Herington, C., & Weaven, S. (2009). Implementing the marketing concept in travel organizations: The important moderating influence of perceived organizational support. Journal of Hospitality Marketing & Management, 18(7), 692-717.
Hult, G. T., Cravens, D. W., & Sheth, J. (2001). Competitive advantage in the global marketplace: A focus on marketing strategy. Journal of Business Research, 51, 1-3.
Hunt, S. D., & Morgan, R. M. (1995). The comparative advantage theory of competition. Journal of Marketing, 59(April), 1-15.
Jaworski, B. J., & Kohli, A. K. (1993). Market orientation: Antecedents and consequences. Journal of Marketing, 57(July), 53-70.
Kirca, A., & Hult, G. T. M. (2009). Intra-organizational factors and market orientation: Effects of national culture. Inter-national Marketing Review, 26(6), 633-650.
Kirca, A., Jayachandran, S., & Bearden, W. O. (2005). Market orientation: A meta-analytic review and assessment of its antecedents and impact on performance. Journal of Marketing, 69(April), 24-41.
Kohli, A. K., & Jaworski, B. J. (1990). Market orientation: The construct, research propositions, and managerial impli-cations. Journal of Marketing, 54(April), 1-18.
Kohli, A. K., Jaworski, B. J., & Kumar, A. (1993). MARKOR. A measure of market orientation. Journal of Marketing Re-search, 30(November), 467-477.
Kolsaker, A. (2008). Academic professionalism in the managerialist era: A study of English universities. Studies in Higher Education, 33(5), 513-525.
Lado, N., Maydeu-Olivares, A., & Rivera, J. (1998). Measuring marketing orientation in several populations: A struc-tural equations model. European Journal of Marketing, 32(1/2), 23-39.
Lai, C. S., Pai, D. C., Yang, C.F., & Lin, H. J. (2009). The effects of market orientation on relationship learning and relationship performing in industrial marketing: The dyadic perspectives. Industrial Marketing Management, 38(2), 166-172.
Ledwith, A., & O’Dwyer, M. (2009). NPD performance and organizational performance in small firms. Journal of Prod-uct Innovation Management, 26(6), 652-661.
Lings, I. N., & Greenley, G. E. (2009). The impact of internal and external market orientations on firm performance. Journal of Strategic Marketing, 17(1), 41-53.
Matsuno, K., Mentzer, J. T. ,& Rentz, J. O, (2005). A conceptual and empirical comparison of three market orientation scales. Journal of Business Research, 58(1), 1-8.
Mavondo, F. T., & Farrell, M. A. (2000). Measuring market orientation: Are there differences between business market-ers and consumer marketers. Australian Journal of Management, 25(2), 223-244.

AD
MI
NI
ST
RA
TI
VE
I
SS
UE
S
JO
UR
NA
L:
E
DU
CA
TI
ON
,
PR
AC
TI
CE
,
AN
D
RE
SE
AR
CH
Niculescu, Xu, Hampton, & Peterson DOI: 10.5929/2013.3.2.2
a
McNaughton, R. B., Osborne, P., & Imrie, B. C. (2002). Market oriented value creation in service firms. European Jour-nal of Marketing, 36(9/10), 990-1002.
Morgan, N.A., Vorhies, D.W., & Mason, C.H. (2009). Market orientation, marketing capabilities, and firm performance. Strategic Management Journal, 30(8), 909-920.
Narver, J. C., & Slater, S. (1990). The effect of a market orientation on business profitability. Journal of Marketing, 54(October), 20-35.
Narver, J. C., Jaccobson, R., & Slater, S. F. (1993). Market orientation and business performance: An analysis of panel data. Cambridge, MA: Marketing Science Institute.
Ng, I. C. L., & Forbes, J. (2009). Education as service: The understanding of university experience through the service logic. Journal of Marketing for Higher Education, 19(1), 38-64.
Noble, C. H., Sinha, R. K., & Kumar, A. (2002). Market orientation and alternative strategic orientations: a longitudinal assessment of performance implications. Journal of Marketing, 66(October), 25-39.
Oplatka, I., & Hemsley-Brown, J. (2007). The incorporation of market orientation in the school culture. International Journal of Educational Management, 21(4), 292-305.
Ordanini, A., & Maglio, P. P. (2009). Market orientation, internal process, and external network: A qualitative compara-tive analysis of key decisional alternatives in the new service development. Decision Sciences, 40(3), 601-625.
Papasolomou-Doukakis, I. (2002). Internal marketing: A means for creating sales or marketing orientation? The case of UK retail banks. Journal of Marketing Communications 8(2), 87-100.
Podsakoff, P. M., MAcKenzie, S. B., Lee, J. Y., & Podsakoff, N. P. (2003). Common method biases in behavioral research: A critical review of the literature and recommended remedies. Journal of Applied Psychology, 88(5), 879-903.
Reichheld F. F., & Sasser, Jr., W. E. (1990). Zero defections: Quality comes to services. Harvard Business Review, 68(5), 105-111.
Saxe, R., & B. A. Weitz (1982). The SOCO scale: A measure of the customer orientation of salespeople. Journal of Mar-keting Research, 19(August), 343-351.
Schuck, S., Gordon, S., & Buchanan, J. (2008). What are we missing here? Problematising wisdoms on teaching qual-ity and professionalism in higher education. Teaching in Higher Education, 13(5), 537-547.
Sharp, B. ( 2001). Marketing orientation: More than just customer focus. International Journal of Wine Marketing, 3(1), 20-25.
Siguaw, J. A., & Diamantopoulos, A. (1995). Measuring market orientation: Some evidence on Narver and Slater’s three-component scale. Journal of Strategic Marketing, 3, 77-88.
Slater, S. F., & Narver, J. C. (1994). Does competitive environment moderate the market orientation-performance relationship? Journal of Marketing, 58(January), 46-55.
Soehadi, A. W., Hart, S., & Tagg, S. K. (2001). Measuring market orientation in the Indonesian retail context. Journal of Strategic Marketing, 9(4), 285-299.
Voon, B. H. (2007). SERVMO: A measure for service-driven market orientation in higher education. Journal of Market-ing for Higher Education, 17(2), 216-237.
Walkenhorst, H. (2008). Explaining change in EU education policy. Journal of European Public Policy, 15(4), 567-587.
Webster, F. E. Jr. (1994). Market-driven management. New York: John Wiley & Sons Inc.
White, K. R., Thompson, J. M., & Patel, U. B. (2001). Hospital marketing orientation and managed care processes: Are they coordinated? Journal of Healthcare Management, 46(5), 327-336.
Zhou, K.Z., Brown, J.R., & Dev, C.S. (2009). Market orientation: Competitive advantage and performance: A demand

AD
MI
NI
ST
RA
TI
VE
I
SS
UE
S
JO
UR
NA
L:
E
DU
CA
TI
ON
,
PR
AC
TI
CE
,
AN
D
RE
SE
AR
CH
Niculescu, Xu, Hampton, & PetersonDOI: 10.5929/2013.3.2.2
VOLUME 3, ISSUE 2
b
based perspective. Journal of Business Research, 62(11), 1063-1080.
About the Authors:Mihai Niculescu ([email protected]) is assistant professor of marketing in the College of Business at New Mexico State University.
Bing Xu ([email protected]) is assistant professor of marketing in the College of Business Administration and Public Policy at California State University – Dominguez Hills.
Gerald M. Hampton ([email protected]) and Robin T. Peterson ([email protected]) are professors of market-ing in the College of Business at New Mexico State University.

AD
MI
NI
ST
RA
TI
VE
I
SS
UE
S
JO
UR
NA
L:
E
DU
CA
TI
ON
,
PR
AC
TI
CE
,
AN
D
RE
SE
AR
CH
Niculescu, Xu, Hampton, & Peterson DOI: 10.5929/2013.3.2.2
a
APPENDIX
MKTOR Scale (adapted from Narver and Slater, 1990)
INSTRUCTIONS
The following set of statements relates to how your department or college relates and responds to students and other universities. For each statement please indicate the extent you agree or disagree by circling a number from (7) strongly agree to (1) strongly disagree. You may circle any of the numbers in between that show how strong your feel-ings are. There is no right or wrong answer. We are only interested in your opinions. Please respond to all statements using the following scale.
ITEMS:
1. Our objectives are driven by satisfaction of our students. 2. We measure satisfaction of our student systematically and frequently. 3. Those responsible for recruiting students regularly share information with our department concerning our
competitors’ strategies. 4. Our marketing strategies (such as recruiting and retention) are driven by our understanding of the possi-
bilities for creating value for our students.5. We respond rapidly to competitive actions that threaten us. 6. We constantly monitor our level of commitment and orientation to students. 7. University administration regularly discusses competitors’ strengths and strategies.8. All levels of administration understand how the entire university can contribute to creating value for stu-
dents. 9. We give close attention to service of students after enrollment. 10. Our strategy for competitive advantage is based on our understanding of our students’ needs.11. We encourage other staff and faculty outside of our department to meet with our prospective students
and their parents. 12. Our department is responsive to serving students. 13. Information on recruiting successes and failures are communicated to members of the department.14. We share information and coordinate resource use with other departments in the university.15. We target potential students where we have or can develop competitive advantage.
Note: Items 1,2,4,6,9 measure customer orientation, items 3,5 7, 11, 15 measure competitor orientation, and items 8,12, 13, 14 measure inter-functional coordination. Items in italics were excluded during confirmatory factor analysis.
MARKOR Scale(adapted from Kohli and Jaworski, 1990; Caruana et al., 1998, 1999)
INSTRUCTIONS
The following set of statements relates to how your department or college relates and responds to students and other universities. For each statement please indicate the extent you agree or disagree by circling a number from (7) strongly agree to (1) strongly disagree. You may circle any of the numbers in between that show how strong your feel-ings are. There is no right or wrong answer. We are only interested in your opinions. Please respond to all statements using the following scale.

AD
MI
NI
ST
RA
TI
VE
I
SS
UE
S
JO
UR
NA
L:
E
DU
CA
TI
ON
,
PR
AC
TI
CE
,
AN
D
RE
SE
AR
CH
Niculescu, Xu, Hampton, & PetersonDOI: 10.5929/2013.3.2.2
VOLUME 3, ISSUE 2
b
Intelligence Generation (IG)
1. In my department we meet with students at least once a year to find out what courses and services they will need in the future.
2. In this department we meet with those that hire our students at least once a year tofind out what courses or services they think students will need in the future.
3. In my college we a do a lot of in-house market research.4. We are slow to detect changes in our students’ course preferences.5. We survey students at least once a year to assess the quality of our courses and services.6. We survey industry at least once a year to assess the quality of our courses and services.7. We are slow to detect fundamental shifts in tertiary education environments government regulation, tech-
nology, competition, delivery systems].8. We periodically review the likely effect of changes in tertiary education environment on students.
Intelligence Dissemination (ID)
9. We have inter-departmental meets at least once a semester to discuss market trends and developments.10. Academic staff in our department spends time discussing students’ future needs with other staff in the col-
lege.11. Academic staff in our department spends time discussing industries’ future needs with other staff in the
college.12. When something important happens to a student or course, the whole department knows about it within
a short period.13. Data on student satisfaction are disseminated at all levels in this college on a regular basis.14. Data on industry satisfaction with our graduates are disseminated at all levels in this college on a regular
basis.15. When one staff member finds out something important about a department in another university, he/she
is slow to alert other colleagues.
Responsiveness
16. It takes us forever to decide how to respond to fee changes for foreign students by other universities.17. For one reason or another we tend to ignore changes in our students’ course or service needs.18. We periodically review our course development efforts to ensure that they are in line what students want.19. We periodically review our course development efforts to ensure that they are in line with what industry or
those who hire our graduates wants.20. Several department heads in my colleges get together periodically to plan a response to changes taking
place in the education environment.21. If a major university were to launch an intensive campaign targeted at our student market, we would
implement a response immediately.22. The activities of the different staff members in this college are well coordinated.23. Student complaints fall on deaf ears in this department.24. Even if we came up with a great course initiative, we probably would not be able to implement it in a
timely fashion.25. When we find that students would like us to modify a course or service, the staff members involved make
concerted efforts to do so.
Note: Items in italics were excluded during confirmatory factor analysis.

AD
MI
NI
ST
RA
TI
VE
I
SS
UE
S
JO
UR
NA
L:
E
DU
CA
TI
ON
,
PR
AC
TI
CE
,
AN
D
RE
SE
AR
CH
Niculescu, Xu, Hampton, & Peterson DOI: 10.5929/2013.3.2.2
a
University MARKOR Scale (Hampton, 2007)
INSTRUCTIONS
In this survey you are asked to respond to statements related to student services at [university name]. Using the 1 to 7 scale below, indicate your agreement with each item by circling the appropriate number that reflects how you feel. Please respond to each statement. The seven point scale is [1= strongly disagree to 7=strongly agree].
ITEMS:
Advising and Mentoring (University ADV)
1. In my interaction with students, I try to determine what they need.2. I try to give students an accurate expectation of what our education program will do for them.3. I am willing to disagree with a student in order to help them make a better decision.4. I try to match a student’s educational needs with courses that best suit that need.5. I answer students’ questions about our courses and services as correctly as I can.6. I suggest a program of courses that is best suited to the students’ needs.
Administration leadership (University ADM)
7. My department head asks for, and considers, my ideas about improving the quality of our services for stu-dents.
8. My department head frequently gives me honest and direct feedback about how well I am serving stu-dents.
9. My department head seeks opportunities to try new ways of doing things to serve students better.10. I know what my department head expects of me in serving students.11. My department head makes efforts to remove obstacles that hinder serving students well.12. My department head helps me learn from experiences with students, both successes and failures.
Intelligence Generation and Responsiveness (University IG-R)
13. We use the information we collect from students to identify ways to improve service to them.14. n our department, we regularly ask our students about their needs, wants, and expectations. 15. We survey students regularly to access their academic needs. 16. Information from student surveys are regularly used to improve the service we provide to students.
AD
MI
NI
ST
RA
TI
VE
I
SS
UE
S
JO
UR
NA
L:
E
DU
CA
TI
ON
,
PR
AC
TI
CE
,
AN
D
RE
SE
AR
CH
Niculescu, Xu, Hampton, & PetersonDOI: 10.5929/2013.3.2.2
VOLUME 3, ISSUE 2
b
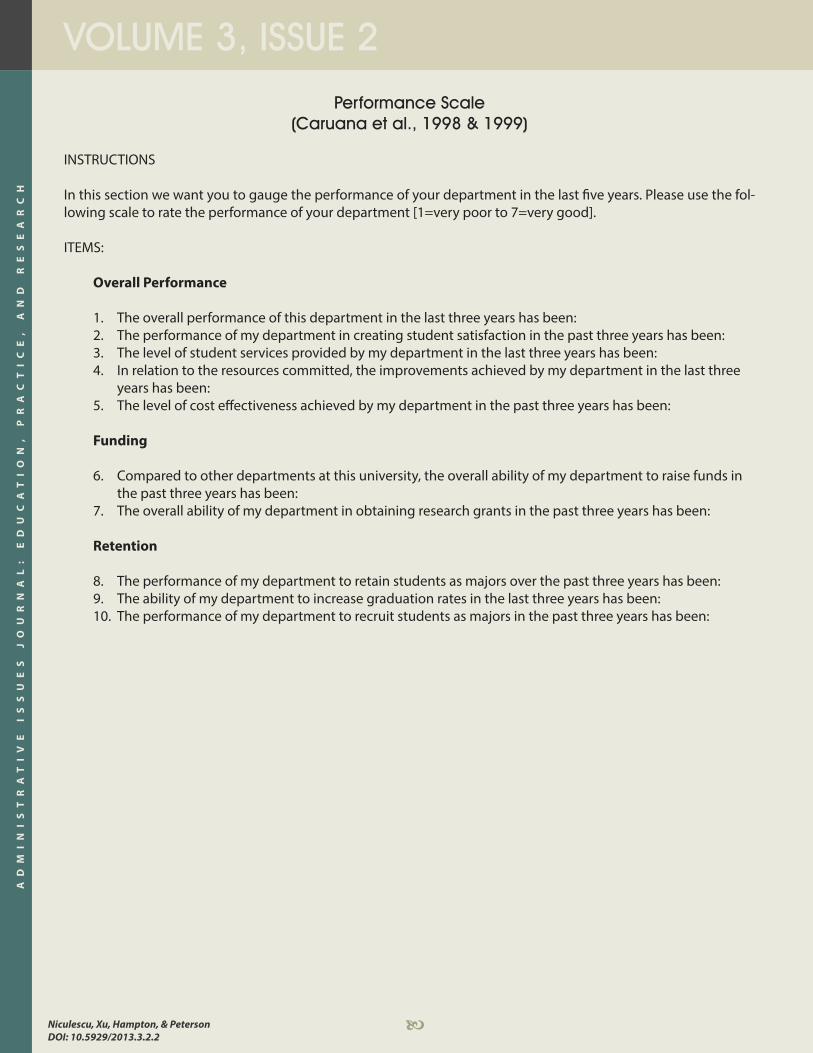
Performance Scale (Caruana et al., 1998 & 1999)
INSTRUCTIONS
In this section we want you to gauge the performance of your department in the last five years. Please use the fol-lowing scale to rate the performance of your department [1=very poor to 7=very good].
ITEMS:
Overall Performance
1. The overall performance of this department in the last three years has been:2. The performance of my department in creating student satisfaction in the past three years has been: 3. The level of student services provided by my department in the last three years has been:4. In relation to the resources committed, the improvements achieved by my department in the last three
years has been: 5. The level of cost effectiveness achieved by my department in the past three years has been:
Funding
6. Compared to other departments at this university, the overall ability of my department to raise funds in the past three years has been:
7. The overall ability of my department in obtaining research grants in the past three years has been:
Retention
8. The performance of my department to retain students as majors over the past three years has been: 9. The ability of my department to increase graduation rates in the last three years has been: 10. The performance of my department to recruit students as majors in the past three years has been: