market opportunities for automotive components used in non
TRANSCRIPT

Helsinki Metropolia University of Applied Sciences
Bachelor of Business Administration
International Business and Logistics
Bachelor´s Thesis
September 20, 2012
Jaana Kalajärv
Market Opportunities for Automotive Components Used in Non-automotive Applications Manufacturing
Estonian Industrial Market
Abstract
Author(s) Title Number of Pages Date
Jaana Kalajärv Market Opportunities for Automotive Components Used in Non-automotive Applications Manufacturing: Estonian Industrial Market 38 pages + 4 appendices 20 September 2012
Degree Bachelor of Business Administration
Degree Programme International Business and Logistics
Specialisation option International Business and Logistics
Instructor(s)
Pauli Järvensivu, Lecturer
This thesis examines the opportunities available for automotive components in the Esto-
nian non-automotive industrial market.
The literature review part is mainly covers the theory of marketing research, because of
the approach chosen for this paper. Only small part of marketing research process is re-
searched closer in literature review section, because of the scope of the research. Three
most relevant steps for the thesis are chosen from research process for further more in-
vestigation, which are: problem definition, development and an approach to the problem,
data preparation and analysis. Basic information about entering a new market, measuring
the market, buying behaviour and marketing mix are chosen to see what and how oppor-
tunities can be found. Another similar research was analysed to see the results for Iberian
market research for automotive components that can be used in medical furniture. The
final outcome was that the Iberian medical furniture market is an interesting market for
technical solution provider, which means that they could aggregate the demand of various
manufacturers and offer them customized products.
As secondary research, Estonian economic situation, industrial market and manufacture
areas are investigated more closely to understand how big the market is and how changes
can affect one another. Past and current information have been taken into account to esti-
mate the future. Investigation results show that industrial market for automotive compo-

Abstract
nents is rather small, but growing. Manufacture situation is tightly connected to Estonian
general industry and economy
The primary research was done by interviewing companies operating in the Estonian
manufacturing area and who could use automotive components in their non-automotive
applications. As a result of the interviews, 22 respondents were gathered and analysed.
Based on the data, the best opportunities seem to be in furniture manufacture at the mo-
ment and also for the future, despite the information shown in the secondary data, which
shows that furniture manufacture is one of the smallest manufacture groups in Estonia.
This knowledge gives more proof that this specific market is small. Annual volumes were
another aspect that show the size of the market, which is also small and more suitable for
retailers or small suppliers than for bigger direct car parts providers. Growth or steadiness
is estimated for the future by the interviewees.
Three recommendations were made as a result of the secondary and primary research:
find a partner, investigate the furniture market more closely, and/or enter the market as a
technical solution provider. The last outcome was similar to the research done for Iberian
medical furniture market.
Keywords Industrial Production, Estonian Economy, Automotive Com-ponents, Non-automotive Industry, Manufacturing, Future

Contents
1 Introduction 1
1.1 Background 2
1.2 Objectives 3
1.3 Delimitations 3
1.4 Research Questions 4
1.5 Research methodology 4
2 Literature review 6
2.1 Marketing research process 6
2.1.1 Problem definition 7
2.1.2 Development and an approach to the problem 7
2.1.3 Data preparation and analysis 7
2.2 Entering a new market 8
2.3 Measuring the market 8
2.4 Organizational buying behaviour 9
2.5 Marketing-mix 10
2.6 Previous research in the industrial market accessible for automotive products 11
3 Automotive products identification 13
4 Estonian market 16
4.1 Estonian Industrial Market in General 16
4.1.1 Past situation (2001-2010) 17
4.1.2 Current situation (2011-2012) 17
4.1.3 Future estimations 18
4.2 Manufacturing in Estonia 19
4.3 Summary of Estonian market situation 24
5 Further market insights 25
5.1 Phone interviews 25
5.1.1 Interview results 27
5.1.2 Results of discussions 27
5.2 Questionnaires by e-mail 27
5.2.1 Questionnaire results 28
5.3 Overall results 29
6 Conclusions 31
6.1 Answering the secondary questions 31
6.2 Recommendations 33
6.3 Answering the main question 34
6.4 Further studies 34
References 36
Appendices
Appendix 1. Interview Questions
Appendix 2. Pre-Interview Statement
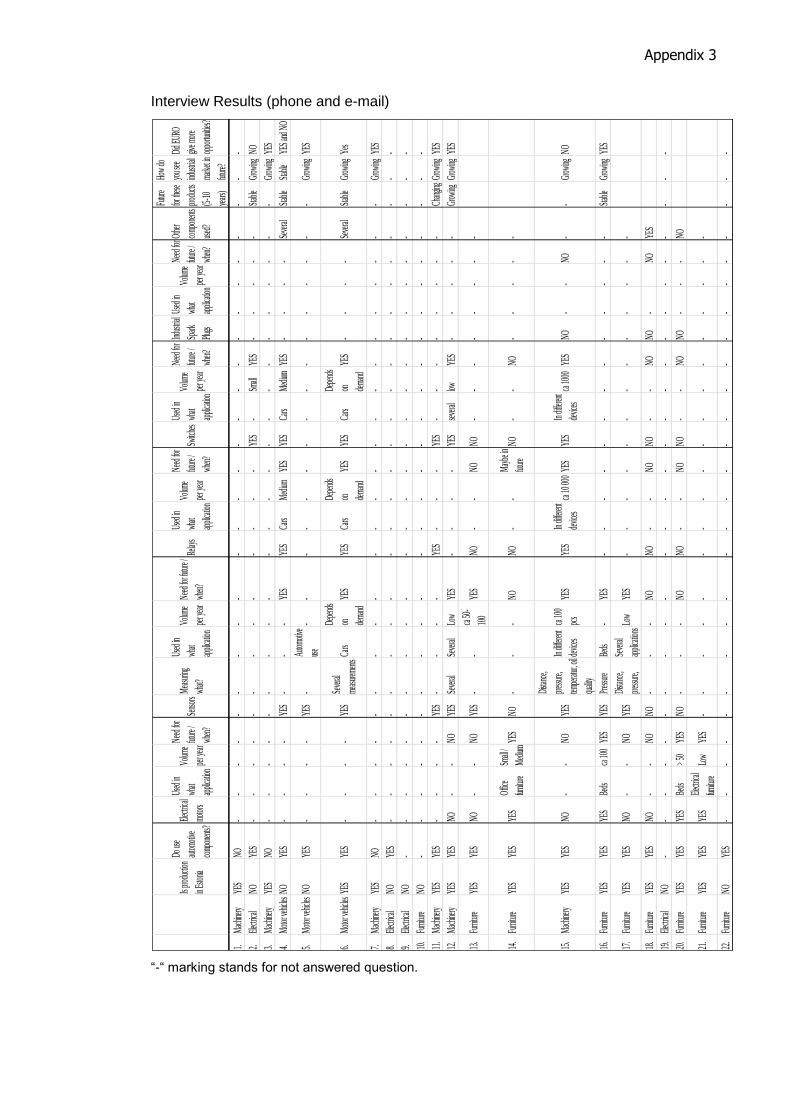
Appendix 3. Interview Results (phone and e-mail)
Appendix 4. List of figures and tables
1
1 Introduction
Entering a new market with a product existing already and designed for a certain field,
but which can be used in different areas of manufacturing, is very common for compa-
nies that would like to expand their business. Using already existing products or modi-
fying the same items is one way to do it. This is can be more challenging when it
comes to finding out what are the areas and which applications can be targeted be-
sides already obvious ones.
Automotive components are included in the products suitable for several applications.
Not only vehicles are the target markets for these items. Industrial market is as well a
big opportunity for simple car parts. There are many countries or areas that do not
have automotive manufacturing, but have a lot of different other manufacturing compa-
nies operating. It does not mean that there are no business opportunities for automo-
tive components suppliers, but it can be more challenging to enter the market because
of lack of knowledge in the industries and the market in general.
This thesis focuses on market opportunities for automotive components, which are
identified later in this paper, which can be used in non-automotive manufacturing. The
Estonian market is chosen as a research area, because of its small market, changing
economy and personal interest. Another reason for this topic is that no similar research
was found in the secondary data for same geographical area.
Researching the general Estonian economic situation, industrial market and manufac-
turing sector might help to see how these more specific areas are connected to wider
ones and hopefully gives an overview of the market size. The emphasis is to analyse
the past and current situation on the market and later to estimate the future opportuni-
ties by using the secondary and primary research.
2
1.1 Background
The thesis is written in co-operation with Robert Bosch Oy. Industrial business is one
part of automotive technology business sector for Bosch Group, which is a global sup-
plier of automotive and industrial technology, consumer goods and building technology.
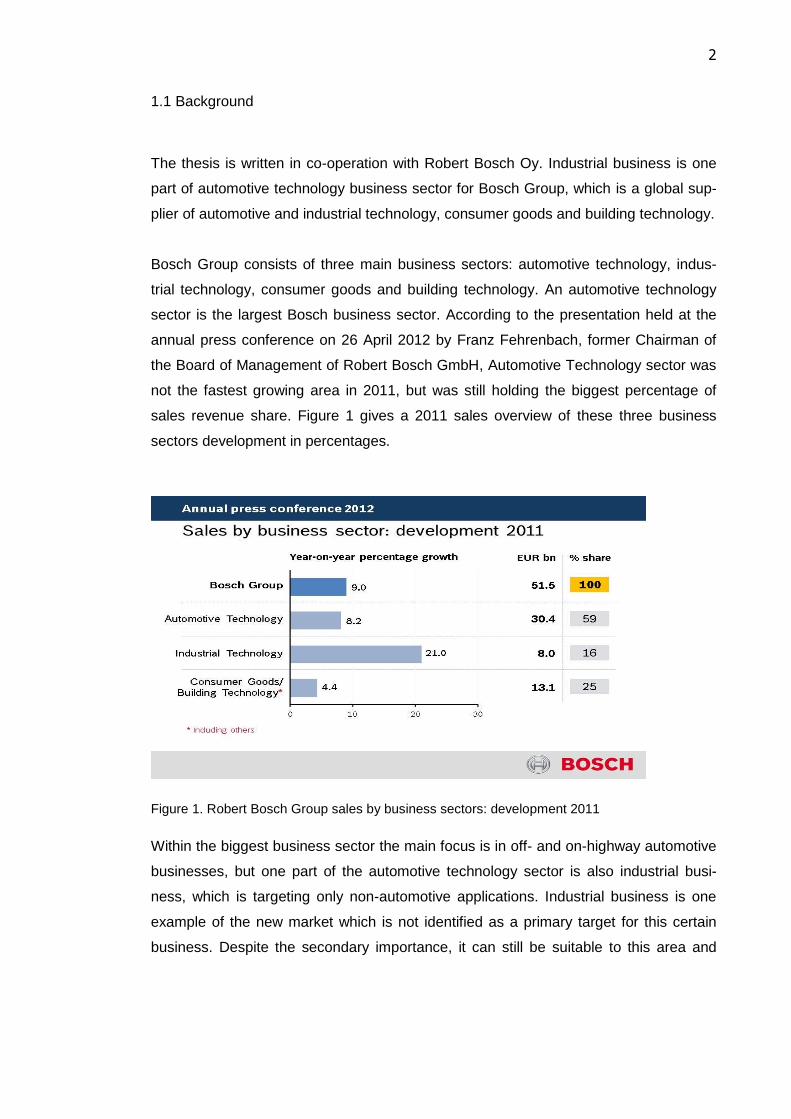
Bosch Group consists of three main business sectors: automotive technology, indus-
trial technology, consumer goods and building technology. An automotive technology
sector is the largest Bosch business sector. According to the presentation held at the
annual press conference on 26 April 2012 by Franz Fehrenbach, former Chairman of
the Board of Management of Robert Bosch GmbH, Automotive Technology sector was
not the fastest growing area in 2011, but was still holding the biggest percentage of
sales revenue share. Figure 1 gives a 2011 sales overview of these three business
sectors development in percentages.
Figure 1. Robert Bosch Group sales by business sectors: development 2011
Within the biggest business sector the main focus is in off- and on-highway automotive
businesses, but one part of the automotive technology sector is also industrial busi-
ness, which is targeting only non-automotive applications. Industrial business is one
example of the new market which is not identified as a primary target for this certain
business. Despite the secondary importance, it can still be suitable to this area and

3
might be a big business opportunity for the company, especially for smaller sales ar-
eas.
Investigations carried out previously have shown that there are small business oppor-
tunities for automotive industry in Estonia. According to European Automobile manu-
facturers´ association, Estonia is concentrating more towards specialist component
manufacturing, rather than the assembly of vehicles (ACAE, 2012). The statement, that
several other industries are more attractive for automotive components in Estonian
market, is set as a hypothesis for this study.
1.2 Objectives
The main objective for this thesis is: to analyse opportunities that Estonian indus-
trial non-automotive market can offer for vehicle components. As there is already
some information available of the existing market, this research is done to expand the
knowledge. The topic will be explored to find out if the assumption of existing and fur-
ther more growing market is correct. The objective will be determined in terms of mar-
ket size, volumes and other possible influences that are creating or eliminating the op-
portunities.
The assumption, that a market exists, has to be proven. Furthermore, the aim is to find
out for which suppliers this is the biggest opportunity in terms of size of volumes and
customers´ buying behaviour. As an outcome of this research is expected that there is
a small market available, that is constantly growing.
1.3 Delimitations
The range of components will be limited for the research according to Bosch Group
web-site for industrial business within automotive sector. Business opportunities for
other components will be taken into account as a secondary importance.
This study will focus on Estonian market. As a result of deeper investigation it will take
even into consideration even more specific areas, which are using automotive compo-
nents in non-automotive applications. Due to the constrains of time and size of re-

4
search the theory will concentrate on relevant parts of market research and analyse
similar already existing research done in this area that support the main body of thesis.
1.4 Research Questions
The thesis seeks for an answer for more than one question, to provide background
information for the main question that is stated.
“What are the opportunities available in Estonian non-automotive industrial market for
automotive components?”- is the main question that needs to be answered.
Several other topics need to be analysed before answering the main question:
How does economic situation affects Estonian industrial market and how has it
changed over the years?
How big is the market generally and in terms of volumes and buying prefer-
ences by the customers?
Are there future opportunities available for direct suppliers?
These sub-questions will be discussed and explored during the main body of the re-
search and the primary question will be answered in the conclusion section.
1.5 Research methodology
There are two types of research designs in the marketing research process: an ex-
ploratory research and a conclusive research (Mishra, 2008). Exploratory research can
cover search for secondary data and literature, survey of knowledgeable persons or
experience survey, and case study. Conclusive research can be more descriptive and
experimental. The formation of research design is dependent on the nature of problem.
Development of a sound research design is combined of seven sub-steps: defining the
objectives of the investigation, planning and determining the scope of investigation,
developing alternative methods for collection, analysis and interpretation data, estimat-
ing the time required, preparing the personnel and administrative set-up, preparing the
budget, formulating the research proposal and accepting it (Sontakki, 2010).

5
Both primary and secondary data need to be covered in case of comprehensive re-
search. Secondary data is not collected to cover the problem that is under discussion, it
is collected for some other purposes. This information may be available in the Internet,
libraries or for example in CD-ROMs. The sources could be for example published sur-
veys of markets, government publications, Government reports, publications of re-
search organizations, publications of trade associations and so on. It is not always
newest information and may have been collected some time ago. To cover the theory
and background information secondary data will be used. Information about Estonian
economy and industrial market situation provide some examples to be covered with
secondary data.
The primary research covers sampling and uses quantitative and qualitative research
studies to fulfil its aim. This part of research is usually more time demanding and ex-
pensive than secondary data collecting. Primary data is used to understand the market,
by collecting information in several areas, such as: customers buying behaviour, mar-
ket size in terms of volumes, and future of Estonian industrial market through the eyes
of operating companies.
6
2 Literature review
This literature review section covers six topics. Firstly, it will take a closer look at mar-
keting research process, which theory helps to underpin the achievement of the objec-
tive. Marketing research process will include deeper information about three steps:
problem definition, development and an approach to the problem, data preparation and
analysis. Opportunities and difficulties of entering a new market will be analysed in next
section. Afterwards importance of market measuring, understanding of organizational
buying behaviour and marketing mix will be discussed more closely. These three top-
ics, mentioned below, are building a theoretical base for secondary and primary re-
search needs. Lastly, theory part will examine the previous research in industrial mar-
ket research, which has been done for small market and specific applications that uses
automotive components in their production.
2.1 Marketing research process
According to the European Society for Opinion and Marketing Research (ESOMAR),
marketing research is defined to be a key element within the total field of marketing
information. It links the consumer, customer and public to the marketer through infor-
mation which is used to identify and define marketing opportunities and problems; to
generate, refine and evaluate marketing actions; and to improve understanding of mar-
keting as a process and of the ways in which specific marketing activities can be made
more effective (Malhotra, Birks, 2006). Marketing research process is divided into cer-
tain steps.
Mr. Birks and Mr. Malhotra (2006) explain marketing research process through six
steps: problem definition, research approach developed, research design developed
fieldwork or data collection, data preparation and analysis, report preparation and
presentation. It is still not only about finding the problem, but more important is to un-
derstand and define a problem (Malhotra, Birks, 2006). Every book does not name
these steps always in a same way, but the concept stays the same. Some theories
include also seventh step- follow-up recommendation (Sontakki, 2010). Three research
7
processes will be monitored closer in this section to guide the achievement of the ob-
jective.
2.1.1 Problem definition
Defining the research problem is the first step of the process. This is the part where
problem is defined and analysed. Importance of analysing the situation is to get an
overview of the problem, which has done by marketing decision-makers and marketing
researchers. Idea is to find out what possible problems they face and what kind of re-
search support they need. Defining a research problem can be divided into three sub-
steps: discovering the managerial problems, refining and redefining, and translating the
managerial problems in to research problems (Sontakki 2010). Once the problem and
need for research have been properly defined, researcher is able to move on to the
second step- considering the possible solutions.
2.1.2 Development and an approach to the problem
Development and an approach to the problem can also be called as preliminary inves-
tigation (Sherlekar, Sherlekar, 2010). During this period researcher will take a closer
look at background information, by meeting the dealers, consumers, suppliers and cus-
tomers to get better overview and understanding of most critical issues. This is the
stage where theoretical framework needs to be selected, adapted and developed. First
it sets the hypothesis that helps to indicate the factors which are more important and
makes investigation and analyses more restricted.
2.1.3 Data preparation and analysis
Data preparation and analysis stage can be done only after all of the data is processed.
In this step data editing, coding, transcription and verification will be covered by the
researchers. In most cases research includes quantitative and qualitative research to
get more accurate outcome. After analysing all the data it makes situation easier for
researchers and they are more likely able to prove or disapprove the hypothesis.

8
2.2 Entering a new market
Andrew Whalley (2010), lecturer in marketing at Royal Holloway University of London,
has explained market development as a growth strategy where the business seeks to
sell its existing products into new markets. He explains that there are several ways to
do it, but brings out four of them in his book of strategic marketing. First option would
be to seek new geographical markets to export the products into new country. Another
way could be applied when supplier understands better the buying behaviour and cus-
tomer‟s decision making process. In this case new product dimensions, packaging or
different price could be applied to enter new market more successfully. Fourth opportu-
nity could be to use new distribution channels.
After finding an existing market, there is another option that can help to locate the busi-
ness into this area: product development. Product development might require that there
are new modifications added to already existing products or even starting new product
from the scratch that can be offered to the existing market according to demand of cus-
tomer.
Diversification is the riskiest growth strategy for the company. In this case, supplier
enters a new market, in which they do not have any experience beforehand, and also
offering a new product that is specially produced for this purpose. More detailed market
research is needed in case of diversification to cut the negative risk percentage.
In next sections, there are three topics discussed: measuring the market, buying be-
haviour, and marketing mix. These topics are giving better overview of what have to be
taken into account eliminating the negative risk.
2.3 Measuring the market
What is market and why do we have to measure it? Internet Centre for Management
and Administration (2010) explains the term market, in marketing concept, as the group
of consumers or organizations that are interested in the product, has the resources to
purchase the product, and is permitted by law and other regulations to acquire the
product. It is important to know the size of market to understand how many customers
9
there may be available, how often do they consume and how much. Not only the pre-
sent needed to be considered, but also past and especially future.
After answering the question, why market is needed to be measured, the following is-
sue is to find out how it is measured. Three key measures of a market are: size of the
market in value and volume terms, the trend in the market size, and the market share
(Murray, O´Driscoll, 1996). It is also necessary to consider these by market segments
to get these three measures more effective.
Every marketer should know answer to next three important questions while choosing a
market segment:
Which criteria to use?
What factors to use while identifying a market segments?
How to develop segmentation analysis?
The criteria can help to select suitable market segments and evaluates its feasibility. A
segments have to be measurable, accessible, substantial, profitable, compatible with
competition, effective and defendable (Paley, 2007).
2.4 Organizational buying behaviour
Organizational buying is defined by Webster and Wind as the decision-making process
by which formal organizations establish the need for purchased products and services
and identify, evaluate, and choose among alternative brands and suppliers (Webster,
Wind, 1972).
According to Patrick J. Robinson theory buyer has to consider three types of buying
situations while making their decisions: the straight rebuy, the modified rebuy, and the
new task (Kotler, 1997). In case of straight rebuy purchaser reorders goods in routine
basis and choose suppliers relying on experiences from the past. Modified rebuy is the
case when buyer decides to make changes in certain areas like prices, delivery re-
quirements or for example in product specifications. Buyer is trying to find better and
more suitable options for company by exploring different solutions. The third type is
new task, which means that purchaser is buying this certain product or service for first
time and goes through five different stages: awareness, interest, evaluation, trial, and
adaption (Kotler, 1997). The last type is considered to be most challenging one out of

10
these three. In case of entering new market, supplier has to be aware of which criteria
is the most important for customer.
2.5 Marketing-mix
Marketing mix is one important part of organizations decision making process. Neil
Borden made marketing mix, which is also mentioned as four P´s of marketing, more
known and popular among marketing world by mentioning it in his article. Four P´s
consists of product, place, price and promotion (Kermally, 2004). Figuring out why,
from where, what to buy and in what price are the decisions that customer need to
make before purchasing. Companies can prioritize these elements differently- some
see that quality is the most important, others again seek for lower price and do not put
that much of a pressure on quality or distance from country of origin. These four levers
are the classical ones and help suppliers to understand better customer‟s decision
making process. As marketing has become more complicated, some claim that only
four categories are not sufficiently useful by themselves anymore. Nowadays some
theories add fifth P into marketing mix, which is- positioning (Ruskin-Brown, 2006).
Positioning lever is “strategic” and also includes segmentation and targeting.
According to Robert Lauterborn´s theory four P´s correspond to the customers 4 C´s,
which are customer needs and wants, cost to the customer, convenience and commu-
nication (Kotler 1997):
Product corresponds to customer needs and wants. This is the part of decision making
where customer or consumer takes into account several details like product variety,
quality, design, features, brand name, packaging, size, warranties and returns.
Price is the category when purchaser has to think about the cost. This covers the
whole picture of what customer is willing to pay out and how much they will make profit
after all the costs. In this case list price, discounts, allowances, payment periods and
credit terms need to be taken into consideration.
Promotion is in tight connection with convenience. Promotional part should give out
enough information to a customer and at the same time keep it relevantly simple for
them. Sales promotion, advertising, sales force, public relations, direct marketing-
these are the ways that supplier can use while covering customers information needs.
11
Place is the part which corresponds with communication part of 4 C´s. Channels, cov-
erage, assortments, locations, inventory and transport can bring customer closer sup-
plier even if sometimes distance in reality is longer.
Positioning or STP (segmentation, targeting, positioning) was not mentioned by
McCarthy and Borden. Still it is nowadays included to marketing mix as a fifth “P”. This
step is more relevant for suppliers to define clearly who the possible customers are and
where do company find them, but it is not part of customers or consumers decision
making process.
2.6 Previous research in the industrial market accessible for automotive products
There has been done similar research before for Bosch Group before in September
2011. This paper is analysing the Iberian medical furniture market as potential indus-
trial business key market. That is the closest research which matches the purpose of
this study. This previous study was targeting more generally use of electrical DC mo-
tors which can be used for example to actuate an adjustment system of nursing or
hospital beds.
The research of Iberian medical furniture market was divided into four topics: the medi-
cal furniture market accessible to Bosch products, trends and expectations for the
medical furniture market, the Spanish medical equipment and health technology mar-
ket, and main suppliers for motors and drivers within the Iberian medical furniture mar-
ket. In first part product range of the Iberian accessible market and existing industrial
business applications in the medical furniture section are identified. Also other suppli-
ers in this area are defined to see how big the market available and how many compa-
nies compete in this area are. In trends and expectation section ageing population,
lifestyle disease and obesity phenomenon is discussed. This gives the overview of the
market and shows how surrounding factors are creating the need for medical furniture
and creating market opportunities for the components.
The result shows that in general medical furniture market is reflecting positive trends in
the health care section. This research brings out four main reasons because of what
progressive rising demand can be expected: aging population, obesity rate, life style
diseases and demand for highly automated products. The last point is the most influ-
encing. Researcher explains that increased number of patients means high pressure

12
on hospitals, clinics and medical offices, which have to look for a way to handle this
challenging situation. Another trend is in the wellness sector, which is favouring the
sales of medical furniture offering high comfort.
Despite the trend factors the demand for motors was not high. According to research in
2011, the Spanish market is dominated by small and medium sized enterprises. There-
fore annual need in volumes is low. The final outcome was that the Iberian medical
furniture market is an interesting market for technical solution provider, which means
that they could aggregate the demand of various manufacturers and offer them cus-
tomized products.

13
3 Automotive products identification
This section will give overview of some of the automotive components that can be used
in non-automotive purpose. Components that will be monitored for this research are
defined according to Robert Bosch Industrial Business web-site and include five main
automotive components that are used in industrial business: electric motors, sensors,
relays, switches and industrial spark plugs.
Table 1 Automotive components usage
Figure 2. Electric motors
The biggest product group is electric mo-
tors, which operate with harmless extra-low
voltages of 12 and 24 volts. Its large number
of sizes and power stages allows targeting
larger number of applications, e.g. for adjust-
ing devices for the office, home or nursing
sector.
Figure 3. Sensors
The area in which sensors can be used is
wide because of its characteristics. Sensors
ability is to test, control, regulate, monitor and
supply computer with physical data. These
can be used easily in everyday objects such
as regulative lamps or touch-sensitive eleva-
tor buttons.
Figure 4. Relays
Relays and lifting magnets are also used
for industrial applications. Relays give the
possibility to switch components with a 12 or
24 voltage ranges, which helps them to fit
into several applications, such as automatic
sliding doors, electric wheelchairs, materials
handling and electric motors.
14
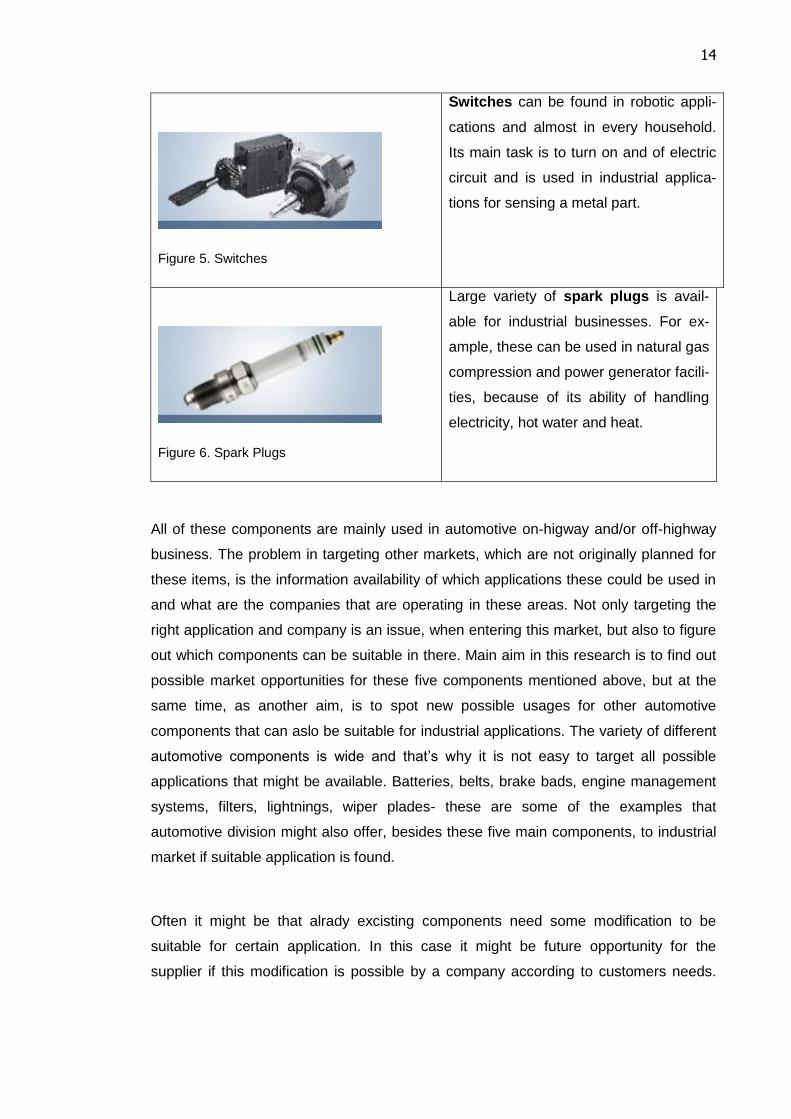
Figure 5. Switches
Switches can be found in robotic appli-
cations and almost in every household.
Its main task is to turn on and of electric
circuit and is used in industrial applica-
tions for sensing a metal part.
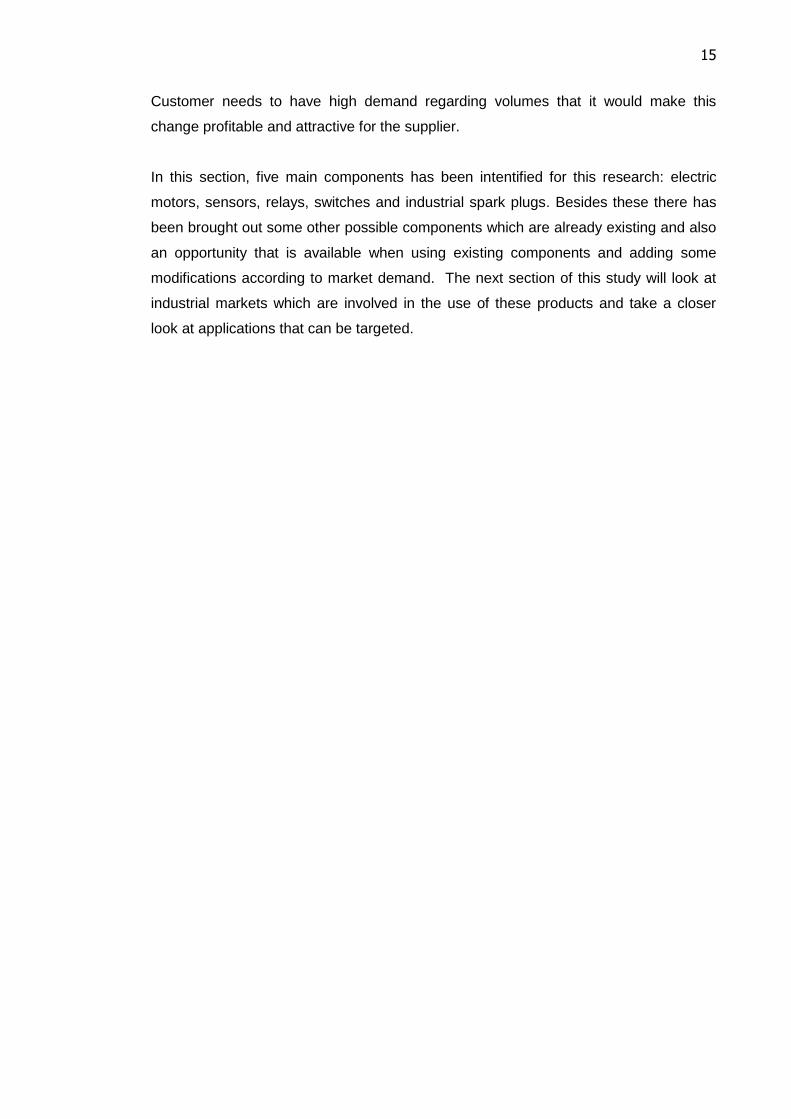
Figure 6. Spark Plugs
Large variety of spark plugs is avail-
able for industrial businesses. For ex-
ample, these can be used in natural gas
compression and power generator facili-
ties, because of its ability of handling
electricity, hot water and heat.
All of these components are mainly used in automotive on-higway and/or off-highway
business. The problem in targeting other markets, which are not originally planned for
these items, is the information availability of which applications these could be used in
and what are the companies that are operating in these areas. Not only targeting the
right application and company is an issue, when entering this market, but also to figure
out which components can be suitable in there. Main aim in this research is to find out
possible market opportunities for these five components mentioned above, but at the
same time, as another aim, is to spot new possible usages for other automotive
components that can aslo be suitable for industrial applications. The variety of different
automotive components is wide and that‟s why it is not easy to target all possible
applications that might be available. Batteries, belts, brake bads, engine management
systems, filters, lightnings, wiper plades- these are some of the examples that
automotive division might also offer, besides these five main components, to industrial
market if suitable application is found.
Often it might be that alrady excisting components need some modification to be
suitable for certain application. In this case it might be future opportunity for the
supplier if this modification is possible by a company according to customers needs.
15
Customer needs to have high demand regarding volumes that it would make this
change profitable and attractive for the supplier.
In this section, five main components has been intentified for this research: electric
motors, sensors, relays, switches and industrial spark plugs. Besides these there has
been brought out some other possible components which are already existing and also
an opportunity that is available when using existing components and adding some
modifications according to market demand. The next section of this study will look at
industrial markets which are involved in the use of these products and take a closer
look at applications that can be targeted.

16
4 Estonian market
In this section I will analyse current data that is available on Estonian industrial market
and economical situation and digs more closely the information given about manufac-
turing area. Later on this help to identify what are the potential applications where
automotive components could fit in and how these areas can be changes in future.
Potentially suitable markets have to cover next criteria:
Production is located in Estonia
Applications use automotive parts
Products are used in non-automotive application
4.1 Estonian Industrial Market in General
The section will use product index indicator to see how situation has changed in Esto-
nia since 2001 and what are the influences that have affected the results over the time.
Statistics of industrial production index and change in percentage has been used to get
better overview of the situation. According to the Eurostat (statistical office of the Euro-
pean Union) web-site the industrial production index shows the output and activity of
the industry sector. It measures changes in the volume of output on a monthly basis. A
data is compiled according to the statistical classification of economic activities in the
European Community (Statistical Office of the European Union, 2012).
Industrial market includes next areas:
Electricity, steam and hot water supply
Mining
Manufacturing
Materials recovery
Intermediate goods
Capital goods
Consumer durables
Consumer non-durables
Energy
17
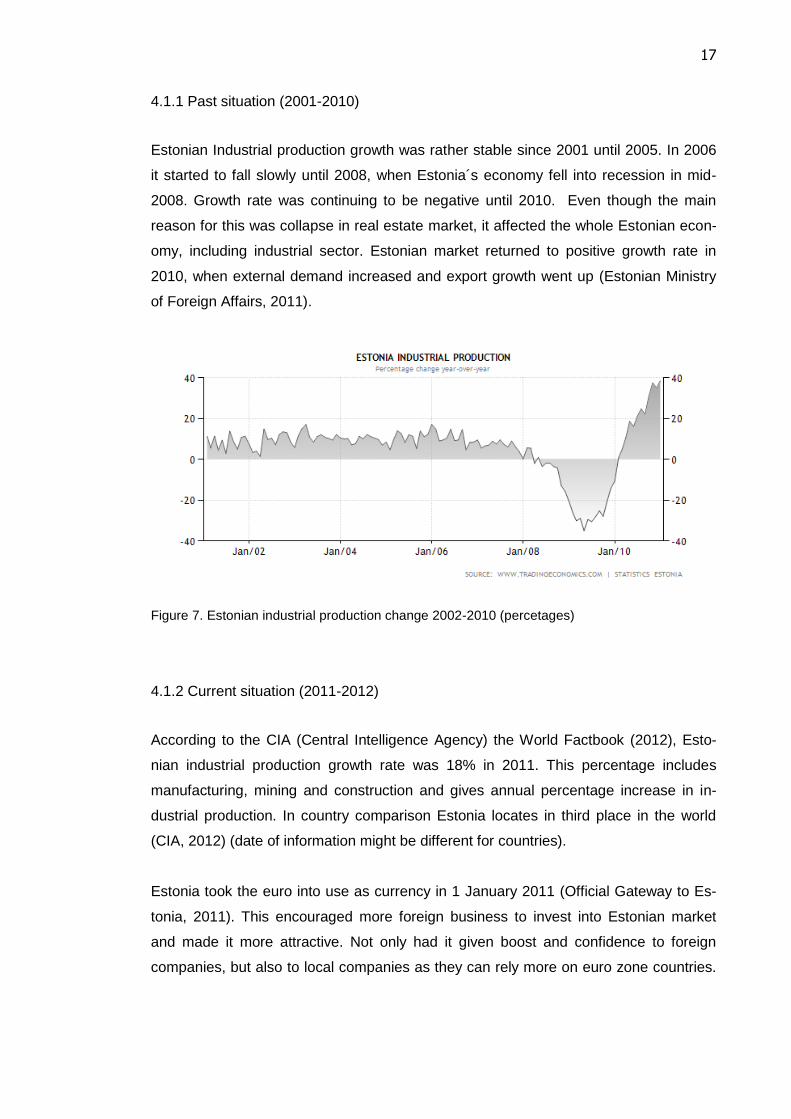
4.1.1 Past situation (2001-2010)
Estonian Industrial production growth was rather stable since 2001 until 2005. In 2006
it started to fall slowly until 2008, when Estonia´s economy fell into recession in mid-
2008. Growth rate was continuing to be negative until 2010. Even though the main
reason for this was collapse in real estate market, it affected the whole Estonian econ-
omy, including industrial sector. Estonian market returned to positive growth rate in
2010, when external demand increased and export growth went up (Estonian Ministry
of Foreign Affairs, 2011).
Figure 7. Estonian industrial production change 2002-2010 (percetages)
4.1.2 Current situation (2011-2012)
According to the CIA (Central Intelligence Agency) the World Factbook (2012), Esto-
nian industrial production growth rate was 18% in 2011. This percentage includes
manufacturing, mining and construction and gives annual percentage increase in in-
dustrial production. In country comparison Estonia locates in third place in the world
(CIA, 2012) (date of information might be different for countries).
Estonia took the euro into use as currency in 1 January 2011 (Official Gateway to Es-
tonia, 2011). This encouraged more foreign business to invest into Estonian market
and made it more attractive. Not only had it given boost and confidence to foreign
companies, but also to local companies as they can rely more on euro zone countries.

18
Companies‟ internationalization became easier and foreign market is now more acces-
sible. Foreign exports increased as a result of accepting new currency.
Despite the attractiveness of euro as a currency, Estonia is again facing a downstream
in economy and this affects industrial market heavily. Industrial production in Estonia
decreased 6.1 percentages in March 2012. In autumn 2011 economy started to slow
down because of financial crisis. Industrial companies in Estonia are rather small and
medium-sized and situation in Europe and World affects these companies negatively
as their customers are more cautious of the situation.
Figure 8. Estonian industrial production change 1/2011 - 6/2012 (percetages)
4.1.3 Future estimations
As economic situation has been changing quick and affecting also industrial market, it
is difficult to find information on industrial production change for future. In The Baltic
Course article 15 June 2012 Juhan Tere writes that about 87 % of Estonian industrial
companies are rather optimistic about the future and except to have even higher turn-
over in 2012 than they had in 2011.
Estonia.eu (2012) states that according to the 2012 forecast of the Estonian Ministry of
Finance, the Estonian economy will grow by 1.7% in 2012. In 2014-2016 Estonian eco-
nomic growth is expected to stabilise at around 3.5%
19
.
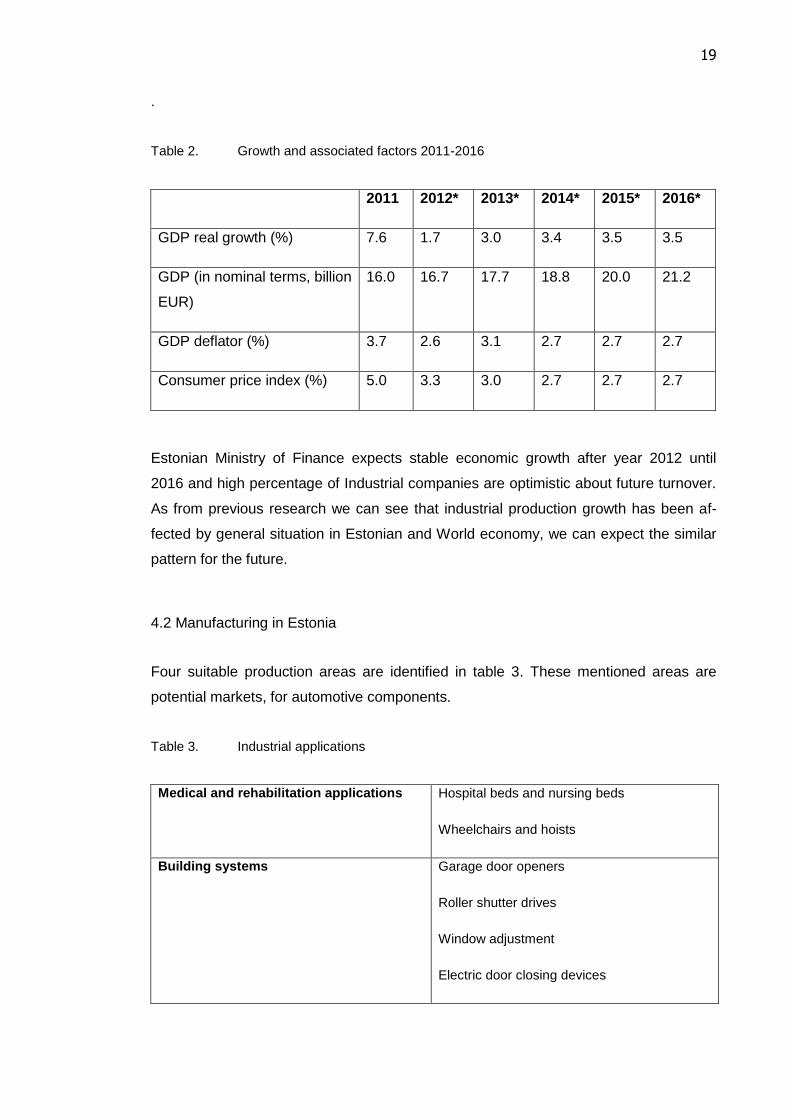
Table 2. Growth and associated factors 2011-2016
Main economic indicators 2011 2012* 2013* 2014* 2015* 2016*
GDP real growth (%) 7.6 1.7 3.0 3.4 3.5 3.5
GDP (in nominal terms, billion
EUR)
16.0 16.7 17.7 18.8 20.0 21.2
GDP deflator (%) 3.7 2.6 3.1 2.7 2.7 2.7
Consumer price index (%) 5.0 3.3 3.0 2.7 2.7 2.7
Estonian Ministry of Finance expects stable economic growth after year 2012 until
2016 and high percentage of Industrial companies are optimistic about future turnover.
As from previous research we can see that industrial production growth has been af-
fected by general situation in Estonian and World economy, we can expect the similar
pattern for the future.
4.2 Manufacturing in Estonia
Four suitable production areas are identified in table 3. These mentioned areas are
potential markets, for automotive components.
Table 3. Industrial applications
Medical and rehabilitation applications
Hospital beds and nursing beds
Wheelchairs and hoists
Building systems
Garage door openers
Roller shutter drives
Window adjustment
Electric door closing devices
20
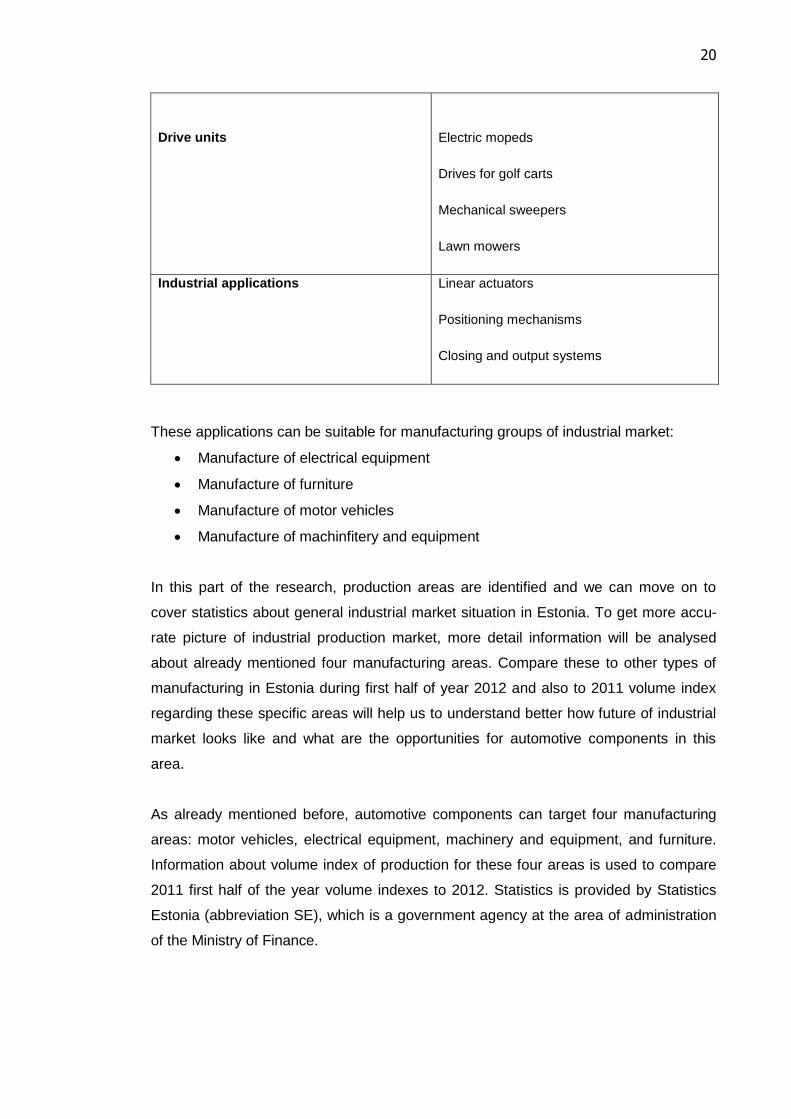
Drive units
Electric mopeds
Drives for golf carts
Mechanical sweepers
Lawn mowers
Industrial applications
Linear actuators
Positioning mechanisms
Closing and output systems
These applications can be suitable for manufacturing groups of industrial market:
Manufacture of electrical equipment
Manufacture of furniture
Manufacture of motor vehicles
Manufacture of machinfitery and equipment
In this part of the research, production areas are identified and we can move on to
cover statistics about general industrial market situation in Estonia. To get more accu-
rate picture of industrial production market, more detail information will be analysed
about already mentioned four manufacturing areas. Compare these to other types of
manufacturing in Estonia during first half of year 2012 and also to 2011 volume index
regarding these specific areas will help us to understand better how future of industrial
market looks like and what are the opportunities for automotive components in this
area.
As already mentioned before, automotive components can target four manufacturing
areas: motor vehicles, electrical equipment, machinery and equipment, and furniture.
Information about volume index of production for these four areas is used to compare
2011 first half of the year volume indexes to 2012. Statistics is provided by Statistics
Estonia (abbreviation SE), which is a government agency at the area of administration
of the Ministry of Finance.

21
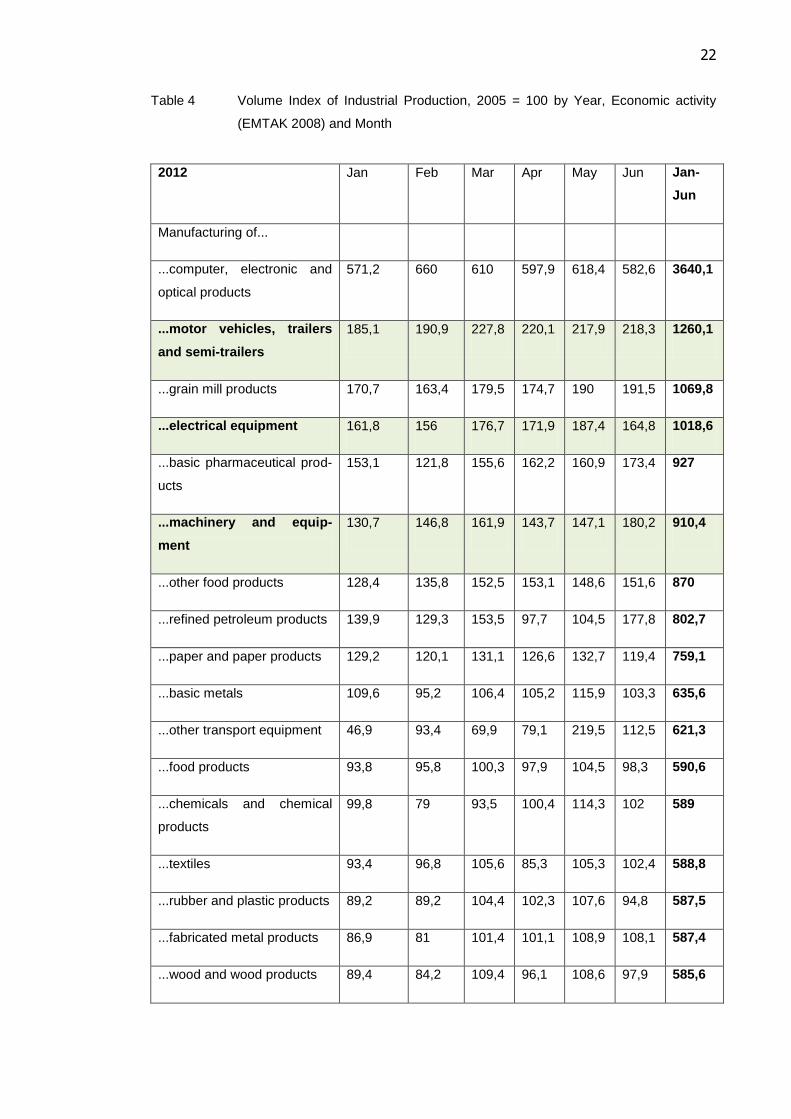
Table 4 includes some of the manufacturing groups that have been presented in Esto-
nia in 2012 until the end of June to compare different industries. This helps to find out
in which place four already identified production areas are located in. Out of these four
groups, that we are targeting, motor vehicles, trailers and semi-trailers have the biggest
volume in this time period. In overall results it is located in second place after com-
puter, electronics and optical products. Electrical equipment and machinery are ranking
high as well compared to most of groups. Furniture, which is rather small group for
automotive components, is only group, out of these four, that is located in the back part
of the table with volume index of 537, 6. From these results, we can see that most of
the biggest volumes are produced in the areas that are suitable for automotive division
industrial business.
In table 5 we can see the 2012 results compared to 2011 first half of the year. The big-
gest volume increase is happening in electrical equipment manufacturing compared to
same months in previous year. Even though motor vehicles manufacturing is located in
second place in overall manufacturing table in 2012, volumes of this sector are drop-
ping the most out of these four manufacturing areas. Change in furniture manufacturing
is rather small and volumes stay more or less the same as year ago. Machinery and
equipment manufacturing is changing a lot over the months. In 2011 there was stable
increase regarding volumes. In 2012 started with promising results, but dropped in April
and March. June 2012 looks again better for machinery production. The overall results
for six months have grown for electrical equipment, machinery and furniture. Volume
index for motor vehicles has decreased compared to previous year.
22
Table 4 Volume Index of Industrial Production, 2005 = 100 by Year, Economic activity
(EMTAK 2008) and Month
2012 Jan Feb Mar Apr May Jun Jan-
Jun
Manufacturing of...
...computer, electronic and
optical products
571,2 660 610 597,9 618,4 582,6 3640,1
...motor vehicles, trailers
and semi-trailers
185,1 190,9 227,8 220,1 217,9 218,3 1260,1
...grain mill products 170,7 163,4 179,5 174,7 190 191,5 1069,8
...electrical equipment 161,8 156 176,7 171,9 187,4 164,8 1018,6
...basic pharmaceutical prod-
ucts
153,1 121,8 155,6 162,2 160,9 173,4 927
...machinery and equip-
ment
130,7 146,8 161,9 143,7 147,1 180,2 910,4
...other food products 128,4 135,8 152,5 153,1 148,6 151,6 870
...refined petroleum products 139,9 129,3 153,5 97,7 104,5 177,8 802,7
...paper and paper products 129,2 120,1 131,1 126,6 132,7 119,4 759,1
...basic metals 109,6 95,2 106,4 105,2 115,9 103,3 635,6
...other transport equipment 46,9 93,4 69,9 79,1 219,5 112,5 621,3
...food products 93,8 95,8 100,3 97,9 104,5 98,3 590,6
...chemicals and chemical
products
99,8 79 93,5 100,4 114,3 102 589
...textiles 93,4 96,8 105,6 85,3 105,3 102,4 588,8
...rubber and plastic products 89,2 89,2 104,4 102,3 107,6 94,8 587,5
...fabricated metal products 86,9 81 101,4 101,1 108,9 108,1 587,4
...wood and wood products 89,4 84,2 109,4 96,1 108,6 97,9 585,6

23
...furniture 88,9 85,8 101,8 85,6 93,7 81,8 537,6
...leather and related prod-
ucts
86,9 77,8 88,5 82,5 87,5 92,9 516,1
...other non-metallic mineral
products
59,5 53,4 66,3 71,2 85,7 88,7 424,8
...wearing apparel 63,5 67,3 60,5 55,5 65,5 76 388,3
...computers and peripheral
equipment
34,3 32,5 38 28,7 34,9 37,4 205,8
Table 5. Volume Index of Industrial Production, 2005 = 100 by Economic Activity (EMTAK
2008), Year and Month
Manufacturing of ... Jan Feb Mar Apr May Jun
... electrical equipment 2011 130,8 133,1 164,5 142,3 159,1 147,4
2012 161,8 156 176,7 171,9 187,4 164,8
change 31 22,9 12,2 29,6 28,3 17,4
... machinery and equipment 2011 96,8 115,4 142,2 143,8 149,5 164,3
2012 130,7 146,8 161,9 143,7 147,1 180,2
change 33,9 31,4 19,7 -0,1 -2,4 15,9
... motor vehicles, trailers and
semi-trailers
2011 214,4 206,1 249,8 226,3 229,9 225,7
2012 185,1 190,9 227,8 220,1 217,9 218,3
change -29,3 -15,2 -22 -6,2 -12 -7,4
...of furniture 2011 85,3 85,7 102,1 86,7 89,8 78,8
2012 88,9 85,8 101,8 85,6 93,7 81,8
change 3,6 0,1 -0,3 -1,1 3,9 3

24
4.3 Summary of Estonian market situation
The automotive products were described and the main industrial markets for these
items were highlighted. By looking at general industrial market situation gave better
understanding of what can influence the overall industry and what the future might look
like. Industry is affected by foreign demand and local economic situation. Within all
industrial areas, mining and electricity are mostly affected by current financial crisis in
the Europe and manufacturing is rather more independent.
This paper focuses more on manufacturing area. Surrounding crisis and foreign de-
mand is important factor for manufactory. Current economic situation is cooling down
the demand, because of consumer‟s insecurity, but keeps business still active and
more unpredictable.
Most industrial companies see positive increase in sales compared to previous year
despite of some difficulties. There is stable increase expected in real Gross domestic
product (abbreviation GDB) for next four years. Out of four production areas, that was
most suitable for automotive components, only motor vehicle and trailer manufacturing
volume index is negative compared to previous year. Despite the negative movement,
it is still located as one of the top manufacturing area compared to others. The other
three markets are increasing.
25
5 Further market insights
Even though the secondary data provided useful information regarding industrial mar-
ket and manufacturing situation generally, information is not specific enough and is
difficult to find. To gain better understanding and more accurate information of the non-
automotive industrial market, which automotive companies can target with their prod-
ucts, qualitative research is needed. Primary data is collected from the companies that
are operating in industrial market in Estonia and might be possible targets for automo-
tive components. Public company listings, that are available in internet, and personal
social networks were used to locate companies, that can fit the criteria, for primary re-
search.
The primary research involves two steps: collecting data and analysing data. Tele-
phone interviews and questionnaires, which were sent out by e-mail, were used to col-
lect data. Research is carried out to collect information for specific reasons, which is
used to support secondary data that was gathered from public sources. In case of this
research, qualitative research was needed to get more accurate information regarding
market opportunities for automotive components that are used in non-automotive appli-
cations.
Due to a small market available, because of limited geographic area and specific mar-
ket, not many companies were found for the interviews. Despite the small number of
respondents, the sample is still valid and represents the high percentage of real num-
ber of companies that are operating in Estonian industrial manufacturing market. Some
of the companies could not be reached by phone or was not able to answer questions
at this point of time. Questionnaires were sent by e-mail to these companies. Rest of
the respondents was interviewed over the phone.
5.1 Phone interviews
Out of all possible interview types, phone interview was selected as a primary method
when collecting the data. This option was chosen because of its advantages over other
types. The biggest advantages of having interview over the phone, not face-to-face, are
26
time and cost. As in this case the market is located in different country than is the loca-
tion of researcher, face-to-face interview gets logistically more complicated. Most of the
companies that were interviewed were not in the same area in Estonia. Rather large
sample was chosen for the research and face-to-face interview with each company
would have been too time-consuming. Having interview by calling the person directly
has also its advantages over the paper version of questionnaire that is sent either by
post or by e-mail. E-mail or questionnaire can be easily forgotten or ignored by the re-
spondent. Getting quick and efficient answer is easiest by phone and more comfortable
for both sides- to interviewee and interviewer.
Some problems came up when having interview by phone. The biggest disadvantage
was that person, who answered the call, was not often the person, who is familiar with
the topic. In some cases, they could not know at this moment, whom to contact and
who could be the right colleague of his/hers that most likely can answer the questions.
All of these situations were eventually solved out and responsible person was found.
The second problem appeared when some of the respondent felt themselves uncom-
fortable when using the telephone and it made theme nervous in the beginning. Also
this problem was eliminated later on during the phone interview and interviewees got
more relaxed and were willing to give the answers.
Questionnaire was used as a base of the interview. Before each interview, Pre-
Interview Statement was told and methods of the interview were explained. The inter-
view followed as a next step. All the interviews were conducted in Estonian language
and were identical in nature. Results of the phone interviews were recorded in written
to the paper copy of research questions form.
Pre-Interview Statement is added as an Appendix 2 and interview questions are inden-
tified according to questionnaire that is added as an Appendix 1.
The recipients were picked according to public company lists available in internet. As
there was no clear information available about manufacturing for each company, these
were still included in list as possible targets. Not only these four main manufacturing
areas, identified above, were covered, but also some other options were considered
when choosing companies for interview.
27
5.1.1 Interview results
Twenty phone interviews were conducted. Eight respondents were reached by phone.
Three interviewees asked to send questionnaire by e-mail and twelve companies could
not be reached by phone. Questionnaire was sent by e-mail also to these companies.
Out of five companies two do not have production in Estonia and one does not use
automotive components in their applications at this point of time. Two companies met
the criteria.
Primary research was done in June and in early August, which might be the reason
why such a high percentage of phone calls were not answered. Because of vacation
season, most of the business that were targeted, which are rather small or medium
sized, are having their holidays mainly during this period of time.
5.1.2 Results of discussions
Afterwards, when basic questions were gone through, there were several interesting
discussions about the topic, which were not included in questionnaire.
The most interesting topic was buying behaviour, which came up with two interviewees.
As a result of the discussions it was stated that for these two companies‟ price and
quality are the most important factors when purchasing automotive components for
their applications. Location of supplier did not matter as much, as long as the logistics
costs are included in total cost of product.
Second point that was made during the minutes that were outside of structured ques-
tions, were that in most cases these companies use retailers as their suppliers when it
comes to these specific components. Reason for this is small annual volumes.
5.2 Questionnaires by e-mail
Original idea was to interview all the possible companies over the phone, because of
bigger percentage of possibility to receive the answers and to get quicker respond.
Change in plans acquired when several targets from the list did not answer to calls or
28
were in the situation where giving the answers was rather complicated over the phone.
As an alternative, thirty one questionnaires were sent out by e-mail.
Questionnaire were originally created in English and in some cases translated into Es-
tonian. Language was agreed over the phone for questionnaires and most of respon-
dent did not mind English as a language of questions. Dichotomous, with only two op-
tions to choose from, and multiple questions were given, which made answering easier
and quicker for respondents. Despite of the difference in language, all of the question-
naires were identical. Not many general interest questions were asked in the begin-
ning. Main interest was in next four areas:
Name of the company
Position in the company of the person, who is filling in the questionnaire
Age of the company
Company‟s main production focus area
Position in the company shows how knowledgeable this person is about this area and
how reliable can be the results provided by him/her.
Rest of the questions is covering more specifically above mentioned automotive com-
ponents and general information of industrial market situation (seen through the eyes
of company). A copy of the questionnaire is added as an Appendix 1.
5.2.1 Questionnaire results
Forty five of questionnaires were sent out. As a result of this, seventeen replies were
sent back by e-mail and twenty eight companies did not answer by phone or by e-mail.
Not all of the companies were covering each criterion that was raised in the market
opportunities section. Out of twenty companies six of questionnaire respondents do not
have production in Estonia and four of seventeen companies do not use automotive
components in their applications in this point of time. Eleven companies met the crite-
ria. Seven out of these eleven companies were operating in furniture industry and of-
fered best opportunities for automotive components in terms of volumes. Furniture
companies use automotive products in their electrical furniture, for example: electrical
beds, desks, office furniture, and medical furniture. Volumes are rather small, but high
compared to other manufacturing areas. Production of furniture is also simpler and

29
more sustainable because of this. Machinery and electrical equipment might need
more specific spare parts that needs to be developed as a new product that is specially
made for this certain company´s application.
5.3 Overall results
Questionnaire and phone interview results are shown in Appendix 3, which is added to
this thesis. Names of the companies are not mentioned in front of the results, because
of statement mentioned in Pre-Interview and request of several respondents. Inter-
viewees are marked as numbers.
As an overall result, five phone interviews were held and forty five questionnaires were
sent by e-mail. Twenty two answers were received.
Based on the questionnaire and interviews data, we can say that there is active indus-
trial market available for automotive components. In terms of size of volume, most of
the companies are rather small and suitable customers for resellers than for direct sup-
pliers. The most used automotive component, according to questionnaire respondents
are sensors and switches, which is used mostly in furniture manufacturing purpose.
Smallest demand according to this research is for industrial plugs.
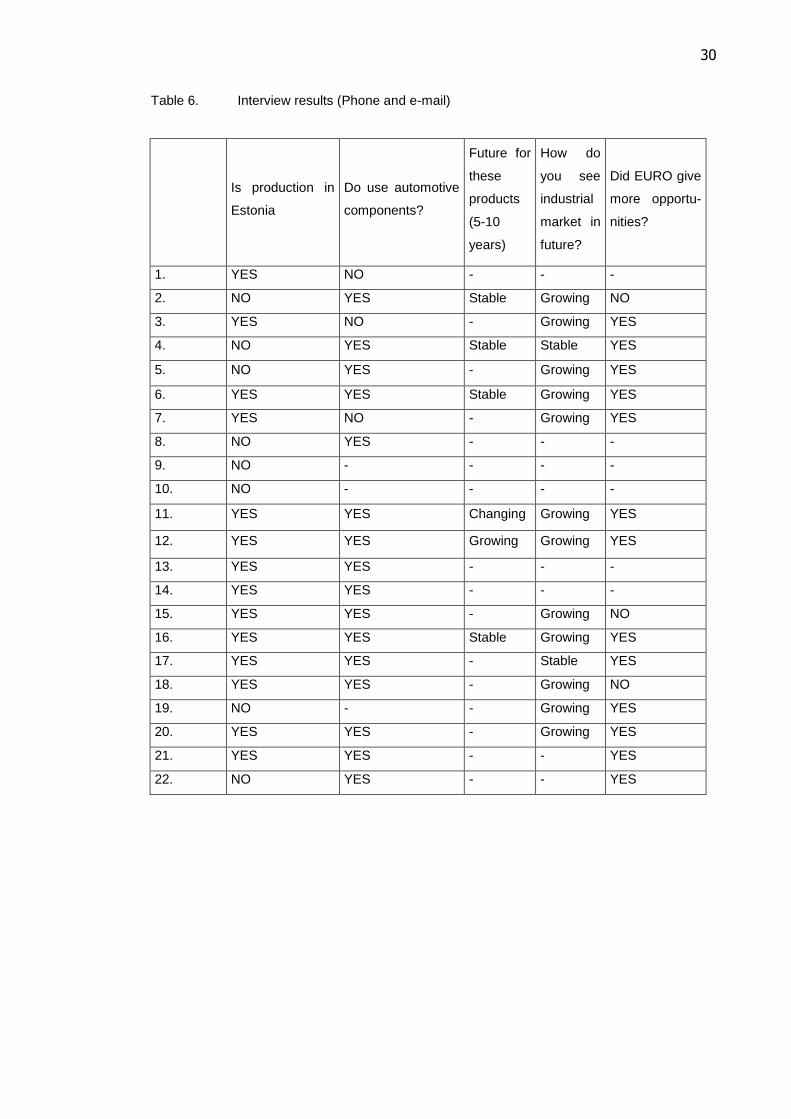
Table 6 gives an overview of industrial market situation generally based of interview
results. Most companies that were interviewed for this research see growth in Estonian
industrial market. 60% of respondent think that market is growing, 10% see that it re-
mains stable and 30% out of twenty two respondents did not answer the question. No
one thought that demand is decreasing. 50% of interviewees find that accepting EURO
as a currency, influences Estonian industrial market positively and gives more business
opportunities for their companies. Rest of the respondents did not agree with this or did
not answer the question at all. Reason for this might be that these certain companies
that answered “yes” have managed to have more international contacts and business
deals after entering the euro zone.
30
Table 6. Interview results (Phone and e-mail)
Is production in
Estonia
Do use automotive
components?
Future for
these
products
(5-10
years)
How do
you see
industrial
market in
future?
Did EURO give
more opportu-
nities?
1. YES NO - - -
2. NO YES Stable Growing NO
3. YES NO - Growing YES
4. NO YES Stable Stable YES
5. NO YES - Growing YES
6. YES YES Stable Growing YES
7. YES NO - Growing YES
8. NO YES - - -
9. NO - - - -
10. NO - - - -
11. YES YES Changing Growing YES
12. YES YES Growing Growing YES
13. YES YES - - -
14. YES YES - - -
15. YES YES - Growing NO
16. YES YES Stable Growing YES
17. YES YES - Stable YES
18. YES YES - Growing NO
19. NO - - Growing YES
20. YES YES - Growing YES
21. YES YES - - YES
22. NO YES - - YES

31
6 Conclusions
The conclusion section will wrap up all the information and the previous analyses. In
addition, it the answers the research questions set in the beginning. This section re-
ports the phase that covers the secondary and primary research results supported by
the theoretical framework.
The theory of marketing research process and entering a new market gave base infor-
mation of the investigation and further consideration. New market entry section led to
need for more detailed information of how market is measured and how understanding
buying behaviour and marketing mix can create better opportunities for the new en-
terer. This theory was used as base information when empirical research was done.
Before starting research for the main body of the thesis, another paper, which was writ-
ten previously in similar topic, was read and examined. The purpose for this was to see
what could be the result for similar research in a small geographical area. This gave
the opportunity to compare the similarities and differences of two studies and led to a
discussion about why these appeared.
6.1 Answering the secondary questions
The first question set to be answered was: how economic situation affects Estonian
industrial market and how has it changed over the years? The section four gives an
overview of how industrial business is affected by general economic situation in Esto-
nia. Relaying on data collected from secondary sources the conclusion for this question
would be that there is a rather tight connection between other economical sections.
Figure 7 shows that industrial production was affected by economic crisis in 2008. Fur-
thermore, the connection was found when similar estimations were applied for the fu-
ture by Estonian Ministry of Finance and companies that are currently operating on the
industrial market. Steady growth is expected for Estonian economy generally as well as
for industrial market.
The second aim was to investigate how big the market generally is and in terms of vol-
umes and buying preferences by the customers? Firstly it was important to understand
into which market section this project can be suitable. According to the study done, the
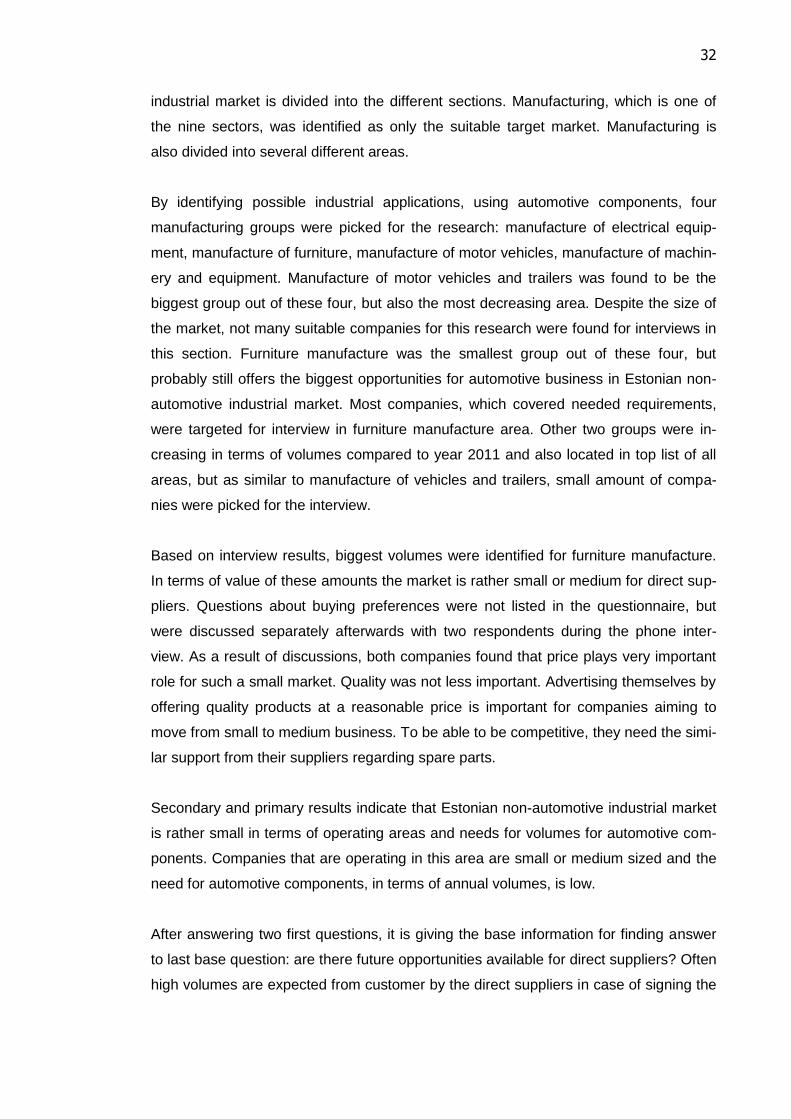
32
industrial market is divided into the different sections. Manufacturing, which is one of
the nine sectors, was identified as only the suitable target market. Manufacturing is
also divided into several different areas.
By identifying possible industrial applications, using automotive components, four
manufacturing groups were picked for the research: manufacture of electrical equip-
ment, manufacture of furniture, manufacture of motor vehicles, manufacture of machin-
ery and equipment. Manufacture of motor vehicles and trailers was found to be the
biggest group out of these four, but also the most decreasing area. Despite the size of
the market, not many suitable companies for this research were found for interviews in
this section. Furniture manufacture was the smallest group out of these four, but
probably still offers the biggest opportunities for automotive business in Estonian non-
automotive industrial market. Most companies, which covered needed requirements,
were targeted for interview in furniture manufacture area. Other two groups were in-
creasing in terms of volumes compared to year 2011 and also located in top list of all
areas, but as similar to manufacture of vehicles and trailers, small amount of compa-
nies were picked for the interview.
Based on interview results, biggest volumes were identified for furniture manufacture.
In terms of value of these amounts the market is rather small or medium for direct sup-
pliers. Questions about buying preferences were not listed in the questionnaire, but
were discussed separately afterwards with two respondents during the phone inter-
view. As a result of discussions, both companies found that price plays very important
role for such a small market. Quality was not less important. Advertising themselves by
offering quality products at a reasonable price is important for companies aiming to
move from small to medium business. To be able to be competitive, they need the simi-
lar support from their suppliers regarding spare parts.
Secondary and primary results indicate that Estonian non-automotive industrial market
is rather small in terms of operating areas and needs for volumes for automotive com-
ponents. Companies that are operating in this area are small or medium sized and the
need for automotive components, in terms of annual volumes, is low.
After answering two first questions, it is giving the base information for finding answer
to last base question: are there future opportunities available for direct suppliers? Often
high volumes are expected from customer by the direct suppliers in case of signing the

33
contract with them. According to research the result it was seen that Estonian market in
terms of volumes is small, but increasing. This gives small opportunities for entering
the market now, but it can change a lot during the years if the estimations regarding
economic growth are reliable for the future.
There are more opportunities available for retailers and smaller suppliers that can
benefit from signing the supply contract based on low annual volumes. The reason why
bigger suppliers are not interested in this case is mainly time capacity used when work-
ing with smaller customers. The final result from this business is that it is often not prof-
itable enough for large companies.
Results of investigation and answers for questions that were asked, identified some
opportunities that are available for large automotive component suppliers in Estonian
non-automotive industrial market. Next section will use the information available and
give an overview of recommendations that were done. There is not only one option
available when entering this market, but a possibility to pick or use even several ap-
proaches.
6.2 Recommendations
Several factors were taken into account and three recommendations were made as a
result of this research. Recommendations are based on the assumption that supplier
will make an effort to enter the market.
Recommendation 1: One possibility to enter new small market is to find a partner,
which can be either a retailer or smaller company operating in the same field. This op-
tion will create an opportunity to work with only one company that includes all these
smaller companies, which are available for this business. That solution reduces issues
with time capacity and gives safe opportunity to monitor market for the future activities.
Recommendation 2: The second recommendation is to investigate furniture market
more closely and find out if the products available for this area are suitable as originals
or need to be modified. If market seems to be increasing enough then this could be
entered already in the beginning even if that may use some extra time capacity. This

34
can create a solid base for future activities. That option is possible only in case when
other business areas within the division cover the loss during the time of entry.
Recommendation 3: As results for Estonian market research are similar to research
done for Iberian market, the same approach can be used. Entering the market as a
technical solution provider, this gives an opportunity to offer them customized products.
This approach may help the applications to adapt also spare parts that are provided by
the supplier and could lead to a higher demand in terms of volumes for the future. This
is case where supplier itself crates a market for themselves and at the same time
makes it more difficult to other suppliers to enter.
6.3 Answering the main question
This paper concentrates on finding out what are the opportunities and market solutions
available for automotive components that can be used in non-automotive applications.
Based on the result we can say that at current time there is a small or medium market
available for automotive components. Despite the small market several recommenda-
tions were made for supplier. According to information available about Estonian econ-
omy and manufacturing area it can be stated that some increase is expected regarding
opportunities for the future and this creates more solutions for entering this specific
market.
Both options are available: to offer already existing components or to develop new
products to create new market opportunities. Still it is necessary to keep in mind that
current market is more profitable for smaller suppliers or retailers because of the low
volumes demand.
6.4 Further studies
The aim of the study to search for wider area and to find out what might be the oppor-
tunities. Deeper investigation should be done to understand different manufacturing
groups better. As already mentioned above in the recommendations section, based on
the information gathered during primary research done for this paper, furniture market
is worth to be researched closer. By narrowing down the research area and product

35
selection will create more advantages when entering the area that seems to be offering
the most opportunities for automotive components in Estonian industrial manufacture
market. A similar approach, which was used for this paper, could be applied for further
more investigations.
36
References
Central Intelligence Agency. (2012). The World Factbook: Country comparison: indus-
trial production growth rate.
https://www.cia.gov/library/publications/the-world-
factbook/rankorder/2089rank.html?countryName=Estonia&countryCode=en&re-
gionCode=eur&rank=3#en. Retrieved 7th August 2012 .
Central Intelligence Agency. (2012). The World Factbook: Estonia.
https://www.cia.gov/library/publications/the-world-factbook/geos/en.html. Retrieved 15th
July 2012 .
Deller, J. (2011) The Iberian Medical Furniture Market as a potential I-Business Key
Market.
Estonian Ministry of Foreign Affairs. (2011). Estonian Economy Grew 2.5 Percent in
2010. http://www.vm.ee/?q=node/10763. Retrieved 7th August 2012 .
European Automobile Manufacturers „ Associate. Country profiles: Estonia.
http://www.acea.be/index.php/country_profiles/detail/estonia. Retrieved 13th July 2012 .
Gordon, M., Scott, J., (1998) " A Dictionary of Sociology, Oxford University Press Inc.,
New York.
Internet Centre for Management and Business Administration. (2010). Definition of
market. http://www.netmba.com/marketing/market/definition/. Retrieved 4th March 2012
Kermally, S., (2004) Gurus on Marketing, Thorogood Publishing, London.
Kotler, P., (1997) Marketing Management Analysis, Planning, Implementation, and
Control, 9th ed., Upper Saddle River, Prentice-Hall, Inc, New Jersey.
Malhotra, N.K., Birks, D.F. (2006) Marketing Research: An applied approach, 2nd Euro-
pean edition, Edinburgh Gate: Prentice Hall, Inc.

37
Mishra, M.N. (2008) Modern Marketing Research, Mumbai, IND: Global Media
Murray, J.A., O´Driscoll, A. (1996) Strategy and process in marketing, Prentice Hall
Europe, Hertfordshire.
Official Gateway to Estonia. (2011). Changeover to the euro in Estonia from 1 January
2011. http://estonia.eu/about-estonia/economy-a-it/euro.html. Retrieved 7th August
2012 .
Official Gateway to Estonia. (2012). Economy in numbers. http://estonia.eu/about-
estonia/economy-a-it/economy-in-numbers.html. Retrieved 7th August 2012 .
Paley, N., (2007) Marketing Strategy Desktop Guide, 2nd Ed., Thorogood Publishing,
London.
Robert Bosch Group. (2012). Annual Report 2011.
http://www.bosch.com/en/com/bosch_group/bosch_figures/publications/publications.ht
ml. Retrieved 10th July 2012 .
Robert Bosch Group. (2012). Automotive Technology sales.
http://www.bosch.com/en/com/bosch_group/bosch_figures/automotive_technology_bos
ch_figures/automotive-technology.html. Retrieved 10th July2012 .
Robert Bosch Group. (2011). The Bosch Group In North America. http://www.bosch-
press.com/tbwebdb/bosch-usa/en-US/PressText.cfm?Search=1&id=235. Retrieved
12th July 2012 .
Ruskin-Brown, I., (2006) Mastering Marketing, Thorogood Publishing, London.
Sherlekar, S.A., Sherlekar, V. S. (2010) Global Marketing Management, Global Media,
Mumbai.
Sontakki, C.N. (2010) Marketing Research, Global Media, Mumbai.

38
Statistical Office of the European Union. (2012). Industrial production index.
http://epp.eurostat.ec.europa.eu/tgm/web/table/description.jsp. Retrieved 7th August
2012 .
Statistics Estonia. (2012). About Statistics Estonia. http://www.stat.ee/organisation.
Retrieved 8th August 2012
The Baltic Course. (2012). Swedbank: Estonian industrial companies are optimistic
about the future. http://www.baltic-
course.com/eng/good_for_business/?doc=58771&underline=Estonian+industrial+comp
anies. Retrieved 7th August 2012 .
Webster, F. E., Wind, Y., (1972) Organizational Buying Behaviour, Prentice Hall,
Englewood Cliffs.
Whalley, A., (2010), Strategic Marketing, Ventus Publishing ApS, p. 65
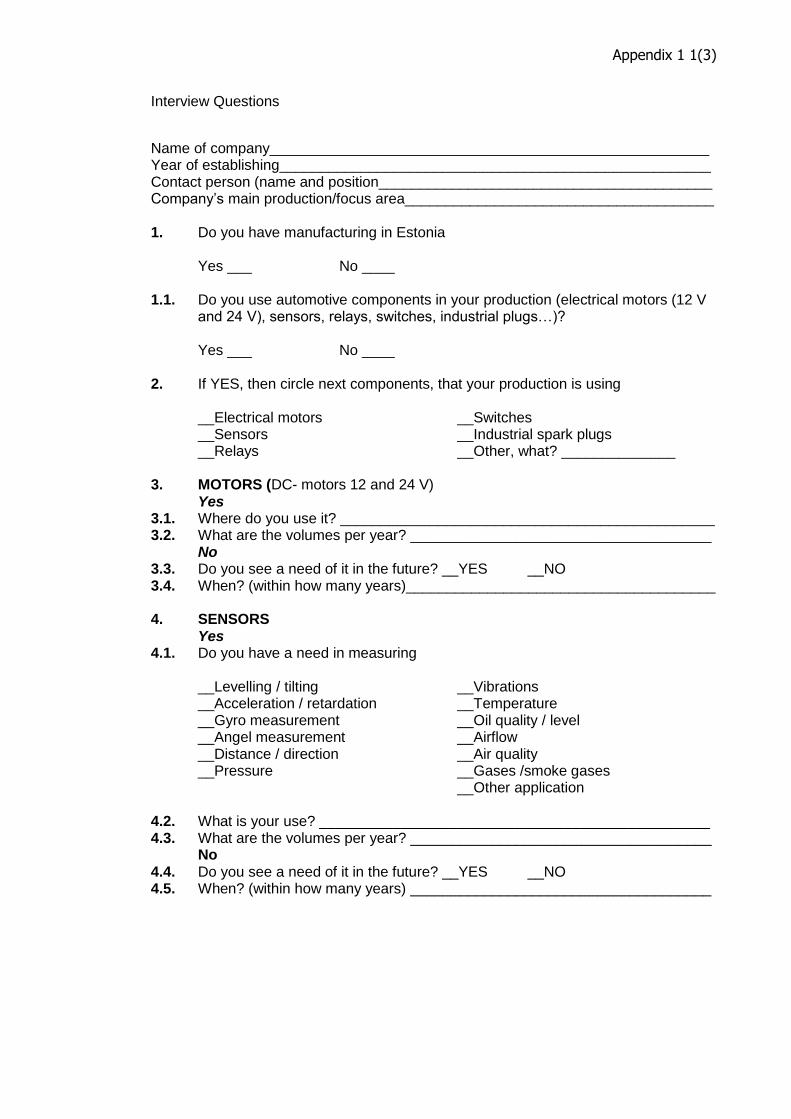
Appendix 1 1(3)
Interview Questions
Name of company______________________________________________________ Year of establishing_____________________________________________________ Contact person (name and position_________________________________________ Company‟s main production/focus area______________________________________ 1. Do you have manufacturing in Estonia
Yes ___ No ____ 1.1. Do you use automotive components in your production (electrical motors (12 V
and 24 V), sensors, relays, switches, industrial plugs…)?
Yes ___ No ____ 2. If YES, then circle next components, that your production is using
__Electrical motors __Sensors __Relays
__Switches __Industrial spark plugs __Other, what? ______________
3. MOTORS (DC- motors 12 and 24 V)
Yes 3.1. Where do you use it? ______________________________________________ 3.2. What are the volumes per year? _____________________________________
No 3.3. Do you see a need of it in the future? __YES __NO 3.4. When? (within how many years)______________________________________ 4. SENSORS
Yes 4.1. Do you have a need in measuring
__Levelling / tilting __Acceleration / retardation __Gyro measurement __Angel measurement __Distance / direction __Pressure
__Vibrations __Temperature __Oil quality / level __Airflow __Air quality __Gases /smoke gases __Other application
4.2. What is your use? ________________________________________________ 4.3. What are the volumes per year? _____________________________________
No 4.4. Do you see a need of it in the future? __YES __NO 4.5. When? (within how many years) _____________________________________

Appendix 1 2(3)
5. RELAYS Yes
5.1. Where do you use it? ______________________________________________ 5.2. What are the volumes per year? _____________________________________
No 5.3. Do you see a need of it in the future? __YES __NO 5.4. When? (within how many years)______________________________________ 6. SWITCHES
Yes 6.1. Where do you use it? ______________________________________________ 6.2. What are the volumes per year? _____________________________________
No 6.3. Do you see a need of it in the future? __YES __NO 6.4. When? (within how many years)______________________________________ 7. INDUSTRIAL SPARK PLUGS
Yes 7.1. Where do you use it? ______________________________________________ 7.2. What are the volumes per year? _____________________________________ 7.3. APPENDIX A (3/3)
No 7.4. Do you see a need of it in the future? __YES __NO 7.5. When? (within how many years)______________________________________
8. OTHER
Yes 8.1. Which component(s)? _____________________________________________ 8.2. Where do you use it? ______________________________________________ 8.3. What are the volumes per year? _____________________________________
No 8.4. Do you see a need of it in the future? __YES __NO 8.5. Which component(s)? _____________________________________________ 8.6. When? (within how many years) _____________________________________
9. How do you judge the future for need of these products in 5 to 10 years? (add
comments if needed) __Growing market ________________________________________________ __Steady market__________________________________________________ __Decreasing market ______________________________________________ __Other comments _______________________________________________
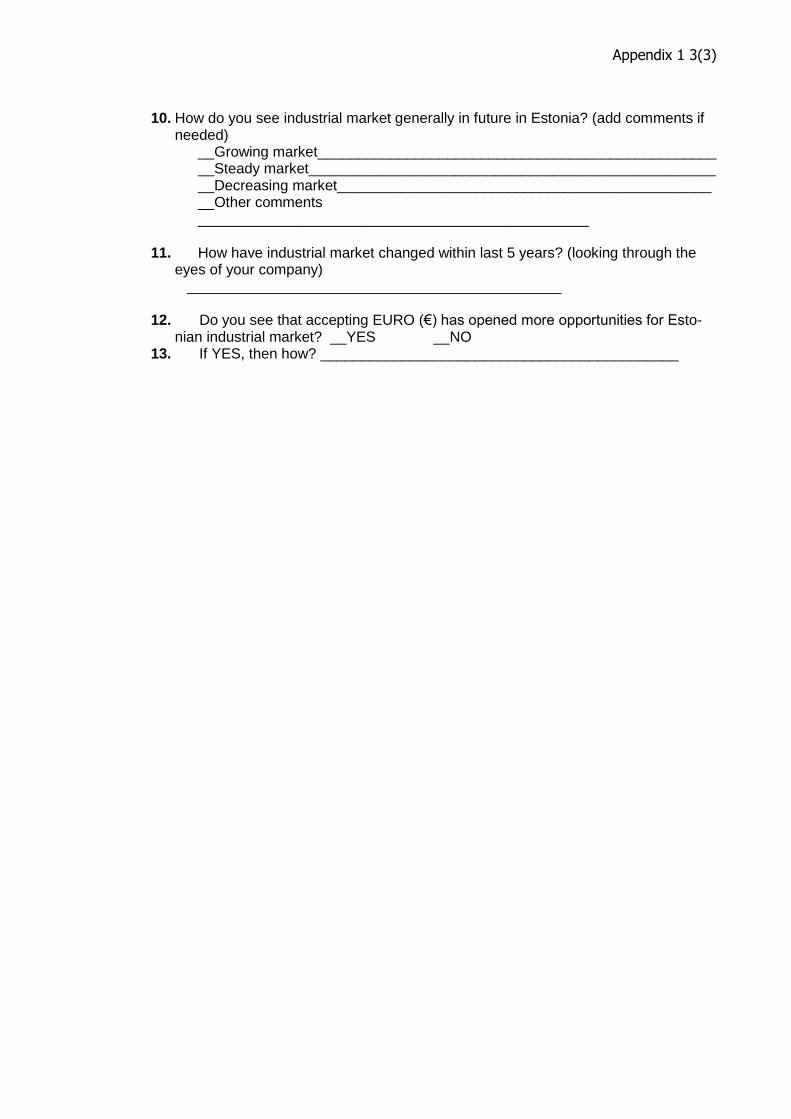
Appendix 1 3(3)
10. How do you see industrial market generally in future in Estonia? (add comments if
needed) __Growing market_________________________________________________ __Steady market__________________________________________________ __Decreasing market______________________________________________ __Other comments ________________________________________________
11. How have industrial market changed within last 5 years? (looking through the
eyes of your company) ______________________________________________
12. Do you see that accepting EURO (€) has opened more opportunities for Esto-
nian industrial market? __YES __NO 13. If YES, then how? ____________________________________________
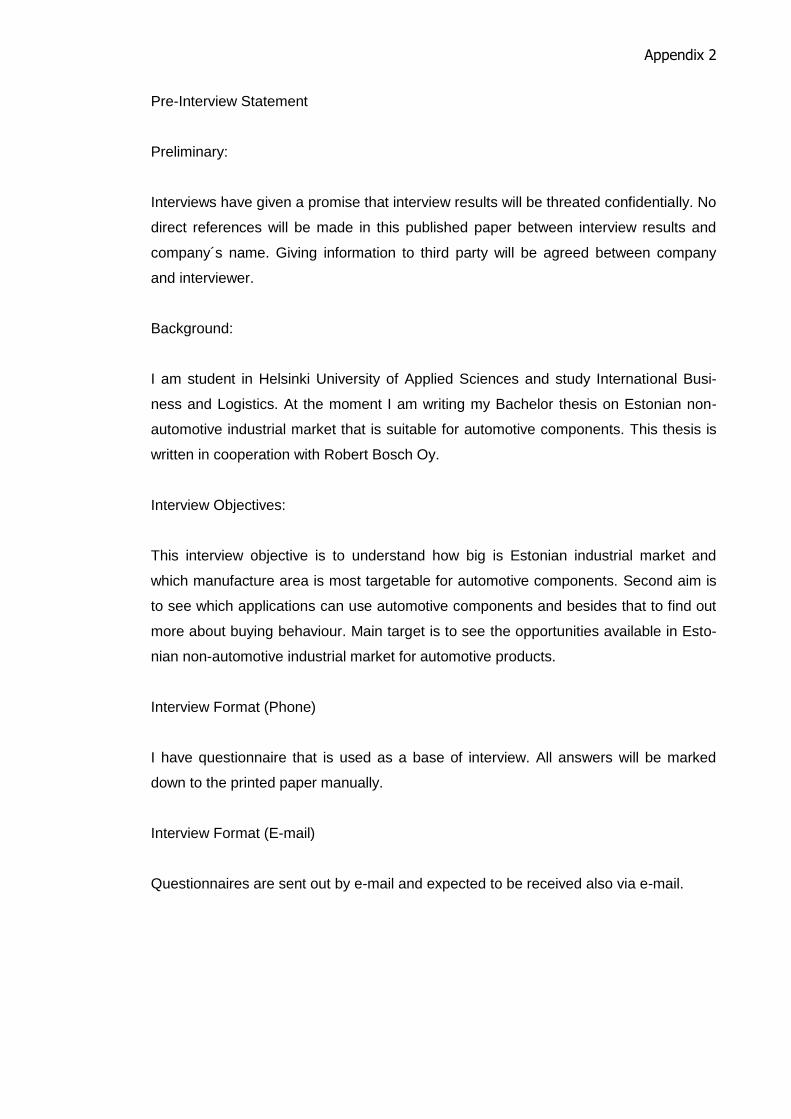
Appendix 2
Pre-Interview Statement
Preliminary:
Interviews have given a promise that interview results will be threated confidentially. No
direct references will be made in this published paper between interview results and
company´s name. Giving information to third party will be agreed between company
and interviewer.
Background:
I am student in Helsinki University of Applied Sciences and study International Busi-
ness and Logistics. At the moment I am writing my Bachelor thesis on Estonian non-
automotive industrial market that is suitable for automotive components. This thesis is
written in cooperation with Robert Bosch Oy.
Interview Objectives:
This interview objective is to understand how big is Estonian industrial market and
which manufacture area is most targetable for automotive components. Second aim is
to see which applications can use automotive components and besides that to find out
more about buying behaviour. Main target is to see the opportunities available in Esto-
nian non-automotive industrial market for automotive products.
Interview Format (Phone)
I have questionnaire that is used as a base of interview. All answers will be marked
down to the printed paper manually.
Interview Format (E-mail)
Questionnaires are sent out by e-mail and expected to be received also via e-mail.
Appendix 3
Interview Results (phone and e-mail)
“-“ marking stands for not answered question.
Is pro
ducti
on
in Es
tonia
Do us
e
autom
otive
comp
onen
ts?
Electr
ical
motor
s
Used
in
what
appli
catio
n
Volum
e
per y
earNe
ed fo
r
future
/
when
?
Senso
rsM
easur
ing
what?
Used
in
what
appli
catio
n
Volum
e
per y
ear
Need
for fu
ture /
when
?Re
lays
Used
in
what
appli
catio
n
Volum
e
per y
ear
Need
for
future
/
when
?
Switc
hes
Used
in
what
appli
catio
n
Volum
e
per y
ear
Need
for
future
/
when
?
Indust
rial
Spark
Plugs
Used
in
what
appli
catio
nVolum
e
per y
earNe
ed fo
r
future
/
when
?
Othe
r
comp
onen
ts
used?
Futur
e
for th
ese
produ
cts
(5-10
years
)
How
do
you s
ee
indust
rial
marke
t in
future
?
Did E
URO
give m
ore
oppo
rtunit
ies?
1.M
achin
eryYE
SNO
--
--
--
--
--
--
--
--
--
--
--
--
-
2.Ele
ctrica
l NO
YES
--
--
--
--
--
--
-YE
S-
Small
YES
--
--
-Sta
bleGr
owing
NO
3.M
achin
eryYE
SNO
--
--
--
--
--
--
--
--
--
--
--
-Gr
owing
YES
4.M
otor v
ehicle
sNO
YES
--
--
YES
--
-YE
SYE
SCa
rsM
edium
YES
YES
Cars
Med
iumYE
S-
--
-Se
veral
Stable
Stable
YES a
nd N
O
5.M
otor v
ehicle
sNO
YES
--
--
YES
-Au
tomoti
ve
use-
--
--
--
--
--
--
--
-Gr
owing
YES
6.M
otor v
ehicle
sYE
SYE
S-
--
-YE
SSe
veral
measu
remen
tsCa
rs
Depe
nds
on
dema
nd
YES
YES
Cars
Depe
nds
on
dema
nd
YES
YES
Cars
Depe
nds
on
dema
nd
YES
--
--
Seve
ralSta
bleGr
owing
Yes
7.M
achin
eryYE
SNO
--
--
--
--
--
--
--
--
--
--
--
-Gr
owing
YES
8.Ele
ctrica
l NO
YES
--
--
--
--
--
--
--
--
--
--
--
--
-
9.Ele
ctrica
l NO
--
--
--
--
--
--
--
--
--
--
--
--
--
10.
Furni
ture
NO-
--
--
--
--
--
--
--
--
--
--
--
--
-
11.
Mac
hinery
YES
YES
--
--
YES
--
--
YES
--
-YE
S-
--
--
--
-Ch
angin
gGr
owing
YES
12.
Mac
hinery
YES
YES
NO-
-NO
YES
Seve
ralSe
veral
Low
YES
--
--
YES
severa
llow
YES
--
--
-Gr
owing
Grow
ingYE
S
13.
Furni
ture
YES
YES
NO-
-NO
YES
--
ca 50
-
100
YES
NO-
-NO
NO-
--
--
--
-
14.
Furni
ture
YES
YES
YES
Offic
e
furnit
ure
Small
/
Med
iumYE
SNO
--
-NO
NO-
-M
aybe
in
future
NO-
-NO
--
--
-
15.
Mac
hinery
YES
YES
NO-
-NO
YES
Dista
nce,
pressu
re,
tempe
ratur,
oil
qualit
y
In dif
feren
t
devic
es
ca 10
0
pcs
YES
YES
In dif
feren
t
devic
esca
10 00
0YE
SYE
SIn
differ
ent
devic
esca
1000
YES
NO-
-NO
--
Grow
ingNO
16.
Furni
ture
YES
YES
YES
Beds
ca 10
0YE
SYE
SPr
essure
Beds
-YE
S-
--
--
--
--
--
--
Stable
Grow
ingYE
S
17.
Furni
ture
YES
YES
NO-
-NO
YES
Dista
nce,
pressu
re,
Seve
ral
appli
catio
nsLo
wYE
S-
--
--
--
--
--
--
18.
Furni
ture
YES
YES
NO-
-NO
NO-
--
NONO
--
NONO
--
NONO
-NO
YES
19.
Electr
ical
NO-
--
--
--
--
--
--
--
--
--
--
--
--
-
20.
Furni
ture
YES
YES
YES
Beds
> 50
YES
NO-
--
NONO
--
NONO
--
NONO
--
-NO
21.
Furni
ture
YES
YES
YES
Electr
ical
furnit
ureLo
wYE
S-
--
--
--
--
--
--
--
--
-
22.
Furni
ture
NOYE
S-
--
--
--
--
--
--
--
--
--
--
--
--

Appendix 4
List of Figures and Tables
List of Figures
Figure 1. Robert Bosch Group sales by business sectors: development 2011
Figure 2. Electric motors
Figure 3. Sensors
Figure 4. Relays
Figure 5. Switches
Figure 5. Spark Plugs
Figure 7. Estonian industrial production change 2002-2010 (percentages)
Figure 8. Estonian industrial production change 1/2011 - 6/2012 (percentages)
List of Tables
Table 1. Automotive components usage
Table 2. Growth and associated factors 2011-2016
Table 3. Industrial applications
Table 4. Volume Index of Industrial Production, 2005 = 100 by Year, Economic activity
(EMTAK 2008) and Month
Table 5. Volume Index of Industrial Production, 2005 = 100 by Economic Activity (EM-
TAK 2008), Year and Month
Table 6. Interview results (Phone and e-mail)