market manipulation what you - · pdf filemarket manipulation what you need to know to stay...
TRANSCRIPT

Market ManipulationWhat You need to know to stay profitable using Wyckoff / Volume Spread Analysis

Important DisclaimerTrading Stocks, Options on Stocks, Futures, Options on Futures, and retail off-exchange foreign currency transactions (FOREX) involves substantial risk of loss and is not suitable for all investors. Past performance, whether actual or indicated by historical tests of strategies, is no guarantee of future performance or success. There is a possibility that you may sustain a loss equal to or greater than your entire investment regardless of which asset class you trade (equities, options, futures or forex); therefore, you should not invest or risk money that you cannot afford to lose.

Gavin Holmes Author “Trading in the Shadow of the Smart Money” &
“The Complete Volume Spread Analysis System Explained”
Head Trader – Wyckoff Williams Investment Portfolio Hedge Fund

Hampshire Police Officer

Over 1000 presentations in 45 countries online and live
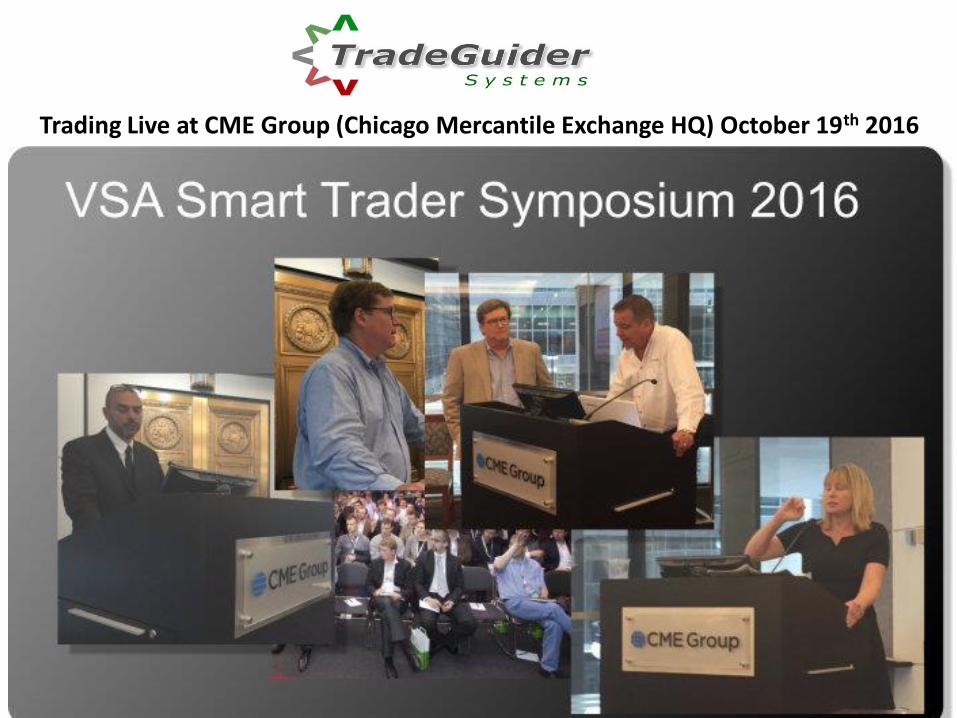
Trading Live at CME Group (Chicago Mercantile Exchange HQ) October 19th 2016

Are The Financial Markets Manipulated - Fact or Fiction?

Market Manipulation - Evidence

Market Manipulation - Evidence

Market Manipulation - Evidence

Market Manipulation - Evidence

Market Manipulation - Evidence

Market Manipulation - Evidence

Market Manipulation Gold and Silver

The Truth in the Newspaper!!

Andrew Maguire Former Goldman Sachs Trader and Whistle Blower
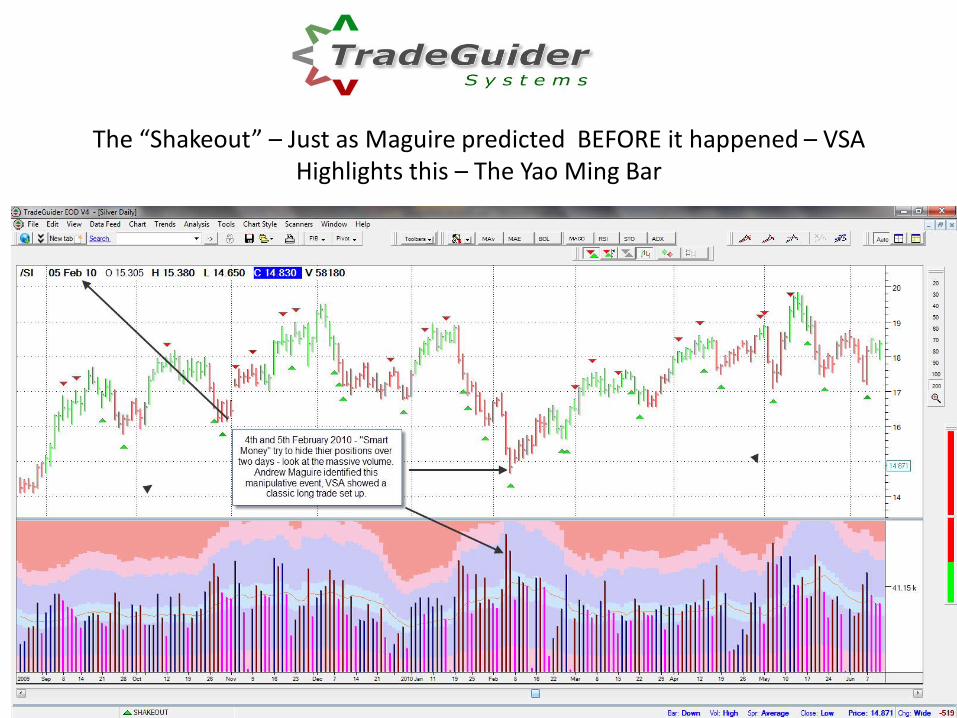
The “Shakeout” – Just as Maguire predicted BEFORE it happened – VSA Highlights this – The Yao Ming Bar

The Yao Ming Bar – What is it?

Houston’s Yao Ming would be ULTRA HIGH VOLUME on a chart!! He is
currently the tallest player in the NBA, at 2.29 m (7 ft 6 in).

CAN ANYONE SPOT YAO MING VOLUME?

The “Shakeout” – Just as Maguire predicted 3 months BEFORE it happened – VSA Highlights this – The Yao Ming Bar

The “Shakeout” – Wait for the trend to change and price to move above the top of the “Shakeout” bar. Stop loss below low of “Shakeout” bar.
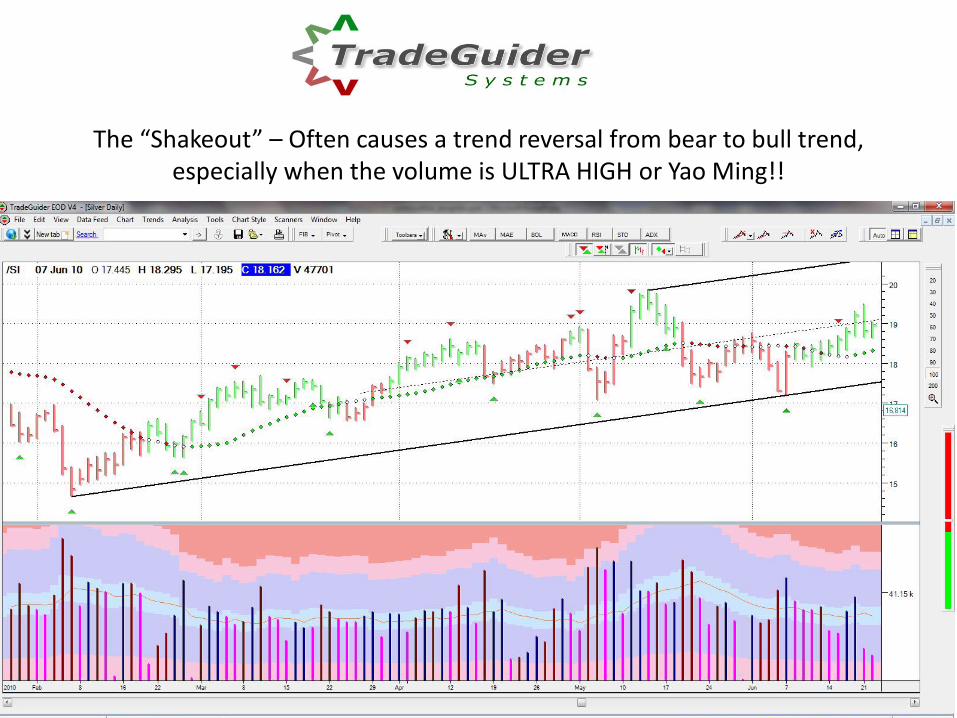
The “Shakeout” – Often causes a trend reversal from bear to bull trend, especially when the volume is ULTRA HIGH or Yao Ming!!

After a “Shakeout” is identified – WAIT. Market price action will move above the top of the “Shakeout” bar. Now we look for the following.

A “Test after a Shakeout” – ANY signal number with this description.

A “No Supply” – ANY signal number with this description.

The Masters & Teachers of the Wyckoff Method & Volume Spread Analysis
Tom Williams Richard Wyckoff

Richard Demille Wyckoff (November 2, 1873 – March 19, 1934) was a stock
market authority, founder and onetime editor of the Magazine of Wall Street
(founding it in 1907), and editor of Stock Market Technique.
"...Thousands of those who operate in the markets now recognize the fact that the
market momentarily indicates its own immediate future, and that these indications
are accurately recorded in the market transactions second by second, and
therefore those who can interpret what transactions take place second by second
or moment by moment have a distinct advantage over the general trading
public...."
Richard D Wyckoff, 1914

VSA Measures the forces that drive the markets

Inventor VSA - Tom George Williams - January 4th 1929 – November 7th 2016
“ If you can read a chart correctly, you will understand the
markets do not move randomly but are moved by the “Smart
Money” and you can see their intention at support and
resistance levels by looking for the footprints hidden in the
volume and price, and then you will have a chance to profit by
following their footsteps.
Volume is vital in your analysis, which is why the self regulated
exchanges around the world will not release true volume
figures until the day after trading took place!!
Tom Williams, 2016

What Is Volume Spread Analysiswww.volumespreadanalysis.com

Volume – Spread or Range of Bar and Closing Price

How Can Volume Spread
Analysis Identify These
Moves?
Volume = Activity
We are interested in volume
because it tells us the consensus
of opinion amongst the
“Smart Money”
The Spread and Close in Relation to the background Confirm

Will Volume Spread Analysis Work In All
Markets(Including Currencies)?

YES – EVEN IN FOREX

Friday 13th June 2014 – Pound Surges

Daily Chart GBP/USD SPOT FOREX MT4 Activtrades

Some Words of Wisdom from WD Gann

Scan Confirm Trade – The Concept• To identify trading opportunities by finding unusually high
volume on a chart (climactic action) followed by low volume (No Demand or No Supply) at the same price level.
• To show visually clear trend alignment in multiple timeframes.
• To alert the trader when a major VSA trade set up has been found in any timeframe via email.
• To alert the trader when a VSA sequential trader set up has been found in any timeframe via email.
• To allow a trader to monitor and scan hundreds of charts at one time so the system is “sniffing” out trading opportunities for the trader to then analyse on the charts.

Scan Confirm Trade – The Concept• To show when the market is in congestion using the
proprietary trading tools developed by TradeGuider Systems International.
• When the scanner is misaligned in multiple timeframes, no trade.
• When the scanner is aligned in multiple timeframes, possible VSA trade set up.
• Visual and audible alerts when trade set up located.
• Bar information window for bar by bar VSA analysis.
• Each VSA indicator has a number and a detailed description of market conditions that caused the indicator to appear.

The Market Participants – The “Herd” and The “Smart Money”

Soon You Will Be Trading in Harmony with “Smart Money”
To get our VSA info pack containing:• Beginners Guide to Trading the Markets online course
• Trading in the Shadow of the Smart Money - complete ebook
• Complete VSA System Explained ebook
• Scan Confirm Trade online training course
• Articles and webinars
• Copy of todays slides
Value £297 – Yours today with my compliments
Text your email to me – 07801 267160