market efficiency and volatility spillovers in futures and · pdf filemarket efficiency and...
TRANSCRIPT

Market Efficiency and Volatility Spillovers in
Futures and Spot Commodity Market: The
Agricultural Sector Perspective
Ajay Kumar ChauhanAssistant Professor, (Finance),
IMT Ghaziabad
Email:[email protected].
Shikha Singh Assistant Professor (Economics),
LBSIM, Delhi
Email:[email protected]
Aanchal AroraResearch Scholar (JRF),
Department of Commerce & Business Management,
Guru Nanak Dev University, Amritsar
Email:[email protected].
Abstract
Future contracts in commodity market with limited maturities are primarily used for
hedging commodity price-fluctuation risks or for taking advantage of price
movements, rather than for the buying or selling of the actual cash commodity. This
paper is an effort to analyze the market efficiency of the Indian commodity market
and volatility spillover effects between the spot and future market with reference to
agri commodities guar seed and chana. The result indicates that the commodity
futures markets effectively serves the price discovery function in the spot market
implying that there is a flow of information from future to spot commodity markets.
Although the innovations in one market can predict the volatility in another market,
the volatility spillovers from future to the spot market are dominant. However in Agri
commodities the volatility in spot market may influences volatility in future market.
SIBM 61
Volume VI, No. 2 September 2013
Introduction
Ever since the dawn of civilization, commodity trading has remained an integral part
of mankind. The first and the foremost reason is that commodity represents the
fundamental elements of lifestyles of human beings. In earlier days, people used to
exchange goods for goods, which was called as “Barter System”. With the
advancement of civilization, trading system has gone through various changes and
has now entered into an era of Futures trading. Existence of a vibrant, active and
liquid commodity market is considered as a healthy sign for the development of an
economy. In the context of an emerging market like India, the growth of capital and
commodity future market would depend on the effectiveness of derivatives in
managing risk. Future contracts can be used for hedging against unfavourable price
fluctuation. The main aim of Futures market is to offer a mechanism wherein the price
risk associated with commodities can be successfully managed. All the commodities
are not suited for futures trading.
Futures contracts in commodity market with finite maturities are primarily used for
hedging commodity price-fluctuation risks or for taking advantage of price
movements, rather than for buying or selling of the actual cash commodity. The buyer
of the futures contract (the party with a long position) agrees on a fixed purchase
price to buy the underlying commodity (wheat, gold or T-bills, for example) from the
seller on the expiration of the contract. The seller of the futures contract (the party
with a short position) agrees to sell the underlying commodity to the buyer at
expiration at the fixed sales price. As time passes, the contract's price changes
relative to the fixed price at which the trade was initiated. This results in profits or
losses for the trader. An established company that has enjoyed a long history of solid
earnings will probably continue to do so. But a commodity that has trended up during
one year may turn around in the opposite direction the next year and very quickly,
too. The commodity trader should therefore identify and incorporate contingency
plans. Hedging programs are used by individuals and companies wanting protection
against adverse price moves which would affect the cash commodities in which they
deal. In most cases, delivery never takes place. Instead, both the buyer and the
seller, acting independently of each other, usually liquidate their long and short
positions before the contract expires, the buyer sells futures and the seller buys
futures. Arbitrageurs in the futures markets are constantly watching the relationship
between cash and futures in order to exploit such mispricing. An arbitrageur would
typically buy a particular commodity at a lower price on one exchange and sell it on
another where it fetches them a higher price. This creates a natural hedge and
therefore the risk is low. If, for example, an arbitrageur realized that gold futures in a
certain month were overpriced in relation to the cash gold market and/or interest
SIBM 62
Volume VI, No. 2 September 2013
rates, he would immediately sell those contracts knowing that he could lock in a risk-
free profit. Traders on the floor of the exchange would notice the heavy selling activity
and react by quickly pushing down the futures price, thus bringing it back into line
with the cash market. For this reason, such opportunities are rare and fleeting. Most
arbitrage strategies are carried out by traders from large dealer firms. There are two
basic categories of futures participants: hedgers and speculators. In general,
hedgers use futures for protection against adverse future price movements in the
underlying cash commodity. The rationale of hedging is based upon the
demonstrated tendency of cash prices and futures values to move in tandem.
Mukherjee (2011) suggests that besides the well-established fact towards the
requirement of market based instrument, there has always been a doubt, as
expressed by different bodies, on the usefulness and suitability of futures contract in
developing the underlying agricultural commodity market, especially in agricultural
based economy like India. Therefore, an attempt is required to be made to re-validate
the impact of futures trading on commodity market in India.
The effect of the introduction of futures trading on the spot market volatility has been
widely documented in the financial literature. In earlier studies the main objective
was to investigate the impact of introduction of index futures trading on volatility of
selected Metal and Agri commodities in Indian Commodity Market. These studies
found that the introduction of commodity futures trading generally reduced or at least
did not increase cash price volatility.
The purpose of this paper is to empirically examine lead-lag relationships between
the level of futures trading activity and cash price volatility in commodity futures
markets.
Review of the Literature
The history of futures trading in commodities in India dates back to the later part of
19th century when the first commodity exchange, viz. The Bombay Cotton Trade
Association Ltd. was set up for organizing futures trading. The early 20th century saw
the mushrooming of a number of commodity Exchanges. The principal commodity
markets functioning in pre-independence era were the cotton markets of Bombay,
Karachi, Ahmedabad and Indore, the wheat markets of Bombay, Hapur, Karachi,
Lyallpur, Amritsar, Okara and Calcutta, the groundnut markets of Madras and
Bombay, the linseed markets of Bombay and Calcutta, Jute and Hessian markets of
Calcutta, Bullion markets of Bombay, Calcutta, Delhi and Amritsar and sugar markets
of Bombay, Calcutta, Kanpur and Muzaffarnagar.
SIBM 63
Volume VI, No. 2 September 2013
Further Sen (2008) in his report explains that there were no uniform guidelines or
regulations. These were essentially outcomes of needs of particular trade
communities and were based on mutual trust and faith. They were regulated by social
control of close-knit groups and whenever such control failed; there would be a crisis.
In 1990, liberalization & globalization in India resulted in a need to examine the role
of futures trading. The Indian government then set up a Committee headed by Prof.
K. N Kabrain (1993). As explained by Ahuja (2006) the Committee recommended
futures trading in 17 commodity groups. It also suggested strengthening of the
Forward Markets Commission and certain amendments to Forward Contracts
(Regulation) Act 1952, particularly allowing options trading in goods and registration
of brokers with Forward Markets Commission. The Government accepted most of
these recommendations and futures' trading was permitted in all recommended
commodities.
Sen (2008) pointed out that the futures' trading in agricultural commodities is so far
limited to only a few commodities. The volume / production ratio of some of these
commodities is too high, indicating prevalence of excessive speculation in futures
trading in those commodities. The commodities with a history of high price volatility
(e.g. guar seed) are prone to excessive speculative interests which open up futures
market to the charge of distorting prices having no linkage to the fundamentals of the
demand and supply factors. Antonio and Foster (1992) suggest that the introduction
of futures trading enhances both the incentive and means for speculation. The
speculative trade associated with futures trading has been accused, however, of
destabilizing the underlying spot market inducing price volatility. Explaining
speculation further Chassard and Halliwell (1986) comment that speculation can
artificially distort price movements so as to exaggerate the normal response to
fundamentals. This effect has been noted by a number of other commentators.
Further Ollermann and Farris (1985) also suggest that if price discovered in futures
market are used to price cash market transactions, futures market may contribute to
increased efficiency in commodity markets. Garbade and Silber (1983) explain that
the relationship between future prices and corresponding cash commodity prices can
reflect the impact of futures market on cash market transactions. Figlewski (1981)
points out the problems occurring due to lack of liquidity and the volatility aspects. He
points out that the volatility can decrease due to the liquidity provided by the
speculators and so the possible adverse future price shift can be compensated.
Further Bhattacharya et al. (1986) used the Figlewski measure to calculate weekly
volatility series for spot and futures prices for GNMAs. The authors postulated that the
Granger causality test can be used to check the influence of futures volatility on spot
SIBM 64
Volume VI, No. 2 September 2013
volatility. The results suggested that there was no change in spot volatility since
futures trading began.
Even though Bhattacharya study was an improved version of studies suggesting use
of volatility measure using causality has invited a lot of criticism. Edwards (1988)
strongly points out that the inference of futures trading leading to stabilized or
unstabilized spot markets cannot be determined by the Causality tests. He argues
that the appearance of futures volatility leading spot volatility could be explained by
futures markets reacting more quickly to information. This will eventually reach the
spot market where it will have a similar effect on volatility.
In a similar vein, Bessembinder Hendrik and Paul J. Seguin (1993) examined greater
futures-trading activity (volume and open interest) associated with greater equity
volatility. The authors partitioned each trading activity series into expected and
unexpected components. The equity volatility co varies positively with unexpected
futures-trading volume and is negatively related to forecastable futures-trading
activity. The study found no evidence of a relation between the futures life cycle and
spot equity volatility. These findings were consistent with theories predicting that
active futures markets enhance the liquidity and depth of the equity markets.
A modified Levene statistic and switching GARACH (1,1) – MA (1) model was used by
Yu Shang-Wu (2001).The author observes the impact of index futures contracts on
the volatility of the spot market. The findings suggest that the volatility of stock
returns in the USA, France, Japan and Australia surged significantly while there were
no significant changes in the volatility in the UK and Hong Kong. The different results
in different markets can be attributed to variation in macroeconomic factors and the
structure of the various markets.
Zant Wouter (2001) investigated a hypothetical hedging scheme in a domestic
commodity market under which a commodity board offers a forward contract to
domestic producers and local traders of natural rubber and covered its commitments
on an international futures exchange-Tokyo Commodity Exchange (TOCOM). The
study aimed to quantify welfare gains to agents in the market and costs and benefits
of the board empirically. The study concluded that the risk aversion of growers is one
and a half to two times as high as that of local traders and the negative impact of risk
on utility almost completely vanishes if forward contracts are available.
Yang Jianet. al. (2005) examined the lead-lag relationship between futures trading
activity (volume and open interest) and cash price volatility for major agricultural
commodities and found that an unexpected increase in futures trading volume uni-
directionally causes an increase in cash price volatility for most commodities. Also
SIBM 65
Volume VI, No. 2 September 2013
there is a weak causal feedback between open interest and cash price volatility. These
findings are generally consistent with the destabilizing effect of futures trading on
agricultural commodity markets.
Lien Donald and Yang Li (2007) examined the asymmetric effect of basis on the time
varying variance and correlation of spot and future returns and its consequences in
dynamic futures hedging strategies in commodity markets. The study has examined
the effect of Bivariate GARCH model for estimating the Minimum Variance hedge ratio
(MVHR) and found that positive basis has a greater impact than the negative basis on
the variance and covariance structure. Results of both in-sample and out of sample
revealed that incorporating the asymmetry basis effect into the hedging decision
leads to a better risk – reduction. The study concluded that separating the effect of
positive and negative basis on the time varying variance – covariance in spot and
futures markets not only provides better descriptions of the joint dynamic behaviors
of commodity prices, but also plays an important role in determining optimal hedging
strategies.
Alizadeh AH et al. (2008)examined constant and dynamic hedge ratios in the New
York Mercantile Exchange oil futures markets and also examined their hedging
performance. The study introduced a Markov regime switching vector error
correction model with GARCH error structure. The study found that the dynamic
relationship between spot and futures prices are characterized by regime shifts. With
the help of in and out-of-sample tests, the study concluded that state dependent
hedge ratios are able to provide significant reduction in portfolio risk and market
agents may be able to obtain superior gains, measured in terms of both variance
reduction and increase in utility. The study suggested that for the purpose of
obtaining more efficient hedge ratios, these should be allowed to be dependent upon
the state of the market.
Gallo Giampiero M. and Otranto Edoardo (2008)examined the volatility spillovers,
interdependence and co – movements between markets and found that volatility in
one market reacts to innovations in other markets as a result of financial integration.
The research study employed Multi – Chain Markov Switching Model (MCMS, Otarnto
2005) to study the market characterizations by relying on the definitions of spillover,
interdependence and co – movements. The model is estimated on the weekly high –
low range of five Asian markets assuming a central (but not necessarily dominant)
role for Hong Kong. The results showed plausible market characterizations over the
long run with a spillover from Hong Kong to Korea and Thailand, interdependence
with Malaysia and co – movement with Singapore.
GemanHelyette and OhanaSteve (2008)examined time – consistency in managing a
SIBM 66
Volume VI, No. 2 September 2013
commodity portfolio. The study determined the problem of managing a storable
commodity portfolio which includes physical assets and positions in spot and futures
markets. The study revealed that the vast amount of capital involved in the
acquisition of a power plant or storage facility implies that the financing period
stretches over a period of several quarters or years.
The study assessed that only the recursive dynamic value measures based on a
utility-type aggregator and certainty equivalent are time consistent. The study
suggested to have important insights through these risk measures on the trade-offs
between date specific risks.
Chng Michael T. (2009)examined that non – trivial cross-elasticity and slow
information flow are empirically manifested in cross-market volume – volatility
interactions among seemingly unrelated commodities. The study investigated cross-
market volatility – volume transmission effects in TOCOM's natural rubber, palladium
and gasoline futures markets.
Liu Peng (Peter) and Tang Ke (2010)investigated arbitrage – free conditions under the
dual cash and storage markets for commodities. The study examined that the
convenience yield is non – negative in the absence of the existence of the arbitrage in
the cash – storage dual markets. The study employed a three – factor model which
captured log – spot price, the convenience yield and the interest rate. The study also
considered that the classical models are not arbitrage free because the classical NCY
(net convenience yield) models do exhibit a high probability of violating the non –
negativity criteria of the convenience yield due to the high degree of volatility of the
convenience yield. The study found out that the separation of the convenience yield
and the storage cost reduces the volatility of the convenience yield and therefore,
yields a smaller probability of violating the non – negative criteria.
Minten Bart et al.(2010)studied the impact of the modern retail on basic foods prices
facing urban consumers. The research study indicated that modern retail is emerging
quickly and offering more labeled, branded food products and more choice than
traditional markets. The study further made an attempt to find out that modern retail
at its incipience in India sells basic foods mostly at the same or lower prices than
traditional retail and thus become an important contributor to improved urban food
security. The study employed hedonic price regression and propensity score
matching.
Paschke Raphael and Prokopczuk Marcel (2010)developed a continuous time factor
model of commodity prices that allows for higher – order autoregressive and moving
average components. The study estimated the parsimonious version of the general
SIBM 67
Volume VI, No. 2 September 2013
model for the crude oil futures market and demonstrated the model's superior
performance in pricing nearby futures contracts in – and out – of – sample. The study
argued that a simple AR(1) representation of the short – term factor (that is , the
convenience yield) is not sufficient to model the futures curve. The study developed a
new model that relied on continuous time autoregressive moving average (CARMA)
processes and derived closed – form futures and options valuation formulas. The
study concluded that the model substantially improves the pricing of long – horizon
contracts with information from the short end of the futures curve.
Sakthivel P. and Kamaiah B. (2010)investigated the impact of introduction of index
futures trading on volatility of Nifty. The study employed GARCH (1, 1) model to
capture the time varying nature of the volatility and volatility clustering phenomena
using daily closing price of the Nifty. The results showed that after introduction of the
futures trading reduced stock market volatility, due to increase market efficiency. The
study also examined futures trading changes structure of spot market volatility using
GARCH model. The study observed that there is a changes structure in spot market
volatility after introduction futures trading. Specifically, there is evidence that the
increased impact on recent news and reduced effect of the uncertainty originating
from the old news. The study concluded that the introduction of the derivatives
contract improved the market efficiency and reduced the asymmetric information.
Verma Ashutosh and Kumar Vijaya C. V. R. S. (2010) examined the Samuelson's
hypothesis which states that the price volatility increases as the contract nears its
maturity. The study also examined the BCSS hypothesis which provides that negative
covariance between the spot price and net cost of carry explains the maturity effect.
The study has examined these hypotheses on the data for wheat and pepper futures
contract traded at NCDEX from the date of listing of the contract to 31st March 2007
and the maturity effect has been examined for each contract individually. The study
has indicated that maturity effect is present in around 45 per cent of the wheat and
pepper contracts. Evidence supporting the BCSS hypothesis is present more strongly
in the case of wheat as compared to pepper and 79 per cent of the contracts having
maturity effect have depicted negative covariance in the case of wheat. The study
concluded that maturity effect is present and it is explained to a large extent by the
negative co-variance between spot price and net carry cost.
Debasish S. S. (2011)investigated the effect of futures trading on the volatility and
operating efficiency of the underlying Indian stock market by taking a sample of
selected individual stocks. The study examined whether the index futures trading in
India has caused a significant change in spot price volatility of the underlying stocks
and how the index futures trading has affected market/trading efficiency in the Indian
SIBM 68
September 2013Volume VI, No. 2
futures and stock markets. The study employed event study approach to test whether
the introduction of index futures trading has resulted in significant change in volatility
and efficiency of the stock returns. The study indicated that the introduction of Nifty
index futures trading in India is associated with both reduction in spot price volatility
and reduced trading efficiency in the underlying stock market. The study suggested
that there is a trade-off between gains and costs associated with the introduction of
derivatives trading at least on a short-term perspective.
Fernandez Viviana (2011)analysed annual and monthly series of various commodity
categories and considered alternative price deflators. The study tested the existence
of downward trends in real commodity prices. The study employed GAUSS routines
methodology written by Harvey et al. (2010) . The study tested the significant role of
pricede flator and time frequency in identifying a negative and/or broken trend. The
study concluded that time frequency and price deflators play a key role when tested
for Prebisch – Singer (PS) hypothesis.
Nair Abhilash S. (2011)examined the impact of introduction of derivatives trading on
the underlying spot market volatility of seventy two scripts using symmetric and
asymmetric GARCH methods. The research study indicated the existence of
asymmetric response to new information. Further, the results indicate an increase in
the efficiency of processing new information. Overall, the study found that there is a
strong evidence of a reduction of volatility after the introduction of derivatives
trading.
Back Janis et al. (2012)studied the impact of seasonally fluctuating volatility in
commodity markets on the pricing of options. The study incorporated seasonality in
volatility as an important aspect to consider for the valuation of futures contracts. The
study extended two standard continuous time commodity derivatives valuation
models to incorporate seasonality in volatility. The study concluded that incorporating
the stylized fact of seasonally fluctuating volatility significantly improves options
valuation performance and suggested that seasonality in volatility should be
accounted for when dealing with options on seasonal commodities.
Nazlioglu Saban et al. (2012) examined whether volatility in oil prices have any
explanatory impact on the volatility in agricultural commodity prices. The study
investigated volatility spillover between oil and selected agricultural commodity
markets (wheat, corn, soybean and sugar) that are key agricultural products for
biofuels and for food in the world. The study focused on determining the impact of the
food price crisis by dividing the data into two sub - periods: pre crisis period and post
crisis period. The study found out that there is no risk transmission between oil and
agricultural commodity markets in the pre-crisis period, but the oil market volatility
SIBM 69
Volume VI, No. 2 September 2013
spills on the agricultural markets (with the exception of sugar) in the post-crisis
period. The study suggested that local measures to suppress price uncertainty in
agricultural markets may not be effective in the short run. The global factors such as
the risk in energy markets seem to drive the short run volatility in agricultural
markets. The importance of this effect is higher for countries that are most vulnerable
to food price fluctuations. Silverio Renan and Szklo Alexandre (2012)examined the
contribution of the futures market to the price discovery process in the spot market
for crude oils. The study employed the Kalman filter technique to study the
relationship between West Texas Intermediate(WTI) spot and futures prices. The
study found that recent evolution of the financial markets has affected the futures oil
market so as to increase its contribution to the price discovery process of the spot
market. The study concluded that futures markets contribution to price discovery has
been increasing throughout time.
Research Methodology
Market efficiency of the commodity market is one of the important issues for the
participants of the market. An efficient commodity market reflects the fair pricing of
the commodities which is one of the requirements for a developing economy like India
as it affects a large number of consumers. In the study, the daily data of closing prices
of the agri commodities (guar seed and chana) are collected from NCDEX website for
the period from 1 April 2004 up to 31st March 2012. Chana is one of the major
consumable commodities in India whereas the guar seed in more like as industrial
commodity. The daily returns of the spot as well as future prices of these commodities
are calculated using the equation Rt= log (Pt/Pt-1)* 100 where, Rtis the daily
returns, Pt is the price of the commodity at time t, Pt-1 is the price of the commodity
at time t.
This paper examines the existence of long term equilibrium relationships, if any,
between the spot and future prices of the two commodities as well as the information
efficiency of spot and future markets of the commodities. In addition to this, efforts
are made to analyze the lead-lag relationships between the volatility in the spot
prices and volatility in commodity futures markets. The ADF unit root test, Phillip
Perron and KPSS tests are used to test the presence of unit root in the price series.
The Johansan's cointegration test is used to test the presence of long term
equilibrium relationship between the spot and future market of the commodities. The
Vector Error Correction Model (VECM) is used to analyze the error correction
mechanism takes place if some disturbance comes in the equilibrium relationship.
The Block Exogeneity test (Wald Test) is applied to analyze the short run causality
relationship between spot and future market of the commodities. The GARCH (1,1)
SIBM 70
Volume VI, No. 2 September 2013
test with squared lagged residuals of other series as exogenous variable is used to
analyze the volatility spillover effects between the spot and future markets. The
analysis is done with the help of software's MS Excel and Eviews.
Data Analysis and Interpretation
The Agri commodities guar seed (industrial commodity) and chana (direct
consumable commodity) are considered for the study and the behavior of spot prices
of both commodities during the period (April 2004 to March 2012) are shown in figure
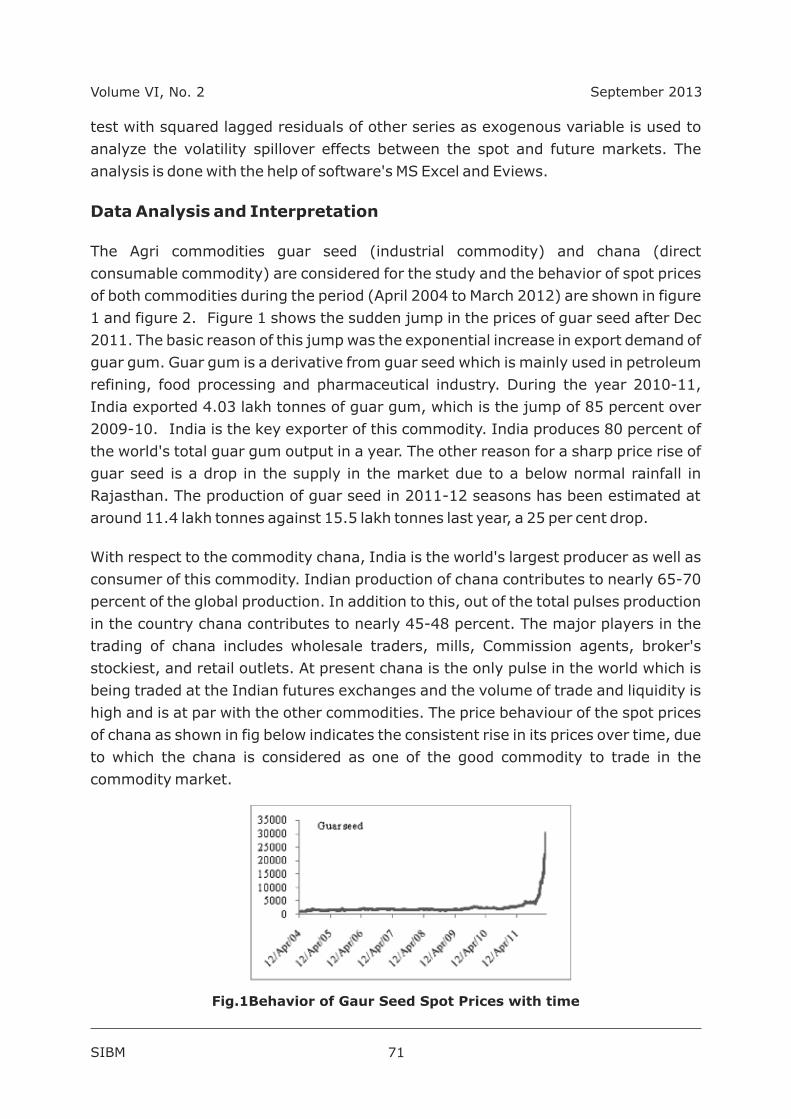
1 and figure 2. Figure 1 shows the sudden jump in the prices of guar seed after Dec
2011. The basic reason of this jump was the exponential increase in export demand of
guar gum. Guar gum is a derivative from guar seed which is mainly used in petroleum
refining, food processing and pharmaceutical industry. During the year 2010-11,
India exported 4.03 lakh tonnes of guar gum, which is the jump of 85 percent over
2009-10. India is the key exporter of this commodity. India produces 80 percent of
the world's total guar gum output in a year. The other reason for a sharp price rise of
guar seed is a drop in the supply in the market due to a below normal rainfall in
Rajasthan. The production of guar seed in 2011-12 seasons has been estimated at
around 11.4 lakh tonnes against 15.5 lakh tonnes last year, a 25 per cent drop.
With respect to the commodity chana, India is the world's largest producer as well as
consumer of this commodity. Indian production of chana contributes to nearly 65-70
percent of the global production. In addition to this, out of the total pulses production
in the country chana contributes to nearly 45-48 percent. The major players in the
trading of chana includes wholesale traders, mills, Commission agents, broker's
stockiest, and retail outlets. At present chana is the only pulse in the world which is
being traded at the Indian futures exchanges and the volume of trade and liquidity is
high and is at par with the other commodities. The price behaviour of the spot prices
of chana as shown in fig below indicates the consistent rise in its prices over time, due
to which the chana is considered as one of the good commodity to trade in the
commodity market.
Fig.1Behavior of Gaur Seed Spot Prices with time
SIBM 71
Volume VI, No. 2 September 2013
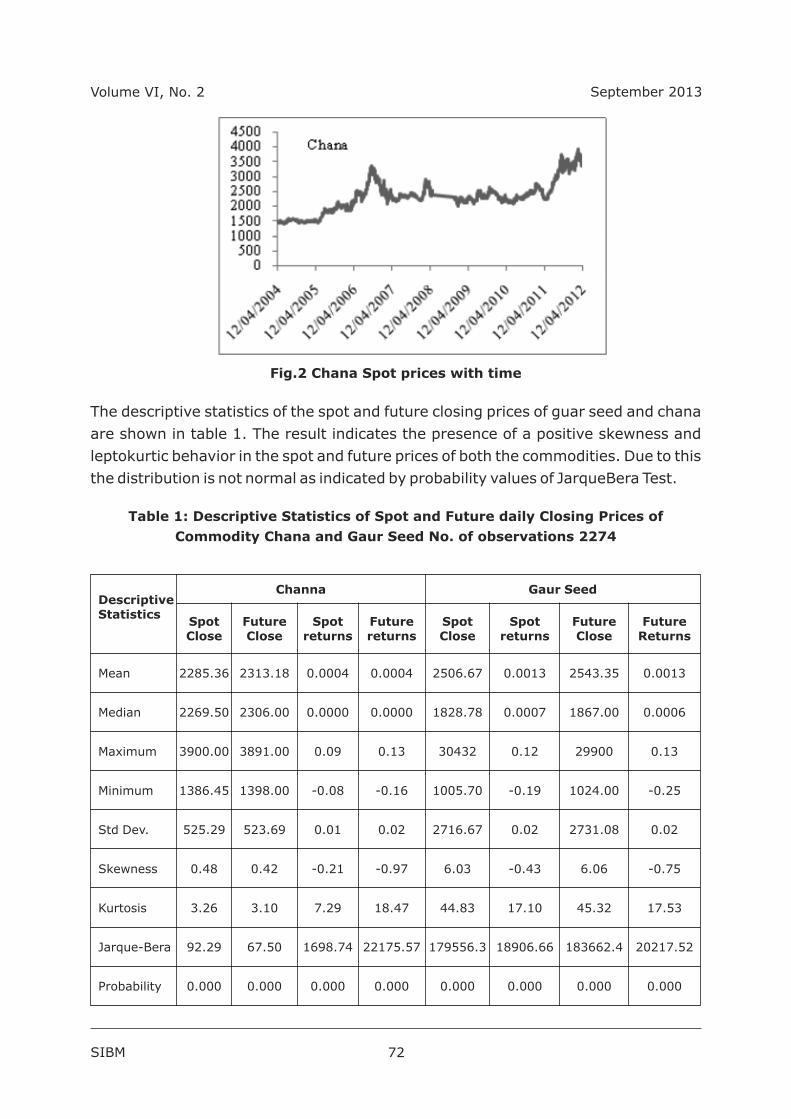
Fig.2 Chana Spot prices with time
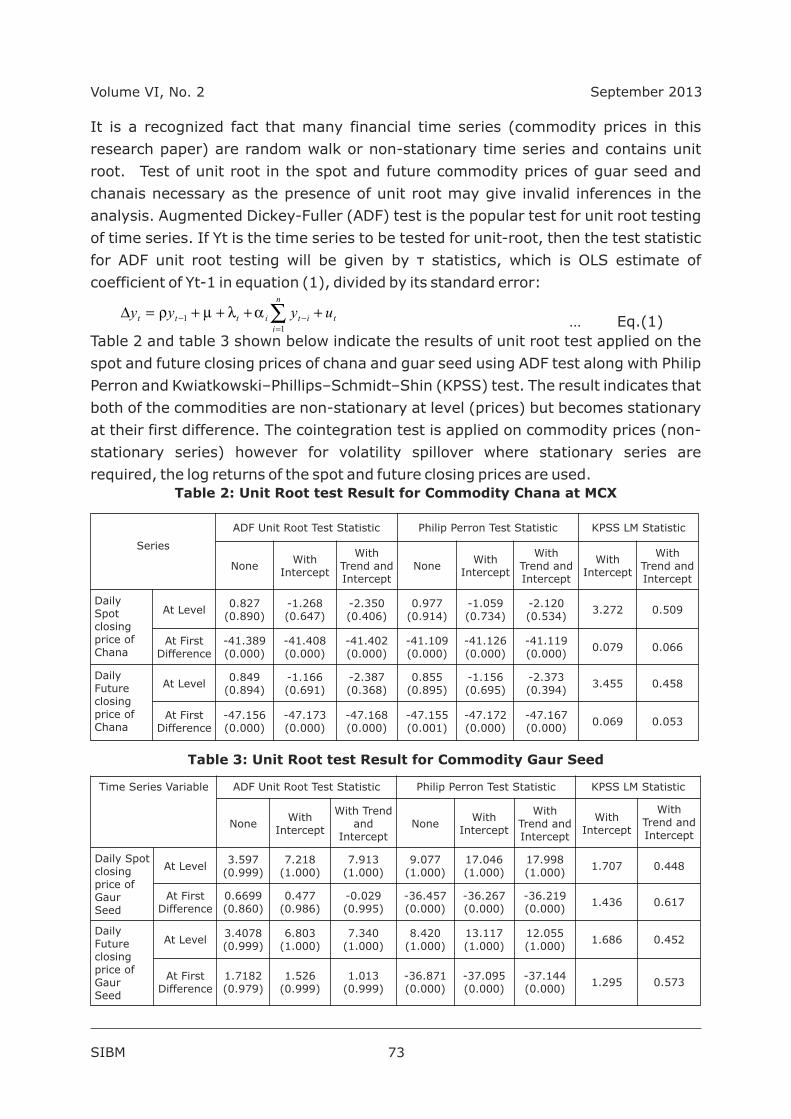
The descriptive statistics of the spot and future closing prices of guar seed and chana
are shown in table 1. The result indicates the presence of a positive skewness and
leptokurtic behavior in the spot and future prices of both the commodities. Due to this
the distribution is not normal as indicated by probability values of JarqueBera Test.
Table 1: Descriptive Statistics of Spot and Future daily Closing Prices of
Commodity Chana and Gaur Seed No. of observations 2274
SIBM 72
Descriptive Statistics
Channa Gaur Seed
Spot Close
Future Close
Spot returns
Future returns
Spot Close
Spot returns
Future Close
Future Returns
Mean 2285.36 2313.18 0.0004 0.0004 2506.67 0.0013 2543.35 0.0013
Median 2269.50 2306.00 0.0000 0.0000 1828.78 0.0007 1867.00 0.0006
Maximum 3900.00 3891.00 0.09 0.13 30432 0.12 29900 0.13
Minimum 1386.45 1398.00 -0.08 -0.16 1005.70 -0.19 1024.00 -0.25
Std Dev. 525.29 523.69 0.01 0.02 2716.67 0.02 2731.08 0.02
Skewness 0.48 0.42 -0.21 -0.97 6.03 -0.43 6.06 -0.75
Kurtosis 3.26 3.10 7.29 18.47 44.83 17.10 45.32 17.53
Jarque-Bera 92.29 67.50 1698.74 22175.57 179556.3 18906.66 183662.4 20217.52
Probability 0.000 0.000 0.000 0.000 0.000 0.000 0.000 0.000
Volume VI, No. 2 September 2013
It is a recognized fact that many financial time series (commodity prices in this
research paper) are random walk or non-stationary time series and contains unit
root. Test of unit root in the spot and future commodity prices of guar seed and
chanais necessary as the presence of unit root may give invalid inferences in the
analysis. Augmented Dickey-Fuller (ADF) test is the popular test for unit root testing
of time series. If Yt is the time series to be tested for unit-root, then the test statistic
for ADF unit root testing will be given by τ statistics, which is OLS estimate of
coefficient of Yt-1 in equation (1), divided by its standard error:
… Eq.(1)
Table 2 and table 3 shown below indicate the results of unit root test applied on the
spot and future closing prices of chana and guar seed using ADF test along with Philip
Perron and Kwiatkowski–Phillips–Schmidt–Shin (KPSS) test. The result indicates that
both of the commodities are non-stationary at level (prices) but becomes stationary
at their first difference. The cointegration test is applied on commodity prices (non-
stationary series) however for volatility spillover where stationary series are
required, the log returns of the spot and future closing prices are used. Table 2: Unit Root test Result for Commodity Chana at MCX
Table 3: Unit Root test Result for Commodity Gaur Seed
SIBM 73
t
n
iitittt uyyy ++++=D å
=--
11 almr
Series
ADF Unit Root Test Statistic Philip Perron Test Statistic KPSS LM Statistic
NoneWith
Intercept
With Trend and Intercept
NoneWith
Intercept
With Trend and Intercept
With Intercept
With Trend and Intercept
Daily Spot closing price of Chana
At Level0.827
(0.890)-1.268(0.647)
-2.350(0.406)
0.977(0.914)
-1.059(0.734)
-2.120(0.534)
3.272 0.509
At First Difference
-41.389(0.000)
-41.408(0.000)
-41.402(0.000)
-41.109(0.000)
-41.126(0.000)
-41.119(0.000)
0.079 0.066
Daily Future closing price of Chana
At Level0.849
(0.894)-1.166(0.691)
-2.387(0.368)
0.855(0.895)
-1.156(0.695)
-2.373(0.394)
3.455 0.458
At First Difference
-47.156(0.000)
-47.173(0.000)
-47.168(0.000)
-47.155(0.001)
-47.172(0.000)
-47.167(0.000)
0.069 0.053
Time Series Variable ADF Unit Root Test Statistic Philip Perron Test Statistic KPSS LM Statistic
NoneWith
Intercept
With Trend and
InterceptNone
With Intercept
With Trend and Intercept
With Intercept
With Trend and Intercept
Daily Spot closing price of Gaur Seed
At Level3.597
(0.999)7.218
(1.000)7.913
(1.000)9.077
(1.000)17.046(1.000)
17.998(1.000)
1.707 0.448
At First Difference
0.6699(0.860)
0.477(0.986)
-0.029(0.995)
-36.457(0.000)
-36.267(0.000)
-36.219(0.000)
1.436 0.617
Daily Future closing price of Gaur Seed
At Level3.4078(0.999)
6.803(1.000)
7.340(1.000)
8.420(1.000)
13.117(1.000)
12.055(1.000)
1.686 0.452
At First Difference
1.7182(0.979)
1.526(0.999)
1.013(0.999)
-36.871(0.000)
-37.095(0.000)
-37.144(0.000)
1.295 0.573
Volume VI, No. 2 September 2013
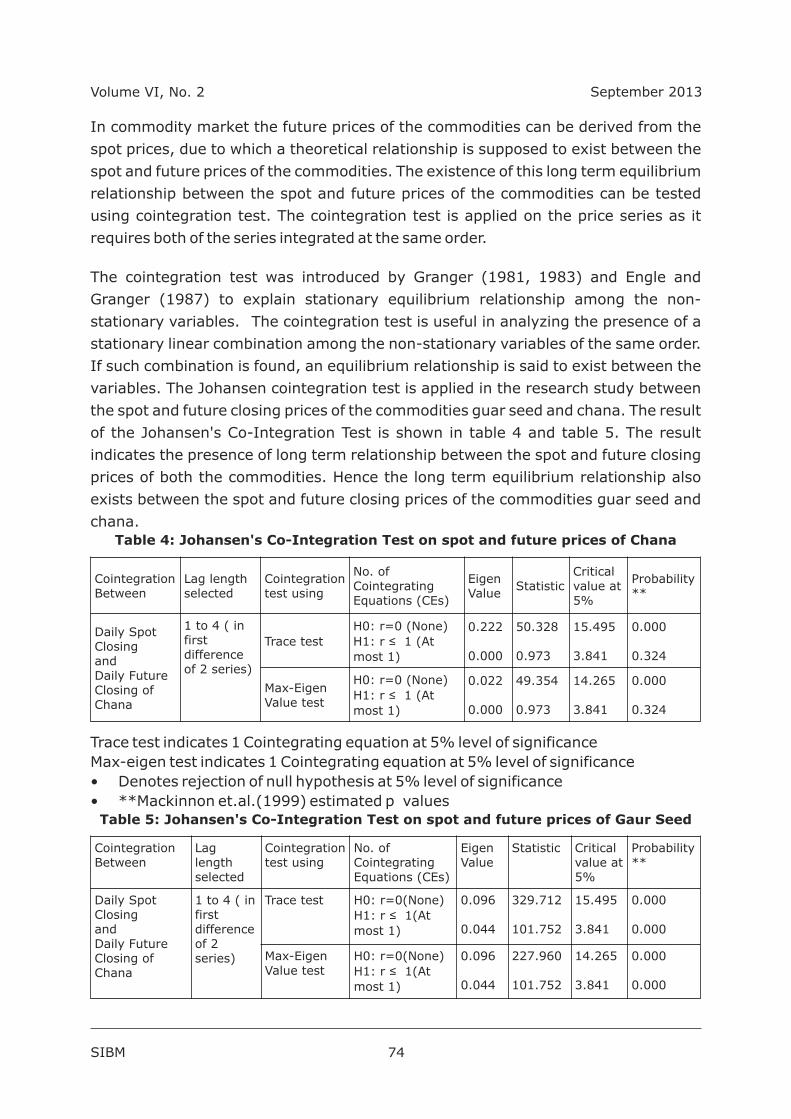
In commodity market the future prices of the commodities can be derived from the
spot prices, due to which a theoretical relationship is supposed to exist between the
spot and future prices of the commodities. The existence of this long term equilibrium
relationship between the spot and future prices of the commodities can be tested
using cointegration test. The cointegration test is applied on the price series as it
requires both of the series integrated at the same order.
The cointegration test was introduced by Granger (1981, 1983) and Engle and
Granger (1987) to explain stationary equilibrium relationship among the non-
stationary variables. The cointegration test is useful in analyzing the presence of a
stationary linear combination among the non-stationary variables of the same order.
If such combination is found, an equilibrium relationship is said to exist between the
variables. The Johansen cointegration test is applied in the research study between
the spot and future closing prices of the commodities guar seed and chana. The result
of the Johansen's Co-Integration Test is shown in table 4 and table 5. The result
indicates the presence of long term relationship between the spot and future closing
prices of both the commodities. Hence the long term equilibrium relationship also
exists between the spot and future closing prices of the commodities guar seed and
chana.Table 4: Johansen's Co-Integration Test on spot and future prices of Chana
Trace test indicates 1 Cointegrating equation at 5% level of significance
Max-eigen test indicates 1 Cointegrating equation at 5% level of significance
• Denotes rejection of null hypothesis at 5% level of significance
• **Mackinnon et.al.(1999) estimated p valuesTable 5: Johansen's Co-Integration Test on spot and future prices of Gaur Seed
SIBM 74
Cointegration Between
Lag length selected
Cointegration test using
No. of Cointegrating Equations (CEs)
Eigen Value
StatisticCritical value at 5%
Probability **
Daily Spot Closing and Daily Future Closing of Chana
1 to 4 ( in first difference of 2 series)
Trace test
H0: r=0 (None)
H1: r ≤ 1 (At
most 1)
0.222
0.000
50.328
0.973
15.495
3.841
0.000
0.324
Max-Eigen Value test
H0: r=0 (None)
H1: r ≤ 1 (At
most 1)
0.022
0.000
49.354
0.973
14.265
3.841
0.000
0.324
Cointegration Between
Lag length selected
Cointegration test using
No. of Cointegrating Equations (CEs)
Eigen Value
Statistic Critical value at 5%
Probability **
Daily Spot Closing and Daily Future Closing of Chana
1 to 4 ( in first difference of 2 series)
Trace test H0: r=0(None)
H1: r ≤ 1(At
most 1)
0.096
0.044
329.712
101.752
15.495
3.841
0.000
0.000
Max-Eigen Value test
H0: r=0(None)
H1: r ≤ 1(At
most 1)
0.096
0.044
227.960
101.752
14.265
3.841
0.000
0.000
Volume VI, No. 2 September 2013
Trace test indicates 1 Cointegrating equation at 5% level of significance
Max-eigen test indicates 1 Cointegrating equation at 5% level of significance
• Denotes rejection of null hypothesis at 5% level of significance
• **Mackinnon et.al.(1999) estimated p values
The equilibrium relationship between the non-stationary variables is used to
construct an Error Correction Model (ECM). An error correction model is a statistical
specification of economic dynamics through which the pull and push forces restore
the equilibrium relationship whenever a disequilibrium takes place. In commodities
market the future prices can be estimated using deterministic models. According to
these models the future prices of the commodities should be equal to the spot prices
plus cost of carry.
In commodities the carrying cost includes capital cost, storage cost minus the
convenience yield if any. Any difference between the theoretical and actual prices of
the commodities may lead to arbitrage opportunities in the market. These arbitrage
opportunities help in correcting the disequilibrium between the spot and future prices
of the commodities in the market.
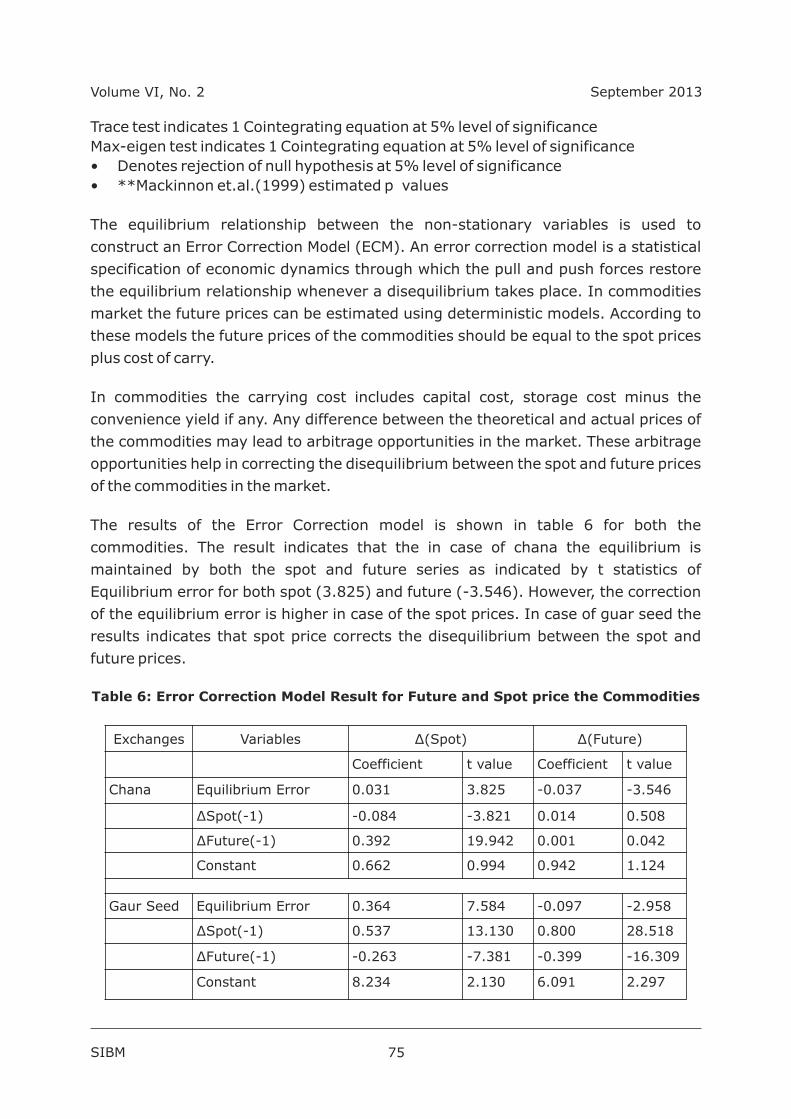
The results of the Error Correction model is shown in table 6 for both the
commodities. The result indicates that the in case of chana the equilibrium is
maintained by both the spot and future series as indicated by t statistics of
Equilibrium error for both spot (3.825) and future (-3.546). However, the correction
of the equilibrium error is higher in case of the spot prices. In case of guar seed the
results indicates that spot price corrects the disequilibrium between the spot and
future prices.
Table 6: Error Correction Model Result for Future and Spot price the Commodities
SIBM 75
Exchanges Variables ∆(Spot) ∆(Future)
Coefficient t value Coefficient t value
Chana Equilibrium Error 0.031 3.825 -0.037 -3.546
∆Spot(-1) -0.084 -3.821 0.014 0.508
∆Future(-1) 0.392 19.942 0.001 0.042
Constant 0.662 0.994 0.942 1.124
Gaur Seed Equilibrium Error 0.364 7.584 -0.097 -2.958
∆Spot(-1) 0.537 13.130 0.800 28.518
∆Future(-1) -0.263 -7.381 -0.399 -16.309
Constant 8.234 2.130 6.091 2.297
Volume VI, No. 2 September 2013
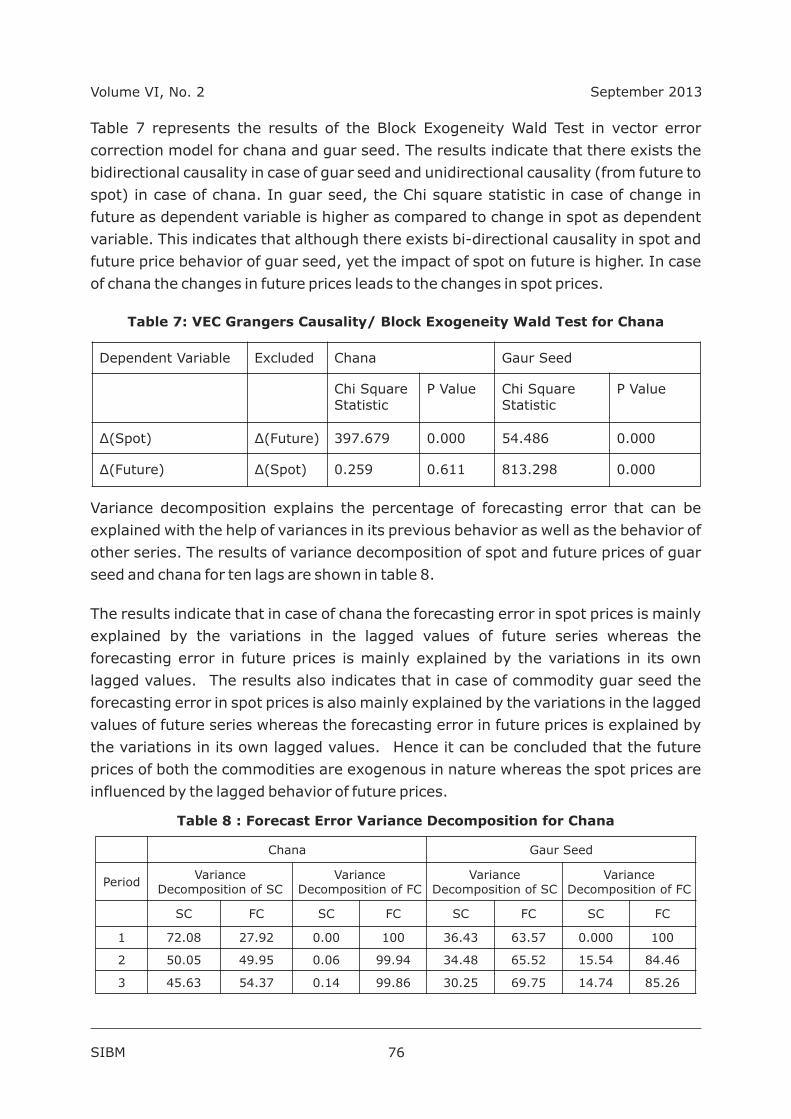
Table 7 represents the results of the Block Exogeneity Wald Test in vector error
correction model for chana and guar seed. The results indicate that there exists the
bidirectional causality in case of guar seed and unidirectional causality (from future to
spot) in case of chana. In guar seed, the Chi square statistic in case of change in
future as dependent variable is higher as compared to change in spot as dependent
variable. This indicates that although there exists bi-directional causality in spot and
future price behavior of guar seed, yet the impact of spot on future is higher. In case
of chana the changes in future prices leads to the changes in spot prices.
Table 7: VEC Grangers Causality/ Block Exogeneity Wald Test for Chana
Variance decomposition explains the percentage of forecasting error that can be
explained with the help of variances in its previous behavior as well as the behavior of
other series. The results of variance decomposition of spot and future prices of guar
seed and chana for ten lags are shown in table 8.
The results indicate that in case of chana the forecasting error in spot prices is mainly
explained by the variations in the lagged values of future series whereas the
forecasting error in future prices is mainly explained by the variations in its own
lagged values. The results also indicates that in case of commodity guar seed the
forecasting error in spot prices is also mainly explained by the variations in the lagged
values of future series whereas the forecasting error in future prices is explained by
the variations in its own lagged values. Hence it can be concluded that the future
prices of both the commodities are exogenous in nature whereas the spot prices are
influenced by the lagged behavior of future prices.
Table 8 : Forecast Error Variance Decomposition for Chana
SIBM 76
Dependent Variable Excluded Chana Gaur Seed
Chi Square Statistic
P Value Chi Square Statistic
P Value
∆(Spot) ∆(Future) 397.679 0.000 54.486 0.000
∆(Future) ∆(Spot) 0.259 0.611 813.298 0.000
Chana Gaur Seed
PeriodVariance
Decomposition of SCVariance
Decomposition of FCVariance
Decomposition of SCVariance
Decomposition of FC
SC FC SC FC SC FC SC FC
1 72.08 27.92 0.00 100 36.43 63.57 0.000 100
2 50.05 49.95 0.06 99.94 34.48 65.52 15.54 84.46
3 45.63 54.37 0.14 99.86 30.25 69.75 14.74 85.26
Volume VI, No. 2 September 2013
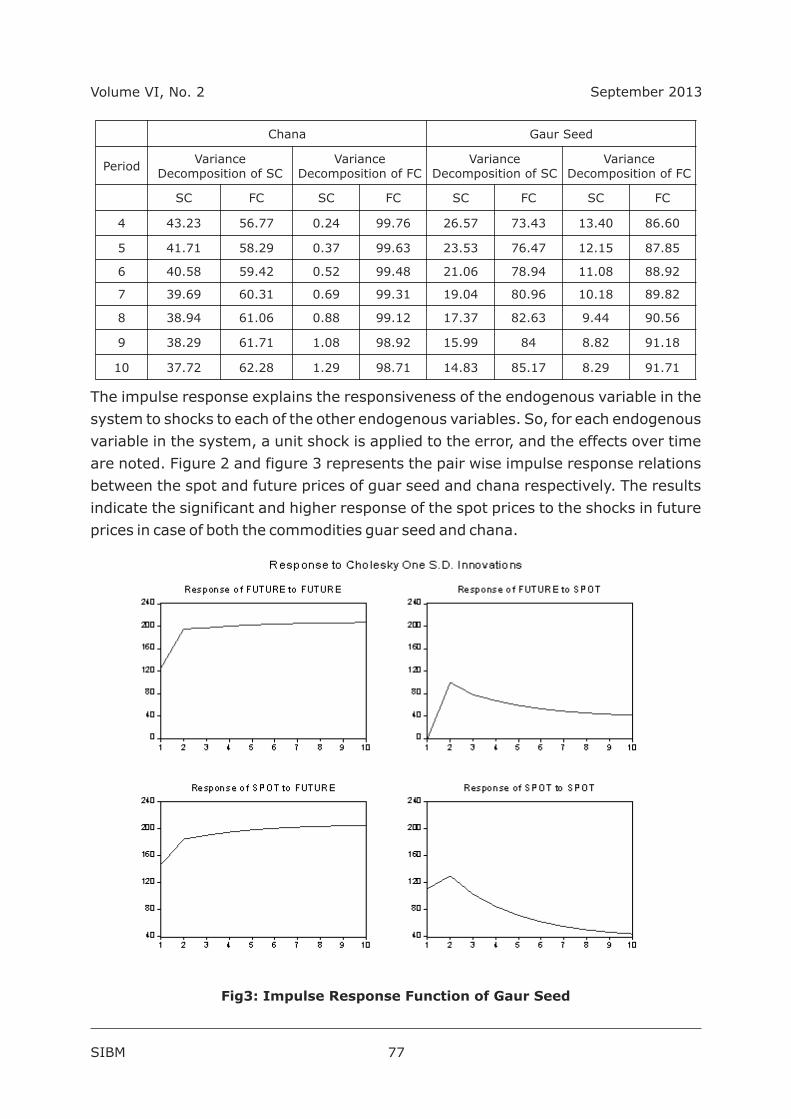
The impulse response explains the responsiveness of the endogenous variable in the
system to shocks to each of the other endogenous variables. So, for each endogenous
variable in the system, a unit shock is applied to the error, and the effects over time
are noted. Figure 2 and figure 3 represents the pair wise impulse response relations
between the spot and future prices of guar seed and chana respectively. The results
indicate the significant and higher response of the spot prices to the shocks in future
prices in case of both the commodities guar seed and chana.
Fig3: Impulse Response Function of Gaur Seed
SIBM 77
Chana Gaur Seed
PeriodVariance
Decomposition of SCVariance
Decomposition of FCVariance
Decomposition of SCVariance
Decomposition of FC
SC FC SC FC SC FC SC FC
4 43.23 56.77 0.24 99.76 26.57 73.43 13.40 86.60
5 41.71 58.29 0.37 99.63 23.53 76.47 12.15 87.85
6 40.58 59.42 0.52 99.48 21.06 78.94 11.08 88.92
7 39.69 60.31 0.69 99.31 19.04 80.96 10.18 89.82
8 38.94 61.06 0.88 99.12 17.37 82.63 9.44 90.56
9 38.29 61.71 1.08 98.92 15.99 84 8.82 91.18
10 37.72 62.28 1.29 98.71 14.83 85.17 8.29 91.71
Volume VI, No. 2 September 2013
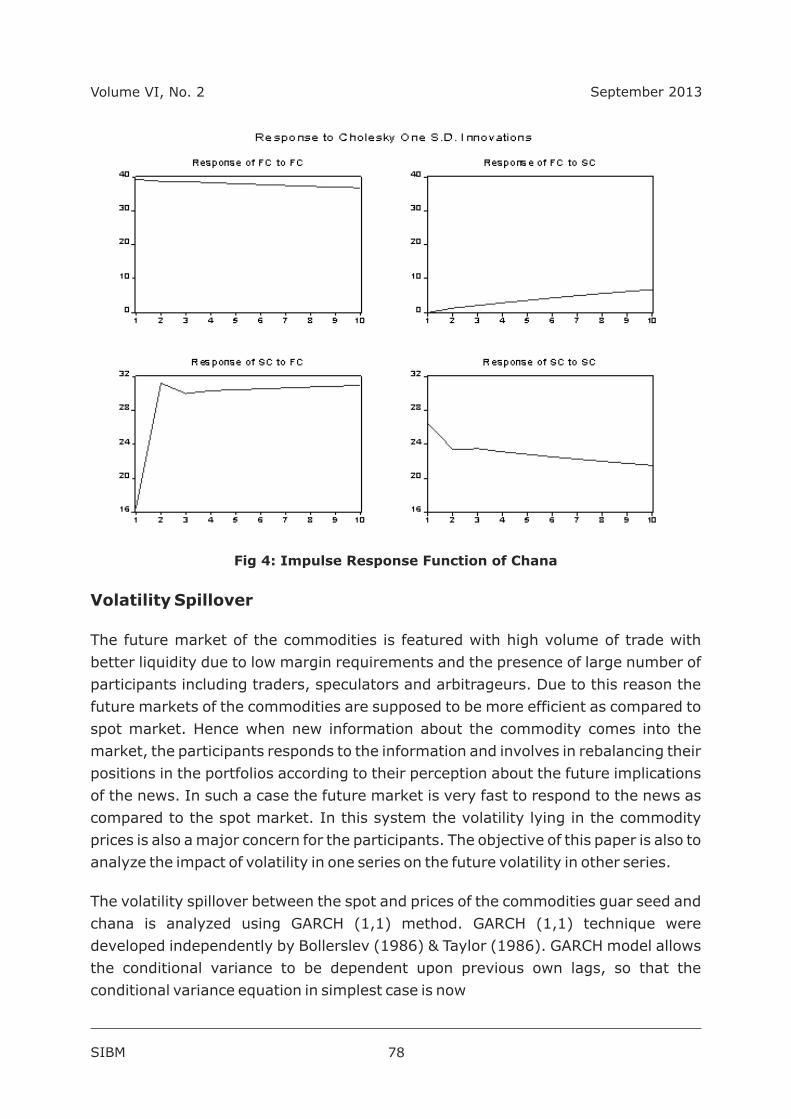
Fig 4: Impulse Response Function of Chana
Volatility Spillover
The future market of the commodities is featured with high volume of trade with
better liquidity due to low margin requirements and the presence of large number of
participants including traders, speculators and arbitrageurs. Due to this reason the
future markets of the commodities are supposed to be more efficient as compared to
spot market. Hence when new information about the commodity comes into the
market, the participants responds to the information and involves in rebalancing their
positions in the portfolios according to their perception about the future implications
of the news. In such a case the future market is very fast to respond to the news as
compared to the spot market. In this system the volatility lying in the commodity
prices is also a major concern for the participants. The objective of this paper is also to
analyze the impact of volatility in one series on the future volatility in other series.
The volatility spillover between the spot and prices of the commodities guar seed and
chana is analyzed using GARCH (1,1) method. GARCH (1,1) technique were
developed independently by Bollerslev (1986) & Taylor (1986). GARCH model allows
the conditional variance to be dependent upon previous own lags, so that the
conditional variance equation in simplest case is now
SIBM 78
Volume VI, No. 2 September 2013
……eq (2)
2This is a GARCH(1,1) model. “σ is” known as conditional variance since it is a one-t
period ahead estimate for the variance calculated based on any past info thought
relevant. In the above mentioned eq 2, one more exogenous variable is included, the
square of the lagged error terms of other variable, estimated with the help of ARMA
forecasting models. The new equation can be represented as
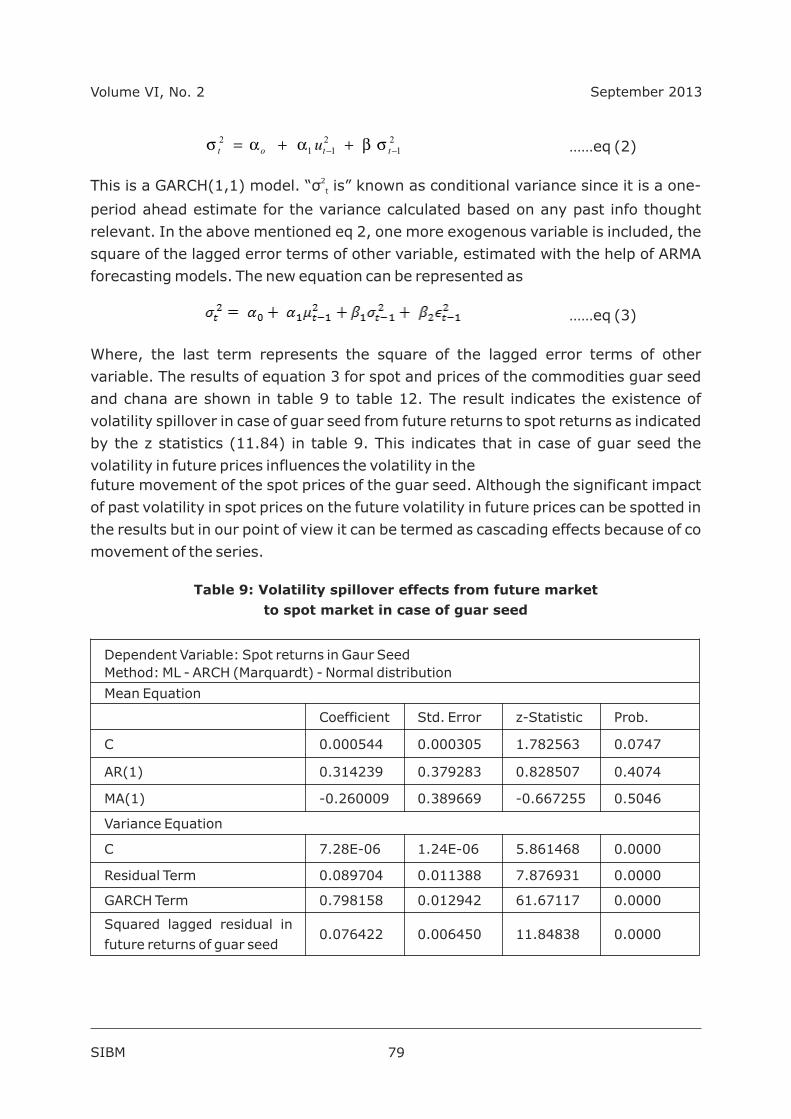
……eq (3)
Where, the last term represents the square of the lagged error terms of other
variable. The results of equation 3 for spot and prices of the commodities guar seed
and chana are shown in table 9 to table 12. The result indicates the existence of
volatility spillover in case of guar seed from future returns to spot returns as indicated
by the z statistics (11.84) in table 9. This indicates that in case of guar seed the
volatility in future prices influences the volatility in the
future movement of the spot prices of the guar seed. Although the significant impact
of past volatility in spot prices on the future volatility in future prices can be spotted in
the results but in our point of view it can be termed as cascading effects because of co
movement of the series.
Table 9: Volatility spillover effects from future market
to spot market in case of guar seed
SIBM 79
21
211
2-- ++= ttot u sbaas
Dependent Variable: Spot returns in Gaur Seed
Method: ML - ARCH (Marquardt) - Normal distribution
Mean Equation
Coefficient Std. Error z-Statistic Prob.
C 0.000544 0.000305 1.782563 0.0747
AR(1) 0.314239 0.379283 0.828507 0.4074
MA(1) -0.260009 0.389669 -0.667255 0.5046
Variance Equation
C 7.28E-06 1.24E-06 5.861468 0.0000
Residual Term 0.089704 0.011388 7.876931 0.0000
GARCH Term 0.798158 0.012942 61.67117 0.0000
Squared lagged residual in
future returns of guar seed0.076422 0.006450 11.84838 0.0000
Volume VI, No. 2 September 2013
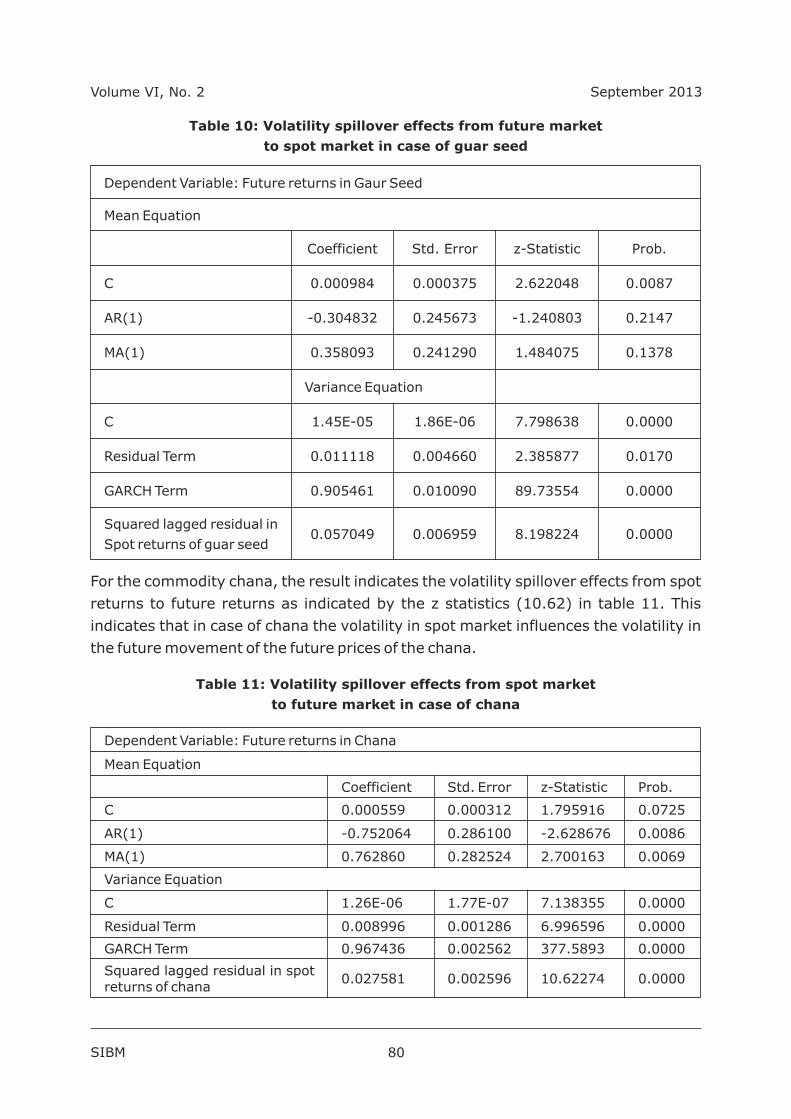
Table 10: Volatility spillover effects from future market
to spot market in case of guar seed
For the commodity chana, the result indicates the volatility spillover effects from spot
returns to future returns as indicated by the z statistics (10.62) in table 11. This
indicates that in case of chana the volatility in spot market influences the volatility in
the future movement of the future prices of the chana.
Table 11: Volatility spillover effects from spot market
to future market in case of chana
SIBM 80
Dependent Variable: Future returns in Gaur Seed
Mean Equation
Coefficient Std. Error z-Statistic Prob.
C 0.000984 0.000375 2.622048 0.0087
AR(1) -0.304832 0.245673 -1.240803 0.2147
MA(1) 0.358093 0.241290 1.484075 0.1378
Variance Equation
C 1.45E-05 1.86E-06 7.798638 0.0000
Residual Term 0.011118 0.004660 2.385877 0.0170
GARCH Term 0.905461 0.010090 89.73554 0.0000
Squared lagged residual in
Spot returns of guar seed0.057049 0.006959 8.198224 0.0000
Dependent Variable: Future returns in Chana
Mean Equation
Coefficient Std. Error z-Statistic Prob.
C 0.000559 0.000312 1.795916 0.0725
AR(1) -0.752064 0.286100 -2.628676 0.0086
MA(1) 0.762860 0.282524 2.700163 0.0069
Variance Equation
C 1.26E-06 1.77E-07 7.138355 0.0000
Residual Term 0.008996 0.001286 6.996596 0.0000
GARCH Term 0.967436 0.002562 377.5893 0.0000
Squared lagged residual in spot returns of chana
0.027581 0.002596 10.62274 0.0000
Volume VI, No. 2 September 2013
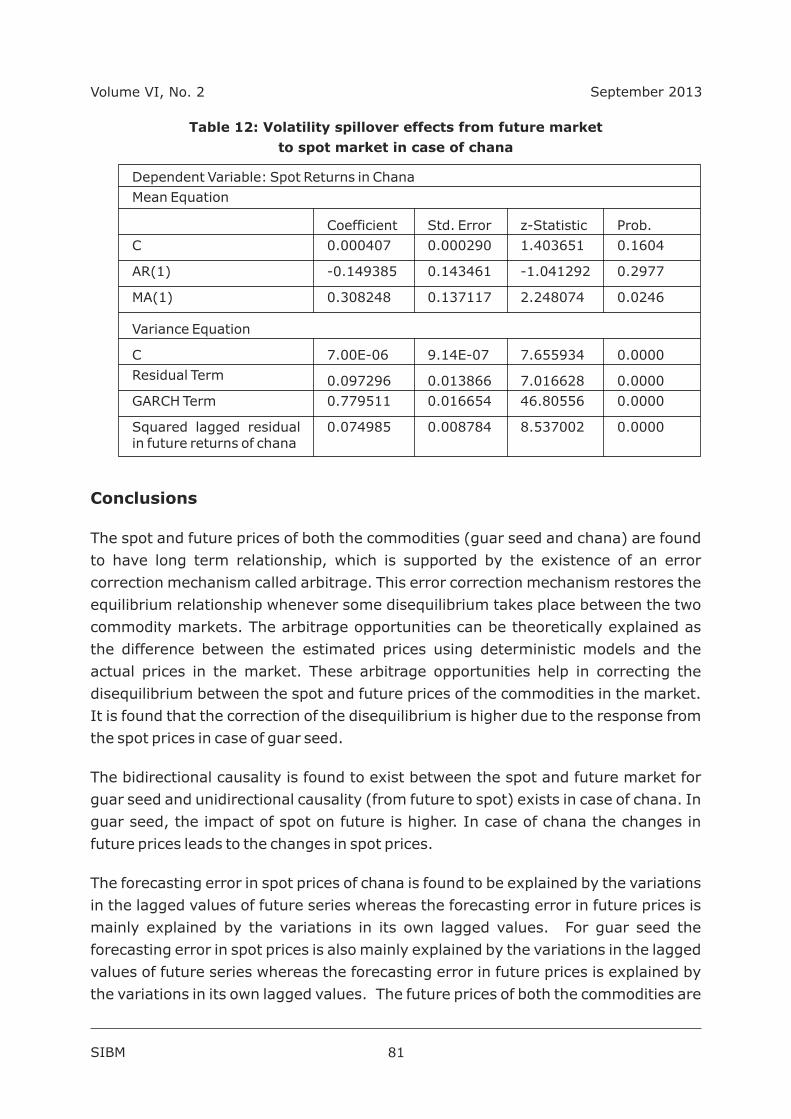
Table 12: Volatility spillover effects from future market
to spot market in case of chana
Conclusions
The spot and future prices of both the commodities (guar seed and chana) are found
to have long term relationship, which is supported by the existence of an error
correction mechanism called arbitrage. This error correction mechanism restores the
equilibrium relationship whenever some disequilibrium takes place between the two
commodity markets. The arbitrage opportunities can be theoretically explained as
the difference between the estimated prices using deterministic models and the
actual prices in the market. These arbitrage opportunities help in correcting the
disequilibrium between the spot and future prices of the commodities in the market.
It is found that the correction of the disequilibrium is higher due to the response from
the spot prices in case of guar seed.
The bidirectional causality is found to exist between the spot and future market for
guar seed and unidirectional causality (from future to spot) exists in case of chana. In
guar seed, the impact of spot on future is higher. In case of chana the changes in
future prices leads to the changes in spot prices.
The forecasting error in spot prices of chana is found to be explained by the variations
in the lagged values of future series whereas the forecasting error in future prices is
mainly explained by the variations in its own lagged values. For guar seed the
forecasting error in spot prices is also mainly explained by the variations in the lagged
values of future series whereas the forecasting error in future prices is explained by
the variations in its own lagged values. The future prices of both the commodities are
SIBM 81
Dependent Variable: Spot Returns in Chana
Mean Equation
Coefficient Std. Error z-Statistic Prob.
C 0.000407 0.000290 1.403651 0.1604
AR(1) -0.149385 0.143461 -1.041292 0.2977
MA(1) 0.308248 0.137117 2.248074 0.0246
Variance Equation
C 7.00E-06 9.14E-07 7.655934 0.0000
Residual Term 0.097296 0.013866 7.016628 0.0000
GARCH Term 0.779511 0.016654 46.80556 0.0000
Squared lagged residual in future returns of chana
0.074985 0.008784 8.537002 0.0000
Volume VI, No. 2 September 2013
exogenous in nature whereas the spot prices are influenced by the lagged behavior of
future prices. The significant and higher response of the spot prices to the shocks in
future prices in case of both the commodities guar seed and chana is found in the
study.
The future market of the commodities is featured with high volume of trade with
better liquidity due to low margin requirements and the presence of large number of
participants including traders, speculators and arbitrageurs. Due to this reason the
future markets of the commodities are supposed to be more efficient as compared to
spot market. Hence when new information about the commodity comes into the
market, the participants responds to the information and involves in rebalancing their
positions in the portfolios according to their perception about the future implications
of the news. In such a case the future market is very fast to respond to the news as
compared to the spot market. In this system the volatility lying in the commodity
prices is also a major concern for the participants. In case of guar seed the volatility in
future prices influences the volatility in the spot prices. Although the significant
impact of past volatility in spot prices on the future volatility in future prices can be
spotted in the results but in our point of view it can be termed as cascading effects
because of co movement of the series. For the commodity chana, the volatility
spillover effects is found from spot returns to future returns which means that the
volatility in spot market of chana influences the volatility in the future movement of
the future prices.
References
1. Ahuja, Narendra, L.,(2006) “Commodity Derivatives Market in India:
Development, Regulation and Future Prospects” International Research Journal
of Finance and Economics, Issue 2.
2. Alizadeh, Amir H., Nomikos, Nikos K. and Pouliasis, Panos, K., (2008) “A Markov
regime switching approach for hedging energy commodities” Journal of Banking
and Finance, Vol. 32, (9), pp. 1970 – 1983.
3. Antoniou, Antonios, Foster, Andrew,J., (1992) “The effect of futures trading on
spot price volatility : Evidence for Brent Crude Oil using GARCH” Journal of
Business Finance & Accounting, Vol.19,( 4), pp. 473 – 484.
4. Back, Janis, Prokopczuk, Marcel and Rudolf, Markus., (2012) “Seasonality and
the valuation of commodity options” Journal of Banking and Finance, Vol. 37(2),
pp. 273 – 290
5. Bessembinder, Hendrik and Seguin, Paul,J., (1993) “Price Volatility, Trading
Volume, and Market Depth: Evidence from Futures Markets” Journal of Financial
& Quantitative Analysis, Vol. 28 ( 1), pp. 21 – 39.
SIBM 82
Volume VI, No. 2 September 2013
6. Bhattacharya, A.K., A. Ramjee and B. Ramjee (1986), 'The Conditional
Relationship between Futures Price Volatility and the Cash Price Volatility of
GNMA Securities' Journal of Futures Markets. Vol. 6 (1), pp. 29-39.
7. Chassard, C, and M, Halliwell (I986), 'The NYMEX Crude Oil Futures Market: An
Analysis of its Performance', Oxford Institute for Energy Studies, Working Paper
No. M9.
8. Ching, Michael, T.,(2009) “Economic linkages across commodity futures:
Hedging and trading implications” Journal of Banking & Finance, Vol. 33(5), pp.
958 – 970.
9. Debasish S. S., (2011) “Spot and Futures: Market Relative Volatility” SCMS
Journal of Indian Management, Vol. 8 (3), pp. 94 – 105.
10. Edwards (1988), “Futures Trading and Cash Market Volatility: Stock Index and
Interest Rate Futures” Journal of Futures Markets, Vol. 8, (4)pp. 421 – 440.
11. Fernandez, Viviana., (2012) “Trends in real commodity prices : How real is real
?” Resources Policy, Vol. 37 (1), pp. 30 – 47.
12. Figlewski, S, (1984)“Futures Trading and Volatility in the GNMA Market”, Journal
of Finance, Vol. 36 (2) pp. 445-456.
13. Froewiss, K.C. (1978), 'GNMA Futures: Stabilizing or Destabilizing?' Federal
Reserve Bank of San Francisco, Economic Review, pp. 20-29.
14. Gallo, Giampiero, M. and Edoardo, Otranto., (2008) “Volatility spillovers,
interdependence and co-movements: A Markov Switching approach”
Computational Statistics and Data Analysis, Vol. 52 (6), pp. 3011 – 3026.
15. Garbade, K.D. and W.L. Silber, (1983), “Price Movements and Price Discovery in
Futures and Cash Markets”Review of Economics and Statistics. Vol. 65, pp. 289-
297.
16. Geman, Helyette and Ohana, Steve., (2008) “Time – consistency in managing a
commodity portfolio: A dynamic risk measure approach” Journal of Banking
and Finance, Vol. 32, (10), pp. 1991 – 2005.
17. Lien, Donald and Yang, Li., (2007)“Asymmetric effect of basis on dynamic
futures hedging: Empirical evidence from commodity markets” Journal of
Banking & Finance, Vol. 32, pp. 187 – 198.
18. Liu, Peng (Peter) and Tang, Ke., (2010) “No – arbitrage conditions for storable
commodities and the modeling of futures term structures” Journal of Banking &
Finance, Vol. 34, ( 7), pp. 1675 – 1687.
19. Minten, Bart, Reardon, Thomas and Sutradhar, Rajib., (2010) “Food prices and
modern retail: The case of Delhi” World Development, Vol. 38, (12), pp. 1775 –
1787.
20. Mukherjee, Dr. KedarNath (2011), “Impact of Futures Trading on Indian
Agricultural Commodity Market”, MPRA Paper No. 29290
21. Nair, Abhilash S., (2011),”Existence and extent of impact of individual stock
derivatives on spot market volatility in India” Applied Financial Economics, Vol.
21 (8), pp. 563 – 600.
SIBM 83
Volume VI, No. 2 September 2013
22. Nazlioglu, Saban, Erdem, Cumhur and Soytas, Ugur., (2012) “Volatility spillover
between oil and agricultural commodity markets” Energy Economics, pp. 1 – 28.
23. Ollermann, C.M. and Farris, P.L., (1985) “Futures or Cash: Which Market Leads
Beef CattlePrices?”The Journal of Futures Markets, pp. 529 – 538.
24. Paschke, Raphael and Prokopczuk, Marcel.,(2010) “Commodity derivatives
valuation with autoregressive and moving average components in the price
dynamics” Journal of Banking and Finance, November 2010, Vol. 34 ( 11), pp.
2742 – 2752.
25. Sakthivel, P. and Kamaiah, B., (2010) “Price Discovery and Volatility Spillover
Between Spot and Futures Markets: Evidence from India”IUP Journal of Applied
Economics, Vol. 9 (2), pp. 81 – 97.
26. Sen,Abhijit (2008) “Report of The Expert Committee To Study The impact of
Futures Trading On Agricultural Commodity Prices” Ministry of Consumer
Affairs, Food & Public Distribution, Government of India.
27. Silverio, Renan and Szklo, Alexandre., (2012) “The effect of the financial sector
on the evolution of oil prices: Analysis of the contribution of the futures market
to the price discovery process in the WTI spot market” Energy Economics, Vol.
32, (6), pp. 1799 – 1808.
28. Verma, Ashutosh and Kumar, C. V. R. S. Vijay, (2010)“An Examination of the
Maturity Effect in the Indian Commodities Futures Market” Agricultural
Economics Research Review, Jul-Dec 2010, Vol. 23 (2), pp. 335 – 342.
29. Yang, Jian, Balyeat, Brian R. and Leatham, David J., (2005) “Futures trading
activity and commodity cash price volatility” Journal of Business Finance &
Accounting, Vol. 32, Issue 1 – 2, pp. 297 – 323.
30. Yu, Shang-Wu.,(2001) “Index futures trading and spot price volatility” Applied
Economics Letters”, , Vol. 8 (3), pp. 183 – 186.
31. Zant, Wouter., (2001) “Hedging price risks of farmers by commodity boards: A
simulation applied to the Indian natural rubber market” World Development,
Vol. 29(4), pp. 691 – 710.
SIBM 84
September 2013Volume VI, No. 2