market assessment data book and findings - b3k prosperity
TRANSCRIPT
1B3K Market Assessment |
Core Tea Meeting 1 – May X, 2020
Market Assessment Data Book and Findings
updated March 2021
2B3K Market Assessment |
Kern County: Economic performance and clusters
Opportunity Industries: Job quality and shared prosperity 2
Fundamentals of growth: Drivers of competitiveness3
4 Findings: Implications and next steps
Market Assessment Data Book | TOC
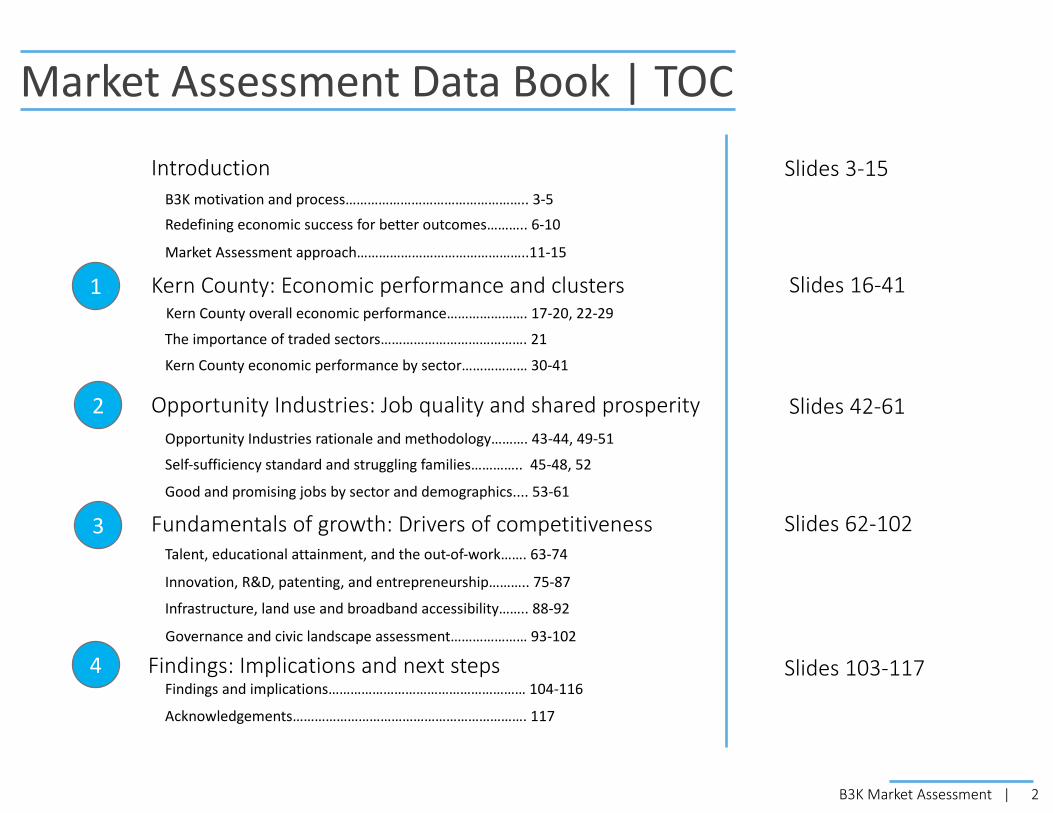
Introduction Slides 3-15
Slides 16-41
Slides 42-61
Slides 62-102
Slides 103-117
1
The importance of traded sectors…………………………………. 21
B3K motivation and process………………………………………….. 3-5Redefining economic success for better outcomes……….. 6-10
Market Assessment approach………………………………………..11-15
Kern County overall economic performance…………………. 17-20, 22-29
Kern County economic performance by sector……………… 30-41
Opportunity Industries rationale and methodology………. 43-44, 49-51
Self-sufficiency standard and struggling families………….. 45-48, 52
Good and promising jobs by sector and demographics.... 53-61
Talent, educational attainment, and the out-of-work……. 63-74
Innovation, R&D, patenting, and entrepreneurship……….. 75-87
Infrastructure, land use and broadband accessibility…….. 88-92
Governance and civic landscape assessment………………… 93-102
Findings and implications……………………………………………… 104-116
Acknowledgements………………………………………………………. 117

3B3K Market Assessment |
B3K Regional Economic Prosperity project motivation, differentiation, and “Market Assessment” role
Despite years of extraordinary job growth and economic mobility for residents, the Bakersfield MSA / Kern County region is starting to fall behind peers and the nation in core aspects of economic performance and competitiveness. In particular, the region is experiencing extreme pressure from market forces and state regulatory action on the industry strengths that historically drive the economy and create opportunity. These challenges have been masked by rapid increases in population that drive local consumption and the expansion of industry sectors offering lower job quality.
Responding to these trends and disruptions, regional leaders launched “A Better Bakersfield and Boundless Kern (B3K)” in late spring 2020. B3K is a collaboration among business, government, and civic stakeholders to create and deliver a joint strategy and operational / investment plan for regional economic growth and opportunity, centered on promoting quality job creation that is enduring and accessible to all residents.
The B3K process differs from prior strategies in the scale and depth of active engagement across stakeholders to develop and implement solutions – large and small firms in multiple industries, labor, education, workforce development, community and environmental groups, local and state government, philanthropy – not just economic development professionals setting an agenda for their individual organizations. Significant early effort was dedicated to this basic civic organizing and education. Thus, beyond strategy decisions, B3K aligns diverse actors to maximize impact in advancing a common agenda for regional prosperity, focusing on shared implementation, commitments to execution, and performance measures for mutual accountability.
Developed over six months, this Market Assessment is the evidence-based foundation needed to achieve those objectives, aggregating data and qualitative analyses into a candid picture of the region’s performance and competitive position. The purpose of the Market Assessment is not to make definitive decisions on new programs. Rather, the function is to deliver findings and considerations that inform stakeholders in the final phase of collectively determining strategic interventions and institutional accountability for implementation. Thus, the Market Assessment research –
• Provides a broad community understanding of core regional economic challenges, and a realistic view of assets and opportunities.• Promotes a shared economic development philosophy and framework for gauging economic success in order to jointly set objectives, guide decisions, and
measure progress.• Sets boundaries and criteria for the strategic trade-offs required on what will have the greatest impact toward those objectives, given resource constraints.• Identifies contributory roles of diverse actors across sectors -- beyond economic development professionals -- in order to both guide individual efforts toward
mutual outcomes and promote functional collaborations in delivering tactics and programs.• Enables an honest self-evaluation of the region’s expectations for economic development actors and evolution to current needs.• Establishes the topics and areas for exploration for developing tactical responses and determining how to carry them out.

4B3K Market Assessment |
B3K process delivers research, strategies and tactics, operations, civic infrastructure
B3K is structured in four phases, with the final implementation stage reached over the course of approximately one year:
• Organizing – Establishing a locally-tailored structure and workplan; identifying and engaging the range of participants needed for institutional ownership of both planning and implementation, aligning them on the project outcomes and distinctive approach; and informing stakeholders about current economic development influences, principles, and practices.
• Discovery – Producing an evidence-based Market Assessment built on quantitative and qualitative inputs to provide a complete narrative aboutthe regional economy and draw findings around which to organize strategy response and guide decisions on interventions.
• Strategy and Governance – Developing a response to findings through a local problem-solving process of assignments, supplemental analysis, and peer expertise; resulting in clear goals, tactics, operational protocols, resource implementation, and progress measures; and determining an ongoing governance structure for distributed implementation and accountability.
• Implementation – Refining tactics, finalizing initiative business plans and investment prospectuses, fundraising, launching activities, and formalizing governance.
5B3K Market Assessment |
B3K relies on leadership and engagement of diverse, non-traditional stakeholders across sectors
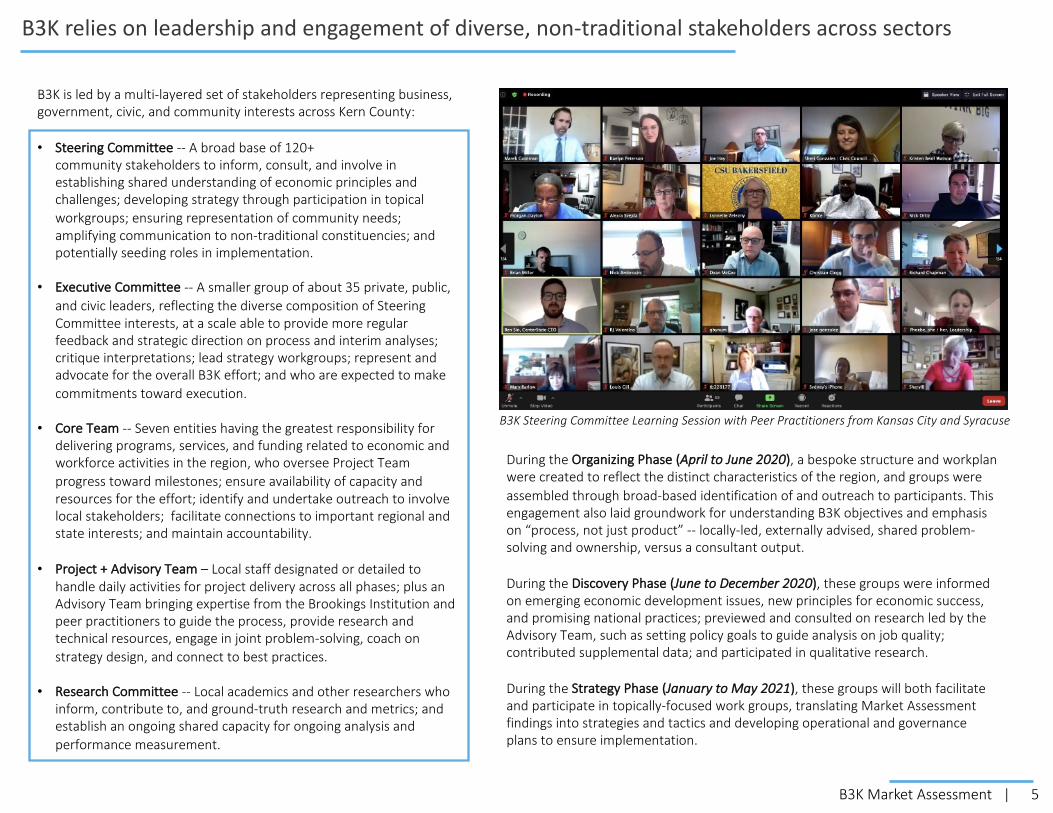
B3K is led by a multi-layered set of stakeholders representing business, government, civic, and community interests across Kern County:
• Steering Committee -- A broad base of 120+ community stakeholders to inform, consult, and involve in establishing shared understanding of economic principles and challenges; developing strategy through participation in topical workgroups; ensuring representation of community needs; amplifying communication to non-traditional constituencies; and potentially seeding roles in implementation.
• Executive Committee -- A smaller group of about 35 private, public, and civic leaders, reflecting the diverse composition of Steering Committee interests, at a scale able to provide more regular feedback and strategic direction on process and interim analyses; critique interpretations; lead strategy workgroups; represent and advocate for the overall B3K effort; and who are expected to make commitments toward execution.
• Core Team -- Seven entities having the greatest responsibility for delivering programs, services, and funding related to economic and workforce activities in the region, who oversee Project Team progress toward milestones; ensure availability of capacity and resources for the effort; identify and undertake outreach to involve local stakeholders; facilitate connections to important regional and state interests; and maintain accountability.
• Project + Advisory Team – Local staff designated or detailed to handle daily activities for project delivery across all phases; plus an Advisory Team bringing expertise from the Brookings Institution and peer practitioners to guide the process, provide research and technical resources, engage in joint problem-solving, coach on strategy design, and connect to best practices.
• Research Committee -- Local academics and other researchers who inform, contribute to, and ground-truth research and metrics; and establish an ongoing shared capacity for ongoing analysis and performance measurement.
During the Organizing Phase (April to June 2020), a bespoke structure and workplan were created to reflect the distinct characteristics of the region, and groups were assembled through broad-based identification of and outreach to participants. This engagement also laid groundwork for understanding B3K objectives and emphasis on “process, not just product” -- locally-led, externally advised, shared problem-solving and ownership, versus a consultant output.
During the Discovery Phase (June to December 2020), these groups were informed on emerging economic development issues, new principles for economic success, and promising national practices; previewed and consulted on research led by the Advisory Team, such as setting policy goals to guide analysis on job quality; contributed supplemental data; and participated in qualitative research.
During the Strategy Phase (January to May 2021), these groups will both facilitate and participate in topically-focused work groups, translating Market Assessment findings into strategies and tactics and developing operational and governance plans to ensure implementation.
B3K Steering Committee Learning Session with Peer Practitioners from Kansas City and Syracuse

6B3K Market Assessment |
Traditional expectations and emphasis of economic development do not address current dynamics
However, the vast majority of job creation actually comes from expansion of existing firms and formation of new firms within a region, not business attraction. For Kern County, approximately 1% of job gains over the past decade were attributable to firms moving in, roughly the same proportion as losses from businesses leaving the region. These attraction outcomes are consistent with many peer economic regions, also reflecting site selector analyses showing a persistent decline in potential deals worth more than 50 jobs or $1 million.
Thus, traditional expectations and misperceptions incentivize an excessive emphasis on attracting businesses. This, in turn, rewards focusing on external marketing over internal ecosystem-building that helps a region to grow from within by providing business supports, talent development, shared innovation assets, export and FDI promotion, and capital access. For example, despite evaluations consistently pegging the return on investment from customized training at ten times greater than that of tax breaks, job training accounts for a paltry 2% of the U.S.’s $50 billion annual spend on economic development incentives. At the same time, site selectors rank workforce skills and workforce development as their top two criteria, followed by transport infrastructure, permitting processes, and taxes; with higher-value opportunities competing on labor quality versus cheap land (Site Selection Magazine survey, Nov 2020).
Conventional views about regional economic development goals and methods no longer align with the most important inputs to competitiveness and how the economy creates opportunity for residents.
For decades, the purpose of economic development has been viewed predominantly as job creation and tax base enhancement, with metrics that center on greenfield projects. Practitioners most often are rewarded based on job counts from attracting a business or capital investment totals for a new facility. These wins are media-friendly, simple to quantify, and easy to interpret as connected to an economic development organization’s visible activities.
Source: Analysis of National Establishment Time-Series (NETS) data, Business Dynamics Research Consortium
25%
74%
1%
70%
29%
1%
Sources of Job Gains vs Losses in Kern County, 2009-2019
Sources: Conway Data; Brookings, Talent-driven economic development, 2019.

7B3K Market Assessment |
Traditional expectations and emphasis of economic development do not address current dynamics
This dynamic also reflects the interplay between funding and strategy of economic development organizations (EDOs). Real estate developers and local governments – often significant EDO funders -- are drawn to attraction. Regional traded sector and young firms, meanwhile, benefit most from investments in resources and programs that support their own growth, not pitching location decisions to outside businesses.
Business attraction remains a valuable part of the economic development toolkit, especially when focused on an anchor that can spin off supply chain development, inject the benefits of foreign investment, or augment a high-value cluster by adding to the shared innovation and talent pool. COVID-19 adaptations likely increase potential for proximate supply chain nodes. However, the amount of attention, effort, resources, and weight given to business attraction as an economic development tool typically is far beyond its value and return on investment.
In rebalancing to grow from within, EDOs only hold direct responsibility or capability for a subset of all the policies, programs, and investments that contribute to the ecosystem. Many other regional stakeholders contribute to the prerequisites for improving economic performance –workforce developers, universities and technical colleges, innovation centers, infrastructure agencies, local and state government, community groups, and businesses individually and collectively.
What distinguishes EDOs is their core mission to work directly with firms toward outcomes; the other contributors are essential, but their inputs need to be orchestrated for maximum effect.
Net Job Creation by Source, 2009-2019
Attract/Leave0%
Expand/Contract69%
Start/Close31%
Above: Over a ten-year period, on net, expansion of existing businesses and new business starts accounted for nearly all job creation in Kern County. This reaffirms the value of focusing more economic development resources on the region’s internal ecosystem to support durability of start-ups and expansion of existing firms , while prioritizing business attraction for select opportunities that create quality jobs and generate other regional benefits to supply chain, investment, and talent.
Source: Analysis of National Establishment Time-Series (NETS) data, Business Dynamics Research Consortium

8B3K Market Assessment |
Macro trends and impacts have shifted the rationale and focus for regional economic development
Over the past three decades, macroeconomic trends in globalization, agglomeration of growth into larger urban centers, acceleration of technological disruptions, and demographic change have transformed regional economies and the kind of growth they produce. While Kern faces distinct issues as an economy built on commodities and resource extraction, plus external regulatory decisions, these macro trends are core challenges to every mid-sized city-region and fundamentally altered how economies work for residents.
Specifically, the shifts have led to expansion of jobs at the high-wage and low-wage ends of the spectrum, with a hollowing out of middle-skill, middle-income jobs. In turn, that has reduced economic mobility – the ability to improve income and wealth over generations – especially for the middle-class; only 50% of 30 year-olds out-earned their parents in 2015, compared to nearly 80% in 1980.
Globalization Agglomeration Technology Demographics
39% of Global GDP comes from cross-sector transactions in goods, services, and capital.
20 counties account for 50% of US business growth, versus 125 counties two decades ago.
Labor force growth is driven by more diverse populations, but with lower educational attainment.
Industry digital skill intensity correlates to higher mean annual wages, less susceptibility to automation.
50%
55%
60%
65%
70%
75%
80%
85%
90%
95%
1940 1945 1950 1955 1960 1965 1970 1975 1980Cohort birth year-15%
-10%
-5%
0%
5%
10%
15%
20%
25%
30%
20 40 60 80 100
Occupations ranked by mean wage
Percentage change in U.S. employment share by mean wages, 1980-2010 U.S. share of children earning more than their parents by age 30
These dynamics also impact the productivity and competitiveness of regions themselves. For instance, controlling for other factors, research shows that metro areas where lower-income children experience greater upward mobility achieve faster per capita income growth.
Responding to these challenges and opportunities requires a comprehensive economic development focus on targeting job quality and access over job counts or aggregate induced wages; building globally-distinctive clusters versus opportunistic business recruitments; and cultivating talent and technological aptitude versus capital expenditures.
Sources: Mandelman, Labor Market Polarization and International Macroeconomic Dynamics2013; Chetty, et al. The Fading American Dream: Trends in Absolute Income Mobility Since 1940, 2016.

9B3K Market Assessment |
Redefining economic success and the focus for regional economic development efforts
GROWTH PROSPERITY INCLUSION
METRICSJobs
Gross Metropolitan ProductEntrepreneurship (Jobs at Young Firms)
More productive firms to grow the economy from within and
generate higher-paying jobs, so the region competes on quality versus
low wages.
METRICSProductivity (GMP per Job)
Standard of Living (GMP per capita)Average Annual Wage
METRICSEmployment Rate
Median WageRelative Poverty
*differences by Race and Geography
More jobs created and expanded output that increases labor demand
and wages, plus young firms that generate greater wealth,
employment, and earnings.
Access to opportunities that raise employment and income, enabling
residents across all community segments to participate to the fullest
of their ability.
Thus, economic success for any region now is more holistic – the ability to achieve long-term expansion (growth), by improving the productivity and value-creation of individuals and firms (prosperity), to create and promote access to quality jobs and economic mobility for all residents (inclusion).
These three aspects are related and mutually reinforcing. Growth does not automatically equate to economic opportunity and inclusive prosperity, but it also is impossible to achieve resident self-sufficiency and middle-class aspirations without sustained growth. For businesses to adapt and generate better quality growth amid rising competition and disruptive technological change, they must be able to draw from regional capacity to solve their innovation challenges and adequately prepare people for the rigors of the modern economy, regardless of race or class.
These outcomes demand a different approach to economic development that distinguishes sectoral opportunities for job quality and access, prioritizes building local ecosystem assets for firms to form as much as marketing for a business to move in, and integrates efforts by all contributors to economic competitiveness.
Source: Brookings Metro Monitor
10B3K Market Assessment |
Delivering different economic outcomes requires focus on competitiveness drivers and scale
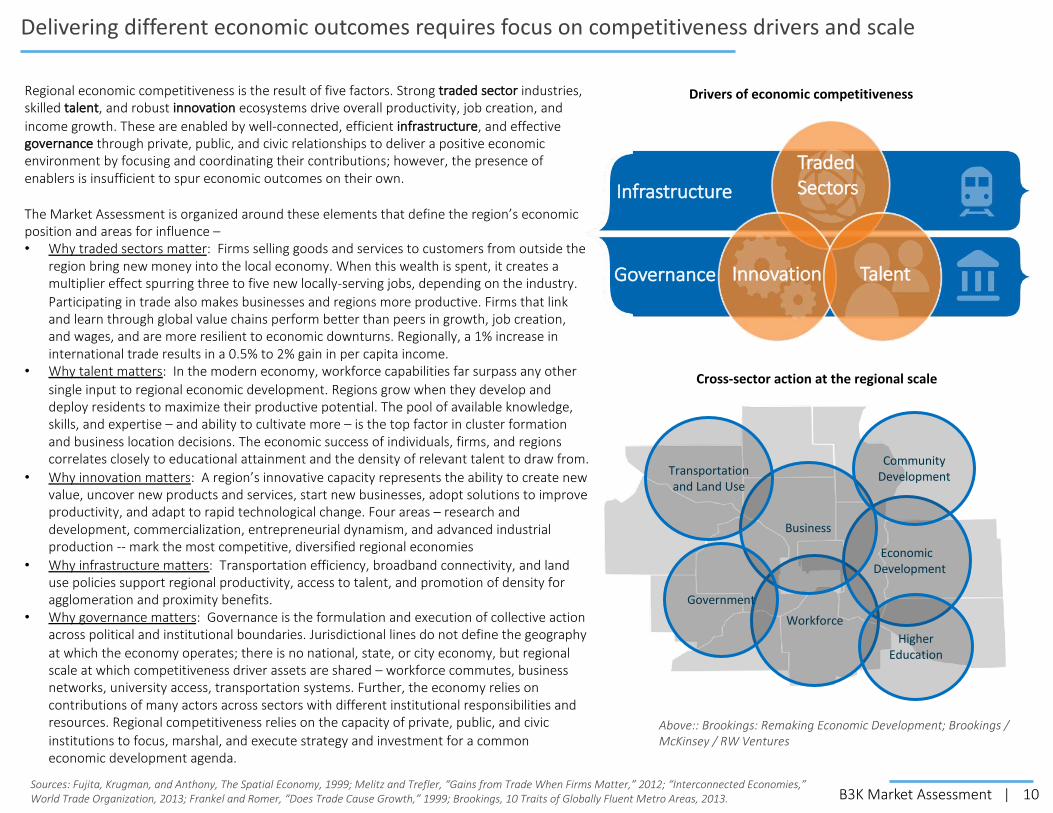
Above:: Brookings: Remaking Economic Development; Brookings / McKinsey / RW Ventures
Regional economic competitiveness is the result of five factors. Strong traded sector industries, skilled talent, and robust innovation ecosystems drive overall productivity, job creation, and income growth. These are enabled by well-connected, efficient infrastructure, and effective governance through private, public, and civic relationships to deliver a positive economic environment by focusing and coordinating their contributions; however, the presence of enablers is insufficient to spur economic outcomes on their own.
The Market Assessment is organized around these elements that define the region’s economic position and areas for influence –• Why traded sectors matter: Firms selling goods and services to customers from outside the
region bring new money into the local economy. When this wealth is spent, it creates a multiplier effect spurring three to five new locally-serving jobs, depending on the industry. Participating in trade also makes businesses and regions more productive. Firms that link and learn through global value chains perform better than peers in growth, job creation, and wages, and are more resilient to economic downturns. Regionally, a 1% increase in international trade results in a 0.5% to 2% gain in per capita income.
• Why talent matters: In the modern economy, workforce capabilities far surpass any other single input to regional economic development. Regions grow when they develop and deploy residents to maximize their productive potential. The pool of available knowledge, skills, and expertise – and ability to cultivate more – is the top factor in cluster formation and business location decisions. The economic success of individuals, firms, and regions correlates closely to educational attainment and the density of relevant talent to draw from.
• Why innovation matters: A region’s innovative capacity represents the ability to create new value, uncover new products and services, start new businesses, adopt solutions to improve productivity, and adapt to rapid technological change. Four areas – research and development, commercialization, entrepreneurial dynamism, and advanced industrial production -- mark the most competitive, diversified regional economies
• Why infrastructure matters: Transportation efficiency, broadband connectivity, and land use policies support regional productivity, access to talent, and promotion of density for agglomeration and proximity benefits.
• Why governance matters: Governance is the formulation and execution of collective action across political and institutional boundaries. Jurisdictional lines do not define the geography at which the economy operates; there is no national, state, or city economy, but regional scale at which competitiveness driver assets are shared – workforce commutes, business networks, university access, transportation systems. Further, the economy relies on contributions of many actors across sectors with different institutional responsibilities and resources. Regional competitiveness relies on the capacity of private, public, and civic institutions to focus, marshal, and execute strategy and investment for a common economic development agenda.
Infrastructure
Governance Innovation Talent
Drivers of economic competitiveness
Traded Sectors
Workforce
EconomicDevelopment
Business
Community Development
Government
Transportation and Land Use
Higher Education
Cross-sector action at the regional scale
Sources: Fujita, Krugman, and Anthony, The Spatial Economy, 1999; Melitz and Trefler, “Gains from Trade When Firms Matter,” 2012; “Interconnected Economies,” World Trade Organization, 2013; Frankel and Romer, “Does Trade Cause Growth,” 1999; Brookings, 10 Traits of Globally Fluent Metro Areas, 2013.

11B3K Market Assessment |
Market Assessment Approach
Strategy and Governance
This Market Assessment is an action-oriented research product resulting from a process led by the Brookings Advisory Team between June and December 2020. It provides the evidence base and implications from which B3K participants can decide priorities and create interventions during the Strategy Phase in January through May 2021.
• Quantitative analysis examined more than 80 indicators of the region’s economic performance, drawing on data from a range of proprietary and public sources, anchored by a novel assessment of “Opportunity Industries” job quality and access.
• Qualitative research undertook individual interviews, six topically-focused roundtables, and other ongoing engagement that totaled more than 100 substantive contacts with government, community, and business stakeholders; in order to collect market insights, contextualize quantitative findings, inventory programs and pilots, and consider civic governance capacity. These contacts extended beyond the 150+ combined participants in Steering, Executive, and Research Committees.
In addition, the local Project Team led two distinct efforts to ensure the Market Assessment reflected community input and voice: a scientifically-valid, County-wide public opinion survey conducted in Summer 2020 and a series of community engagement sessions in January 2021 focused on job quality and access.
Through the late summer and early fall, the Advisory Team previewed progress and analysis with stakeholders, receiving collective and individual feedback that informed or guided the process. For example, the Executive Committee as a whole set policy targets for reducing the share of working families that cannot achieve self-sufficiency in order to define the wage threshold for a “good job” used in the Opportunity Industries analysis. The Research Committee similarly provided perspective and input at various stages, including suggestions and context from supplementary analyses and data sources. Lastly, the Advisory Team conferred with consultants to the City of Bakersfield preparing a city-specific plan for an economic development function start-up and strategy, in order to ensure alignment in approaches.
Accounting for COVID-19:
B3K started to organize as the COVID-19 pandemic began. Amid a disruption of unknown duration and impact, undertaking a long-term regional economic strategy ran counter to the immediacy of severe disruptions for the region’s residents, workers, and businesses – as well as the uncertainty about implications for mid-term recovery or permanent changes to how the economy trends. Data reflecting ten years of post-recession economic performance or twenty years of worker career movements seemed disconnected from current circumstances, yet no post-COVID data would be available or any indicator of future directions.
Yet, what drives regional competitiveness, how to measure economic success, and options to organize for economic development have not changed with COVID-19. Rather, the pandemic has exposed and reinforced the challenges of job quality, family self-sufficiency, and economic mobility. It also has accelerated prior trends in digitalization, automation, and logistics. Several prospective growth opportunities raised by the pandemic – remote work; manufacturing supply chain resiliency; the potential that some second-tier cities could be more competitive with larger hubs – are intriguing, but remain to be proven.
Like all disruptions – technological, natural, or economic – goals and principles still set the basis for response, forecasting is an educated guess based on evidence and experience, and adaptability to evolving circumstances is required. The objectives and challenges for Bakersfield and Kern remain the same, as do assets, liabilities, and longitudinal data that defines those strengths and weaknesses.
COVID-19 impacts are a consideration for inputs, but they do not reset the fundamentals of how to approach an inclusive economic development strategy for the region.
12B3K Market Assessment |
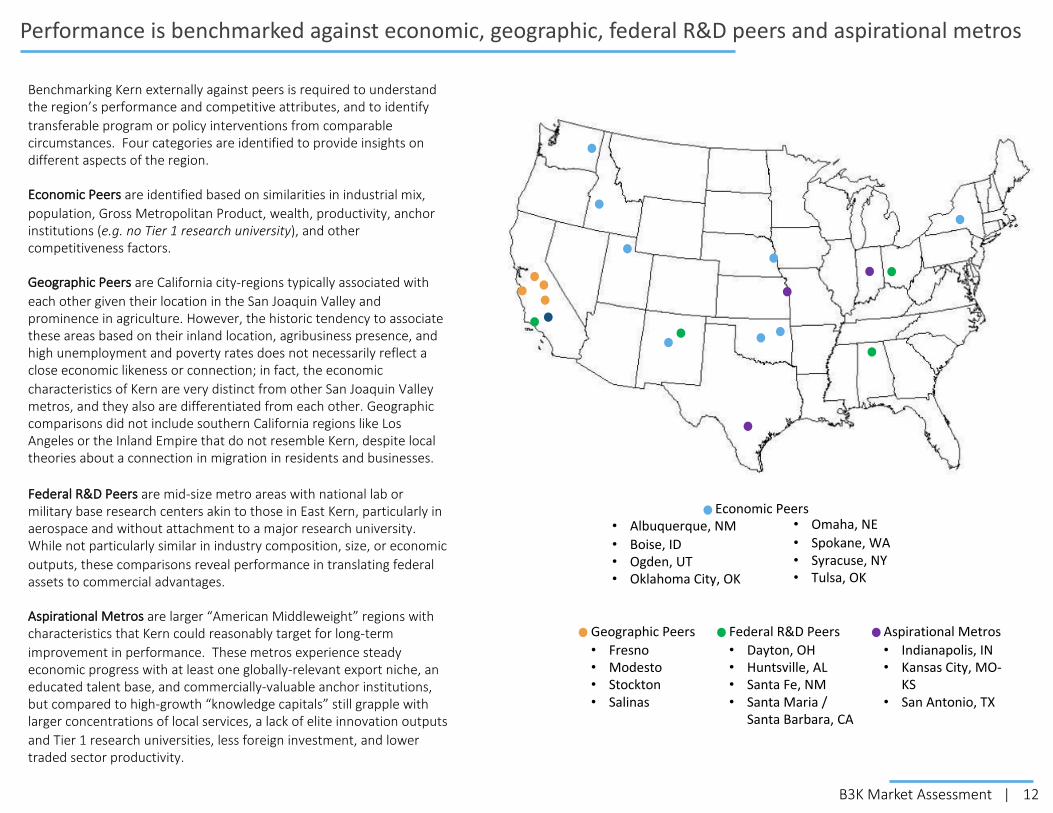
Performance is benchmarked against economic, geographic, federal R&D peers and aspirational metros
Geographic Peers• Fresno• Modesto• Stockton• Salinas
• Albuquerque, NM• Boise, ID• Ogden, UT• Oklahoma City, OK
Benchmarking Kern externally against peers is required to understand the region’s performance and competitive attributes, and to identify transferable program or policy interventions from comparable circumstances. Four categories are identified to provide insights on different aspects of the region.
Economic Peers are identified based on similarities in industrial mix, population, Gross Metropolitan Product, wealth, productivity, anchor institutions (e.g. no Tier 1 research university), and other competitiveness factors.
Geographic Peers are California city-regions typically associated with each other given their location in the San Joaquin Valley and prominence in agriculture. However, the historic tendency to associate these areas based on their inland location, agribusiness presence, and high unemployment and poverty rates does not necessarily reflect a close economic likeness or connection; in fact, the economic characteristics of Kern are very distinct from other San Joaquin Valley metros, and they also are differentiated from each other. Geographic comparisons did not include southern California regions like Los Angeles or the Inland Empire that do not resemble Kern, despite local theories about a connection in migration in residents and businesses.
Federal R&D Peers are mid-size metro areas with national lab or military base research centers akin to those in East Kern, particularly in aerospace and without attachment to a major research university. While not particularly similar in industry composition, size, or economic outputs, these comparisons reveal performance in translating federal assets to commercial advantages.
Aspirational Metros are larger “American Middleweight” regions with characteristics that Kern could reasonably target for long-term improvement in performance. These metros experience steady economic progress with at least one globally-relevant export niche, an educated talent base, and commercially-valuable anchor institutions, but compared to high-growth “knowledge capitals” still grapple with larger concentrations of local services, a lack of elite innovation outputs and Tier 1 research universities, less foreign investment, and lower traded sector productivity.
Federal R&D Peers• Dayton, OH• Huntsville, AL• Santa Fe, NM• Santa Maria /
Santa Barbara, CA
Aspirational Metros• Indianapolis, IN• Kansas City, MO-
KS• San Antonio, TX
• Omaha, NE• Spokane, WA• Syracuse, NY• Tulsa, OK
Economic Peers
13B3K Market Assessment |
Prior regional strategies identify recurring themes
• Distinctive assets in certain sectors, including aerospace, agriculture, and energy; business-friendly climate and streamlined regulatory processes within California; and quality of life / outdoor amenities.
• Lack of diversification and reliance on commodities and vulnerability to industry shocks; low educational attainment; geographic isolation between job centers; and high poverty, low wages, and other roadblocks to resident opportunity.
As a baseline, the Market Assessment process reviewed previous and ongoing strategy efforts to achieve economic, workforce, and community development objectives in Kern County. These efforts have sought to leverage and address common opportunities and challenges, such as:
Historic areas of emphasis include:
• Bakersfield Vision 2020 -- Improvements in broadband, business attraction, business development and entrepreneurship, workforce and economic alignment, business services, tech, and public/private collaborations.
• 2012-2013 CEDS -- Expansion of jobs and overall prosperity, increased inclusion and equity, and promotion of sustainability and high quality of life.
• Economic Roadmap for Kern County (2015) -- Emphasis on building on agriculture and oil to diversify, improving small business capital access, taking advantage of business-friendly climate, workforce development, and quality of place.
• Economic Diversification Plan for East Kern County (2017) -- Prioritized business development, talent development and recruitment, innovation and entrepreneurship, tourism and visitor attraction, and regional collaboration
• Kern, Inyo, and Mono WDB Local Plan (2017-2020) -- Advancement of state objectives around demand-driven skills attainment, enabling upward mobility, and program/service alignment, coordination, and integration. Local goals include boosting access to services, non-traditional partnerships, career pathways and other preparation for in-demand occupations in targeted sectors, and meeting business needs.
Current / historic economic and workforce development strategies that guide program and funding decisions:• Bakersfield Vision 2020 (2000)• Kern County CEDS (2013)• Kern County Incentives Policy (2020)• Economic Road Map for Kern County (2015)• Economic Diversification Plan for East Kern County (2017)• San Joaquin Valley and Associated Counties Regional Workforce Plan
(2017-2020)• Kern, Inyo, and Mono Workforce Development Board Local Plan
(2017-2020)
Other strategies, studies, and materials that provided context:• Sustainable Communities Strategy (2018)• Boundless & Better Rebranding Project (2019)• Kern EDC Market Overview (2020)• Kern County Food Systems Assessment (UC Davis/Kern Food Policy
Council, 2017)• Regions Rise Together convening materials (2019)• California Career Pathways Trust program summary / materials• Kern Economic Journal (CSUB, ongoing)• Kern County: Geography of Inequity and Opportunities for Action
(UC Davis/San Joaquin Valley Health Fund, 2017)• Oil & Gas In California: The Industry, Its Economic Contribution and
User Industries at Risk (LAEDC, 2019)• Economic Impact Study: High-Speed Rail Heavy Maintenance Facility
in Kern County (LAEDC, 2010)
14B3K Market Assessment |
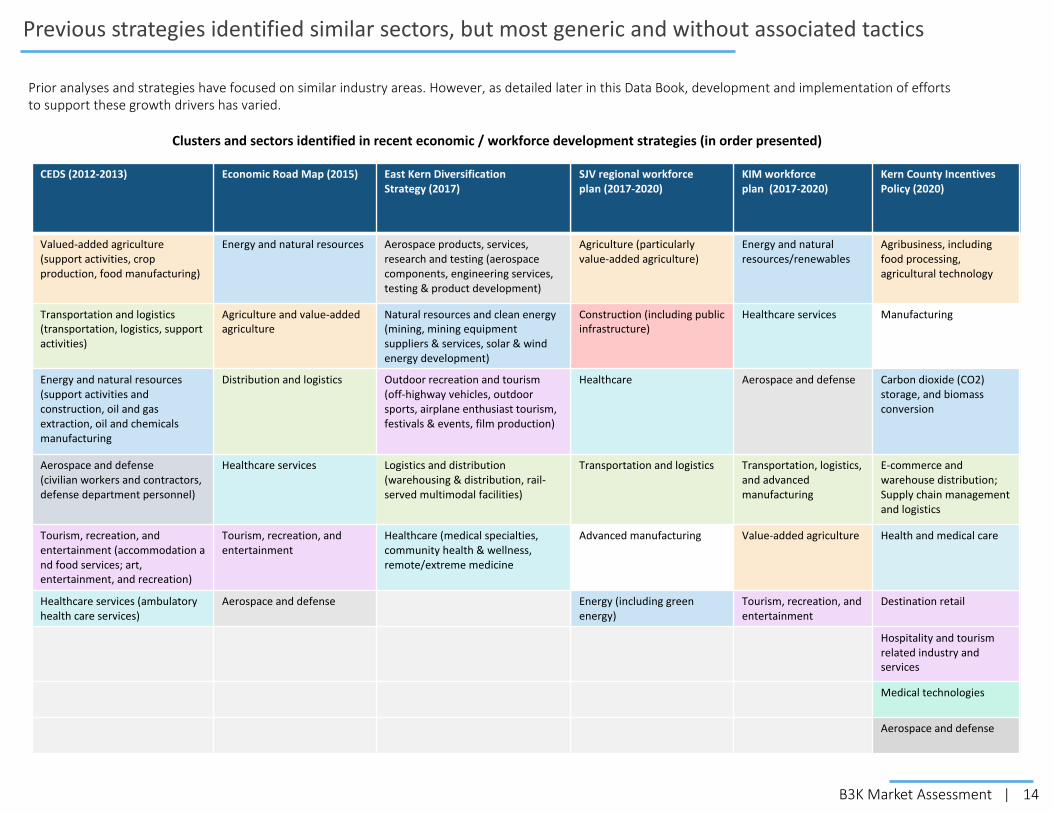
Previous strategies identified similar sectors, but most generic and without associated tactics
CEDS (2012-2013) Economic Road Map (2015) East Kern Diversification Strategy (2017)
SJV regional workforce plan (2017-2020)
KIM workforce plan (2017-2020)
Kern County Incentives Policy (2020)
Valued-added agriculture(support activities, crop production, food manufacturing)
Energy and natural resources Aerospace products, services, research and testing (aerospace components, engineering services, testing & product development)
Agriculture (particularly value-added agriculture)
Energy and natural resources/renewables
Agribusiness, including food processing, agricultural technology
Transportation and logistics(transportation, logistics, support activities)
Agriculture and value-added agriculture
Natural resources and clean energy (mining, mining equipment suppliers & services, solar & wind energy development)
Construction (including public infrastructure)
Healthcare services Manufacturing
Energy and natural resources (support activities and construction, oil and gas extraction, oil and chemicals manufacturing
Distribution and logistics Outdoor recreation and tourism (off-highway vehicles, outdoor sports, airplane enthusiast tourism, festivals & events, film production)
Healthcare Aerospace and defense Carbon dioxide (CO2) storage, and biomass conversion
Aerospace and defense(civilian workers and contractors, defense department personnel)
Healthcare services Logistics and distribution (warehousing & distribution, rail-served multimodal facilities)
Transportation and logistics Transportation, logistics, and advanced manufacturing
E-commerce and warehouse distribution; Supply chain management and logistics
Tourism, recreation, and entertainment (accommodation and food services; art, entertainment, and recreation)
Tourism, recreation, and entertainment
Healthcare (medical specialties, community health & wellness, remote/extreme medicine
Advanced manufacturing Value-added agriculture Health and medical care
Healthcare services (ambulatory health care services)
Aerospace and defense Energy (including green energy)
Tourism, recreation, and entertainment
Destination retail
Hospitality and tourism related industry and services
Medical technologies
Aerospace and defense
Prior analyses and strategies have focused on similar industry areas. However, as detailed later in this Data Book, development and implementation of efforts to support these growth drivers has varied.
Clusters and sectors identified in recent economic / workforce development strategies (in order presented)
15B3K Market Assessment |
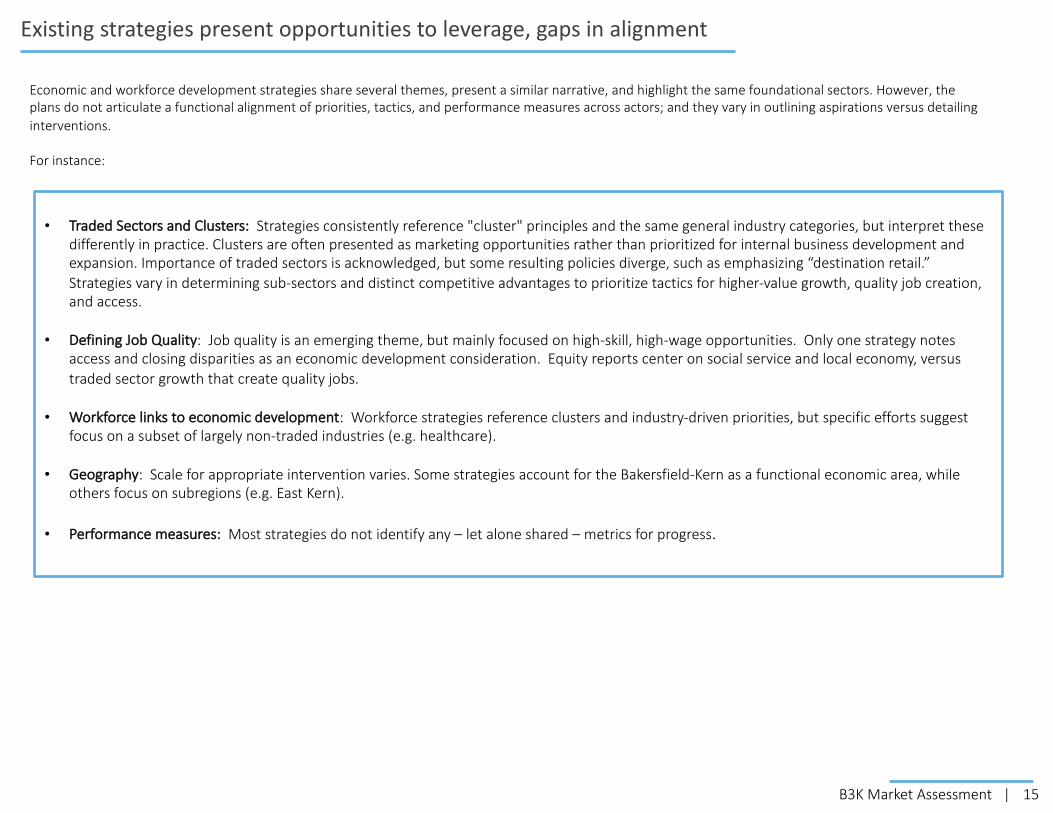
Existing strategies present opportunities to leverage, gaps in alignment
• Traded Sectors and Clusters: Strategies consistently reference "cluster" principles and the same general industry categories, but interpret these differently in practice. Clusters are often presented as marketing opportunities rather than prioritized for internal business development and expansion. Importance of traded sectors is acknowledged, but some resulting policies diverge, such as emphasizing “destination retail.” Strategies vary in determining sub-sectors and distinct competitive advantages to prioritize tactics for higher-value growth, quality job creation, and access.
• Defining Job Quality: Job quality is an emerging theme, but mainly focused on high-skill, high-wage opportunities. Only one strategy notes access and closing disparities as an economic development consideration. Equity reports center on social service and local economy, versus traded sector growth that create quality jobs.
• Workforce links to economic development: Workforce strategies reference clusters and industry-driven priorities, but specific efforts suggest focus on a subset of largely non-traded industries (e.g. healthcare).
• Geography: Scale for appropriate intervention varies. Some strategies account for the Bakersfield-Kern as a functional economic area, while others focus on subregions (e.g. East Kern).
• Performance measures: Most strategies do not identify any – let alone shared – metrics for progress.
Economic and workforce development strategies share several themes, present a similar narrative, and highlight the same foundational sectors. However, the plans do not articulate a functional alignment of priorities, tactics, and performance measures across actors; and they vary in outlining aspirations versus detailing interventions.
For instance:
16B3K Market Assessment |
Kern County: Economic performance and traded sectors1
Opportunity Industries: Job quality and economic mobility 2
Fundamentals of growth: Competitiveness Drivers3
4 Findings: Implications and next steps
Market Assessment Data Book
17B3K Market Assessment |
Change in Jobs
Change in GMP
Change in Jobs at Young Firms
Change in GMP per job
Change in Average Annual Wage
Change in GMP per capita
Change in Median Earnings
Change in Employment Rate
Change in Relative Poverty Rate
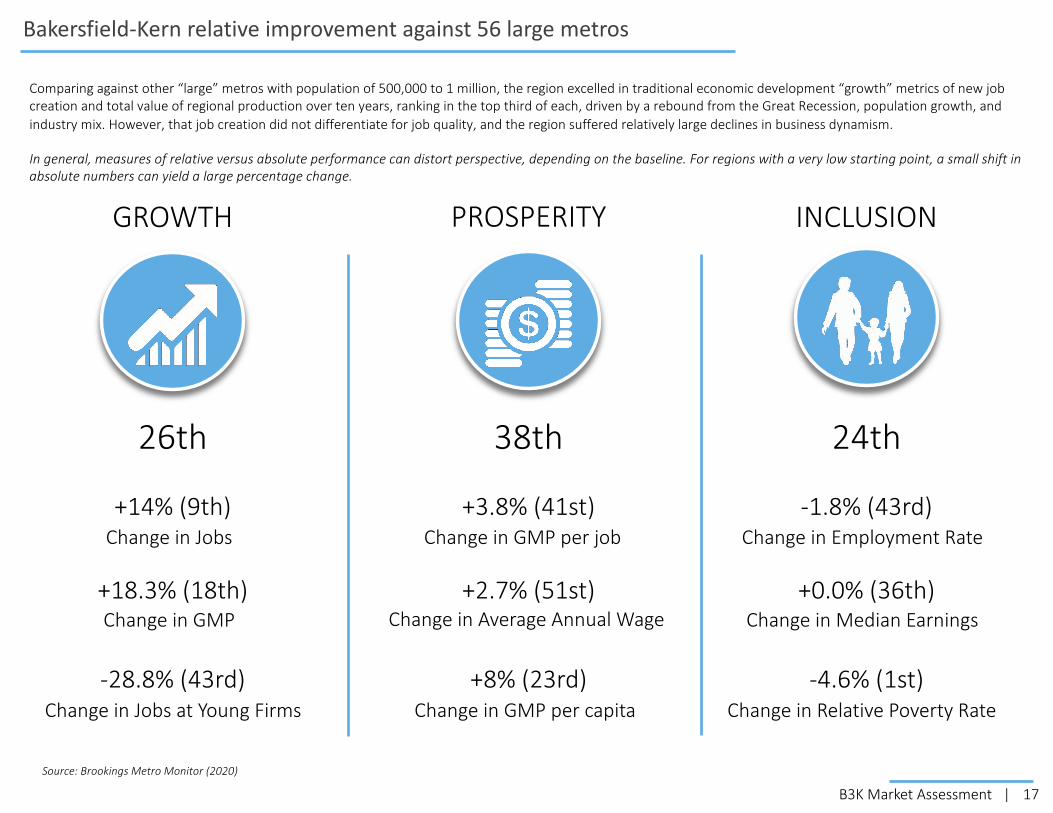
Comparing against other “large” metros with population of 500,000 to 1 million, the region excelled in traditional economic development “growth” metrics of new job creation and total value of regional production over ten years, ranking in the top third of each, driven by a rebound from the Great Recession, population growth, and industry mix. However, that job creation did not differentiate for job quality, and the region suffered relatively large declines in business dynamism.
In general, measures of relative versus absolute performance can distort perspective, depending on the baseline. For regions with a very low starting point, a small shift in absolute numbers can yield a large percentage change.
Source: Brookings Metro Monitor (2020)
26th 38th 24th
+14% (9th)
+18.3% (18th)
-28.8% (43rd)
+3.8% (41st)
+2.7% (51st)
+8% (23rd)
-1.8% (43rd)
+0.0% (36th)
-4.6% (1st)
Bakersfield-Kern relative improvement against 56 large metros
GROWTH PROSPERITY INCLUSION

18B3K Market Assessment |
95
100
105
110
115
2008 2009 2010 2011 2012 2013 2014 2015 2016 2017 2018
Bakersfield Large Metros United States
Kern lags national and peer comparisons in improving productivity, which correlates to lower wages
95
100
105
110
115
2008 2009 2010 2011 2012 2013 2014 2015 2016 2017 2018
Bakersfield, CA Albuquerque, NMOgden, UT Oklahoma City, OKOmaha, NE Spokane, WA
95
100
105
110
115
2008 2009 2010 2011 2012 2013 2014 2015 2016 2017 2018
Average annual wage versus large metros, 2008-2018
Bakersfield Large Metros
Average annual wage versus economic peers, 2008-2018
95
100
105
110
115
2008 2009 2010 2011 2012 2013 2014 2015 2016 2017 2018
Bakersfield, CA Albuquerque, NMOgden, UT Oklahoma City, OKOmaha, NE Spokane, WA
Productivity versus economic peers, 2008-2018
Prosperity indicators show changes in the wealth and income generated by an economy. Improved productivity of workers through upgraded skills or adoption of process innovation results in raising the value of labor, which enables and usually tracks to increased wages. The region’s lag in productivity versus peers also is reflected in the comparatively flat trajectory of average wages.
Productivity (output per job) versus national, 2008-2018
Source: Brookings Institution Metro Monitor, 2020
19B3K Market Assessment |
55%
60%
65%
70%
75%
2008 2009 2010 2011 2012 2013 2014 2015 2016 2017 2018
Kern vs large metro employment rate, 2008-2018
Kern Large US Metros
0%
10%
20%
30%
40%
50%
60%
70%
80%
2008 2009 2010 2011 2012 2013 2014 2015 2016 2017 2018
Kern employment rate by race, 2008-2018
White Hispanic Black Asian
Kern lags employment rate / median earnings versus large metros, shows regional disparity among races
$20,000
$25,000
$30,000
$35,000
2008 2009 2010 2011 2012 2013 2014 2015 2016 2017 2018
Kern vs large metro area median earnings, 2008-2018
Kern Large US Metros
$0
$5,000
$10,000
$15,000
$20,000
$25,000
$30,000
$35,000
$40,000
$45,000
$50,000
2008 2009 2010 2011 2012 2013 2014 2015 2016 2017 2018
Median earnings levels by race, 2008-2018
White Hispanic Black Asian
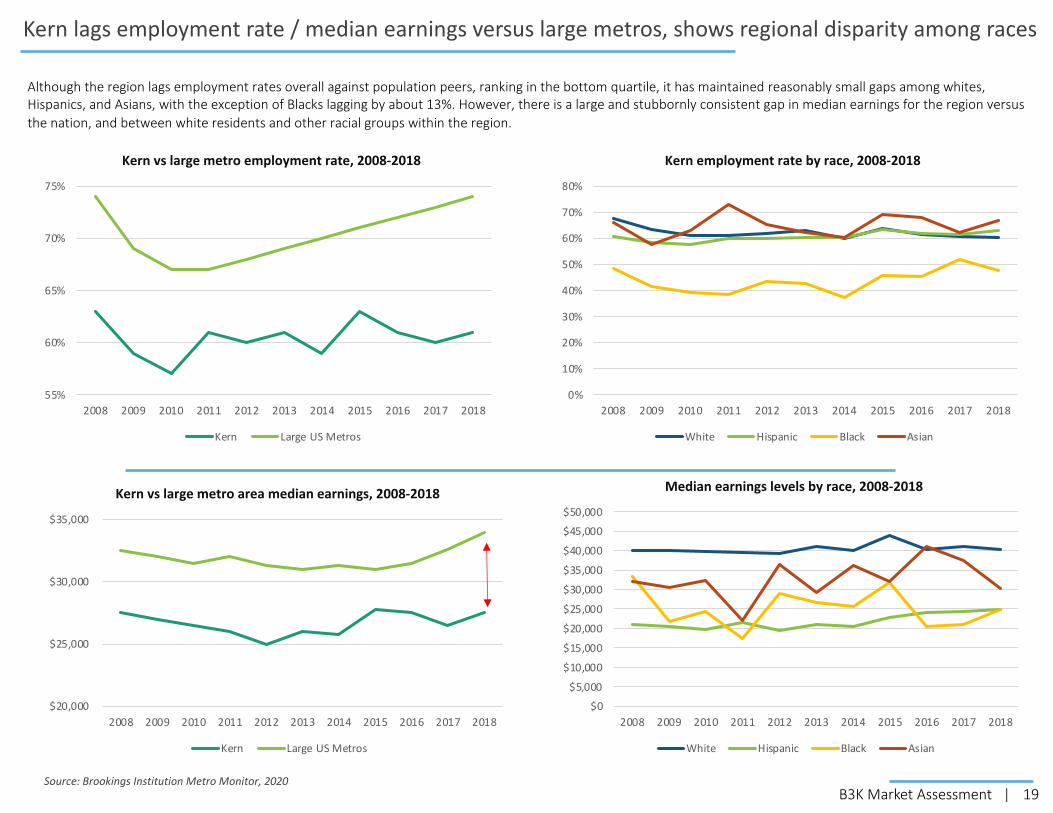
Although the region lags employment rates overall against population peers, ranking in the bottom quartile, it has maintained reasonably small gaps among whites, Hispanics, and Asians, with the exception of Blacks lagging by about 13%. However, there is a large and stubbornly consistent gap in median earnings for the region versus the nation, and between white residents and other racial groups within the region.
Source: Brookings Institution Metro Monitor, 2020

20B3K Market Assessment |
0%
5%
10%
15%
20%
25%
30%
35%
40%
45%
50%
2008 2009 2010 2011 2012 2013 2014 2015 2016 2017 2018
Relative income poverty rate by race, 2008-2018
White Hispanic Black Asian
20%
22%
24%
26%
28%
30%
2008 2009 2010 2011 2012 2013 2014 2015 2016 2017 2018
Kern vs large metros relative income poverty rate 2008-2018
Kern Large US Metros
Kern ranked among the very best regions nationwide in reducing income inequality overall, and among races.
This aspect is measured by the “relative income poverty” gap among races – the share of residents that earn less than half of the median income in the region. The lower this share, the less the disparity.
The region achieved this outcome by a combined massive 20% reduction among People of Color, as well as a slight increase among whites. Kern actually reached roughly equivalent levels between whites and Hispanics, while Blacks remained 7% higher.
In part, this metric reflects reduction in poverty rates over a decade, which lowered from a post-recession high above 23% to less than 18%.
However, this improvement does not indicate greater ability of working families to earn enough for self-sufficiency or achieve economic mobility. Rather, it shows a compression of wages closer toward the median income -- so that fewer workers are earning dramatically less than the midpoint between the highest and lowest paid.
As assessed in Section 2, more than half of Kern County residents struggle to make ends meet for basic living expenses, and more than two-thirds of those belong to families with at least one working adult.
Kern’s economy has dramatically narrowed income inequality, although not because all are improving
Source: Brookings Institution Metro Monitor, 2020

21B3K Market Assessment |
Competitiveness Drivers: Traded Sectors
Why traded sectors matter:
Firms selling goods and services to customers from outside the region bring new money into the local economy.
When this wealth is spent, it creates a multiplier effect spurring three to five new locally-serving jobs, depending on the industry.
Participating in trade also makes businesses and regions more productive.
Firms that link and learn through global value chains perform better than peers in growth, job creation, and wages, and are more resilient to economic downturns.
Regionally, a 1% increase in international trade results in a 0.5% to 2% gain in per capita income.

22B3K Market Assessment |
Competitivness
0.0%
5.0%
10.0%
15.0%
20.0%
25.0%
2009 2010 2011 2012 2013 2014 2015 2016 2017 2018 2019
Job
grow
th si
nce
2009
National job growth Kern County job growth due to industry structure Kern County total job growth
Kern County’s job growth and components of changeCumulative from 2009 to 2019*
Kern County added jobs faster than the nation and projections, based on its industry mix
Kern County’s recent job growth has outpaced the nation. Kern County’s job base grew 23% over the 10 years from 2009 to 2019, from 278,000 to 342,000 jobs. This exceeded the nation’s rate of job growth. The county entered and exited the Great Recession before the rest of the country and mounted a strong jobs recovery.
“Competitive shifts” account for about one-third of the county’s job growth during this period. The national labor market grew 14.3%, and Kern County’s specializations in faster-growing industries added another 1.1 percentage points to the county’s job growth rate. However, Kern County’s sectors added jobs at an even faster pace than the nation, accounting for the final 7.3 percentage points of the county’s job growth.
These industries were able to add jobs at a faster rate than their national counterparts because of distinct local economic conditions that drove their growth and/or made them more competitive.
Kern experienced a brief recession in the middle of the last decade. The county’s competitiveness was greatest during the early years of the recovery from the Great Recession, from 2010 to 2014. In 2015, the county’s two largest traded clusters, agriculture and oil, saw simultaneous downturns that caused a brief recession within the County. Though much of the agricultural sector since recovered, the county’s food manufacturing cluster did not. The oil industry shed half its jobs from 2015 to 2017 and has remained stagnant.
The County’s labor market revived thanks to population growth, and a few high-growth sectors. Though the county’s growth slowed from 2014 to 2017, it accelerated once more thanks in large part to increasing local demand, recovery of agricultural production, and the emergence of a transportation and logistics cluster. * This chart displays the results of a dynamic shift-share analysis, which decomposes local job growth into three factors: national macroeconomic
growth, national industry growth, and growth due to local competitive shifts.Source: Brookings analysis of Economic Modeling Specialists Intl. estimates and U.S. Clusters Mapping Project cluster definitions.

23B3K Market Assessment |
However, community perceptions elevate need for greater economic opportunity
Strategy and Governance
B3K stakeholders conducted a county-wide, scientifically-valid public opinion survey in Summer 2020 to better understand perceptions of economic performance and opportunity.
Nearly 40% of Kern residents felt that their area offered very little or no economic opportunity.
These findings validated the perceived importance of strategic action for improving the regional economy, aligned with success principles that focus on greater opportunity and access affording economic mobility.
Source: B3K Survey of Bakersfield-Kern Residents. Conducted by Cignal, Inc. August 24-September 1, 2020

24B3K Market Assessment |
Although classified as one metro, Kern has two functional economic areas that diverge in character
• Jobs in the Greater Bakersfield portion of Kern County grew by 24% from 2009 to 2019.
• Almost one-third of job growth in Greater Bakersfield was attributable to factors other than industry composition and national economic trends –namely population growth.
• Locally-serving consumer-driven sectors and local government accounted for most of this performance.
• Traded sectors account for only 12% of the region’s accelerated growth --driven primarily by agriculture.
• Jobs in the East Kern portion of the county grew by 11% from 2009 to 2019.
• East Kern specialized in industries that grew slowly nationwide, but still performed better within Kern County.
• Traded sector advanced industries and federal innovation center employment drove the area’s job growth.
• The area’s competitiveness enabled it to overcome these headwinds and add more jobs than expected.
Kern County GreaterBakersfield
City ofBakersfield
Suburbs
West KernGrowth due to national trends Growth due to industry mix Growth due to competitiveness
23%
32%
22%24%
Kern County East Kern County
East KernGrowth due to national trends Growth due to industry mix Growth due to competitiveness
23%
11% net growth
Economic regions typically are defined by Metropolitan Statistical Areas (MSAs) designated by the federal government as encompassing cities and surrounding suburban and rural areas closely linked by significant economic factors and interaction, most notably as workforce commuting sheds. For clarity and statistical purposes, these regions follow political jurisdictions, and usually extend across adjacent county boundaries. Different parts of a region vary in performance and assets, or may be on the fringe, but they share functional economic connections.
The Bakersfield MSA is coterminous with Kern County, so intuitively the vision is of one functional economic area, despite a population spread over 8,000 square miles that otherwise would encompass multiple states and metropolitan areas. Overseeing a single administrative unit, elected leaders have emphasized commonalities and potential for links between Greater Bakersfield and East Kern, in the same way that states do. Kern’s written economic development strategies consistently have focused on the County as one region, except for the East Kern diversification study in 2017 in response to U.S. Department of Defense funding focused on the military presence.
In fact, analysis shows the performance, growth drivers, industry composition, and talent base of Greater Bakersfield versus East Kern are fundamentally different, and the functional economic and workforce affinities are not significant. But for the County boundary, it is likely that these two areas could be classified as separate metros, with East Kern associating to Palmdale and Lancaster rather than Bakersfield.

25B3K Market Assessment |
Kern County’s job growth by sector and componentCumulative from 2009 to 2018*
Tradable industries represent a small portion of the county’s performance
16,079 17,724
4,930
4,301
2,421
8,917
8,730
0
5,000
10,000
15,000
20,000
25,000
30,000
35,000
Tradable sector Local-serving sector Public sector
Tota
l net
jobs
gai
ned
from
200
9 to
201
9
National macroeconomic growth National industry growth Local competitiveness
Kern County’s local-serving, traded, and public sectors all saw notable job growth from 2009 to 2019. Traded sectors –industries that produce goods or services that are primarily sold to customers outside of the County – added nearly 25,000 jobs. Its locally-serving sector, which provides goods and services for consumers and businesses within the County, added nearly 37,000 jobs. The public sector, which includes federal civilian and military employment, added 8,700 jobs.
The locally-serving and public sectors each far exceeded average national job creation during this period. Job growth in the locally-serving and government sectors netted the county close to 18,000 more jobs than expected. In fact, nationwide, the public sector shed jobs. Kern’s public sector growth was driven not by its federal civilian or military installations but by state and local government and education, primarily within the city of Bakersfield.
Traded sectors were not as competitive. The sectors that export goods and services to bring new income into Kern County accounted for notable job creation over the decade and grew slightly faster than expectations. However, they accounted for far less total growth compared to locally-serving sectors at just 2,400 net jobs, representing only 12% of the county’s performance in outpacing the national baseline.
This balance of growth and competitiveness raises concerns about the trajectory and resilience of Kern County’s economy. Although the county looks very competitive on the surface, this analysis finds that traded sectors that typically drive regional economic growth actually are only slightly competitive compared to the national base and account for an only relatively small portion of the county’s economic value.
* This chart displays the results of a dynamic shift-share analysis, which decomposes local job growth into three factors: national macroeconomic growth, national industry growth, and growth due to local competitive shifts.
Source: Brookings analysis of Economic Modeling Specialists Intl. estimates and U.S. Clusters Mapping Project cluster definitions.
26B3K Market Assessment |
-5 %
0%
5%
10%
15%
20%
25%
30%
35%
40%
45%
50%
55%
60%
65%
70%
75%
80%
-5 00
0
500
1,000
1,500
2,000
2,500
3,000
3,500
4,000
4,500
5,000
5,500
6,000
6,500
7,000
7,500
8,000
Health Service
s
Hospita
lity
Community
Org
anizatio
ns
Education
Commerci
al Servi
ces
Retailin
g of Genera
l Merch
andise
Moto
r Vehicl
es and Se
rvices
Real Es tate
Loca
l Logist
ics
Personal S
ervices
Food and Beverage Producti
on
Household Goods a
nd Serv
ices
Utilitie
s
Enterta
inment and M
edia
Financia
l Service
s
Industrial
Products
and Services
Job change, 20 09 - 2019 (left axis) Percent change in jobs, 2 009 to 2019 (right axis)
Local-serving clusters have grown much faster than the county's population
Change in jobs within Kern County’s local-serving clusters, 2009 to 2019
105%
-30%
Source: Brookings analysis of Economic Modeling Specialists Intl. estimates and U.S. Clusters Mapping Project cluster definitions.
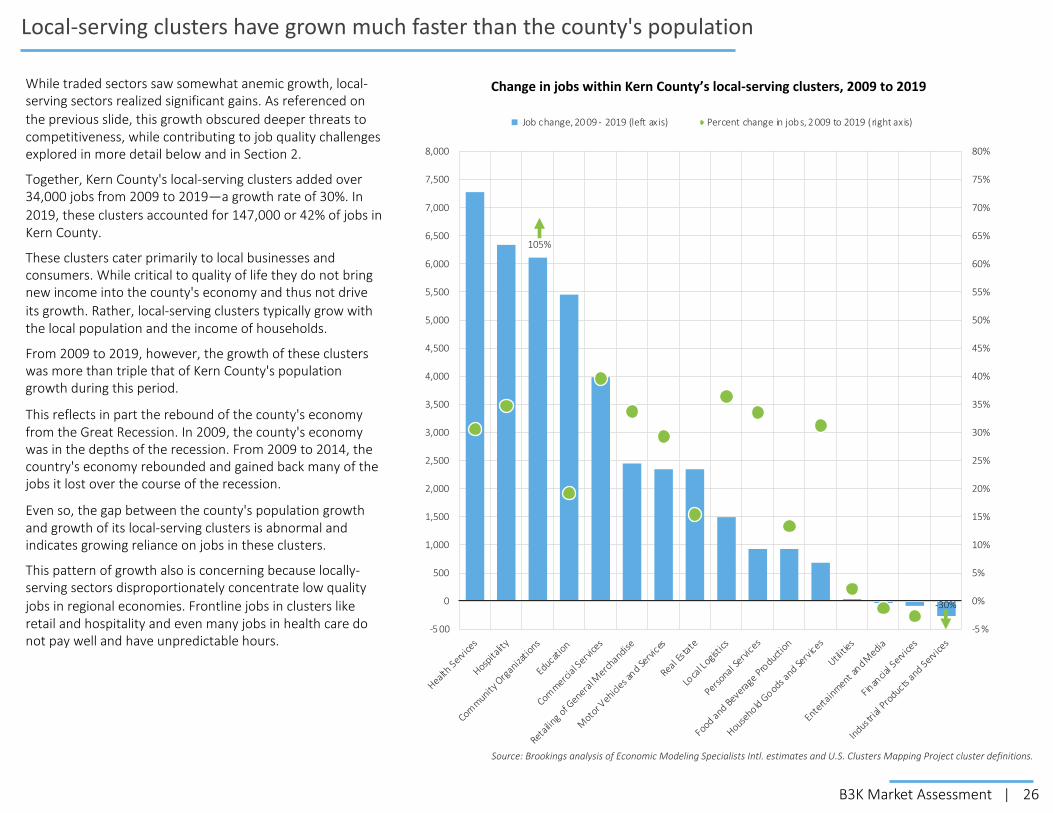
While traded sectors saw somewhat anemic growth, local-serving sectors realized significant gains. As referenced on the previous slide, this growth obscured deeper threats to competitiveness, while contributing to job quality challenges explored in more detail below and in Section 2.
Together, Kern County's local-serving clusters added over 34,000 jobs from 2009 to 2019—a growth rate of 30%. In 2019, these clusters accounted for 147,000 or 42% of jobs in Kern County.
These clusters cater primarily to local businesses and consumers. While critical to quality of life they do not bring new income into the county's economy and thus not drive its growth. Rather, local-serving clusters typically grow with the local population and the income of households.
From 2009 to 2019, however, the growth of these clusters was more than triple that of Kern County's population growth during this period.
This reflects in part the rebound of the county's economy from the Great Recession. In 2009, the county's economy was in the depths of the recession. From 2009 to 2014, the country's economy rebounded and gained back many of the jobs it lost over the course of the recession.
Even so, the gap between the county's population growth and growth of its local-serving clusters is abnormal and indicates growing reliance on jobs in these clusters.
This pattern of growth also is concerning because locally-serving sectors disproportionately concentrate low quality jobs in regional economies. Frontline jobs in clusters like retail and hospitality and even many jobs in health care do not pay well and have unpredictable hours.
27B3K Market Assessment |
Missiles and Space Vehicles
Specialty Foods and Ingredients
Engineering ServicesInsurance Carriers
Construction
Water, Sewage, and Other Systems Warehousing and Storage
Wholesale of Industrial Machinery, Equipment,
and Supplies
Wholesale of Food Products
Air Transportation
Ground Transportation Support ActivitiesTrucking
Processed Chemical Products
Waste Collection
Other Waste Management Services
Nonmetal Mining
Petroleum Processing
Support Activities for Oil and Gas
Oil and Gas Extraction
Pipeline Transportation
0.00
0.50
1.00
1.50
2.00
2.50
3.00
3.50
4.00
4.50
5.00
5.50
6.00
6.50
7.00
-1 00% -7 5% -5 0% -2 5% 0% 25% 50% 75% 100% 125% 150%
Coun
ty lo
catio
n qu
otie
nt in
201
9
Competitive shift in percentage points, from 2009 to 2019
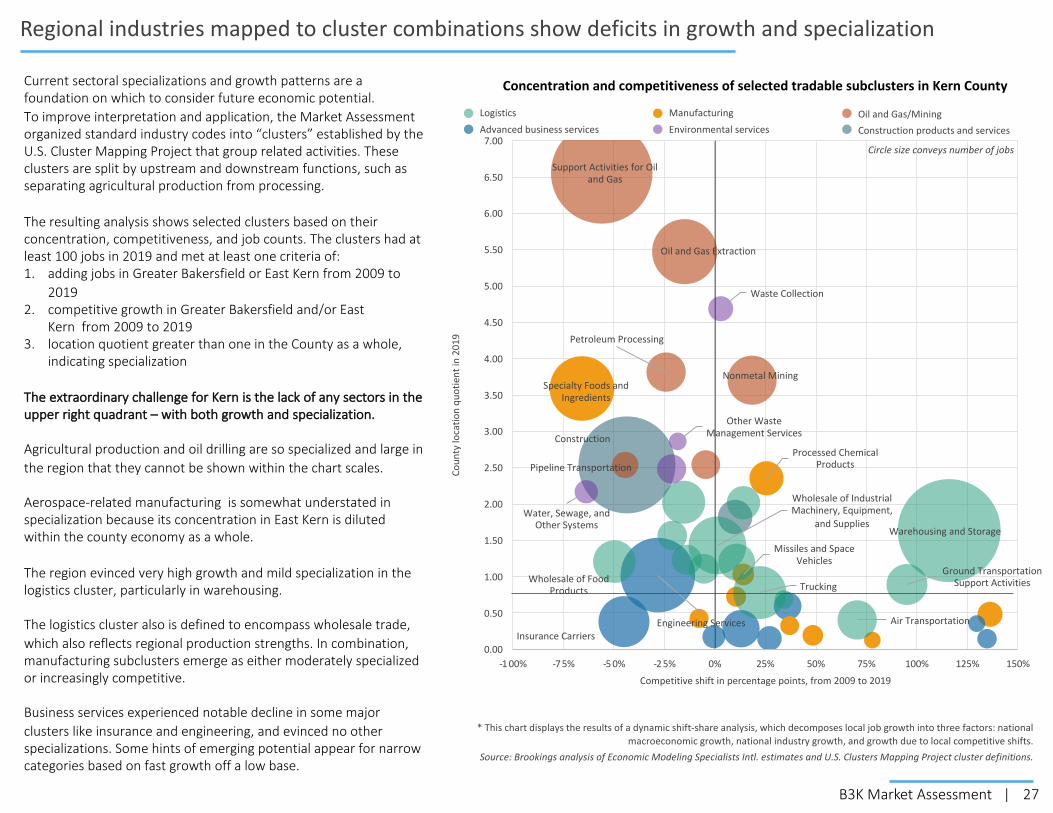
Current sectoral specializations and growth patterns are a foundation on which to consider future economic potential.To improve interpretation and application, the Market Assessment organized standard industry codes into “clusters” established by the U.S. Cluster Mapping Project that group related activities. These clusters are split by upstream and downstream functions, such as separating agricultural production from processing.
The resulting analysis shows selected clusters based on their concentration, competitiveness, and job counts. The clusters had at least 100 jobs in 2019 and met at least one criteria of:1. adding jobs in Greater Bakersfield or East Kern from 2009 to
20192. competitive growth in Greater Bakersfield and/or East
Kern from 2009 to 20193. location quotient greater than one in the County as a whole,
indicating specialization
The extraordinary challenge for Kern is the lack of any sectors in the upper right quadrant – with both growth and specialization.
Agricultural production and oil drilling are so specialized and large in the region that they cannot be shown within the chart scales.
Aerospace-related manufacturing is somewhat understated in specialization because its concentration in East Kern is diluted within the county economy as a whole.
The region evinced very high growth and mild specialization in the logistics cluster, particularly in warehousing.
The logistics cluster also is defined to encompass wholesale trade, which also reflects regional production strengths. In combination, manufacturing subclusters emerge as either moderately specialized or increasingly competitive.
Business services experienced notable decline in some major clusters like insurance and engineering, and evinced no other specializations. Some hints of emerging potential appear for narrow categories based on fast growth off a low base.
Concentration and competitiveness of selected tradable subclusters in Kern County
Regional industries mapped to cluster combinations show deficits in growth and specialization
* This chart displays the results of a dynamic shift-share analysis, which decomposes local job growth into three factors: national macroeconomic growth, national industry growth, and growth due to local competitive shifts.
Source: Brookings analysis of Economic Modeling Specialists Intl. estimates and U.S. Clusters Mapping Project cluster definitions.
LogisticsAdvanced business services
ManufacturingEnvironmental services
Oil and Gas/MiningConstruction products and services
Circle size conveys number of jobs
28B3K Market Assessment |
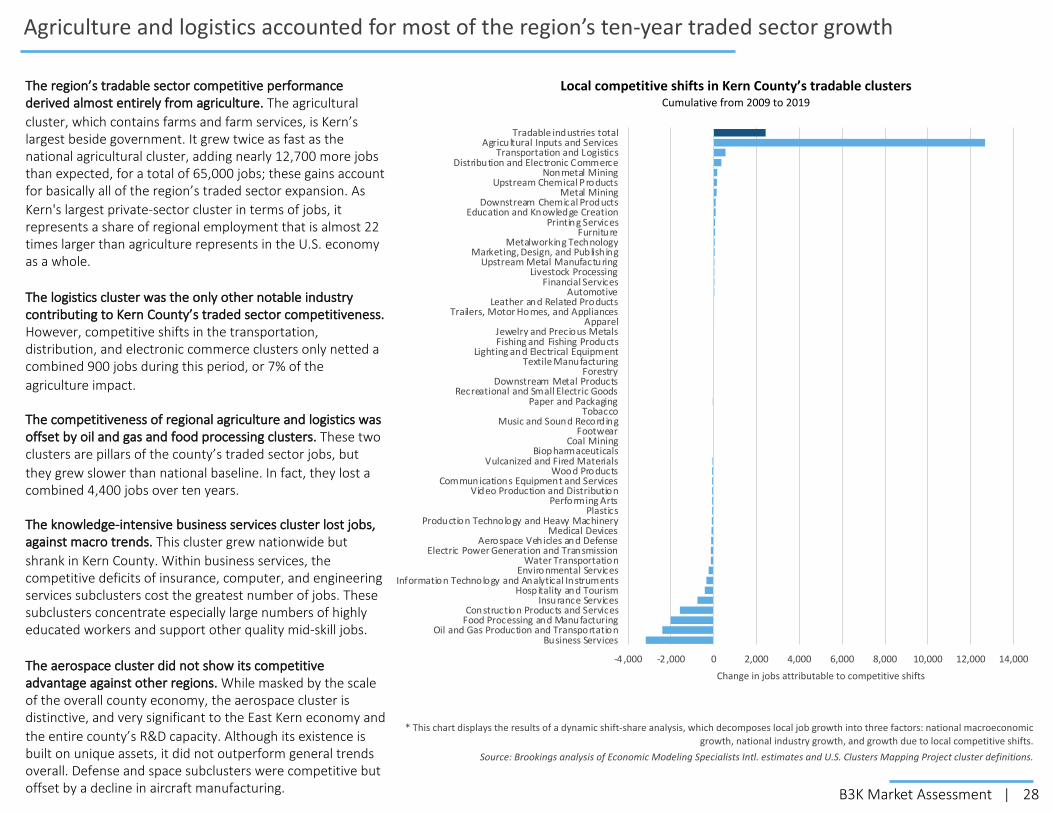
Local competitive shifts in Kern County’s tradable clustersCumulative from 2009 to 2019
Agriculture and logistics accounted for most of the region’s ten-year traded sector growth
-4 ,000 -2 ,000 0 2,000 4,000 6,000 8,000 10,000 12,000 14,000
Business ServicesOil and Gas Production and Transportation
Food Processing and ManufacturingConstruction Products and Services
Insurance ServicesHospitality and Tourism
Information Technology and Analytical InstrumentsEnvironmental Services
Water TransportationElectric Power Generation and Transmission
Aerospace Vehicles and DefenseMedical Devices
Production Technology and Heavy MachineryPlastics
Performing ArtsVideo Production and Distribution
Communications Equipment and ServicesWood Products
Vulcanized and Fired MaterialsBiopharmaceuticals
Coal MiningFootwear
Music and Sound RecordingTobacco
Paper and PackagingRecreational and Small Electric Goods
Downstream Metal ProductsForestry
Textile ManufacturingLighting and Electrical Equipment
Fishing and Fishing ProductsJewelry and Precious Metals
ApparelTrailers, Motor Homes, and Appliances
Leather and Related ProductsAutomotive
Financial ServicesLivestock Processing
Upstream Metal ManufacturingMarketing, Design, and Publish ing
Metalworking TechnologyFurniture
Printing ServicesEducation and Knowledge Creation
Downstream Chemical ProductsMetal Mining
Upstream Chemical ProductsNonmetal Mining
Distribution and Electronic CommerceTransportation and Logistics
Agricultural Inputs and ServicesTradable industries total
Change in jobs attributable to competitive shifts
The region’s tradable sector competitive performance derived almost entirely from agriculture. The agricultural cluster, which contains farms and farm services, is Kern’s largest beside government. It grew twice as fast as the national agricultural cluster, adding nearly 12,700 more jobs than expected, for a total of 65,000 jobs; these gains account for basically all of the region’s traded sector expansion. As Kern's largest private-sector cluster in terms of jobs, it represents a share of regional employment that is almost 22 times larger than agriculture represents in the U.S. economy as a whole.
The logistics cluster was the only other notable industry contributing to Kern County’s traded sector competitiveness. However, competitive shifts in the transportation, distribution, and electronic commerce clusters only netted a combined 900 jobs during this period, or 7% of the agriculture impact.
The competitiveness of regional agriculture and logistics was offset by oil and gas and food processing clusters. These two clusters are pillars of the county’s traded sector jobs, but they grew slower than national baseline. In fact, they lost a combined 4,400 jobs over ten years.
The knowledge-intensive business services cluster lost jobs, against macro trends. This cluster grew nationwide but shrank in Kern County. Within business services, the competitive deficits of insurance, computer, and engineering services subclusters cost the greatest number of jobs. These subclusters concentrate especially large numbers of highly educated workers and support other quality mid-skill jobs.
The aerospace cluster did not show its competitive advantage against other regions. While masked by the scale of the overall county economy, the aerospace cluster is distinctive, and very significant to the East Kern economy and the entire county’s R&D capacity. Although its existence is built on unique assets, it did not outperform general trends overall. Defense and space subclusters were competitive but offset by a decline in aircraft manufacturing.
* This chart displays the results of a dynamic shift-share analysis, which decomposes local job growth into three factors: national macroeconomic growth, national industry growth, and growth due to local competitive shifts.
Source: Brookings analysis of Economic Modeling Specialists Intl. estimates and U.S. Clusters Mapping Project cluster definitions.

29B3K Market Assessment |
These performance reviews suggest that significant parts of Kern County’s economy reached an inflection point in the middle of the last decade. Underneath the positive growth picture, the region’s faster-than-average job creation was dependent largely on a massive expansion of its agricultural sector in the aftermath of the Great Recession, the more recent emergence of a logistics cluster expanding from southern California, and rapid increases in state / local government and education employment.
Meanwhile, oil and gas and food manufacturing have become less competitive or stagnant. The decline of these clusters is particularly troubling because they account for so much new regional income from the sales outside the county, as well as employment; oil and gas in particular generates an extraordinary number of quality jobs accessible to low-skill and mid-skill workers.
Changing global economic conditions, external competition, consumer preferences, and regulatory policies, will further test Kern County’s economy. Combined, these external forces will continue to challenge many of the industries and clusters on which the Kern economy has traditionally relied and may accelerate their decline. The effects of environmental policies, water management, and general business climate raise resiliency and adaptation issues for the oil and gas and agricultural sectors. Aerospace in East Kern faces new intrastate and national competitors for operations.
Kern County needs new growth engines. The county can seek to leverage the strengths and momentum it has in legacy clusters to shore up competitiveness where possible. However, it also needs to pursue moving those sectors up the value chain; expanding into adjacent industries; and promoting emerging clusters that are the future of the U.S. economy, reflecting more innovative and value-added activities.
Kern County’s job growth in major employment clusters (excluding aerospace), 2009-2018
The region’s largest tradable clusters confront serious market headwinds
Source: Brookings analysis of Economic Modeling Specialists Intl. estimates and U.S. Clusters Mapping Project cluster definitions.
-2 0%
-1 0%
0%
10%
20%
30%
40%
50%
60%
70%
80%
90%
2009 2010 2011 2012 2013 2014 2015 2016 2017 2018 2019
Cum
ulat
ive
chan
ge in
jobs
sinc
e 20
09
Oil and Gas Production and Transportation Food Processing and ManufacturingAgricultural Inputs and Services Construction Products and ServicesTransportation, Logistics, and Distribution
30B3K Market Assessment |
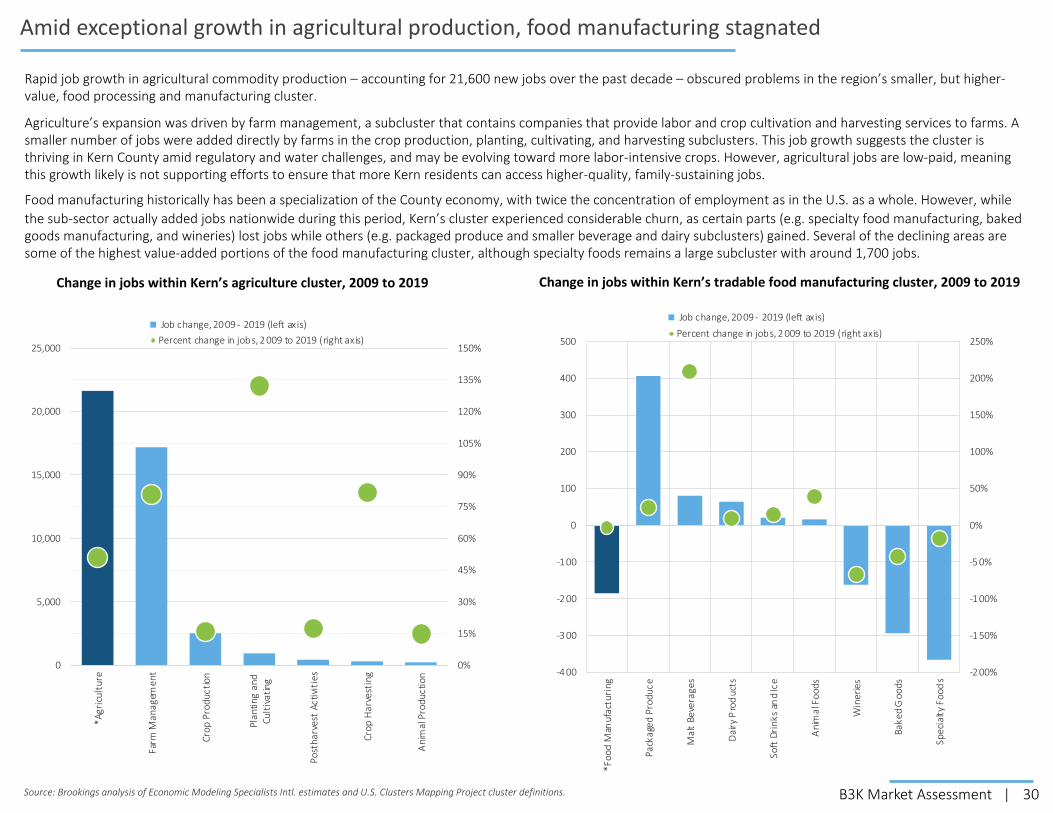
Amid exceptional growth in agricultural production, food manufacturing stagnated
0%
15%
30%
45%
60%
75%
90%
105%
120%
135%
150%
0
5,000
10,000
15,000
20,000
25,000
*Agr
icul
ture
Farm
Man
agem
ent
Crop
Pro
duct
ion
Plan
ting
and
Cult
ivat
ing
Post
harv
est
Activ
itie
s
Crop
Har
vest
ing
Ani
mal
Pro
duct
ion
Job change, 20 09 - 2019 (left axis)Percent change in jobs, 2 009 to 2019 (right axis)
Source: Brookings analysis of Economic Modeling Specialists Intl. estimates and U.S. Clusters Mapping Project cluster definitions.
Change in jobs within Kern’s agriculture cluster, 2009 to 2019
-2 00%
-1 50%
-1 00%
-5 0%
0%
50%
100%
150%
200%
250%
-4 00
-3 00
-2 00
-1 00
0
100
200
300
400
500
*Foo
d M
anuf
actu
ring
Pack
aged
Pro
duce
Mal
t Be
vera
ges
Dai
ry P
rod
ucts
Soft
Dri
nks
and
Ice
Ani
mal
Foo
ds
Win
erie
s
Bake
d G
oods
Spec
ialty
Foo
ds
Job change, 20 09 - 2019 (left axis)
Percent change in jobs, 2 009 to 2019 (right axis)
Change in jobs within Kern’s tradable food manufacturing cluster, 2009 to 2019
Rapid job growth in agricultural commodity production – accounting for 21,600 new jobs over the past decade – obscured problems in the region’s smaller, but higher-value, food processing and manufacturing cluster.
Agriculture’s expansion was driven by farm management, a subcluster that contains companies that provide labor and crop cultivation and harvesting services to farms. A smaller number of jobs were added directly by farms in the crop production, planting, cultivating, and harvesting subclusters. This job growth suggests the cluster is thriving in Kern County amid regulatory and water challenges, and may be evolving toward more labor-intensive crops. However, agricultural jobs are low-paid, meaning this growth likely is not supporting efforts to ensure that more Kern residents can access higher-quality, family-sustaining jobs.
Food manufacturing historically has been a specialization of the County economy, with twice the concentration of employment as in the U.S. as a whole. However, while the sub-sector actually added jobs nationwide during this period, Kern’s cluster experienced considerable churn, as certain parts (e.g. specialty food manufacturing, baked goods manufacturing, and wineries) lost jobs while others (e.g. packaged produce and smaller beverage and dairy subclusters) gained. Several of the declining areas are some of the highest value-added portions of the food manufacturing cluster, although specialty foods remains a large subcluster with around 1,700 jobs.

31B3K Market Assessment |
Options for higher-value agricultural activity and better jobs are limited
Despite the outsized performance of the agricultural production sector, pressure from state groundwater management constraints, potential for automation, and low job quality force a strategic question: whether this agriculture base can be leveraged into other more enduring aspects of the value chain with better quality jobs.
Unfortunately, the region’s underdeveloped innovation assets (see Section 3) vis-à-vis competing, first-mover regions complicate ambitions to evolve into either new agri-food tech products or services to be used locally and exported (e.g. plant or animal sciences, robotics, precision agriculture, supply chain control) or water management innovations.
Notwithstanding high impact research concentrations in basic agricultural disciplines like entomology, horticulture, veterinary services, and agronomy, Kern does not have novel convergence or any comparative advantage to other established specialized agricultural hubs.
Meanwhile, despite expertise in pumps, an evaluation of the business base; innovation map and physical assets; and competing water tech, management, and policy centers did not uncover a strong foundation for a water management niche.
The alternative is finding more areas within “value-added agriculture” that differentiate from commodity production, which could range from growing organic to making carrots into hot dogs, rice, and pasta.
Only reinforcing and expanding food manufacturing, reversing current trends, offers some opportunity within this category. While slightly below-average in job quality against other sectors, food manufacturing generates better quality jobs than agricultural production, as well as higher multiplier effects of between 2.5 and 5.0 for indirect and induced jobs. Skills adjacency between the sub-sectors is strong. Therefore, food manufacturing provides good jobs across skill levels and can upgrade overall job quality.
Agricultural Production Food Manufactur ing
Good and promising jobs in agricultural production vs food manufacturing
High-skill good jobs Mid-skill good jobs
Low-skill good jobs High-skill promising jobs
Mid-skill promising jobs Low-skill promising jobs
0%
10%
20%
30%
40%
50%
60%
70%
80%
90%
100%
Agricultural Production Food Manufactur ing
Overall job quality in agricultural production and food manufacturing
All good jobs All promising jobs All other jobs
Food manufacturing offers higher job quality than agricultural production
*Source: Brookings Opportunity Industries analysis. This methodology is introduced and presented in more detail in Section 2. Information on economic multipliers from Economic Policy Institute, Updated employment multipliers for the U.S. economy, 2019.

32B3K Market Assessment |
Though less present than in comparable California agricultural regions, food manufacturing has potential
0
20
40
60
80
100
120
140
160
0
2,000
4,000
6,000
8,000
10,000
12,000
14,000
Fresno, CA Modesto, CA Merced, CA Bakersfield,CA
Stockton, CA Sal inas, CA
Total food manufacturing jobs and payrolled business locations, 2019
total jobs, 2019 payrolled business locations, 2019
0
20
40
60
80
100
120
140
160
Fresno, CA Modesto, CA Merced, CA Bakersfield,CA
Stockton, CA Sal inas, CA
Food manufacturing jobs per 1000 workers, 2019
The scale of Kern’s food manufacturing jobs and firms is notably behind comparable California agricultural production regions in terms of absolute numbers and intensity. Despite leading the San Joaquin Valley in growing commodities, it lags other regions in converting those into value-added food products. Still, the region has a location quotient of 1.76 and is base to some large, nationally-recognizable firms.
One factor for the location of food production activities depends on value-to-weight and perishability. Those that are low in both categories typically are regionalized in multiple locations (e.g. soft drink bottling), while those that are high may be manufactured more centrally in fewer places.
With the region’s other locational elements and talent base, this suggests untapped potential for spurring more food manufacturing activity as a straightforward economic development opportunity that meets job quality and access objectives. It also relates to other manufacturing strengths for the region.
Opportunity for food innovation and R&D appears more limited. A few local firms also have internal research and development capabilities to make entirely new products, with their own food scientists, research chefs, and process engineers. Additionally, the innovation ecosystem mapping (slide 81) uncovered a node of food science technology expertise, but it is too small to rank anywhere on the impact index.
However, no strong evidence emerged from the Market Assessment analysis that the region has existing assets to be positioned more broadly as a hub of food manufacturing product or process innovations that could spin off significant new commercial opportunities, whether in products or services. Large food and beverage companies tend to centralize their own research and development at headquarters, whether in products, production, or packaging. Without that presence to build on, the basics of universities with strong research and development in food processing innovation, or even a public test kitchen, it is difficult to spur dynamic new firms within the market.
Therefore, the most accessible opportunity is simply looking to expand existing or attract other food manufacturing activities.
Source: Analysis of Economic Modeling Specialists Inc., 2020

33B3K Market Assessment |
Within food manufacturing, occupational growth narrows potential focus
0
200
400
600
800
1,000
1,200
1,400
Bakersfield, CA Fresno, CA Merced, CA Modesto, CA Stockton, CA Sal inas, CA
Total job counts for top food manufacturing occupations in comparable California agricultural production regions, 2019
Food Batchmakers
Packaging and Fil ling Machine Operators and Tenders
Packers and Packagers, Hand
Laborers and Freight, Stock, and Material Movers, Hand
Industrial Truck and Tractor Operators
Within food manufacturing, the largest occupational categories are packaging and hand laborers, offering a variable mix of job quality.
The interesting dynamic for the Kern region is the disproportionate prevalence of food batchmakers, with slightly higher job quality and value.
Additionally, regional growth in this category has been dramatic over the past decade.
This reinforces the potential to target specialty food manufacturing in plant-based protein and beverage alternatives, confectionary, snack foods, and traditional activities.
However, without adding innovation assets, the primary appeal is specifically targeting southern California companies to place their production activities in Kern for regional distribution.
550%
(100%)
(50%)
0%
50%
100%
150%
200%
250%
Food Batchmakers Packaging and Fil lingMachine Operators
and Tenders
Packers andPackagers, Hand
Laborers andFreight, Stock, andMaterial Movers,
Hand
Industrial Truck andTractor Operators
Change in top food manufacturing occupations in comparable California agriculture production regions, 2009-2019
Bakersfield, CA Fresno, CA Merced, CA Modesto, CA Stockton, CA Sal inas, CA
Source: Analysis of Economic Modeling Specialists Inc., 2020

34B3K Market Assessment |
-8 0%
-6 0%
-4 0%
-2 0%
0%
20%
40%
60%
80%
100%
120%
-8 00
-6 00
-4 00
-2 00
0
200
400
600
800
1,000
1,200
*Oil
and
Gas
Dril
ling
Wel
ls
Pipe
line
Tran
spor
tatio
n
Oil
and
Gas
Mac
hine
ry
Petr
ole
um P
roce
ssin
g
Oil
and
Gas
Ext
ract
ion
Supp
ort A
ctiv
itie
s
Job change, 20 09 - 2019 (left axis) Percent change in jobs, 2 009 to 2019 (right axis)
Kern's oil and gas industry is confronting significant market and regulatory pressures
Change in jobs within Kern County’s tradable oil and gas cluster, 2009 to 2019
Source: Brookings analysis of Economic Modeling Specialists Intl. estimates and U.S. Clusters Mapping Project cluster definitions.
Oil and gas has been a primary driver of Kern County's economy, representing six times the concentration of employment compared to the U.S. as a whole, providing good jobs and economic mobility to many workers with very low educational attainment.
However, changing market conditions and State regulations aiming to meet ambitious climate change targets have severely impacted the industry and challenge its future growth in the region.
Since the market-driven collapse in oil prices in 2015, the cluster has shed a considerable number of jobs. The cluster's job counts are down 10% compared to 2009, but down closer to 33% compared to 2014. The rate of cluster job losses in Kern notably exceeds that of the U.S. baseline.
These declines have hit every sub-sector of the cluster except drilling wells, which may represent a short-term push in anticipation of anticipating policy and market shifts. Most troublingly, support activities for oil and gas – which contains many of the region's uniquely-talented, highly-educated engineers and executives –declined the most in absolute terms.
The decline of the oil and gas industry represents a significant shock to both Kern's economy and its identity. In addition to generating wealth, tax revenue, good jobs, and global connections, the industry has been a source of regional pride and international recognition.
Business leaders describe the last 15 years of State regulatory actions as fueling an either-or perspective between environmental goals and economic impact, resulting in postures centered on preservation versus elimination rather than finding ways to achieve both outcomes.
Even in the renewable fuels and carbon management sector, business leaders note a “stigma” around the industry that impedes collaboration to achieve environmental objectives while also grappling with economic development reality.
Moving beyond this frame will require new cooperation and partnership between the region and the State to encourage investments and policy certainty -- building off existing energy assets and expertise in ways that grow related value-add businesses and enduring, accessible jobs.

35B3K Market Assessment |
Existing energy capabilities provide a foundation for new sub-sectors, innovation, quality growth
-2 50%
-2 00%
-1 50%
-1 00%
-5 0%
0%
50%
100%
-2 50
-2 00
-1 50
-1 00
-5 0
0
50
100
Electric generation Solar Power Wind Power Fossil Fuel Power
Job change, 20 09 - 2019 (left axis) Percent change in jobs, 2 009 to 2019 (right axis)
Change in jobs within Kern County’s tradable energy generation cluster, 2009 to 2019
1064%
Source: Brookings analysis of Economic Modeling Specialists Intl. estimates and U.S. Clusters Mapping Project cluster definitions.
Challenges in the oil and gas cluster do not necessarily spell the end of the region's distinctive foothold in energy based on its DNA.
Recent opportunities for Kern County centered on expansion of renewable energy production with wind and solar energy installations in East Kern, such as the Tehachapi Storage Project, Alta Wind Energy Center, and BHE Renewables's Solar Star Project. While these major facilities have generated construction jobs and visibility for the region, renewable energy generation has not been a large source of longer-term, durable job creation. Solar energy production added net 60 jobs off a small existing base, and wind power actually shed jobs in recent years. This sub-sector is no replacement for the scale of oil and gas production.
Other opportunities, more directly leveraging the region's legacy oil and gas strengths, may offer greater opportunities for growth.
First, the region has experienced notable expansion of and external investment in renewable biofuels production and innovation, such as firms repurposing existing refineries for biodiesel to supply the State and primes (e.g. Global Clean Energy Holding, Kern Oil and Refining). These firms are developing and testing new production technologies and processes. Fostering further renewable fuels production and industry-leading commercialization of technologies and processes for export could be a distinctive niche, spurred by State policy and market demand.
Second, other renewable fuels and energy production, including hydrogen and agricultural or woody biomass can be further adjacent industries that fit Kern’s energy foundations, alongside supportive research, practice, and policy interests of the state.
Third, carbon capture and storage (CCS) development represents a globally-significant opportunity for which the region is uniquely positioned – proving and scaling the function, and innovating products, processes, and services for export. Talent and industry adjacency analyses affirm that CCS matches the region’s capabilities. Both multinational and regional energy companies present in Kern are investing enormous effort in this area. Efforts like CRC seeking to demonstrate the CCS technology at Elk Hills Field could be the basis for a cluster initiative versus a stand-alone project. No other location in California, or nationally, fully occupies this space.
Even Kern County's comparatively low innovation capacity (see Section 3) shows strength and convergence in related geological and engineering disciplines, as well as China Lake biofuels research. Still substantial investments in research and development capacities will be required for these possibilities to succeed. Nascent work by CSU Bakersfield in establishing an Energy Research Center and Bakersfield College connecting the National Renewable Energy Laboratory to the region are examples of required assets, but need to be integrated and augmented.
In addition to potential investments, State policy support that enables greater industry certainty and navigates complex, fragmented regulatory authorities are likely also required to enable proof of concept and scale.
These options require additional examination and market-testing and are not a guarantee to replace oil and gas at its scale of employment and revenue. Nonetheless, they reflect potentially significant opportunities to evolve and repurpose Kern's legacy strengths.
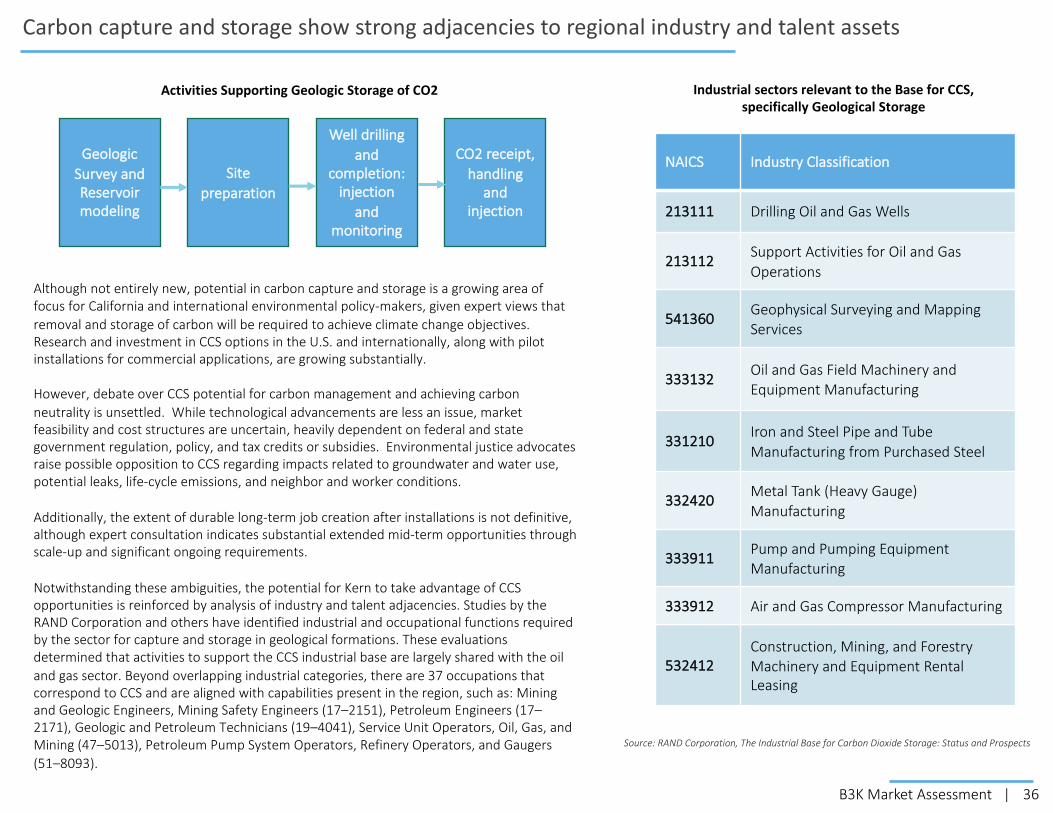
36B3K Market Assessment |
Carbon capture and storage show strong adjacencies to regional industry and talent assets
NAICS Industry Classification
213111 Drilling Oil and Gas Wells
213112 Support Activities for Oil and Gas Operations
541360 Geophysical Surveying and Mapping Services
333132 Oil and Gas Field Machinery and Equipment Manufacturing
331210 Iron and Steel Pipe and Tube Manufacturing from Purchased Steel
332420 Metal Tank (Heavy Gauge) Manufacturing
333911 Pump and Pumping Equipment Manufacturing
333912 Air and Gas Compressor Manufacturing
532412Construction, Mining, and Forestry Machinery and Equipment Rental Leasing
Source: RAND Corporation, The Industrial Base for Carbon Dioxide Storage: Status and Prospects
Geologic Survey and Reservoir modeling
Site preparation
Well drilling and
completion: injection
and monitoring
CO2 receipt, handling
and injection
Activities Supporting Geologic Storage of CO2 Industrial sectors relevant to the Base for CCS, specifically Geological Storage
Although not entirely new, potential in carbon capture and storage is a growing area of focus for California and international environmental policy-makers, given expert views that removal and storage of carbon will be required to achieve climate change objectives. Research and investment in CCS options in the U.S. and internationally, along with pilot installations for commercial applications, are growing substantially.
However, debate over CCS potential for carbon management and achieving carbon neutrality is unsettled. While technological advancements are less an issue, market feasibility and cost structures are uncertain, heavily dependent on federal and state government regulation, policy, and tax credits or subsidies. Environmental justice advocates raise possible opposition to CCS regarding impacts related to groundwater and water use, potential leaks, life-cycle emissions, and neighbor and worker conditions.
Additionally, the extent of durable long-term job creation after installations is not definitive, although expert consultation indicates substantial extended mid-term opportunities through scale-up and significant ongoing requirements.
Notwithstanding these ambiguities, the potential for Kern to take advantage of CCS opportunities is reinforced by analysis of industry and talent adjacencies. Studies by the RAND Corporation and others have identified industrial and occupational functions required by the sector for capture and storage in geological formations. These evaluations determined that activities to support the CCS industrial base are largely shared with the oil and gas sector. Beyond overlapping industrial categories, there are 37 occupations that correspond to CCS and are aligned with capabilities present in the region, such as: Mining and Geologic Engineers, Mining Safety Engineers (17–2151), Petroleum Engineers (17–2171), Geologic and Petroleum Technicians (19–4041), Service Unit Operators, Oil, Gas, and Mining (47–5013), Petroleum Pump System Operators, Refinery Operators, and Gaugers (51–8093).

37B3K Market Assessment |
Kern County’s aerospace cluster requires strategic action to maintain and leverage competitiveness
-5 0%
-4 0%
-3 0%
-2 0%
-1 0%
0%
10%
20%
30%
40%
50%
-3 50
-3 00
-2 50
-2 00
-1 50
-1 00
-5 0
0
50
100
150
200
250
300
350
*Aerospace Vehicles andDefense
Search and NavigationEquipment
Aircraft Missiles and SpaceVehicles
Job change, 20 09 - 2019 (left axis) Percent change in jobs, 2 009 to 2019 (right axis)
Change in jobs within Kern County’s tradable aerospace manufacturing cluster, 2009 to 2019
480%
Source: Brookings analysis of Economic Modeling Specialists Intl. estimates and U.S. Clusters Mapping Project cluster definitions.
Home to Mojave Air and Space Port, Edwards Air Force Base, and China Lake Naval Air Weapons Station, East Kern County contains some of the world's leading public and private aerospace and defense assets. Yet this alone is not enough to ensure the success of the region's aerospace cluster amid serious global competition.
Aerospace manufacturing generally has seen uneven growth in recent years. The U.S. airplane and aircraft parts industry has struggled as supply chains have globalized and the industry became increasingly reliant on non-metal materials.
In Kern, traditional aircraft manufacturing has declined, but the aerospace cluster as a whole was buoyed by more niche and higher value-added subclusters related to high-altitude navigation technologies, defense, and space vehicles. In some cases, Kern’s aircraft job losses were attributable to relocation across the county line to Palmdale / Lancaster, effectively part of the same cluster and functional economic area, but just moving jobs around rather than creating them.
At the same time, East Kern faces increasing competition from existing and emerging aerospace hubs in states like Colorado, Florida, New Mexico, and Texas, some of which have succeeded in attracting jobs away from the region. Several of these states have dedicated, written space strategies to support cluster development, including incentives, alongside more favorable policy environments. The establishment of the Central Coast's REACH strategy and partnership with the state to enhance aerospace activity at Vandenburg AFB speaks to growing competition even within California.
Meanwhile, East Kern faces other challenges for sector retention and expansion. Federal research centers face massive retirements in the next five years. For small and large companies, talent access is inhibited by the absence of a four-year university in the immediate area and other coordinated training at scale. Lack of placemaking amenities make it difficult to attract and keep workers.
Mechanisms to enhance access to and commercialization of sophisticated innovation assets at the region’s federal installations have lagged peer regions, evidenced by low SBIR/STTR awards (see Section 3) and indicating unrealized growth opportunities. Specific policy constraints also have constrained expansion at Mojave Air and Space Port, despite industry demand.
The region has not established a cluster initiative to support aerospace and address these issues at scale in a strategic, sustained, and collaborative manner, including the broader Antelope Valley, notwithstanding emergence of subregional interest groups. This gap leaves economic development interests and activities fragmented and inefficient, and businesses on their own to navigate common challenges. Additionally, some firms expressed frustration with responsiveness of regional and state actors to basic services. Closing these gaps will be imperative to maximizing use of limited resources and ensuring the cluster's continued competitiveness.
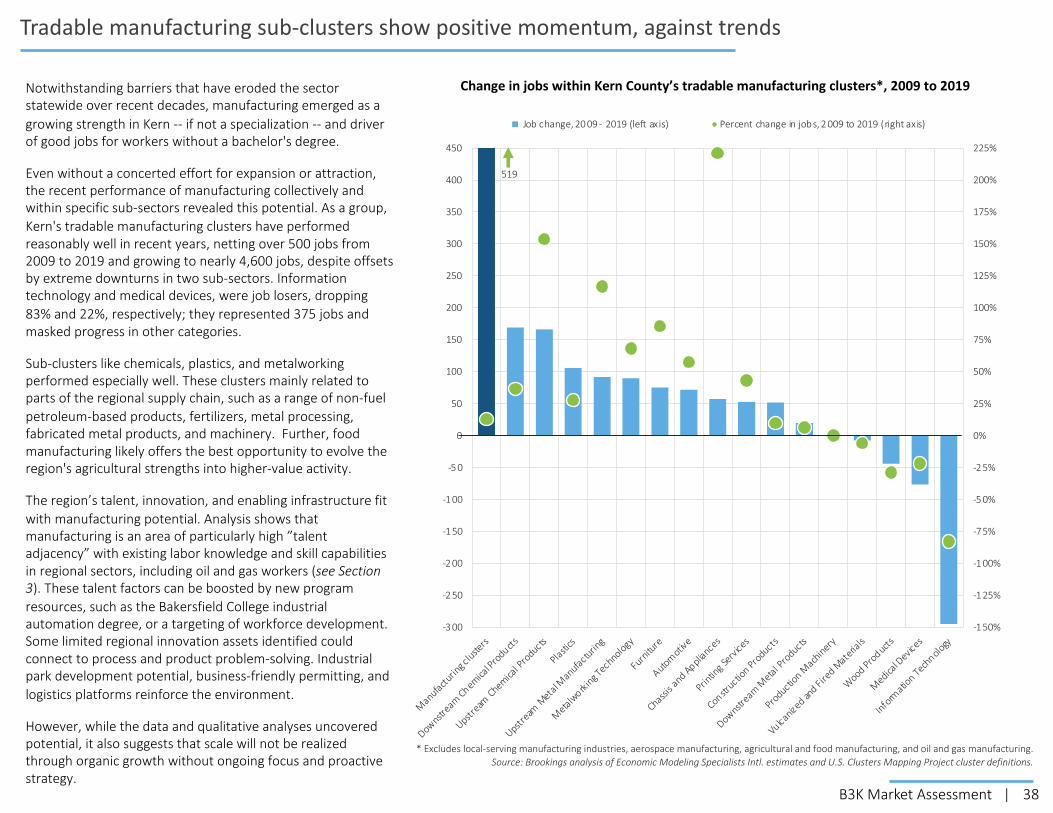
38B3K Market Assessment |
-1 50%
-1 25%
-1 00%
-7 5%
-5 0%
-2 5%
0%
25%
50%
75%
100%
125%
150%
175%
200%
225%
-3 00
-2 50
-2 00
-1 50
-1 00
-5 0
0
50
100
150
200
250
300
350
400
450
Manufactu
ring cluste
rs
Downstream Chemica
l Pro
ducts
Upstream
Chemical P
roducts
Plastics
Upstream
Meta
l Manufacturin
g
Metalw
orking Technology
Furnitu
re
Automotiv
e
Chassis a
nd Appliances
Printin
g Serv
ices
Constructio
n Products
Downstream M
etal Pro
ducts
Productio
n Mach
inery
Vulcanized and Fire
d Mate
rials
Wood Pro
ducts
Medica
l Devices
Inform
ation Tech
nology
Job change, 20 09 - 2019 (left axis) Percent change in jobs, 2 009 to 2019 (right axis)
Tradable manufacturing sub-clusters show positive momentum, against trends
* Excludes local-serving manufacturing industries, aerospace manufacturing, agricultural and food manufacturing, and oil and gas manufacturing.Source: Brookings analysis of Economic Modeling Specialists Intl. estimates and U.S. Clusters Mapping Project cluster definitions.
Change in jobs within Kern County’s tradable manufacturing clusters*, 2009 to 2019
519
Notwithstanding barriers that have eroded the sector statewide over recent decades, manufacturing emerged as a growing strength in Kern -- if not a specialization -- and driver of good jobs for workers without a bachelor's degree.
Even without a concerted effort for expansion or attraction, the recent performance of manufacturing collectively and within specific sub-sectors revealed this potential. As a group, Kern's tradable manufacturing clusters have performed reasonably well in recent years, netting over 500 jobs from 2009 to 2019 and growing to nearly 4,600 jobs, despite offsets by extreme downturns in two sub-sectors. Information technology and medical devices, were job losers, dropping 83% and 22%, respectively; they represented 375 jobs and masked progress in other categories.
Sub-clusters like chemicals, plastics, and metalworking performed especially well. These clusters mainly related to parts of the regional supply chain, such as a range of non-fuel petroleum-based products, fertilizers, metal processing, fabricated metal products, and machinery. Further, food manufacturing likely offers the best opportunity to evolve the region's agricultural strengths into higher-value activity.
The region’s talent, innovation, and enabling infrastructure fit with manufacturing potential. Analysis shows that manufacturing is an area of particularly high ”talent adjacency” with existing labor knowledge and skill capabilities in regional sectors, including oil and gas workers (see Section 3). These talent factors can be boosted by new program resources, such as the Bakersfield College industrial automation degree, or a targeting of workforce development. Some limited regional innovation assets identified could connect to process and product problem-solving. Industrial park development potential, business-friendly permitting, and logistics platforms reinforce the environment.
However, while the data and qualitative analyses uncovered potential, it also suggests that scale will not be realized through organic growth without ongoing focus and proactive strategy.

39B3K Market Assessment |
Logistics grew dramatically, focused on warehousing, storage, and fulfillment
-2 5%
0%
25%
50%
75%
100%
125%
150%
175%
200%
225%
250%
-5 00
0
500
1,000
1,500
2,000
2,500
3,000
3,500
4,000
4,500
5,000
Tradab
le logis tic
s
Ware
housing an
d Storag
e
General F
reight T
rucking
Logis
tics S
upport Acti
vities
Air Transp
o. Support
Activitie
s
Specialize
d Freight T
rucki
ng
Rail Tra
spo. S
upport Acti
vities
Freight Tra
nsporta
tion A
rrangement
Rail Tra
nsporta
tion
Road Transp
o. Support
Activit
ies
Job change, 20 09 - 2019 (left axis) Percent change in jobs, 2 009 to 2019 (right axis)
Change in jobs within Kern County’s logistics sector, 2009 to 2019
1390%
-52%
Source: Brookings analysis of Economic Modeling Specialists Intl. estimates and U.S. Clusters Mapping Project cluster definitions.
Logistics has been a major focus of Kern's economic development efforts in recent years, resulting in a wave of ribbon-cuttings at major new warehouse facilities for companies like Amazon and L'Oreal.
This expansion has leveraged Kern County's physical location proximate to southern California and other major markets, accessibility of land and active developers, good enabling infrastructure, and efficient regulatory processes.
Between 2009 and 2019, Kern County's tradable logistics cluster added 4,500 jobs, growing to over 12,000 total. Two-thirds of this job growth came from the warehousing and storage subcluster, which contains e-commerce activities. The subcluster tripled in size during this period.
However, most of the warehousing and storage subcluster employs a majority of low-paid workers, alongside a few very highly-skilled and highly-paid managers and executives. When averaged, these two extremes make the cluster look reasonably well paid, while job quality actually is low for most workers. As explored in more detail on the next slide, the current mix of primary sector growth in Kern does not appear poised to deliver jobs that enable worker self-sufficiency and economic mobility at scale.
In contrast, the elements of the tradable logistics cluster that deal with goods movement often contain higher-quality jobs. This includes subclusters for trucking, logistics support, air transportation, and rail transportation. However, most of these subclusters have grown at a slower rate than warehousing and storage and account for fewer new jobs.
Momentum in logistics growth is likely to continue, building on local competitiveness factors and new market forces in e-commerce, raising strategic economic development questions regarding job quality and leveraging related sector opportunities (e.g. manufacturing).
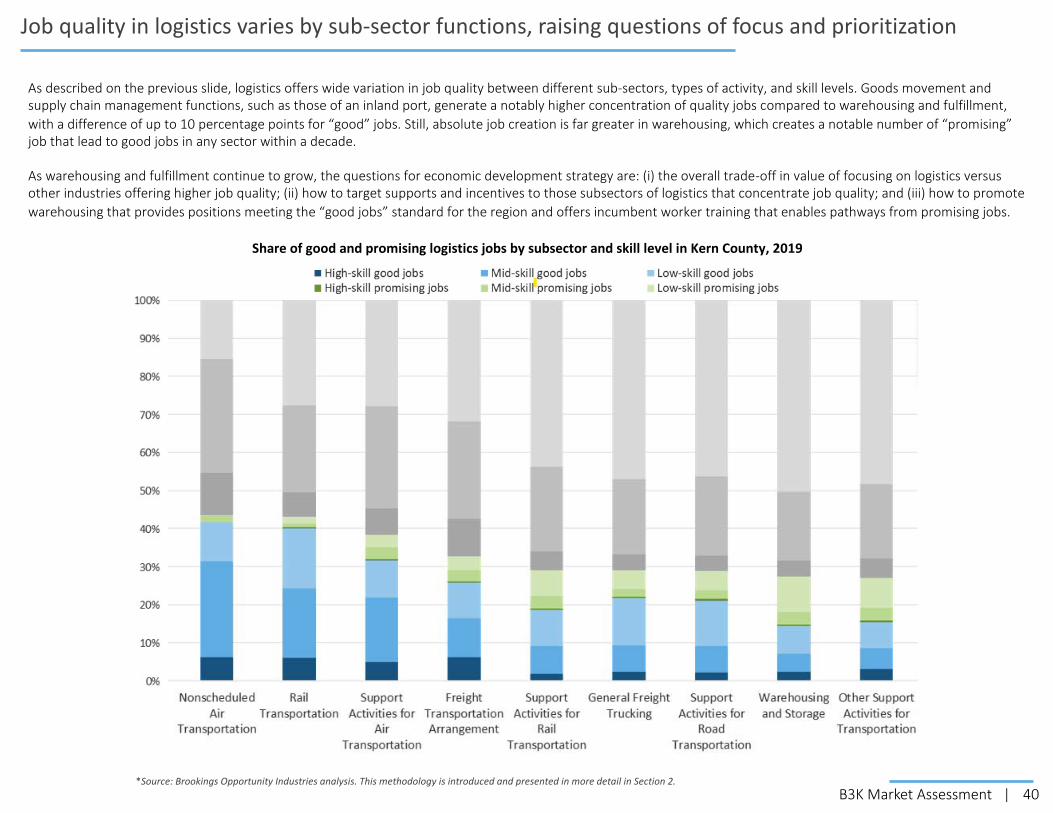
40B3K Market Assessment |
Job quality in logistics varies by sub-sector functions, raising questions of focus and prioritization
Share of good and promising logistics jobs by subsector and skill level in Kern County, 2019
As described on the previous slide, logistics offers wide variation in job quality between different sub-sectors, types of activity, and skill levels. Goods movement and supply chain management functions, such as those of an inland port, generate a notably higher concentration of quality jobs compared to warehousing and fulfillment, with a difference of up to 10 percentage points for “good” jobs. Still, absolute job creation is far greater in warehousing, which creates a notable number of “promising” job that lead to good jobs in any sector within a decade.
As warehousing and fulfillment continue to grow, the questions for economic development strategy are: (i) the overall trade-off in value of focusing on logistics versus other industries offering higher job quality; (ii) how to target supports and incentives to those subsectors of logistics that concentrate job quality; and (iii) how to promote warehousing that provides positions meeting the “good jobs” standard for the region and offers incumbent worker training that enables pathways from promising jobs.
*Source: Brookings Opportunity Industries analysis. This methodology is introduced and presented in more detail in Section 2.

41B3K Market Assessment |
Business services suffered as economy restructured, but options for subclusters pending digital skills
-5 0%
-2 5%
0%
25%
50%
75%
100%
125%
150%
175%
200%
-8 00
-7 00
-6 00
-5 00
-4 00
-3 00
-2 00
-1 00
0
100
200
Arc
hite
ctur
al S
ervi
ces
Mar
ketin
g
Rese
arch
Org
aniz
atio
ns
Des
ign
Ser
vice
s
Insu
ranc
e Re
late
d
Con
sulti
ng S
ervi
ces
Busi
ness
Sup
port
Adv
ertis
ing
Engi
neer
ing
Serv
ices
Com
pute
r Ser
vice
s
Insu
ranc
e Ca
rrie
rs
Job change, 20 09 - 2019 (left axis) Percent change in jobs, 2 009 to 2019 (right axis)
Change in jobs within Kern County’s tradable business services subclusters, 2009 to 2019
Source: Brookings analysis of Economic Modeling Specialists Intl. estimates and U.S. Clusters Mapping Project cluster definitions.
Kern’s tradable business services clusters have shifted over the past decade as the rest of its economy has evolved; again, the split in performance between Greater Bakersfield and East Kern is notable.
In fact, prior economic development strategies proactively removed business services as a target for growth, considering it a local sector serving regional businesses rather than externally. The most prominent business services subclusters shed extremely large numbers of jobs on net:
• Engineering services jobs dropped by more nearly 25%, likely due to the decline in the county's oil and gas and heavy construction sectors.
• The computer services cluster declined in Bakersfield and environs where it largely services the private sector, even as it added jobs in East Kern with military and federal agency clients.
• In insurance services, anchor State Farm pulled 700 jobs out of Bakersfield as it consolidated operations in Tempe, Arizona.
Still, a few subclusters experienced dramatic rates of job growth, more than doubling in size from 2009 to 2019, albeit off relatively low employment baselines. Research organizations, including scientific and technical consulting grew especially fast in East Kern, with other areas in marketing, design, and consulting also expanding.
These data points by themselves do not indicate significant strength. Thus, business services may offer a longer-term -- rather than short-term -- growth and diversification option, despite the recent declines in Greater Bakersfield. This would target support for young tech-oriented firms, as well as capturing back-office function “leakage” from more expensive coastal markets, either through “second office” locations or expanded outsource contracting to serve firms based elsewhere (e.g. Stria).
However, talent analysis (see Section 3) indicates that any prospects for business services expansion will require development of a stronger digital skills and tech talent base as a prerequisite component of a deliberate overall effort.

42B3K Market Assessment |
1
2
3
4
Market Assessment Data Book
Kern County: Economic performance and traded sectors
Opportunity Industries: Job quality and economic mobility
Fundamentals of growth: Competitiveness Drivers
Findings: Implications and next steps
43B3K Market Assessment |
“Opportunity Industries”: Rationale and Purpose
B3K focuses on achieving dual economic objectives of fostering (i) enduring growth and competitiveness for the Bakersfield-Kern region and (ii) jobs that enable self-sufficiency and upward mobility of residents.
Longitudinal economic performance, sector, and talent analyses show that, for decades, Kern’s distinctive industry mix generated outsized income potential for less-educated workers, primarily via the oil and gas industry. Thus, Kern was an extraordinary outlier with regard to economic mobility, compared to regions with much higher levels of educational attainment (see Slide 64). The same reviews affirm that the recent decline in certain traded industries and growth in others is decreasing historic opportunity for residents.
These outcomes require economic development strategies that focus not just on job counts, but the quality of jobs created and providing access to them. In particular, “middle-skill, middle-income" jobs for workers with less than a bachelor's degree are central to determining economic development priorities, responding to the impact of macroeconomic trends that have hollowed out job creation in that category and reduced pathways for younger workers to out-earn their parents.
The challenge is making the connection between industries and worker outcomes more explicit and detailed – distinguishing the quality of jobs that different sectors and activities generate, factoring in scale, educational requirements, and career progressions.
For example, a traditional assessment that gauges the median wage in a given industry does not reveal the extent to which the distribution of the jobs actually pay enough to meet basic expenses or are accessible to workers at specific skill levels. Nor can it indicate whether a particular job in that sector is likely to lead to a better quality job later.
The "Opportunity Industries" analysis identifies the sectoral concentrations of “good” and “promising” jobs that enable workers to achieve self-sufficiency for themselves and their families.
Furthermore, Opportunity Industries affords a granular understanding of progressions in job quality by sector, by occupation and worker demographics.
With this information, regional leaders can:• prioritize economic development interventions to focus on sectors
that concentrate quality jobs• enhance job quality in other prominent clusters• align workforce outreach and training activities to ensure residents
are better connected to those jobs.
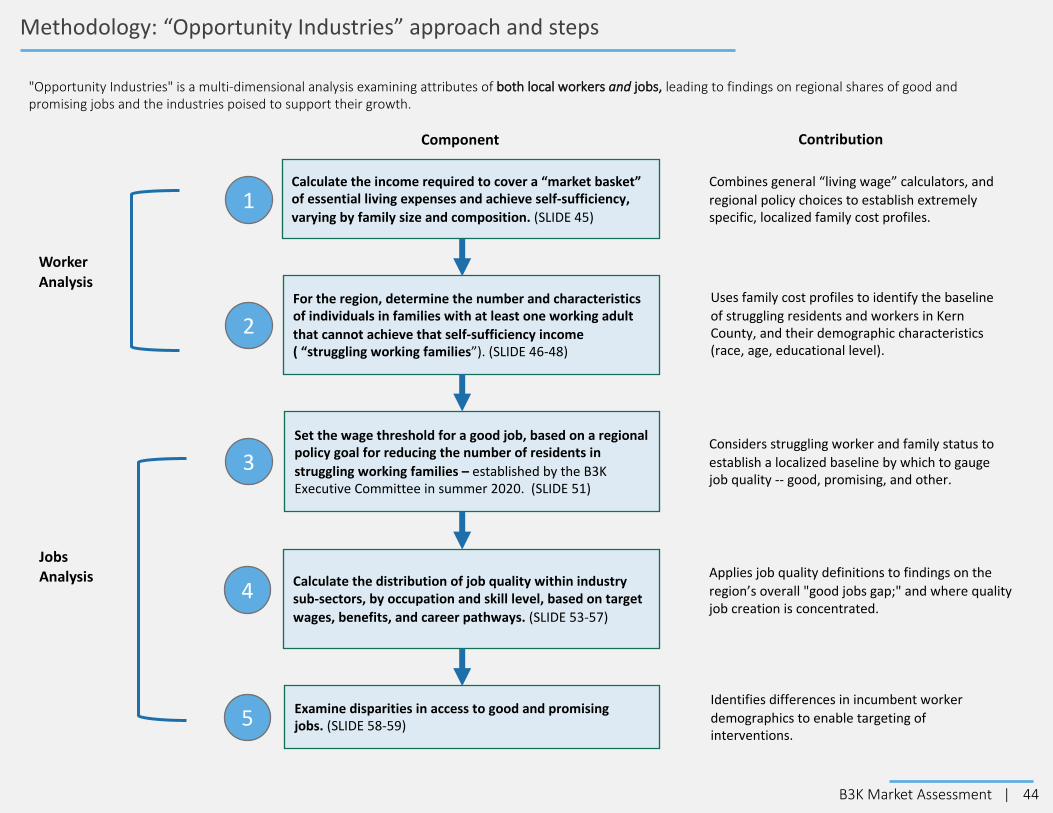
44B3K Market Assessment |
Methodology: “Opportunity Industries” approach and steps
"Opportunity Industries" is a multi-dimensional analysis examining attributes of both local workers and jobs, leading to findings on regional shares of good and promising jobs and the industries poised to support their growth.
Calculate the income required to cover a “market basket” of essential living expenses and achieve self-sufficiency, varying by family size and composition. (SLIDE 45)
For the region, determine the number and characteristics of individuals in families with at least one working adult that cannot achieve that self-sufficiency income ( “struggling working families”). (SLIDE 46-48)
Set the wage threshold for a good job, based on a regional policy goal for reducing the number of residents in struggling working families – established by the B3K Executive Committee in summer 2020. (SLIDE 51)
Calculate the distribution of job quality within industry sub-sectors, by occupation and skill level, based on target wages, benefits, and career pathways. (SLIDE 53-57)
Examine disparities in access to good and promising jobs. (SLIDE 58-59)
Worker Analysis
JobsAnalysis
Uses family cost profiles to identify the baseline of struggling residents and workers in Kern County, and their demographic characteristics (race, age, educational level).
Considers struggling worker and family status to establish a localized baseline by which to gauge job quality -- good, promising, and other.
Applies job quality definitions to findings on the region’s overall "good jobs gap;" and where quality job creation is concentrated.
Identifies differences in incumbent worker demographics to enable targeting of interventions.
Component Contribution
2
3
4
1
5
Combines general “living wage” calculators, and regional policy choices to establish extremely specific, localized family cost profiles.
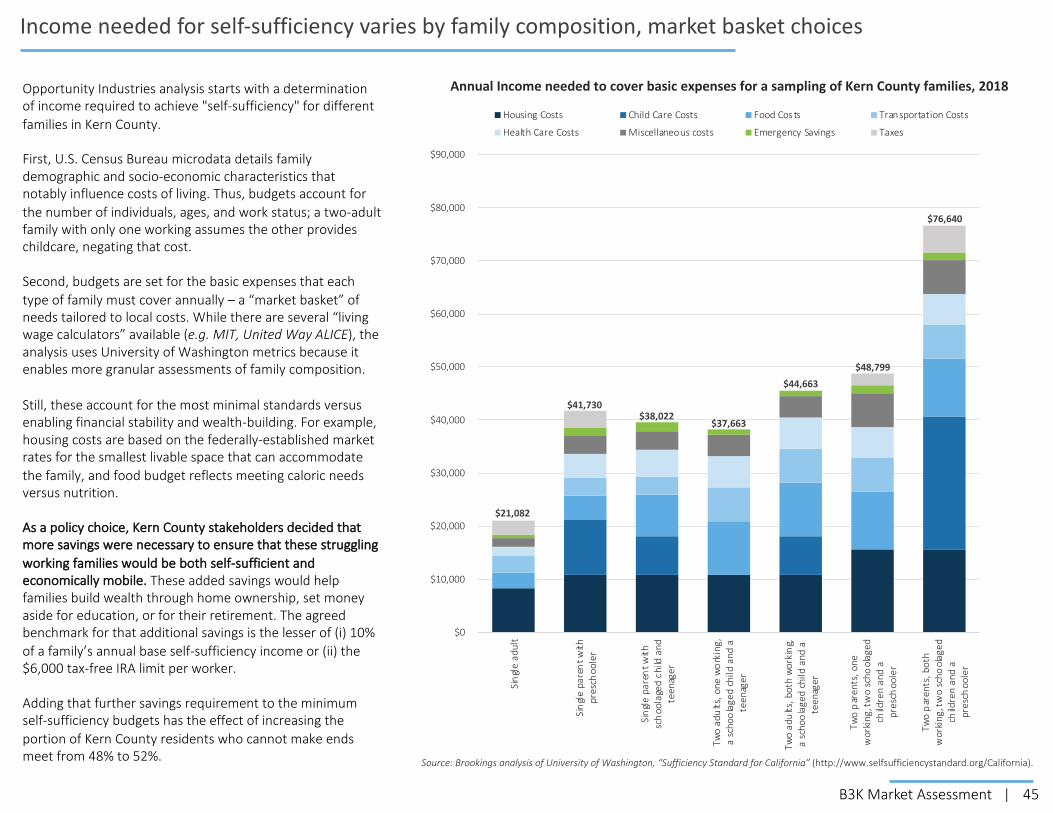
45B3K Market Assessment |
$0
$10,000
$20,000
$30,000
$40,000
$50,000
$60,000
$70,000
$80,000
$90,000
Sin
gle
adul
t
Sin
gle
pare
nt w
ithpr
esch
oole
r
Sin
gle
pare
nt w
ithsc
hoo
lage
d ch
ild a
ndte
enag
er
Two
adu
lts, o
ne w
ork
ing,
a sc
hoo
lage
d ch
ild a
nd a
teen
ager
Two
adu
lts, b
oth
wor
kin
g,a
scho
ola
ged
child
and
ate
enag
er
Two
par
ents
, one
wor
king
, tw
o sc
hool
aged
child
ren
and
apr
esch
oole
r
Two
par
ents
, bot
hw
orki
ng, t
wo
scho
olag
edch
ildre
n an
d a
pres
choo
ler
Housing Costs Child Care Costs Food Costs Transportation Costs
Health Care Costs Miscellaneous costs Emergency Savings Taxes
Annual Income needed to cover basic expenses for a sampling of Kern County families, 2018
Income needed for self-sufficiency varies by family composition, market basket choices
Source: Brookings analysis of University of Washington, “Sufficiency Standard for California” (http://www.selfsufficiencystandard.org/California).
$21,082
$41,730$38,022
$37,663
$44,663
$76,640
$48,799
Opportunity Industries analysis starts with a determination of income required to achieve "self-sufficiency" for different families in Kern County.
First, U.S. Census Bureau microdata details family demographic and socio-economic characteristics that notably influence costs of living. Thus, budgets account for the number of individuals, ages, and work status; a two-adult family with only one working assumes the other provides childcare, negating that cost.
Second, budgets are set for the basic expenses that each type of family must cover annually – a “market basket” of needs tailored to local costs. While there are several “living wage calculators” available (e.g. MIT, United Way ALICE), the analysis uses University of Washington metrics because it enables more granular assessments of family composition.
Still, these account for the most minimal standards versus enabling financial stability and wealth-building. For example, housing costs are based on the federally-established market rates for the smallest livable space that can accommodate the family, and food budget reflects meeting caloric needs versus nutrition.
As a policy choice, Kern County stakeholders decided that more savings were necessary to ensure that these struggling working families would be both self-sufficient and economically mobile. These added savings would help families build wealth through home ownership, set money aside for education, or for their retirement. The agreed benchmark for that additional savings is the lesser of (i) 10% of a family’s annual base self-sufficiency income or (ii) the $6,000 tax-free IRA limit per worker.
Adding that further savings requirement to the minimum self-sufficiency budgets has the effect of increasing the portion of Kern County residents who cannot make ends meet from 48% to 52%.

46B3K Market Assessment |
More than half of Kern County’s residents struggle to make ends meet and achieve self-sufficiency
Source: Brookings analysis of American Community Survey public-use microdata and University of Washington estimates.
More than 450,000 people or more than half of Kern County residents lived on less income than required to cover their basic expenses in 2018. This large share is primarily a reflection of the economy, the quality of job creation, and local workers' qualifications for well-paid jobs.
The data indicates that most people in these families struggle to achieve self-sufficiency because adults cannot earn enough income at work – not because they are not working.
Less than one-third of Kern residents in struggling families belong to families without workers. A disproportionate share of people in these families are seniors aged 65 years or more, or include adults unable to work due to a disability.
Most struggling Kern residents are members of families having at least one adult who participates in the labor market, yet cannot cover all basic living expenses.
Furthermore, the vast majority of struggling prime-aged adults aged 25 to 55 years and struggling young adults younger than 25 years-old belong to working families. Likewise, more than 95% of the children in struggling families belong to working families.
Share of Kern County’s residents that belong to families with insufficient income, 2018
306,031 35%
147,167 17%
427,942 48%
0% 10% 20% 30% 40% 50% 60% 70% 80% 90% 100%
Seniors
Children
Young adults
Prime-aged adults
In struggling working families In struggling non-working families In non-struggling familiesStruggling working families Struggling non-working families Non-struggling families

47B3K Market Assessment |
Within age group, share of struggling workers Within education level, share of struggling workers Within race, share of struggling workers
76%
44%
28%
23%21%
18 to 24 years 25 to 34 years 35 to 54 years 55 to 64 years 65 years andolder
55%
48%
32%
23%
11%
Less than highschool
High school Some college Associatedegree
Bachelor'sand higher
45%
25%
40%
32%34%
Hispanic White Black Asian Other
Source: Brookings analysis of American Community Survey public-use microdata and University of Washington estimates.
There are significant disparities in the likelihood a worker struggles by age, education, and race
Focusing only on the status of struggling working families, more than 133,000 adult workers in Kern County struggled to make ends meet for their families in 2018, prior to the COVID-19 pandemic and economic downturn.
However, there are notable differences in the rate at which workers struggle. Some vary predictably across characteristics like education and age, since these serve as proxies for human capital. Younger workers have less labor market experience, which means they may not be as productive or well-paid. Workers with less education have fewer skills, and tend to earn less on average.
Though disparities along these dimensions are common in other regions, the share of younger and less-educated workers that struggle in Kern remains very high in comparison to other major U.S. metropolitan areas. This is consistent with the unusually low levels of educational attainment in the region.
Kern also has significant racial disparities in the likelihood a worker struggles, only a portion of which are correlated to education and age. A Hispanic worker is 80% more likely to struggle to make ends meet compared to a white worker. A Black worker is 60% more likely to struggle than a white worker.
While a smaller portion of Black and Hispanic adults in Kern County have post-secondary education compared to whites, these differences in educational attainment explain only about half of the disparities between white workers and workers of color. Age explains another 18% of the difference.
This still leaves one-third of these disparities unexplained, raising questions of how to address potential socio-economic barriers. Further, these discrepancies indirectly reinforce disparities in educational attainment, since incentives for a white worker and a worker of color to attain more education are unequal.
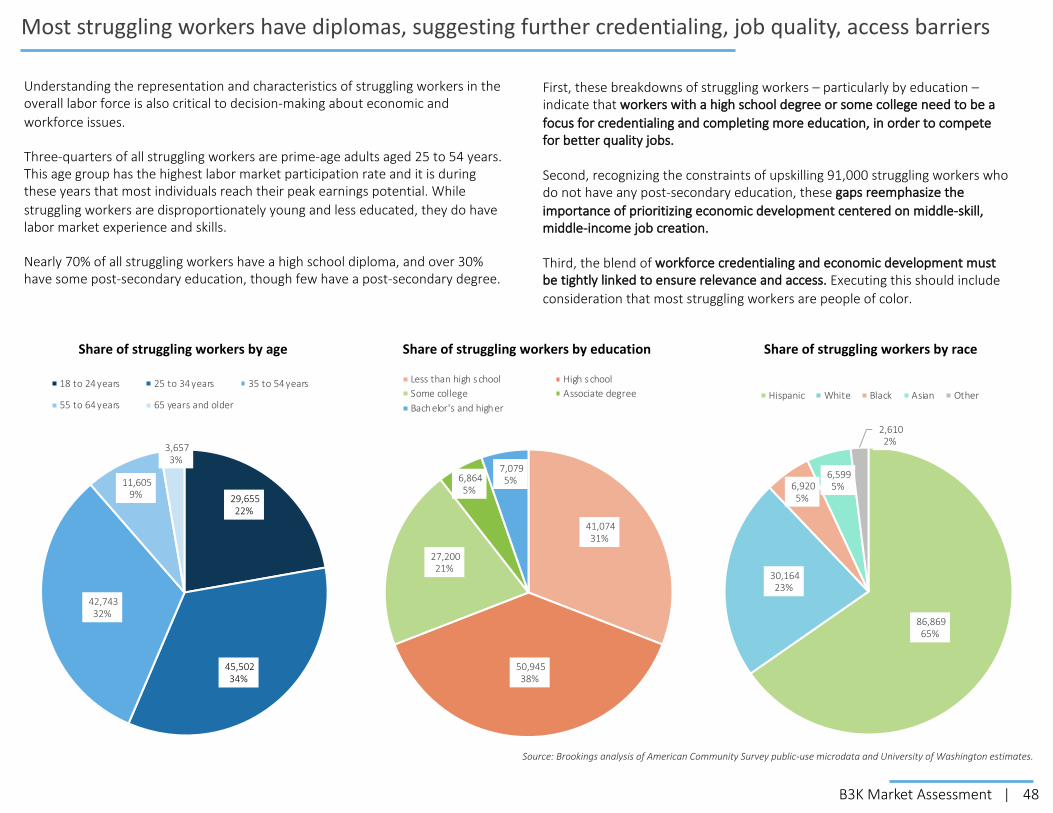
48B3K Market Assessment |
Most struggling workers have diplomas, suggesting further credentialing, job quality, access barriers
Source: Brookings analysis of American Community Survey public-use microdata and University of Washington estimates.
29,655 22%
45,502 34%
42,743 32%
11,605 9%
3,657 3%
18 to 24 years 25 to 34 years 35 to 54 years
55 to 64 years 65 years and older
41,074 31%
50,945 38%
27,200 21%
6,864 5%
7,079 5%
Less than high school High schoolSome college Associate degreeBachelor's and higher
86,869 65%
30,164 23%
6,920 5%
6,599 5%
2,610 2%
Hispanic White Black Asian Other
Share of struggling workers by age Share of struggling workers by education Share of struggling workers by race
Understanding the representation and characteristics of struggling workers in the overall labor force is also critical to decision-making about economic and workforce issues.
Three-quarters of all struggling workers are prime-age adults aged 25 to 54 years. This age group has the highest labor market participation rate and it is during these years that most individuals reach their peak earnings potential. While struggling workers are disproportionately young and less educated, they do have labor market experience and skills.
Nearly 70% of all struggling workers have a high school diploma, and over 30% have some post-secondary education, though few have a post-secondary degree.
First, these breakdowns of struggling workers – particularly by education –indicate that workers with a high school degree or some college need to be a focus for credentialing and completing more education, in order to compete for better quality jobs.
Second, recognizing the constraints of upskilling 91,000 struggling workers who do not have any post-secondary education, these gaps reemphasize the importance of prioritizing economic development centered on middle-skill, middle-income job creation.
Third, the blend of workforce credentialing and economic development must be tightly linked to ensure relevance and access. Executing this should include consideration that most struggling workers are people of color.
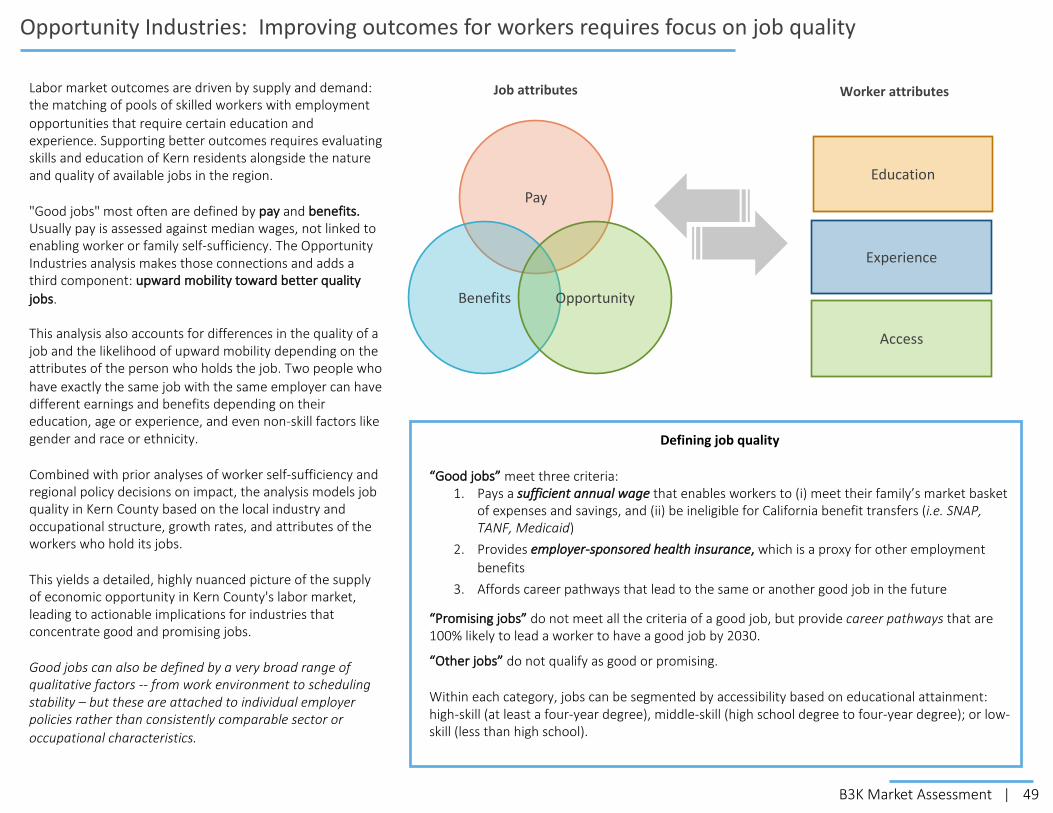
49B3K Market Assessment |
Opportunity Industries: Improving outcomes for workers requires focus on job quality
Pay
Benefits Opportunity
Job attributes
Education
Experience
Access
Worker attributesLabor market outcomes are driven by supply and demand: the matching of pools of skilled workers with employment opportunities that require certain education and experience. Supporting better outcomes requires evaluating skills and education of Kern residents alongside the nature and quality of available jobs in the region.
"Good jobs" most often are defined by pay and benefits. Usually pay is assessed against median wages, not linked to enabling worker or family self-sufficiency. The Opportunity Industries analysis makes those connections and adds a third component: upward mobility toward better quality jobs.
This analysis also accounts for differences in the quality of a job and the likelihood of upward mobility depending on the attributes of the person who holds the job. Two people who have exactly the same job with the same employer can have different earnings and benefits depending on their education, age or experience, and even non-skill factors like gender and race or ethnicity.
Combined with prior analyses of worker self-sufficiency and regional policy decisions on impact, the analysis models job quality in Kern County based on the local industry and occupational structure, growth rates, and attributes of the workers who hold its jobs.
This yields a detailed, highly nuanced picture of the supply of economic opportunity in Kern County's labor market, leading to actionable implications for industries that concentrate good and promising jobs.
Good jobs can also be defined by a very broad range of qualitative factors -- from work environment to scheduling stability – but these are attached to individual employer policies rather than consistently comparable sector or occupational characteristics.
Defining job quality
“Good jobs” meet three criteria:1. Pays a sufficient annual wage that enables workers to (i) meet their family’s market basket
of expenses and savings, and (ii) be ineligible for California benefit transfers (i.e. SNAP, TANF, Medicaid)
2. Provides employer-sponsored health insurance, which is a proxy for other employment benefits
3. Affords career pathways that lead to the same or another good job in the future
“Promising jobs” do not meet all the criteria of a good job, but provide career pathways that are 100% likely to lead a worker to have a good job by 2030.
“Other jobs” do not qualify as good or promising.
Within each category, jobs can be segmented by accessibility based on educational attainment: high-skill (at least a four-year degree), middle-skill (high school degree to four-year degree); or low-skill (less than high school).

50B3K Market Assessment |
Methodology: Identifying the career pathway potential from promising to good jobs
71%67%
72%77%
All workers Workers with a bachelordegree
Workers with an associatedegree
Workers with a high schooldiploma
Share of workers in good jobs who made major career shifts
Source: Brookings, “Opportunity Industries”.
The vast majority of workers obtain good jobs after making major career shifts, and these shifts are more important for less-educated workers. These are not “career ladders” advancing in one vocation or sector, but “career pathways” that may change dramatically.
How can promising jobs that afford upward mobility to good jobs be identified, especially when transitioning into entirely different industries and occupations?
Using the largest publicly-run national labor market survey, the Opportunity Industries analysis follows workers through job changes over the past 20 years. It tracks individuals’ transitions from month to month over two four-month long periods to yield more than 8 million records representing billions of months worked in the U.S. labor market.
As the example of a credit clerk shows, these transitions are not always intuitive, incremental, or improving wages and job quality.
These pathways are not theoretical nor prescriptive. Rather, they reveal what happens across individuals' attributes and observed labor market behaviors.
The data enables modeling of the probability of each movement based on particular circumstances -- the rate of job growth in a place and time, and the characteristics of the worker who made the transition.
Those models establish the career pathways for workers based on their starting occupation and attributes. These can be applied to regional economic and labor market conditions to determine the likelihood that a certain job will lead to a good job.
Common career paths for credit clerks
$0
$50
$100
$150
Start Step 1 Step 2 Step 3
Aver
age
wag
e, in
thou
sand
s
Credit clerk
Loan officer
Retail supervisorLoan reviewer
Nurse aide
Financial manager
Teacher
Loan reviewer
Personal care aide
Loan officer
Financial manager
Teacher
Loan reviewer
Nurse aide
Loan officer
Chief executive
Source: Brookings, “Opportunity Industries”.

51B3K Market Assessment |
Methodology: Determining the wage threshold for a "good job"
What constitutes the target for a “good job” depends on the policy objectives for the region.
Based on regional stakeholder preferences in Kern County, the family self-sufficiency “market basket” budget extended beyond the minimum required for breakeven with annual expenses to also include some savings and wealth-building. That market basket then was applied to determine the proportion of working families that could not meet that self-sufficiency standard, based on their unique characteristics. Tracking across the variety of family compositions and annual income needs, an hourly wage curve can be created that shows how many people – individual adults, children, or undifferentiated residents – can achieve self-sufficiency at different levels.
The policy question then becomes: What is the change in status of struggling workers and their families that Kern County stakeholders consider the goal for improving overall job quality in the region? How many residents should move out of struggling status?
Typically, regions center this decision around the impact on children, given the exceptional influence that lower incomes have on their development, health, and lifelong socio-economic outcomes.
As in other metros, the debate in Kern County balanced what is ambitious and achievable, meaningful and realistic. It considered current economic development and labor market conditions, the scale of progress required to reach wage and job creation targets, and forecasted conditions.
Stakeholders set a policy goal of reducing the share of Kern County children in struggling working families by 50%, resulting in a target wage of $21.80 per hour.*
This analysis was done at the peak of a tight labor market of a 10-year long business cycle. Although economic conditions are disrupted and uncertain, this wage threshold remains an appropriate "high-water mark" for defining good jobs.
(*Note: The bare minimum market basket expenses, without added savings and wealth-building, required $20.20 per hour wage to meet the 50% goal.)
Share of Kern County's struggling residents lifted to self-sufficiency at different wage thresholds
Source: Brookings analysis of American Community Survey public-use microdata and University of Washington estimates.
0.0%
10.0%
20.0%
30.0%
40.0%
50.0%
60.0%
70.0%
80.0%
90.0%
100.0%
$15.00 $20.00 $25.00 $30.00 $35.00 $40.00 $45.00 $50.00
Shar
e of
gro
up li
fted
out
of s
trug
glin
g st
atus
Hourly wage for full-time, year-round work
Struggling children Struggling adults All struggling persons
$21.80/hr
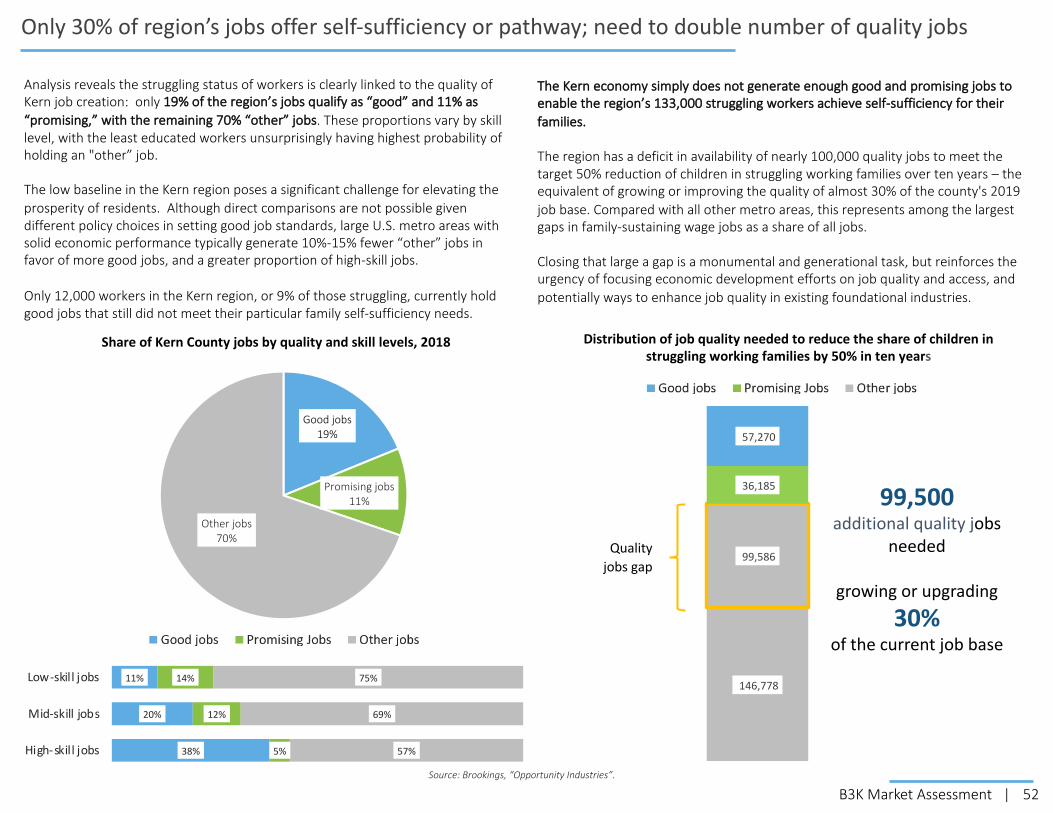
52B3K Market Assessment |
146,778
99,586
36,185
57,270 Good jobs
19%
Promising jobs11%
Other jobs70%
Only 30% of region’s jobs offer self-sufficiency or pathway; need to double number of quality jobs
Analysis reveals the struggling status of workers is clearly linked to the quality of Kern job creation: only 19% of the region’s jobs qualify as “good” and 11% as “promising,” with the remaining 70% “other” jobs. These proportions vary by skill level, with the least educated workers unsurprisingly having highest probability of holding an "other” job.
The low baseline in the Kern region poses a significant challenge for elevating the prosperity of residents. Although direct comparisons are not possible given different policy choices in setting good job standards, large U.S. metro areas with solid economic performance typically generate 10%-15% fewer “other” jobs in favor of more good jobs, and a greater proportion of high-skill jobs.
Only 12,000 workers in the Kern region, or 9% of those struggling, currently hold good jobs that still did not meet their particular family self-sufficiency needs.
Source: Brookings, “Opportunity Industries”.
38%
20%
11%
5%
12%
14%
57%
69%
75%
High-skill jobs
Mid-skill jobs
Low-skill jobs
Share of Kern County jobs by quality and skill levels, 2018
The Kern economy simply does not generate enough good and promising jobs to enable the region’s 133,000 struggling workers achieve self-sufficiency for their families.
The region has a deficit in availability of nearly 100,000 quality jobs to meet the target 50% reduction of children in struggling working families over ten years – the equivalent of growing or improving the quality of almost 30% of the county's 2019 job base. Compared with all other metro areas, this represents among the largest gaps in family-sustaining wage jobs as a share of all jobs.
Closing that large a gap is a monumental and generational task, but reinforces the urgency of focusing economic development efforts on job quality and access, and potentially ways to enhance job quality in existing foundational industries.
99,500additional quality jobs
needed
growing or upgrading 30%
of the current job base
Quality jobs gap
Distribution of job quality needed to reduce the share of children in struggling working families by 50% in ten years

53B3K Market Assessment |
To boost opportunity, Kern should prioritize sectors that concentrate good and promising jobs
As discussed in Section 1, the growth and decline of specific dominant regional industries over the past decade has importantimplications for the availability of good and promising jobs. Sectors concentrating good jobs, such as oil and gas, have declined, while those offering fewer good jobs, such as agriculture and large locally-serving clusters like health care, have grown.
Within these sectors, specific sub-sectors can also offer notably different levels of job quality. As shown on Slide 31, agricultural manufacturing offers a higher proportion of good and promising jobs than agricultural production in the region. Within the region's burgeoning logistics cluster (see slide 39), sub-sectors focused on goods movement and supply chain management best warehousing and fulfillment in job quality by a significant degree.
The following slides illustrate and expand on these dynamics, applying the Opportunity Industries analysis to show the concentration of good, promising, and other jobs at different skill levels within groupings of sectors. They add further context to the forcesdriving the region’s significant gap in good and promising jobs presented on the previous slide.
The analysis demonstrates that sectors containing greater concentrations of job quality (such as utilities or finance) offer fewer total jobs. Altogether, this reflects the generally low number of quality jobs in the region and, troublingly, the challenge posed to boosting them by the County's major growth drivers and economic trajectory.
For local leaders, these dynamics demand intentionality in targeting specific opportunity-rich sectors for growth – rather than focusing on absolute growth in job counts – as well as a focus on the specific sub-sectors in these areas primed to offer good and promising jobs.
To improve outcomes for more workers, local leaders will need to focus dually on supporting the growth of specific sectors offering better jobs, while also improving talent development and workforce preparedness for those opportunities. A general, non-targetedfocus on growth alone is unlikely to alter the region’s current trajectory or address these core challenges around regional prosperity.
.

54B3K Market Assessment |
Share of jobs by industry type and skill level in Kern County’s sectors, 2019
Share of job quality varies by industry and skill level, with more good jobs in high-value traded sectors
Source: Brookings, “Opportunity Industries”.
0%
10%
20%
30%
40%
50%
60%
70%
80%
90%
100%
Total
Profess
ional
Utilitie
s
Administra
tive
Finance
Government
Education
Mining,
oil, an
d gas
Inform
ation
Manufactu
ring
Wholesa
le
Constructio
n
Health ca
re
Headquarters
Logis
tics
Real esta
te
Loca
l serv
ices
Hospita
lityReta
il
Agricu
lture
Arts and enterta
inment
High-skill good jobs Mid-skill good jobs Low-skill good jobsHigh-skill promising jobs Mid-skill promising jobs Low-skill promis ing jobsHigh-skill other jobs Mid-skill other jobs Low-skill other jobs
Traded Sectors

55B3K Market Assessment |
0
5
10
15
20
25
30
35
40
45
50
55
60
65
Profess
ional
Utilitie
s
Administra
tive
Finance
Government
Education
Mining,
oil, an
d gas
Inform
ation
Manufactu
ring
Wholesa
le
Constructio
n
Health ca
re
Headquarters
Logis
tics
Real esta
te
Loca
l serv
ices
Hospita
lityReta
il
Agricu
lture
Arts and enterta
inment
Thou
sand
s of
Jobs
High-skill good jobs Mid-skill good jobs Low-skill good jobsHigh-skill promising jobs Mid-skill promising jobs Low-skill promis ing jobsHigh-skill other jobs Mid-skill other jobs Low-skill other jobs
Number of jobs by type and skill level in Kern County’s sectors, 2019
Sectors that concentrate the greatest job quality tend to create fewer jobs
Source: Brookings, “Opportunity Industries”.
Traded Sectors
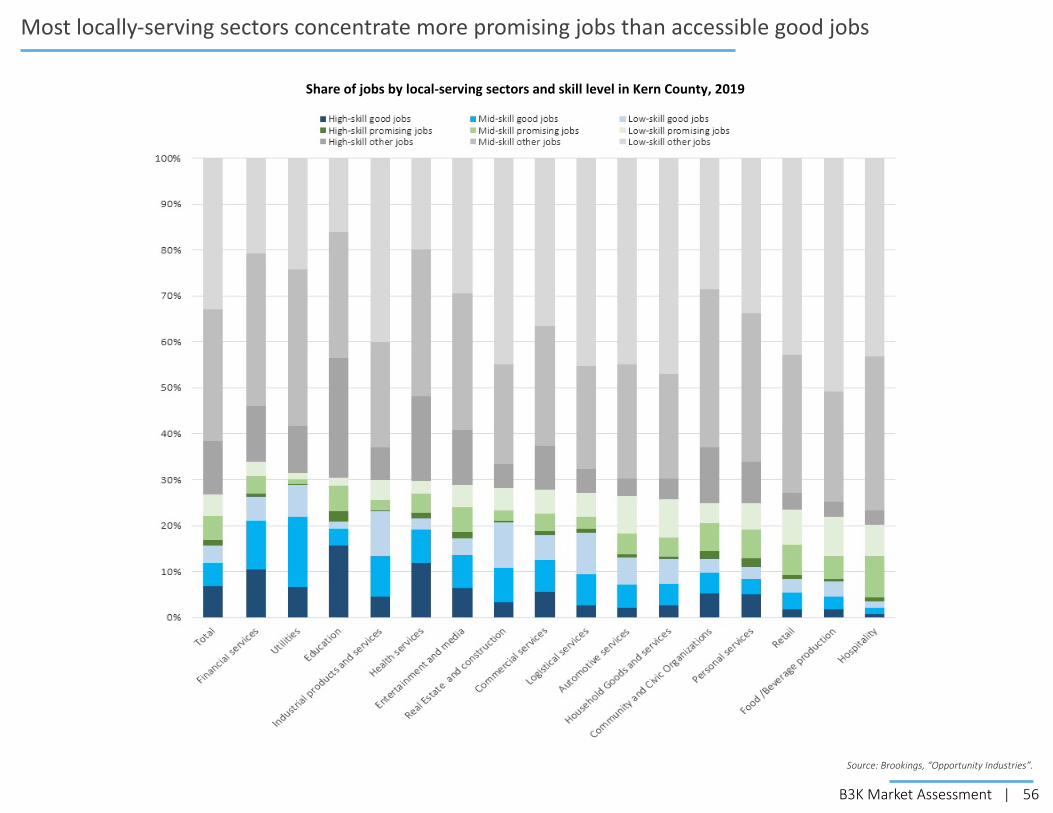
56B3K Market Assessment |
Most locally-serving sectors concentrate more promising jobs than accessible good jobs
Share of jobs by local-serving sectors and skill level in Kern County, 2019
Source: Brookings, “Opportunity Industries”.

57B3K Market Assessment |
The most opportunity-rich locally-serving sectors tend to generate fewer total jobs
Share of jobs by local-serving cluster and skill level in Kern County, 2019
-
5,000
10,000
15,000
20,000
25,000
30,000
35,000
Financia
l servi
ces
Utilitie
s
Education
Industrial
products and se
rvices
Health se
rvices
Enterta
inment and m
edia
Real Es tate
and co
nstructio
n
Commerci
al serv
ices
Logis
tical se
rvices
Automotiv
e service
s
Household Goods a
nd servi
ces
Community
and Civic Orga
nizatio
ns
Personal s
ervices
Retail
Food /Beverage pro
duction
Hospita
lity
High-skill good jobs Mid-skill good jobs Low-skill good jobsHigh-skill promising jobs Mid-skill promising jobs Low-skill promis ing jobsHigh-skill other jobs Mid-skill other jobs Low-skill other jobs
Source: Brookings, “Opportunity Industries”.

58B3K Market Assessment |
Workers with different demographics face clear disparities in occupying good and promising jobs
Source: Brookings, “Opportunity Industries”.
0% 5% 10% 15% 20% 25% 30% 35% 40% 45% 50%
Hispanic
Black
Asian
Other
White
Women
Men
18 to 24 years
25 to 34 years
35 to 54 years
65 years or older
55 to 64 years
Less than high school
High school diploma or GED
Some college or certificate
Associate degree
Bachelor degree and higher
Total
Share of group that ho lds a good job Share of group that ho lds a promising job
Share of workers in each demographic group that have a good or promising jobBeyond the need for more quality jobs, Kern economic development stakeholders must consider how to close gaps in access to those jobs.
The Opportunity Industries analysis uncovered significant disparities in who occupies good and promising jobs based on a range of demographic characteristics.
Predictably, many of those disparities follow human capital dimensions. For example, workers who hold a bachelor’s degree are more likely to have a good job than those with only a high school diploma. Older workers are more likely to have a good job than younger workers and hold relatively few promising jobs, reflecting the value of experience and on-the-job learning. Younger workers tend to hold promising jobs that afford knowledge and skills acquisition that enable them to command higher good job wages and benefits within the next ten years.
However, differences also emerge along dimensions that are not directly connected to human capital.
Men are more likely than women to hold a good job—an especially concerning disparity given that a large portion of struggling workers are single mothers. Furthermore, analysis of the out-of-work population finds rates for women dramatically higher than men, including those in prime working age with more than a high school degree (see Slide 68).
Race also is a dividing line in who occupies a good or promising job. White workers are more likely to hold a good job than workers of color.
Some race-based disparities may be attributable to other demographic characteristics. For example, the region’s Hispanic cohort trends significantly younger than the white population, thereby naturally skewing Hispanic residents toward holding fewer good jobs and a larger proportion of promising jobs.
Nevertheless, similar to the differences uncovered in analysis of struggling workers generally, age and educational attainment do not explain all of these gaps in performance.

59B3K Market Assessment |
Demographic disparities in job quality persist among workers with the same educational attainment
Share of workers in each demographic group that have a good or promising job
Source: Brookings, “Opportunity Industries”.
0% 10% 20% 30% 40% 50%
Hispanic, no diploma
Asian, no diploma
Other, no diploma
Black, no diploma
White, no d ip loma
Hispanic, high school
Asian, high school
Other, high school
Black, high school
White, high school
Hispanic, associate
Asian, associate
Other, associate
Black, associate
White, associate
Hispanic, bachelor and higher
Asian, bachelor and higher
Other, bachelor and higher
Black, bachelor and higher
White, bachelor and higher
Even among workers with the same education, disparities persist between workers of different races in the share occupying good or promising jobs. At every level of educational attainment, workers of color are at some disadvantage. More education helps to significantly narrow gaps between whites and workers of color, but no amount closes them completely. For example:
• A white worker with a high school diploma or GED is twice as likely to hold a good job as a Hispanic worker with the same degrees.
• A white worker with at least a bachelor's degree is 50% more likely to hold a good job than a Hispanic worker with the same education.
Again, age and associated work experience may be a major factor, with the Hispanic cohort of workers younger than the white population. However, the struggling worker analysis correlated less than 20% of the difference in outcomes to age.
At higher levels of educational attainment, some of this divergence could be attributable to fields of study that tend to be pursued by particular racial groups, whether by interest or structural expectations. Hispanic and white students might disproportionately seek degrees in different disciplines with varying salary profiles, such as liberal arts versus computer science. In addition to retention and graduation rates, examining the distribution of majors by race at CSU Bakersfield and Kern Community College District may offer insights on this theory. Either way, the difference in likely outcomes from enrolling in a four-year degree program creates different levels of risk and reward for Hispanic versus white students, which can lead to different decisions about whether the investment of time and resources is worth it.
Similarly, the distribution of training and workforce development system participants and focus of placements could influence outcomes. For example, programs may consider the extent to which they tend to serve more Hispanic versus white workers, prioritize filling high volumes of job openings versus targeting job quality, and have different results in the type of training provided or placement made.
The scale of the labor market disparities among similarly situated workers also suggests other factors, such as gaps in access to social networks to connect with better quality jobs and firm hiring outreach and incumbent worker advancement practices.
Share of group that holds a good job Share of group that holds a promising job

60B3K Market Assessment |
Community engagement validated job quality and access challenges
B3K conducted several community engagement sessions to ensure that community members were an integral part of the B3K process, building towards a strategy that is reflective of community members’ experiences.
These sessions focused particularly on documenting experiences and gathering feedback related to workforce development, unemployment and the out-of-work population, and access to quality jobs.In all, these conversations reinforced other data and qualitative input on the region’s challenges to shared prosperity and disparities in access to quality jobs.
Specific themes included:• Generational poverty and trauma pose significant roadblocks to
prosperity.
• Varied access to supports across racial groups contributes to disparities in educational outcomes. Educational experiences that offer more accessible pathways to better jobs, perhaps through renewed emphasis on vocational training, are needed.
• Finding full-time stable work, rather than part-time employment, can be challenging.
• Transportation is a barrier to job access, particularly in rural areas. Rural areas also struggle with access and exposure to educational opportunities.
• Training programs don’t necessarily translate to promised outcomes in pay or employment.
• Immigrant communities face particular barriers to accessing good jobs and can also be targets for misinformation around opportunities.
• There is an imperative for ensure that regional strategies benefit and uplift existing residents, rather than just attracting skilled workers from outside.
“Poverty is trauma. Racism is embedded into local structures and causes trauma… Trauma has really profound impacts on individuals and populations.”
“Students (children of farmworkers) are not seeing college as a next step for them. They are seeing time invested in school and then the pay is not what they expected. They’re making the same as someone with a high school diploma. They don’t have connections. They don’t have people they can reach out to guide them in the process.”
“Once they (young adults) became real breadwinners in the household, it’s hard for them to start working and go back to school and focus on that.”
“When our kids are going to school, we’ve got to make sure they’re taking the classes that are going to send them to college...but we have to learn about that to know what kind of classes will take them to college and what kind of classes won’t.”
“We don’t have access to very good jobs to raise our family. That also stops us from helping our kids more and encouraging them to be successful.”
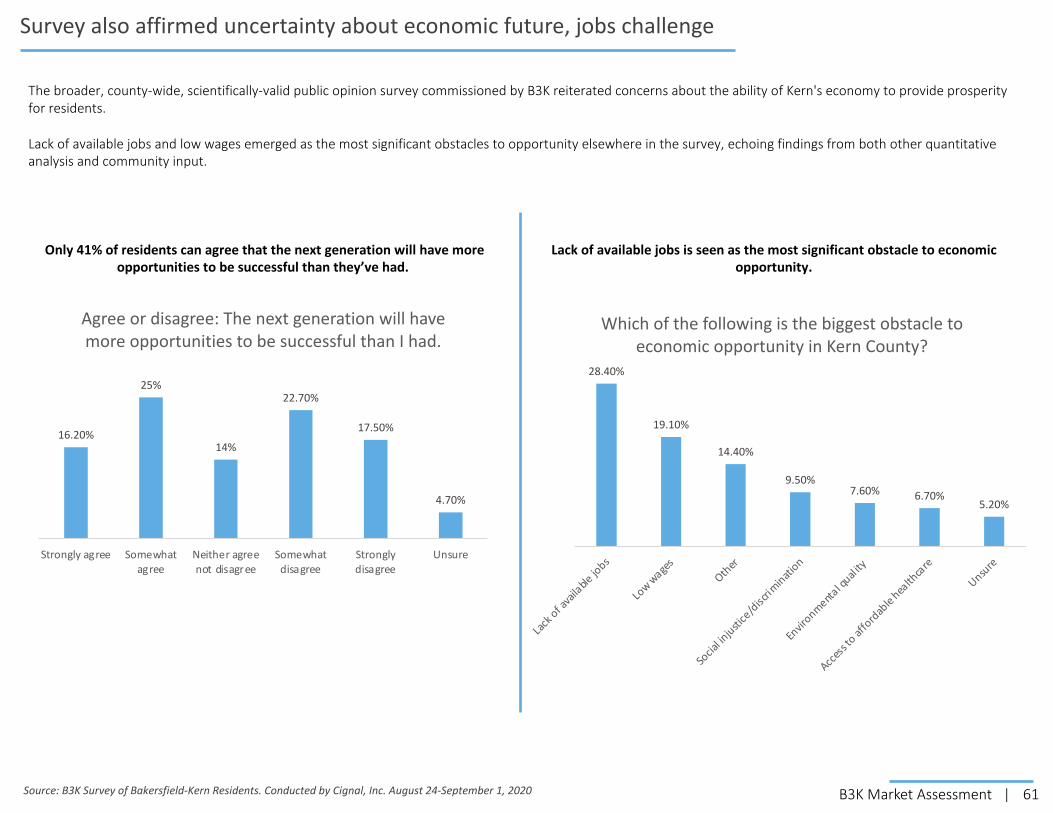
61B3K Market Assessment |
Survey also affirmed uncertainty about economic future, jobs challenge
The broader, county-wide, scientifically-valid public opinion survey commissioned by B3K reiterated concerns about the ability of Kern's economy to provide prosperity for residents.
Lack of available jobs and low wages emerged as the most significant obstacles to opportunity elsewhere in the survey, echoing findings from both other quantitative analysis and community input.
16.20%
25%
14%
22.70%
17.50%
4.70%
Strongly agree Somewhatagree
Neither agreenot disagree
Somewhatdisagree
Stronglydisagree
Unsure
Agree or disagree: The next generation will have more opportunities to be successful than I had.
28.40%
19.10%
14.40%
9.50%7.60% 6.70%
5.20%
Lack o
f avai
lable jo
bs
Low wages
Other
Socia
l injustic
e/discrim
ination
Envir
onmental qu
al ity
Access
to affordab
le hea
lthcare
Unsure
Which of the following is the biggest obstacle to economic opportunity in Kern County?
Only 41% of residents can agree that the next generation will have more opportunities to be successful than they’ve had.
Lack of available jobs is seen as the most significant obstacle to economic opportunity.
Source: B3K Survey of Bakersfield-Kern Residents. Conducted by Cignal, Inc. August 24-September 1, 2020

62B3K Market Assessment |
1
2
3
4
Market Assessment Data Book
Kern County: Economic performance and traded sectors
Opportunity Industries: Job quality and economic mobility
Fundamentals of growth: Competitiveness Drivers
Findings: Implications and next steps

63B3K Market Assessment |
Competitiveness Drivers: Talent
Why talent matters:
In the modern economy, workforce capabilities far surpass any other single input to regional economic development.
Regions grow when they develop and deploy residents to maximize their productive potential.
The pool of available knowledge, skills, and expertise – and ability to cultivate more – is the top factor in cluster formation and business location decisions.
The economic success of individuals, firms, and regions correlates closely to educational attainment and the density of relevant talent to draw from.

64B3K Market Assessment |
Educational attainment in the region lags economic peers, with deficits hidden by historic job mix
Talent drives regional economic performance, and economic outcomes for workers are closely correlated to higher educational attainment levels of the local labor force. As demonstrated by the Opportunity Industries analysis, higher-skilled workers are considerably more likely to hold a good or promising job. According to research by the City Observatory, educational attainment now explains about two-thirds of the variation in per capita incomes across large US city-regions.
Kern has been a dramatic outlier. While consistently lagging behind California and national comparisons in levels of educational attainment, Kern benefited from the unique presence of high-wage extraction industry jobs that are accessible to residents holding a high school degree or less.
As a result, the region placed far outside the trend line in offering economic mobility for a relatively uneducated workforce. In 2010, Kern per capita earnings were roughly $31,000 despite less than 15% of residents holding at least a Bachelor’s degree. That put the region ahead of the Inland Empire and Las Vegas, and on par with metros having about twice the educational attainment.
However, by 2018, declines in core low-skill industries and job quality caught up with Kern. Per capita income grew to $39,700 while educational attainment only rose to 16%, but the more educated regions experienced substantially greater improvements that surpassed Kern in economic opportunity.
While still exceeding expectations, the decline in oil industry jobs and economic drag from over 50% of the population lacking more than a high school degree has pulled Kern more in line with national standards. These downward trends will continue.
No economic development strategy can change long-term outcomes in job quality, vitality, and competitiveness if the region does not dramatically improve educational attainment rates at all levels. This responsibility extends beyond educators to all stakeholders – business, government, and community.
BOS
CHIDEN
KCLV
ORL
PHI RAL
RIV
SEA
SFOSJOWDC
AUSBIR
$20,000
$30,000
$40,000
$50,000
$60,000
$70,000
$80,000
15% 20% 25% 30% 35% 40% 45% 50% 55%Percent of adults 25 or older with Bachelor's degree or higher
Metro per capita income vs educational attainment, 2010
Source: City Observatory analysis of ACS and BEA data
Per c
apita
inco
me
Kern
$20,000
$30,000
$40,000
$50,000
$60,000
$70,000
$80,000
15% 20% 25% 30% 35% 40% 45% 50% 55%Percent of adults 25 or older with Bachelor's degree or higher
Metro per capita income vs educational attainment, 2018
Kern RIV
LV
PHL
RALKC
AUS
IND
SA
Per c
apita
inco
me
SLC
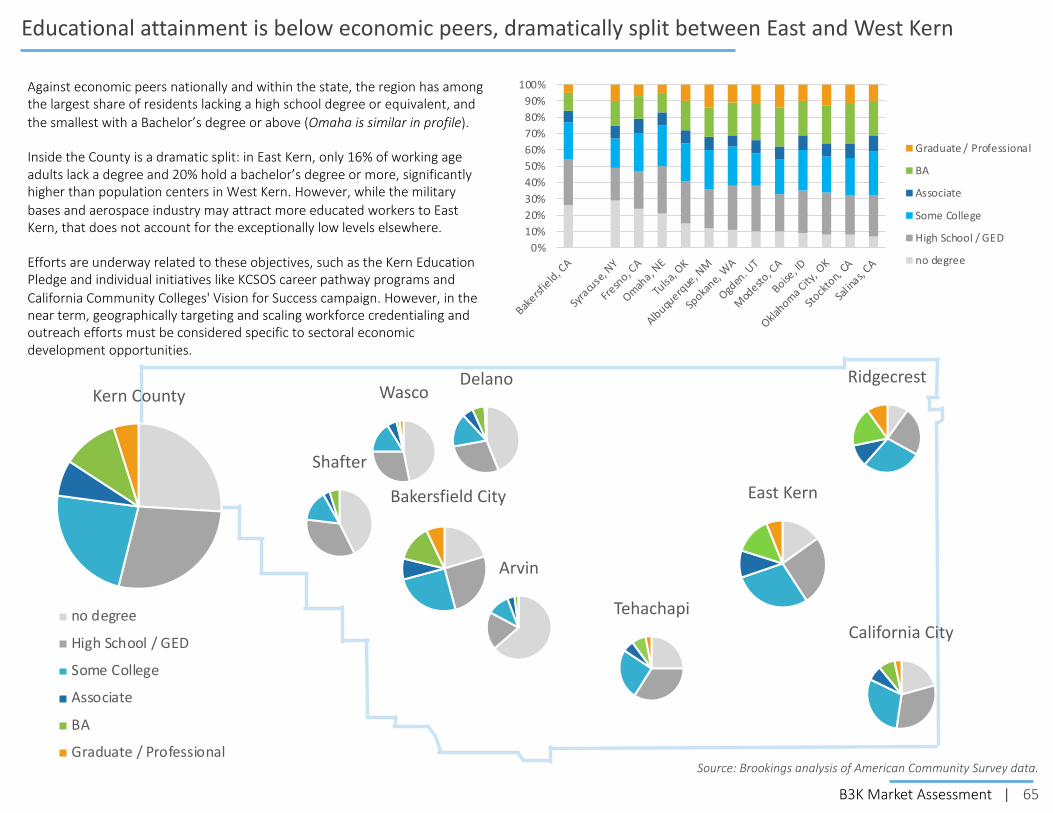
65B3K Market Assessment |
Educational attainment is below economic peers, dramatically split between East and West Kern
Against economic peers nationally and within the state, the region has among the largest share of residents lacking a high school degree or equivalent, and the smallest with a Bachelor’s degree or above (Omaha is similar in profile).
Inside the County is a dramatic split: in East Kern, only 16% of working age adults lack a degree and 20% hold a bachelor’s degree or more, significantly higher than population centers in West Kern. However, while the military bases and aerospace industry may attract more educated workers to East Kern, that does not account for the exceptionally low levels elsewhere.
Efforts are underway related to these objectives, such as the Kern Education Pledge and individual initiatives like KCSOS career pathway programs and California Community Colleges' Vision for Success campaign. However, in the near term, geographically targeting and scaling workforce credentialing and outreach efforts must be considered specific to sectoral economic development opportunities.
Bakersfield City
Delano
Shafter
Ridgecrest
California City
East Kern
Wasco
Arvin
Tehachapi
Kern County
no degree
High School / GED
Some College
Associate
BA
Graduate / Professional
0%10%20%30%40%50%60%70%80%90%
100%
Bakersf
ield, CA
Syracuse,
NY
Fresno, C
A
Omaha, N
E
Tulsa
, OK
Albuquerque
, NM
Spokan
e, WA
Ogden
. UT
Modesto
, CA
Boise, ID
Oklahoma C
ity, O
K
Stockt
on, CA
Salina
s, CA
Graduate / Professional
BA
Associate
Some College
High School / GED
no degree
Source: Brookings analysis of American Community Survey data.
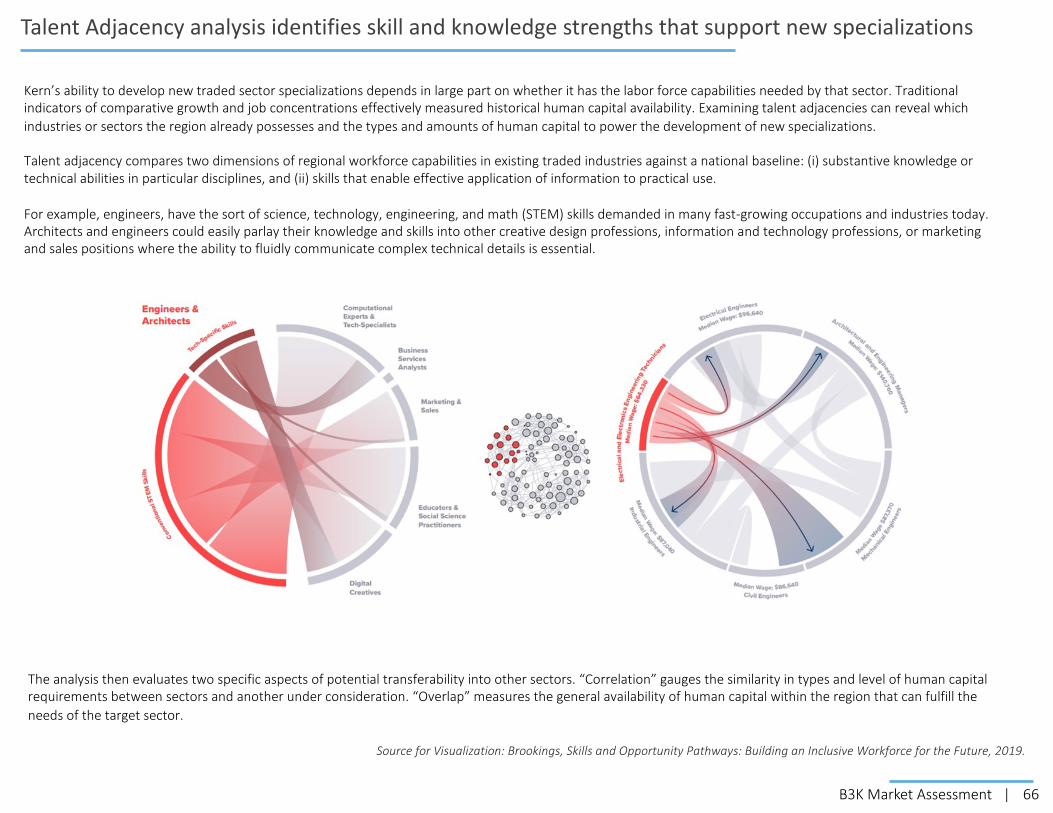
66B3K Market Assessment |
Talent Adjacency analysis identifies skill and knowledge strengths that support new specializations
Kern’s ability to develop new traded sector specializations depends in large part on whether it has the labor force capabilities needed by that sector. Traditional indicators of comparative growth and job concentrations effectively measured historical human capital availability. Examining talent adjacencies can reveal which industries or sectors the region already possesses and the types and amounts of human capital to power the development of new specializations.
Talent adjacency compares two dimensions of regional workforce capabilities in existing traded industries against a national baseline: (i) substantive knowledge or technical abilities in particular disciplines, and (ii) skills that enable effective application of information to practical use.
For example, engineers, have the sort of science, technology, engineering, and math (STEM) skills demanded in many fast-growing occupations and industries today. Architects and engineers could easily parlay their knowledge and skills into other creative design professions, information and technology professions, or marketing and sales positions where the ability to fluidly communicate complex technical details is essential.
The analysis then evaluates two specific aspects of potential transferability into other sectors. “Correlation” gauges the similarity in types and level of human capital requirements between sectors and another under consideration. “Overlap” measures the general availability of human capital within the region that can fulfill the needs of the target sector.
Source for Visualization: Brookings, Skills and Opportunity Pathways: Building an Inclusive Workforce for the Future, 2019.
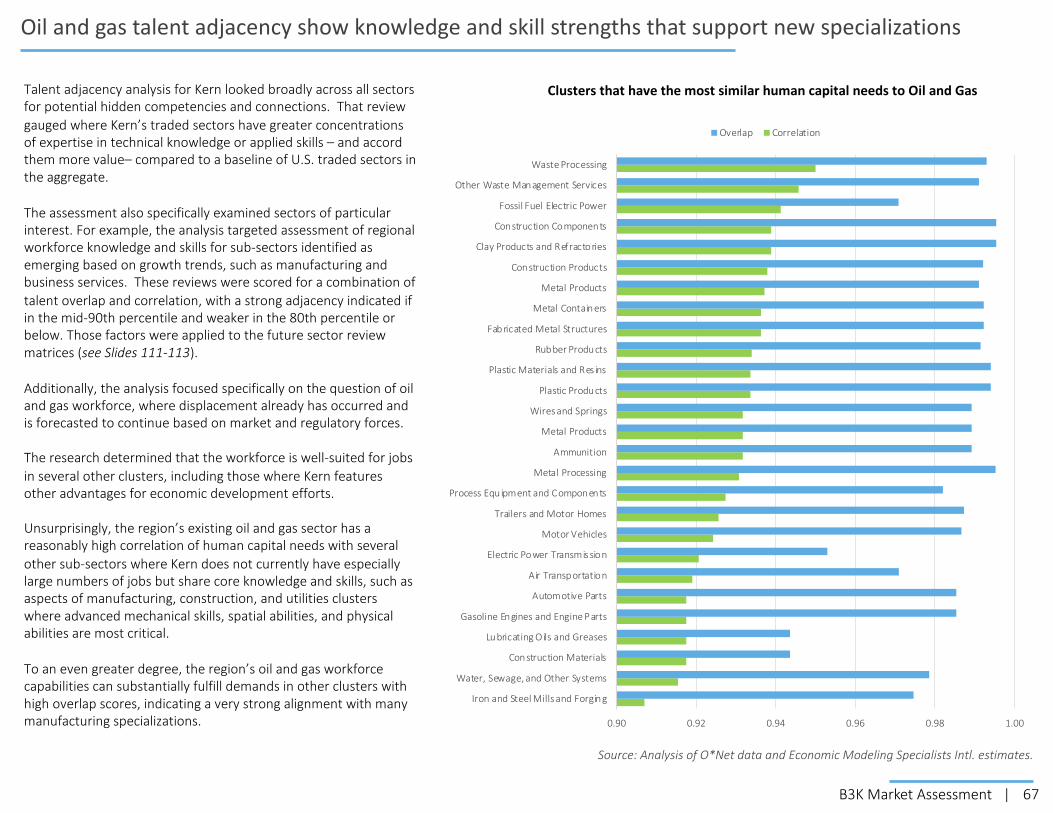
67B3K Market Assessment |
Oil and gas talent adjacency show knowledge and skill strengths that support new specializations
Clusters that have the most similar human capital needs to Oil and Gas
0.90 0.92 0.94 0.96 0.98 1.00
Iron and Steel Mills and Forging
Water, Sewage, and Other Systems
Construction Materials
Lubricating Oils and Greases
Gasoline Engines and Engine P arts
Automotive Parts
Air Transportation
Electric Power Transmission
Motor Vehicles
Trailers and Motor Homes
Process Equipment and Components
Metal Processing
Ammunition
Metal Products
Wires and Springs
Plastic Products
Plastic Materials and Res ins
Rubber Products
Fabricated Metal Structures
Metal Containers
Metal Products
Construction Products
Clay Products and Refractories
Construction Components
Fossil Fuel Electric Power
Other Waste Management Services
Waste Processing
Overlap Correlation
Talent adjacency analysis for Kern looked broadly across all sectors for potential hidden competencies and connections. That review gauged where Kern’s traded sectors have greater concentrations of expertise in technical knowledge or applied skills – and accord them more value– compared to a baseline of U.S. traded sectors in the aggregate.
The assessment also specifically examined sectors of particular interest. For example, the analysis targeted assessment of regional workforce knowledge and skills for sub-sectors identified as emerging based on growth trends, such as manufacturing and business services. These reviews were scored for a combination of talent overlap and correlation, with a strong adjacency indicated if in the mid-90th percentile and weaker in the 80th percentile or below. Those factors were applied to the future sector review matrices (see Slides 111-113).
Additionally, the analysis focused specifically on the question of oil and gas workforce, where displacement already has occurred and is forecasted to continue based on market and regulatory forces.
The research determined that the workforce is well-suited for jobs in several other clusters, including those where Kern features other advantages for economic development efforts.
Unsurprisingly, the region’s existing oil and gas sector has a reasonably high correlation of human capital needs with several other sub-sectors where Kern does not currently have especially large numbers of jobs but share core knowledge and skills, such as aspects of manufacturing, construction, and utilities clusters where advanced mechanical skills, spatial abilities, and physical abilities are most critical.
To an even greater degree, the region’s oil and gas workforce capabilities can substantially fulfill demands in other clusters with high overlap scores, indicating a very strong alignment with many manufacturing specializations.
Source: Analysis of O*Net data and Economic Modeling Specialists Intl. estimates.
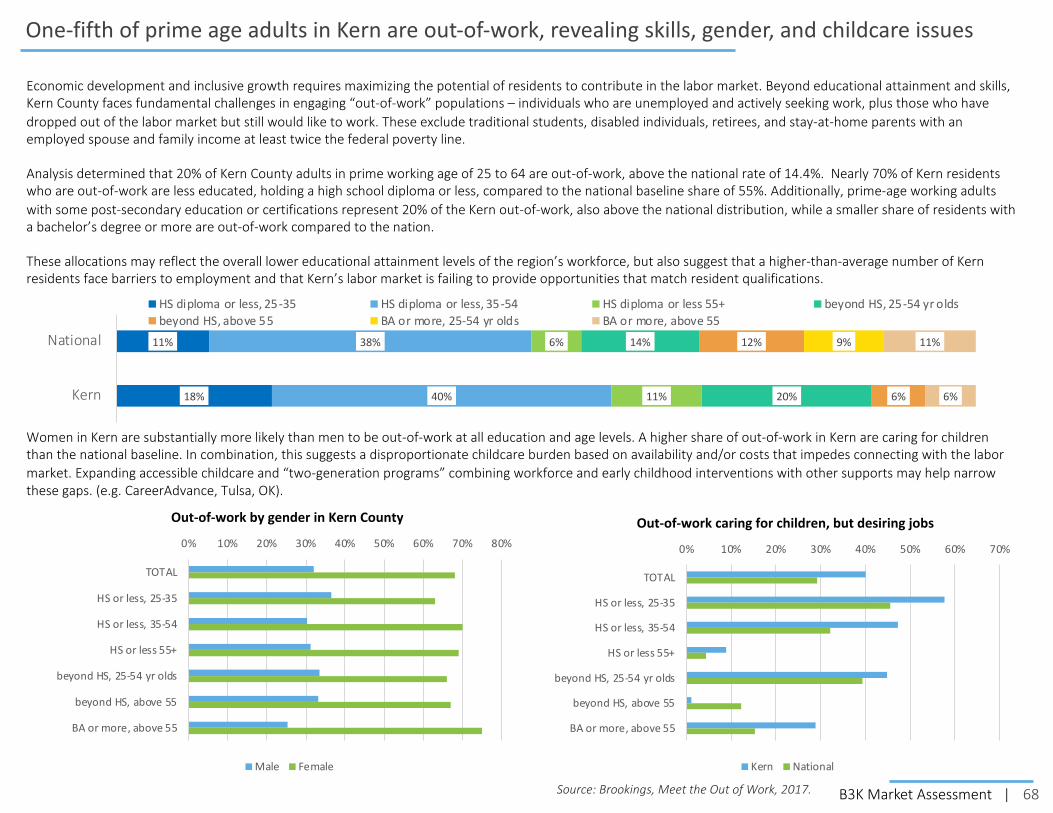
68B3K Market Assessment |
One-fifth of prime age adults in Kern are out-of-work, revealing skills, gender, and childcare issues
Economic development and inclusive growth requires maximizing the potential of residents to contribute in the labor market. Beyond educational attainment and skills, Kern County faces fundamental challenges in engaging “out-of-work” populations – individuals who are unemployed and actively seeking work, plus those who have dropped out of the labor market but still would like to work. These exclude traditional students, disabled individuals, retirees, and stay-at-home parents with an employed spouse and family income at least twice the federal poverty line.
Analysis determined that 20% of Kern County adults in prime working age of 25 to 64 are out-of-work, above the national rate of 14.4%. Nearly 70% of Kern residents who are out-of-work are less educated, holding a high school diploma or less, compared to the national baseline share of 55%. Additionally, prime-age working adults with some post-secondary education or certifications represent 20% of the Kern out-of-work, also above the national distribution, while a smaller share of residents with a bachelor’s degree or more are out-of-work compared to the nation.
These allocations may reflect the overall lower educational attainment levels of the region’s workforce, but also suggest that a higher-than-average number of Kern residents face barriers to employment and that Kern’s labor market is failing to provide opportunities that match resident qualifications.
0% 10% 20% 30% 40% 50% 60% 70%
TOTAL
HS or less, 25-35
HS or less, 35-54
HS or less 55+
beyond HS, 25-54 yr olds
beyond HS, above 55
BA or more, above 55
Out-of-work caring for children, but desiring jobs
Kern National
0% 10% 20% 30% 40% 50% 60% 70% 80%
TOTAL
HS or less, 25-35
HS or less, 35-54
HS or less 55+
beyond HS, 25-54 yr olds
beyond HS, above 55
BA or more, above 55
Out-of-work by gender in Kern County
Male Female
Women in Kern are substantially more likely than men to be out-of-work at all education and age levels. A higher share of out-of-work in Kern are caring for children than the national baseline. In combination, this suggests a disproportionate childcare burden based on availability and/or costs that impedes connecting with the labor market. Expanding accessible childcare and “two-generation programs” combining workforce and early childhood interventions with other supports may help narrow these gaps. (e.g. CareerAdvance, Tulsa, OK).
18%
11%
40%
38%
11%
6%
20%
14%
6%
12% 9%
6%
11%
Kern
National
HS diploma or less, 25-35 HS diploma or less, 35-54 HS diploma or less 55+ beyond HS, 25-54 yr oldsbeyond HS, above 55 BA or more, 25-54 yr olds BA or more, above 55
Source: Brookings, Meet the Out of Work, 2017.

69B3K Market Assessment |
Characteristics of out-of-work suggest some targeted interventions for populations and language
0% 10% 20% 30% 40% 50% 60%
TOTAL
HS or less, 25-35
HS or less, 35-54
HS or less 55+
beyond HS, 25-54 yr olds
beyond HS, above 55
BA or more, above 55
Out-of-work adults with Limited English Proficiency
Kern National
0% 10% 20% 30% 40% 50% 60% 70% 80%
TOTAL
HS or less, 25-35
HS or less, 35-54
HS or less 55+
beyond HS, 25-54 yr olds
beyond HS, above 55
BA or more, above 55
Proportion of total out-of-work adult cohort by race
White Black Hispanic Asian
Among working-age adults, white and Hispanic cohorts represent the largest share of the out-of-work in Kern County, consistent with their larger proportion of total residents.
This racial distribution of the out-of-work by age and education similarly reflects the characteristics of those demographics, with a bigger proportion of Hispanics in the younger and less-educated groupings versus whites in the older categories with more than a high school degree.
In general, the distribution of Black and Asian out-of-work residents is roughly aligned with County population shares. However, the proportion of out-of-work prime-age and moderately-educated Black residents is nearly double their share of County population.
These factors may justify revisiting the targeted outreach and services offered by workforce development and other providers focused on reengaging workers.
Overall, language barriers are less of an issue for most out-of-work Kern County residents than the national baseline comparison. The notable exception is adults aged 25-35 having a high school diploma or less, where more than 50% have limited English proficiency, presenting a distinctive barrier to labor market success.
This difference suggests a focus on customized interventions to improve English proficiency. Established models exist to provide this language training at worksites and online (including via mobile technology). Examples include programming from the Building Skills Partnership (active in seven California locations) and English Innovations, a combined in-person/online platform in Washington state supported by the Gates Foundation.
Source: Brookings, Meet the Out of Work, 2017.

70B3K Market Assessment |
One-quarter of young adults are out-of-work; childcare major issue to reengage moderately educated
Nearly one-quarter of Kern’s young adults aged 18 to 24 are out-of-work, compared to a national average of 17% in large metro areas. These counts exclude high school and college students, disabled individuals, and stay-at-home parents with an employed spouse and family income at least twice the federal poverty line.
The out-of-work challenge is particularly acute among less-educated young residents. Nearly three-quarters (73%) of Kern’s out-of-work young adults hold a high school diploma or less, higher than the national average of 62%. Conversely, the number of out-of-work Kern residents having a four-year degree is so small as to be statistically insignificant compared a national baseline of 6%, reinforcing the value and demand for higher educational attainment.
44%
37%
29%
25%
11%
17%
16%
15% 6%
Kern
National
HS diploma or less, 18-21 HS diploma or less, 22-24 beyond HS, 18-21 beyond HS, 22-24 BA degree
0% 10% 20% 30% 40% 50% 60% 70%
TOTAL
HS or less, 18-21
HS or less, 22-24
HS or less, 22-24
beyond HS, 22-24
Out-of-work young adults by gender
Male Female
0% 5% 10% 15% 20% 25% 30%
TOTAL
HS or less, 18-21
HS or less, 22-24
beyond HS, 18-21
beyond HS, 22-24
Kern National
Unlike adult population, disparities in gender are not as notable among young adults, although a diverging increase for women starts to emerge with age.
However, a much sharper differentiation for potential response is the childcare barrier. Across both out-of-work age groups, a notably higher share of better-educated young adults in Kern are caring for children than the national baseline, nearly double the amount. This suggests that lack of childcare access is blocking labor force participation, especially among a group with knowledge and skills.
Out-of-work young adults caring for children, by educational attainment
Source: Brookings, Meet the millions of young adults who are out of work, 2019.
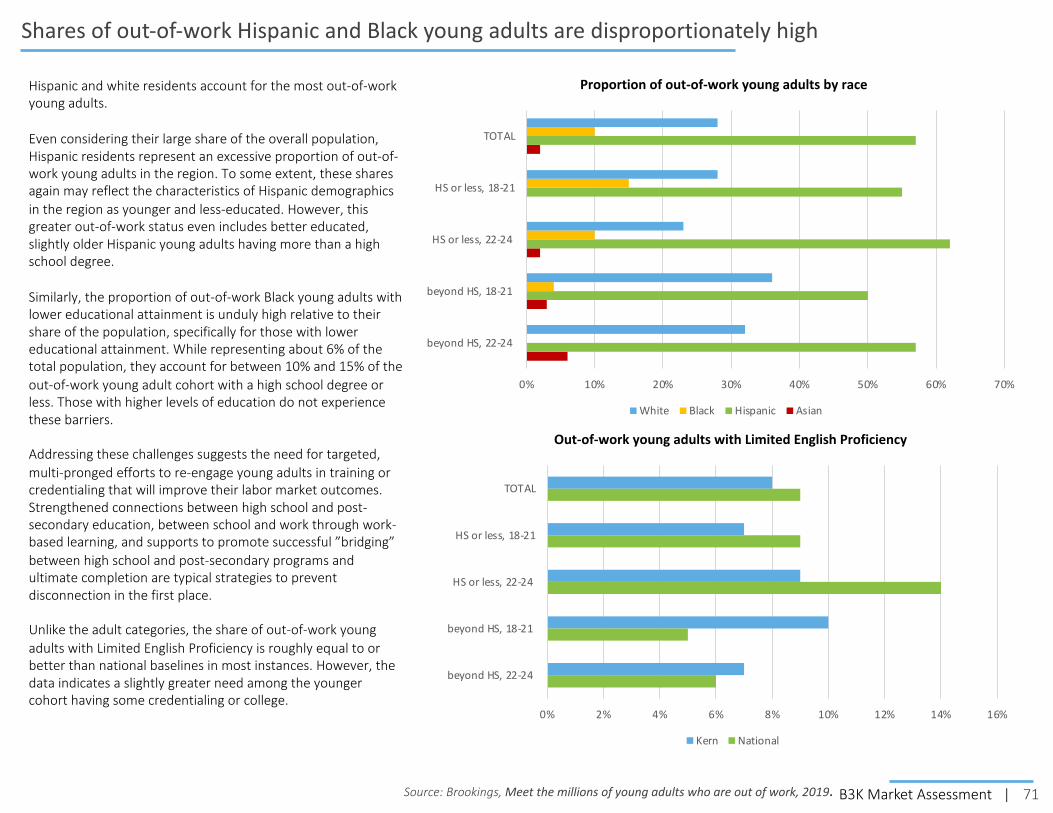
71B3K Market Assessment |
Shares of out-of-work Hispanic and Black young adults are disproportionately high
Hispanic and white residents account for the most out-of-work young adults.
Even considering their large share of the overall population, Hispanic residents represent an excessive proportion of out-of-work young adults in the region. To some extent, these shares again may reflect the characteristics of Hispanic demographics in the region as younger and less-educated. However, this greater out-of-work status even includes better educated, slightly older Hispanic young adults having more than a high school degree.
Similarly, the proportion of out-of-work Black young adults with lower educational attainment is unduly high relative to their share of the population, specifically for those with lower educational attainment. While representing about 6% of the total population, they account for between 10% and 15% of the out-of-work young adult cohort with a high school degree or less. Those with higher levels of education do not experience these barriers.
Addressing these challenges suggests the need for targeted, multi-pronged efforts to re-engage young adults in training or credentialing that will improve their labor market outcomes. Strengthened connections between high school and post-secondary education, between school and work through work-based learning, and supports to promote successful ”bridging” between high school and post-secondary programs and ultimate completion are typical strategies to prevent disconnection in the first place.
Unlike the adult categories, the share of out-of-work young adults with Limited English Proficiency is roughly equal to or better than national baselines in most instances. However, the data indicates a slightly greater need among the younger cohort having some credentialing or college.
0% 2% 4% 6% 8% 10% 12% 14% 16%
TOTAL
HS or less, 18-21
HS or less, 22-24
beyond HS, 18-21
beyond HS, 22-24
Out-of-work young adults with Limited English Proficiency
Kern National
0% 10% 20% 30% 40% 50% 60% 70%
beyond HS, 22-24
beyond HS, 18-21
HS or less, 22-24
HS or less, 18-21
TOTAL
Proportion of out-of-work young adults by race
White Black Hispanic Asian
Source: Brookings, Meet the millions of young adults who are out of work, 2019.

72B3K Market Assessment |
Kern lags comparison regions in tech employment growth and mid-tech opportunities
Outside of the major high-tech hubs like Silicon Valley, Seattle, and DC, there is promising growth in a middle-skill portion of technology-based jobs, accessible to workers without a bachelor’s degree. The core occupations include computer network architects (52%), support specialists (50%), and systems analysts (31%), and to a lesser extent programmers and security analysts (22%).
High-tech hubs where Big Tech is headquartered and creative leaps are made actually employ lower concentrations of mid-tech workers. Regions with more mid-tech work revolve around applications, buildouts, and backoffice opportunities. Some bias is associated with the presence of government and higher education institutions with large digital networks. The strongest locations in scale and growth are in mid-size Midwest metros, linked to support for advancing tech and digital skill demands in other industries.
Kern had both a relatively small proportion of mid-tech jobs and a zero compound annual growth in jobs over five years, which is an unusual combination against economic peers or aspirational regions. The lower share of jobs could be associated with the disproportionately high-tech job presence in East Kern. However, the absence of growth in mid-tech jobs may suggest some combination of an existing industrial mix with low tech adoption, lack of diversification in business, professional, and back-office services, and talent constraints; all of which could be targeted to bring the region more in line with these opportunities.
25.7%24.6% 23.8%
22.6% 21.6% 21.5% 21.3% 20.5% 20.0%17.9%
15.7% 15.3%13.8%
23.1% 23.0%
20.1%
3.8%
-5.0%
3.6% 4.0% 4.2%
-0.9%
6.3%3.8%
9.7%
0.0%
4.2%
-4.6%
2.4%
5.6%4.2%
-2.3%
-10.0%
-5.0%
0.0%
5.0%
10.0%
15.0%
20.0%
25.0%
30.0%
Spokan
e, WA
Stockt
on, CA
Omaha, N
E
Tulsa
, OK
Fresno, C
A
Albuquerque
, NM
Syracuse,
NY
Salina
s, CA
Oxnard
, CA
Bakersf
ield, CA
Oklahoma C
ity, O
K
Modesto
, CA
Boise City
, ID
Indianap
olis, IN
Kansas C
ity, M
O
San Antonio,
TX
Mid-tech share of regional computer and mathematical employment
Mid-Tech Job Share, 2016 Mid-Tech Job CAGR, 2012-16
Source: Brookings, ”Could ‘mid-tech’ jobs elevate more people and non-coastal places?”, 2018.

73B3K Market Assessment |
Digital skills among workers are a challenge and opportunity
62%
41%
35%
43%
3%
16%
2002 2016
Share of regional jobs requiring various digital skill levels, 2002-2016
Low Medium High
32.5%
44.4%
23.2%
Risk of automation for job tasks
"High risk" job share
"Medium risk" job share
"Low risk" job share
Despite the lack of tech job growth, regional employers are demanding workers with more digital skills and technology aptitudes across other job functions – whether in agriculture, logistics, or business services.
The share of Kern jobs requiring either medium or high levels of digital skills increased from 38% to 59% over 14 years. While this is very significant for workers, it actually ranks among the lowest levels of overall change among large metropolitan areas. With a high correlation between income and occupational digital skill requirements, the smaller relative impact on the County again indicates less advancement in technological advantage and the economic opportunities that brings.
At the same time, Kern has an above-average proportion of job tasks that are at medium risk of automation versus economic peers, although fewer high-risk jobs. This suggests an urgency for improving the digital skills base for the region, both to take advantage of current potential and prepare for future demands.
Sources: Brookings, Digitalization and the American Workforce, 2017; Automation and artificial intelligence: How machines are affecting people and places, 2019.

74B3K Market Assessment |
Notable unmet demand for mid-tech and high-tech talent, indicating need for digital skills
Source: Analysis of Economic Modeling Systems Inc. data, 2020
• approximately 760 unique postings per year• split evenly between Greater Bakersfield and East Kern• primarily computer systems analysts, plus network architects
and support specialists• top hard skills in programming languages (SQL), business
processes and requirements, computer science, information systems, systems analysis, data analysis, project management
• main certifications sought in CompTIA Security, ITL, IAT Level II, Cisco Network Associate, Project Management
• frequent BA screen, despite occupational functions typically not requiring a degree
• approximately 6700 unique postings per year• almost evenly split, with 3% more in East Kern• predominantly software engineers and developers, systems
and network administrators, information security• top hard skills in computer science, software engineering,
programming languages (SQL + Java), operating systems, software development
• main certifications sought in CompTIA Security / Network, Certified Information Services Professional, IAT Level II, Microsoft Systems Administrator / Engineer, GIAC, Cisco Network Associate, DOD Information Assurance
1 in 5mid-tech positions filled per month
1 in 10high-tech positions filled per month
Mid-tech job postings by industry
Professional +Administrative
Manufacturing
Health
Education
Agriculture
PublicAdministration
High-tech job postings by industry
Professional +Administrative
Manufacturing
Health
Information
Education
Public Administration
Analysis of monthly job postings and hires indicates major workforce gaps in digital skills, industry needs, differentiation in demand between Greater Bakersfield and East Kern, and business hiring practices that unnecessarily exclude middle-skill workers.
75B3K Market Assessment |
Competitiveness Drivers: Innovation
Why innovation matters:
A region’s innovative capacity represents the ability to create new value, uncover new products and services, start new businesses, adopt solutions to improve productivity, and adapt to rapid technological change.
Four areas – research and development, commercialization, entrepreneurial dynamism, and advanced industrial production – mark the most competitive, diversified regional economies.

76B3K Market Assessment |
California State University, Bakersfield R&D expenditures by source of fundingFrom 2009 to 2018, in millions
The region lags peers in open institutional research assets
Federal government$13.5M
52%Institution funds
$8.03M31%
State and local government
$1.68 7%
Business$0.61
2%
Nonprofit organizations
$0.31 1%
All other sources$1.89
7%
0.99
1.46
1.12
0.46
0.21
Federal government Institution State and local government Business Nonprofit organizations
Relative concentration of CSU Bakersfield’s R&D expenditures by source of fundingCompared to all U.S. research universities
U.S. ave.
Source: Brookings analysis of National Science Foundation’s Higher Education R&D Survey microdata.
Academic expenditures on research and development are a helpful indicator of the level and nature of institutional capacity within a region. In most regions, a university is the most significant performer of R&D.
• CSU Bakersfield spent just $26 million on R&D from 2009 to 2018. This is a very small amount of academic R&D expenditure for an economy the size of the Bakersfield-Kern region. In contrast, CSU Fresno spent $77 million and CSU San Bernardino spent over $100 million; University of Nebraska – Omaha spent $90 million; and University of Oklahoma –Tulsa spent $22 million over only five years.
• About half of CSU Bakersfield funding for its R&D expenditures came from the federal government. This level is commensurate with the average among U.S. research universities.
• CSU Bakersfield reallocated other sources of income toward R&D. CSU Bakersfield was its own second-largest source of R&D funding. The university invested more of its own income from other sources into R&D to complement its external income for R&D. This practice is not uncommon among public universities.
• Together, state and local government represent an atypically large share of investment in the university’s R&D. These sources funded about 7% of CSU Bakersfield’s R&D expenditures during this period—an above-average proportion compared to all U.S. research universities.
• The university receives relatively little funding from business or nonprofit groups for its R&D. Recognizing CSU Bakersfield’s core mission and capabilities, this still is a very low level of support compared to peers, creating a major gap in translational R&D and applied problem-solving that would lead to commercialization regional economic benefits.
Although CSU Bakersfield is the largest source of “open” R&D in Kern County, a significant portion of the county’s R&D capacity resides outside academia. As home to military bases, military contractors, and portions of the U.S. aerospace industry, it contains unique R&D capacities in a diverse set of institutions not found in other regions.

77B3K Market Assessment |
Despite CSU Bakersfield’s relatively small amount of spending on R&D, those activities are highly concentrated in select fields and subfields of science. They appear closely aligned with Kern’s specializations in oil and gas drilling, but also computer science and operations that belie the lack of tech-related firms and digital skills in the region beyond military assets.
• The field of mathematics and computer science is the university’s most outsized area of R&D expenditures. This field represents 3.4 times as much of CSU Bakersfield’s R&D expenditures than the national average. Further, the university is “specialized” in every math and computer science subfield, especially math and statistics, which represents over 14 times as much of the university’s total R&D expenditures than the national average.
• Life and earth sciences is the university’s second-most outsized area of R&D expenditures. Nearly all spending in this field is in environmental sciences, which includes geochemistry, geophysics, and environmental engineering disciplines closely related to oil and gas drilling and exploration, as well as life sciences such as ecology and mycology.
• The university undertakes R&D in physical sciences and engineering that complements its other specialties. The university’s near or above-average R&D expenditures in chemistry and electrical engineering may complement or converge with its research in environmental sciences and computer science.
• CSU Bakersfield boasts large R&D capacity in the social sciences and humanities. The analyses shown on Slide 81 suggest that the university’s strengths in psychology, sociology, and business and economics may converge with the university’s strengths in computer science and environmental sciences.
Relative concentration of CSU Bakersfield’s R&D expenditures by scientific field and subfield*Compared to all U.S. research universities
CSU Bakersfield’s R&D spending reflects the county’s economic specialties
0.0
1.0
2.0
3.0
4.0
5.0
6.0
7.0
Mat
h an
d co
mpu
ter s
cienc
eM
ath
and
stat
istic
sOt
her m
ath
and
com
pute
r scie
nce
Com
pute
r scie
nces
Life a
nd ea
rth
scie
nces
Envi
ronm
enta
l scie
nces
Agric
ultu
ral s
cienc
esOt
her l
ife an
d ea
rth sc
i.
Socia
l scie
nces
and
hum
aniti
esAr
ts a
nd h
uman
ities
Psyc
holo
gySo
ciolo
gyBu
sines
s and
eco
nom
icsOt
her s
ocia
l sci.
and
hum
aniti
esM
edia
and
com
mun
icat
ions
Polit
ical s
cienc
eLa
w
Phys
ical s
cienc
es an
d en
ginee
ring
Chem
istry
Elec
trica
l eng
inee
ring
Phys
icsCh
emica
l eng
inee
ring
Mat
eria
ls en
ginee
ring
Othe
r phy
sical
sci.
Astro
phys
icsAe
rosp
ace
engi
neer
ing
Civi
l eng
inee
ring
Indu
stria
l eng
inee
ring
Mec
hani
cal e
ngin
eerin
g
Biom
edica
l and
hea
lth sc
ienc
esBi
omed
ical s
cienc
esHe
alth
scie
nces
Med
ical e
ngin
eerin
g
Conc
entr
atio
n (L
Q) o
f R&
D ex
pend
iture
s rel
ativ
e to
all
U.S
. res
earc
h un
iver
sitie
s
Major field Sub-field
* Excludes capital expenditures.Source: Brookings analysis of National Science Foundation’s Higher Education R&D Survey microdata.
~14.0

78B3K Market Assessment |
Number of peer-reviewed scholarly articles published by Kern County institutionsFrom 2001 to 2020
Source: Brookings analysis of Clarivate data.
Kern County research institutions publish very small amounts of open scholarship
881
280
175 175
11
770
0
100
200
300
400
500
600
700
800
900
1,000
CSU Bakers field U.S. Departmentof Defense
Naval Air WeaponsStation
Kern MedicalCenter
Bakersfield College Otherorganizations
Another strong basis for assessing innovation capabilities of public and private entities within a region is publication of research results in peer-reviewed scholarly articles.
Innovation strengths and areas of new opportunity can be identified by examining the content, volume, concentration, relative impact, and convergence of scholarly articles published by institutions within Kern County and adjacent to military assets in East Kern.
These analyses can only look at “open” articles; defense DOD installations and military contractors also perform groundbreaking research that cannot be published.
• Altogether, regional institutions only published 2,300 articles over roughly two decades. This is an extremely low amount of scholarship for a region of this size. In fact, on a per-capita basis, that is about 12% of the U.S. metro average.
• CSU Bakersfield is the county’s most prolific single research institution in terms of volume of published scholarship. The university published 881 scholarly articles over nearly 20 years.
• U.S. military institutions were the second largest source of scholarship published from Kern County. The Naval Air Weapons Station (NAWS) at China Lake was the anchor for federal research scholarship for the county. Divisions of the U.S. Department of Defense including the Army, Navy, and Air Force jointly or independently published research with NAWS.
• Kern Medical Center in Bakersfield published 175 scholarly articles. This volume rivaled other significant research entities in the county, but not compared against major medical institutions in general.
• A large and diverse collection of other entities also publish research. For example, Chevron, Aera Energy, military contractors, Bakersfield Dermatology, and some other groups published a few scholarly articles per year, on average, explicitly associated with Kern as the source of the authorship.

79B3K Market Assessment |
The scholarship that Kern County does produce is highly concentrated in select fields of science. The volume of that published research output by scientific subfield can be mapped against the relative impact of the work as measured by global citations in other publications and patents.
• Kern County’s research institutions and organizations publish outsized amounts of research in select engineering disciplines, including environmental engineering, chemical engineering, and mechanical engineering. Each of these subfields accounts for more than twice as much of the region’s scholarship than the national average, and at least 1.4 times as much of the region’s citations.
• Research also specializes in most subfields within life and earth sciences, consistent with R&D spending. In terms of total scholarly output or impact, the region specializes in 10 out of 11 subfields of life and earth sciences. These subfields relate to geosciences, agriculture, and ecology – disciplines complementary to the major economic drivers, and potentially the basis for adjacencies in the oil and gas sector.
• Military installations and CSU Bakersfield produce strengths in decision sciences and “other engineering.” These subfields are categorized within the field of mathematics and computer sciences, but in fact reflect interdisciplinary disciplines related to operations research, artificial intelligence, cybernetics, and electrical engineering.
• CSU Bakersfield output in the social sciences and humanities results in above-average impact, most significantly in history, geography, and philosophy.
Concentration of Kern County’s “open” scholarship by scientific subfieldPeer-reviewed articles published from 2001 to 2020
0.00
0.50
1.00
1.50
2.00
2.50
3.00
3.50
4.00
4.50
5.00
0.00 0.50 1.00 1.50 2.00 2.50 3.00 3.50 4.00 4.50 5.00
Conc
entr
atio
n (L
Q) o
f cita
tions
of p
eer-
revi
ewed
art
icle
s rel
ativ
e to
nat
iona
l ave
rage
Concentration (LQ) of peer-reviewed articles relative to national average
Biomedical and health sciences Mathematics and computer science Social sciences and humanitiesPhysical sciences and engineering Life and earth sciences
Source: Brookings analysis of Clarivate data.
Research scholarship in the region is highly concentrated in select subfields
History
Geography
“Other engineering”Agriculture
Mechanical engineering
Chemical engineering
Environmental engineering
Decision sciences
Earth and environmentalsciences
Veterinary sciences
Philosophy
Size conveys number of publications
High
er im
pact
Higher productivity

80B3K Market Assessment |
0.00
1.00
2.00
3.00
4.00
5.00
6.00
7.00
8.00
9.00
10.00
11.00
Engi
neer
ing,
petr
oleu
mEn
gine
erin
g, ae
rosp
ace
Engi
neer
ing,
mar
ine
Ther
mod
ynam
icsEn
gine
erin
g, oc
ean
Engi
neer
ing,
mec
hani
cal
Engi
neer
ing,
mul
tidisc
iplin
ary
Spec
tros
copy
Engi
neer
ing,
chem
ical
Phys
ics, m
athe
mat
ical
Ener
gy &
fuel
s
Ento
mol
ogy
Zool
ogy
Plan
t scie
nces
Ecol
ogy
Biod
ivers
ity co
nser
vatio
nM
ycol
ogy
Geol
ogy
Pale
onto
logy
Geoc
hem
istry
& ge
ophy
sics
Min
eralo
gyGe
osci
ence
s, m
ultid
iscip
linar
yGe
ogra
phy,
phy
sical
Wat
er re
sour
ces
Envi
ronm
enta
l scie
nces
Fore
stry
Hort
icultu
reVe
terin
ary s
cienc
esAg
rono
my
Agric
ultu
re, m
ultid
iscip
linar
ySo
il scie
nce
Engi
neer
ing,
man
ufac
turin
gEn
gine
erin
g, in
dust
rial
Oper
atio
ns re
sear
chM
athe
mat
ics
Impa
ct: C
once
ntra
tion
of c
itatio
ns o
f t p
eer-
revi
ewed
art
icle
s rel
ativ
e to
nat
iona
l ave
rage
Concentration of citations of Kern County’s “open” scholarship by scientific disciplineCitations of peer-reviewed articles published from 2001 to 2020
Source: Brookings analysis of Clarivate data.
The region’s research scholarship aligns tightly with current and potential economic specializations
Engineering Biology Environmental science Agriculture Math
Going one level deeper – from subfields to scientific disciplines within these subfields – affirms more notable and complementary specializations within the region’s body of research scholarship.
Again, these disciplines represent both an outsized volume of regional scholarship output and an outsized portion of its global citations.
• Engineering disciplines account for among the largest portions of the region’s impact, and those closely related to economic strengths are its most specialized in terms of scholarly impact. Petroleum engineering and aerospace engineering account for more than 9.5 times as much of the Kern’s scholarly citations compared to the national average.
• The region is especially impactful in virtually all the disciplines within the field of life and earth sciences. From geosciences to biology and ecology to agriculture, research institutions, led by CSU Bakersfield, produce disproportionate impact in each. Strengths in geochemistry, geophysics, physical geography, and basic geology all link with existing oil and gas activities, but also other adjacent parts of the value-chain.
• Kern County’s research institutions are especially impactful in interdisciplinary mathematics and computer sciences. These are something of a cross-institution area of strength-- both the university and the military installations produce substantial research in these disciplines. Specifically, manufacturing engineering, industrial engineering, and operations research are prominent, and afford capabilities and connections to sectoral growth targets in the region.

81B3K Market Assessment |
Source: Brookings analysis of Clarivate data.
Kern County features converging research strengths in engineering disciplines
Physical sciences and engineeringBiomedical and health sciencesMathematical and computer scienceLife and earth sciencesSocial sciences and humanitiesSize conveys relative concentration (LQ)
Kern County’s unique network of cross-disciplinary “open” scholarshipPeer-reviewed articles published from 2001 to 2020
The value of research and innovation capabilities in regional economic development is often for competitiveness and advancement of a particular industry strength, but the greatest benefit is finding new sector and commercial potential.
Those opportunities typically arise from relationships across disciplines, indicated by connections between scholarly publications. This convergence can signal emerging areas of science and technology with leverageable advantages for developing new products, services, and clusters.
Analyzing cross-disciplinary publications associated with the region can identify connections between disciplines where the volume of scholarship is especially large relative to the average across the state of California. Often, these connections can also be identified with other metro economies in the U.S. and globally; however the limited volume of open scholarship produced in the region could not uncover robust links.
• The region’s strengths in social sciences and humanities are sprawling and linked to unusual commercial disciplines. Unique connections exist between scholarship in philosophy, public administration, and medical ethics, for example, some of which are strongly connected to fields within biomedical and health sciences. Other social science disciplines converge with computer science, such as experimental psychology, applied psychology, and management.
• Physical science and engineering are tightly linked in several clusters -- energy engineering, mechanical engineering, and thermodynamics; and another around materials sciences. The former is especially associated with other specializations in computer science and an array of environmental sciences.
• Life and earth science disciplines are especially convergent across other fields. The environmental sciences within this field converge with aspects of physical sciences and engineering and, surprisingly, humanities disciplines. For example, biological disciplines and veterinary sciences converge with biomedical and health sciences.
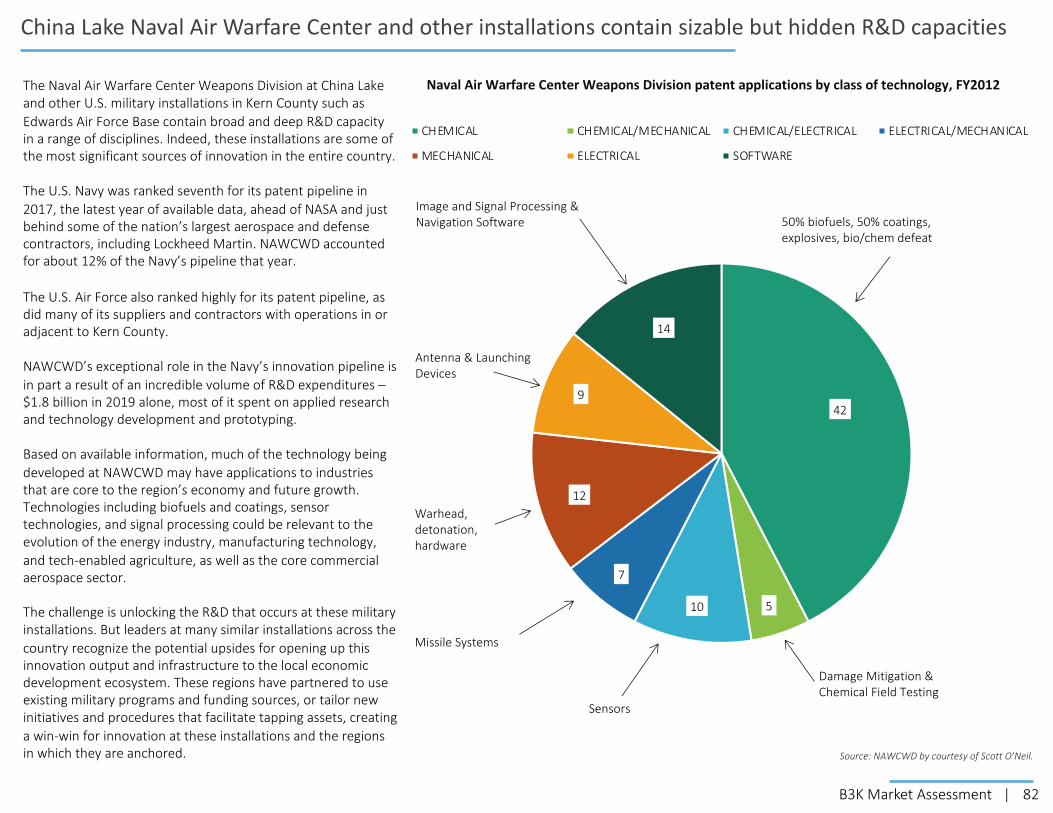
82B3K Market Assessment |
China Lake Naval Air Warfare Center and other installations contain sizable but hidden R&D capacities
Naval Air Warfare Center Weapons Division patent applications by class of technology, FY2012
Source: NAWCWD by courtesy of Scott O’Neil.
42
510
7
12
9
14
CHEMICAL CHEMICAL/MECHANICAL CHEMICAL/ELECTRICAL ELECTRICAL/MECHANICAL
MECHANICAL ELECTRICAL SOFTWARE
50% biofuels, 50% coatings, explosives, bio/chem defeat
Antenna & Launching Devices
Image and Signal Processing & Navigation Software
Warhead, detonation, hardware
Missile Systems
Sensors
Damage Mitigation & Chemical Field Testing
The Naval Air Warfare Center Weapons Division at China Lake and other U.S. military installations in Kern County such as Edwards Air Force Base contain broad and deep R&D capacity in a range of disciplines. Indeed, these installations are some of the most significant sources of innovation in the entire country.
The U.S. Navy was ranked seventh for its patent pipeline in 2017, the latest year of available data, ahead of NASA and just behind some of the nation’s largest aerospace and defense contractors, including Lockheed Martin. NAWCWD accounted for about 12% of the Navy’s pipeline that year.
The U.S. Air Force also ranked highly for its patent pipeline, as did many of its suppliers and contractors with operations in or adjacent to Kern County.
NAWCWD’s exceptional role in the Navy’s innovation pipeline is in part a result of an incredible volume of R&D expenditures –$1.8 billion in 2019 alone, most of it spent on applied research and technology development and prototyping.
Based on available information, much of the technology being developed at NAWCWD may have applications to industries that are core to the region’s economy and future growth. Technologies including biofuels and coatings, sensor technologies, and signal processing could be relevant to the evolution of the energy industry, manufacturing technology, and tech-enabled agriculture, as well as the core commercial aerospace sector.
The challenge is unlocking the R&D that occurs at these military installations. But leaders at many similar installations across the country recognize the potential upsides for opening up this innovation output and infrastructure to the local economic development ecosystem. These regions have partnered to use existing military programs and funding sources, or tailor new initiatives and procedures that facilitate tapping assets, creating a win-win for innovation at these installations and the regions in which they are anchored.

83B3K Market Assessment |
Kern lags economic peers in utility patent generation, but with above-median distinction
The region generates a below-average number of patents compared to its economic and size peers, as well as larger aspirational “middleweight” regions, even accounting for the absence of a Tier 1 research university (e.g. Omaha, Ogden, Spokane, Indianapolis, Kansas City). However, military-associated patents like those produced at China Lake are difficult to assign and compare consistently attached to the specific locations that generate them, so likely are underreported for the region.
Despite the low volume, the distinctiveness of the patents generated in the region is slightly above the median among all metro areas. This “knowledge complexity index” (KCI) metric is based on the ubiquity versus novelty of the patent content. Taking into account the novelty of military intellectual property, both the output and the KCI assigned to the region is likely understated.
This further reinforces the potential and importance for (1) bringing existing innovation and financing tools “off base” for commercialization (2) accessing base resources, and (3) investing in new private-public innovation capabilities and activities highly focused on sector priorities.
0
0.2
0.4
0.6
0.8
1
1.2
1.4
0
0.05
0.1
0.15
0.2
0.25
0.3
0.35
0.4
0.45
0.5
Albuquerque
, NM
Omaha, N
E
Syracuse,
NY
Oklahoma C
ity, O
K
Ogden
, UT
Spokan
e, WA
Bakersf
ield, CA
El Paso
,TX
Tulsa
, OK
Indianap
olis, IN
Kansas C
ity, M
O-KS
San Antonio,
TX
Patent output and novelty among peer economies and aspirational middleweights
patents per 1000 workers Knowledge Complexity Index
Know
ledg
e Co
mpl
exity
Inde
xPatents per 1000 w
orkers
* Note: Fresno ranks similarly to Bakersfield. Boise is excluded as an extreme outlier in both productivity and complexity, driven by two major computer innovators (HP and Micron Technology). Oxnard also overproduces based on the concentration of Amgen and other biotech companies.
Source: Analysis of USPTO data, Kogler and Rigby.
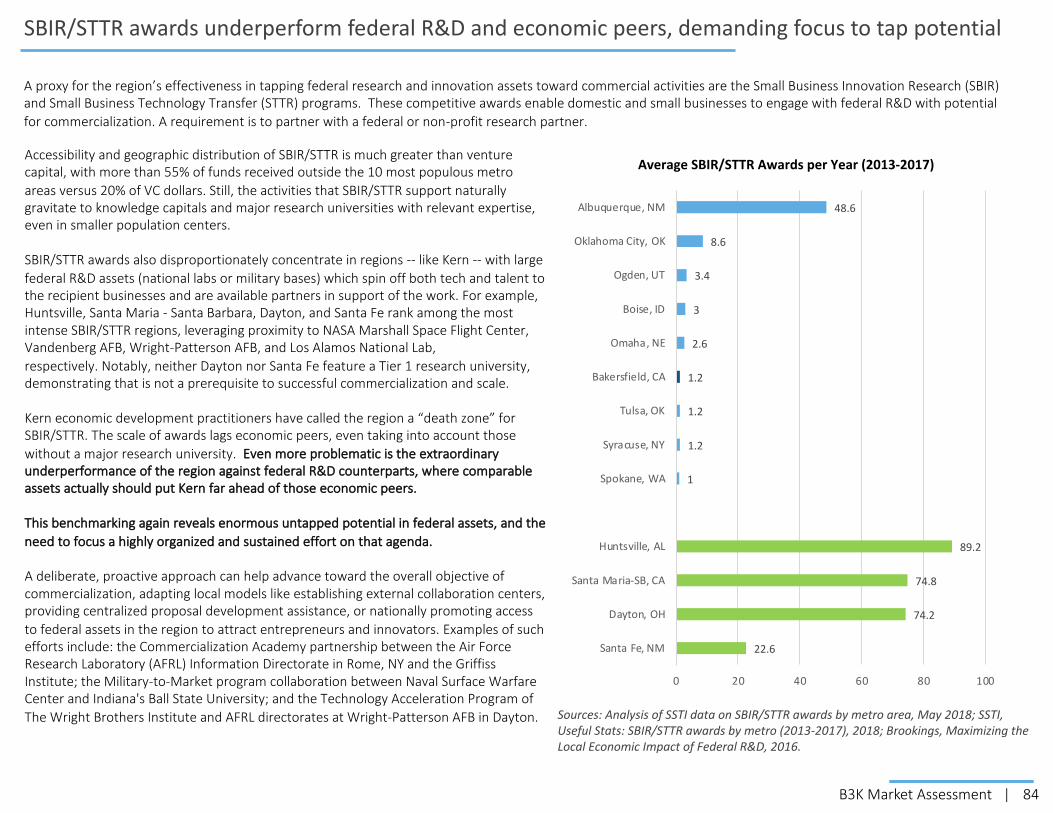
84B3K Market Assessment |
SBIR/STTR awards underperform federal R&D and economic peers, demanding focus to tap potential
Accessibility and geographic distribution of SBIR/STTR is much greater than venture capital, with more than 55% of funds received outside the 10 most populous metro areas versus 20% of VC dollars. Still, the activities that SBIR/STTR support naturally gravitate to knowledge capitals and major research universities with relevant expertise, even in smaller population centers.
SBIR/STTR awards also disproportionately concentrate in regions -- like Kern -- with large federal R&D assets (national labs or military bases) which spin off both tech and talent to the recipient businesses and are available partners in support of the work. For example, Huntsville, Santa Maria - Santa Barbara, Dayton, and Santa Fe rank among the most intense SBIR/STTR regions, leveraging proximity to NASA Marshall Space Flight Center, Vandenberg AFB, Wright-Patterson AFB, and Los Alamos National Lab, respectively. Notably, neither Dayton nor Santa Fe feature a Tier 1 research university, demonstrating that is not a prerequisite to successful commercialization and scale.
Kern economic development practitioners have called the region a “death zone” for SBIR/STTR. The scale of awards lags economic peers, even taking into account those without a major research university. Even more problematic is the extraordinary underperformance of the region against federal R&D counterparts, where comparable assets actually should put Kern far ahead of those economic peers.
This benchmarking again reveals enormous untapped potential in federal assets, and the need to focus a highly organized and sustained effort on that agenda.
A deliberate, proactive approach can help advance toward the overall objective of commercialization, adapting local models like establishing external collaboration centers, providing centralized proposal development assistance, or nationally promoting access to federal assets in the region to attract entrepreneurs and innovators. Examples of such efforts include: the Commercialization Academy partnership between the Air Force Research Laboratory (AFRL) Information Directorate in Rome, NY and the Griffiss Institute; the Military-to-Market program collaboration between Naval Surface Warfare Center and Indiana's Ball State University; and the Technology Acceleration Program of The Wright Brothers Institute and AFRL directorates at Wright-Patterson AFB in Dayton. Sources: Analysis of SSTI data on SBIR/STTR awards by metro area, May 2018; SSTI,
Useful Stats: SBIR/STTR awards by metro (2013-2017), 2018; Brookings, Maximizing the Local Economic Impact of Federal R&D, 2016.
22.6
74.2
74.8
89.2
1
1.2
1.2
1.2
2.6
3
3.4
8.6
48.6
0 20 40 60 80 100
Santa Fe, NM
Dayton, OH
Santa Maria-SB, CA
Huntsville, AL
Spokane, WA
Syracuse, NY
Tulsa, OK
Bakersfield, CA
Omaha, NE
Boise, ID
Ogden, UT
Oklahoma City, OK
Albuquerque, NM
Average SBIR/STTR Awards per Year (2013-2017)
A proxy for the region’s effectiveness in tapping federal research and innovation assets toward commercial activities are the Small Business Innovation Research (SBIR) and Small Business Technology Transfer (STTR) programs. These competitive awards enable domestic and small businesses to engage with federal R&D with potential for commercialization. A requirement is to partner with a federal or non-profit research partner.
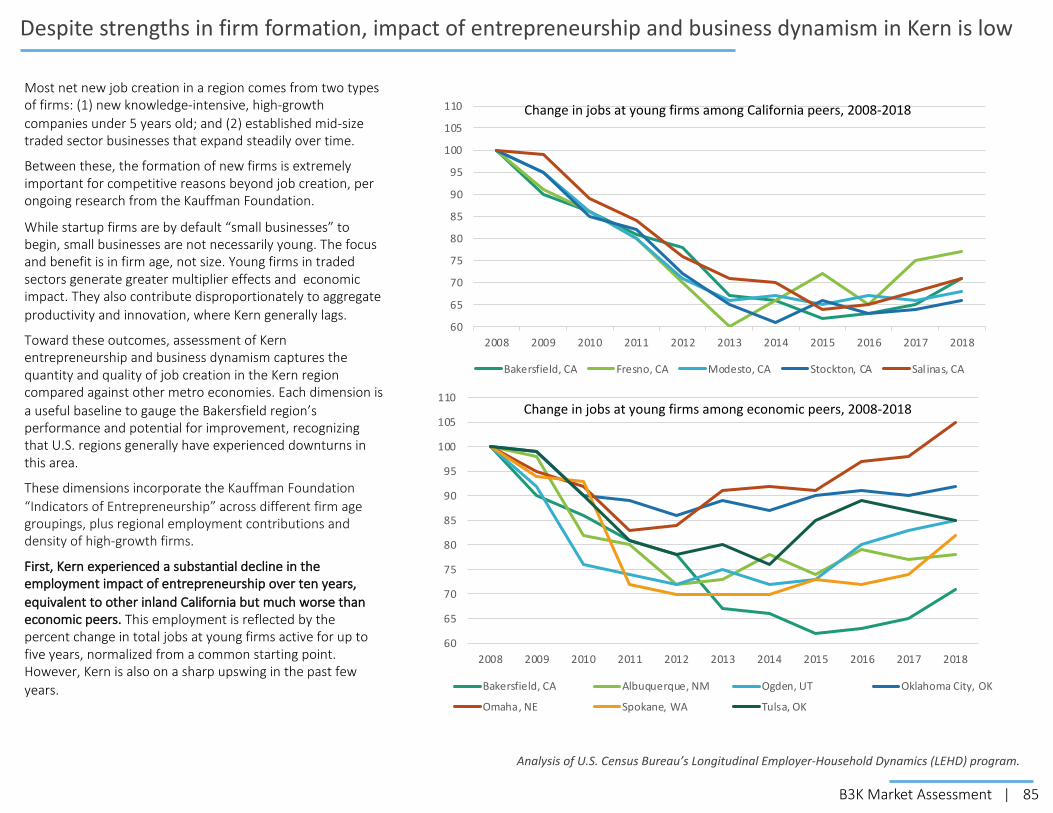
85B3K Market Assessment |
Despite strengths in firm formation, impact of entrepreneurship and business dynamism in Kern is low
Most net new job creation in a region comes from two types of firms: (1) new knowledge-intensive, high-growth companies under 5 years old; and (2) established mid-size traded sector businesses that expand steadily over time.
Between these, the formation of new firms is extremely important for competitive reasons beyond job creation, per ongoing research from the Kauffman Foundation.
While startup firms are by default “small businesses” to begin, small businesses are not necessarily young. The focus and benefit is in firm age, not size. Young firms in traded sectors generate greater multiplier effects and economic impact. They also contribute disproportionately to aggregate productivity and innovation, where Kern generally lags.
Toward these outcomes, assessment of Kern entrepreneurship and business dynamism captures the quantity and quality of job creation in the Kern region compared against other metro economies. Each dimension is a useful baseline to gauge the Bakersfield region’s performance and potential for improvement, recognizing that U.S. regions generally have experienced downturns in this area.
These dimensions incorporate the Kauffman Foundation “Indicators of Entrepreneurship” across different firm age groupings, plus regional employment contributions and density of high-growth firms.
First, Kern experienced a substantial decline in the employment impact of entrepreneurship over ten years, equivalent to other inland California but much worse than economic peers. This employment is reflected by the percent change in total jobs at young firms active for up to five years, normalized from a common starting point. However, Kern is also on a sharp upswing in the past few years.
60
65
70
75
80
85
90
95
100
105
110
2008 2009 2010 2011 2012 2013 2014 2015 2016 2017 2018
Change in jobs at young firms among California peers, 2008-2018
Bakersfield, CA Fresno, CA Modesto, CA Stockton, CA Sal inas, CA
60
65
70
75
80
85
90
95
100
105
110
2008 2009 2010 2011 2012 2013 2014 2015 2016 2017 2018
Change in jobs at young firms among economic peers, 2008-2018
Bakersfield, CA Albuquerque, NM Ogden, UT Oklahoma City, OK
Omaha, NE Spokane, WA Tulsa, OK
Analysis of U.S. Census Bureau’s Longitudinal Employer-Household Dynamics (LEHD) program.

86B3K Market Assessment |
Kern young firms excel in private job creation, but cannot sustain quality and durability of jobs
Second, Kern tops economic peers in “contribution” of jobs by young firms, and by a substantial margin, counter to lagging overall change in number of jobs at young firms. Kauffman defines contribution as the proportion of the total private sector jobs in a region attributable to young firms at each age segment up to five years. Counter to lagging overall change in number of jobs at young firms, Kern has outperformed national baselines and countered general downward trends in contribution. This indicates relative strength in new firm formation.
Third, Kern ranks low in “compensation” for jobs in young firms, by a notable amount, although improves its position over time. Kauffman measures compensation as the percentage of earnings a typical job in young firm in the region offers relative to a typical private sector job in a business of any age nationally. Jobs at new firms are expected to pay substantially less than a national standard, and may also be influenced by localized cost of living, but the gap suggests that many firms started may not be knowledge-based or well-resourced for durability.
Fourth, Kern jobs created at young firms are destroyed most rapidly, ranking at the bottom for job “constancy” among peers. Kauffman tracks constancy as the share of jobs in firms at each age segment that last more than three consecutive quarters; for example, only 29% of jobs created at Kern firms under two years-old survived beyond nine months. Durability of jobs is less than half or 2/3 the rate of peers in each of the age segments, thus losing the advantages in firm formation.
Composite comparisons across economic regions can be ranked by the Kauffman “Jobs Quality-Quantity Index.” This aggregates and equally weights the indicators of job contribution, earnings compensation, and constancy of jobs to provide a comprehensive picture of job-related dynamics in young firms within a geographic area. Blending these attributes, Kern is lowest among peers.
0-1 yrs 2-3 yrs 4-5 yrs Kauffman IndexBoise, ID 3.79% 4.33% 4.03% 1Oklahoma City, OK 3.21% 4.50% 3.66% 1Omaha, NE 3.54% 3.42% 3.23% 1Spokane, WA 3.53% 4.20% 3.61% 1Albuquerque, NM 2.76% 3.29% 3.62% 0.99Syracuse, NY 2.35% 2.84% 2.34% 0.99Tulsa, OK 3.12% 3.76% 3.59% 0.99Fresno, CA 5.45% 5.88% 4.46% 0.98Ogden, UT 2.91% 5.39% 3.85% 0.98Bakersfield, CA 6.64% 6.62% 6.49% 0.95
Contribution: Share of private sector jobs in a region accounted for by firms of a given age
0-1 yrs 2-3 yrs 4-5 yrs Kauffman IndexBoise, ID 50.04% 57.06% 62.55% 1Oklahoma City, OK 59.25% 69.22% 65.19% 1Omaha, NE 61.54% 59.53% 58.50% 1Spokane, WA 54.72% 54.37% 80.23% 1Albuquerque, NM 49.63% 53.25% 58.50% 0.99Syracuse, NY 46.62% 53.50% 60.74% 0.99Tulsa, OK 62.28% 74.71% 66.88% 0.99Fresno, CA 43.82% 47.08% 59.93% 0.98Ogden, UT 47.92% 48.66% 52.07% 0.98Bakersfield, CA 38.53% 38.58% 58.38% 0.95
Compensation: relative earnings of typical job in young firms regionally versus any age nationally
0-1 yrs 2-3 yrs 4-5 yrs Kauffman IndexBoise, ID 0.52 0.62 0.66 1Oklahoma City, OK 0.51 0.63 0.62 1Omaha, NE 0.57 0.64 0.65 1Spokane, WA 0.54 0.63 0.66 1Albuquerque, NM 0.53 0.62 0.67 0.99Syracuse, NY 0.53 0.62 0.67 0.99Tulsa, OK 0.51 0.62 0.59 0.99Fresno, CA 0.44 0.49 0.58 0.98Ogden, UT 0.5 0.52 0.64 0.98Bakersfield, CA 0.29 0.33 0.49 0.95
Constancy: share of jobs held in young firms that last more than three quarters
Source: Kauffman Foundation Indicators of Entrepreneurship – multi-dimensional private jobs analysis
Best Worst2nd WorstKey:

87B3K Market Assessment |
Increasing sustainability of young firms requires more basic supports, focus on knowledge-intense firms
Distinguishing among these young firms is a core issue. High-growth firms concentrate in knowledge-intensive or STEM traded sectors that enable rapid and sustained differentiation; young tech and ICT firms tend to be net positive job creators, while other young firms lose jobs at a higher rate. Unsurprisingly, concentrations of knowledge-intensive firms also correlate to effective university commercialization programs. This leads to targeting different types of assistance for traded sector growth firms versus “Main Street” locally-serving businesses, and startups versus scaleups later in the life-cycle.
Kern ranks low in its density of high-growth young firms against multiple comparison groups. Kern performs below all other peer regions for young tech-oriented companies per capita. In analysis of Inc 5000 firm entries based on three-year consecutive high-growth rates meeting OECD definitions, Kern lags against economic peers, California peers, aspirational middleweight regions, and military innovation hubs. Reinforcing these themes, Heartland Forward analysis across 375 metro areas also ranked the Bakersfield MSA extremely high in (9th) in share of young firm employment, but extremely low in knowledge-intensity (346th).
Braiding the findings of strong firm formation and job contributions with weak job durability and development of high-growth, knowledge-intensive firms raises implications for targeting basic missing supports to young firms, beyond generic “small business services” – assets like incubators and accelerators, programs in commercialization and problem-solving assistance, and nurturing of digital / tech talent.
0
50
100
150
200
250
0.0
50.0
100.0
150.0
200.0
250.0
300.0
Omaha, N
E
Oklahoma C
ity, O
K
Ogden
, UT
Boise, ID
Tulsa
, OK
Albuquerque
, NM
Fresno, C
A
Spokan
e, WA
Bakersf
ield, CA
Modesto
, CA
Syracuse,
NY
Indianap
olis, IN
Kansas C
ity, M
O-KS
San Antonio,
TX
Huntsv
ille, A
L
Santa M
aria-SB
, CA
Dayton,
OH
Density (entries per 1M pop.) Inc. 5000 High-Growth Entries
Regional Predictors for High-Growth Firms in Kern - Inherited vs Influenceable?• Overall rate of business formation in the region, because entrepreneurial
regions tend to stay that way due to culture and networked experience.• Workers with college degrees, which drives entrepreneurship broadly and the
likelihood of forming knowledge-intensity of firms. • Employment in high-tech industries generally, for spinning off new firms, plus
supply chain proximity to serving high-tech, high-growth customers.• Population in prime entrepreneurship age (35-44 years), where professionals
have accumulated experience and wealth, but are not yet risk-averse approaching retirement.
Sources: Brookings. High-growth firms and cities in the U.S., 2018; Heartland Forward, Young Firms and Regional Economic Growth, 2020. Brookings analysis of Crunchbase and EMSI data.
High-growth young firm density, 2011-2017
- 0.10 0.20 0.30 0.40 0.50 0.60
OgdenSyracuse
OmahaAlbuquerque
BoiseTulsa
Oklahoma City
ModestoStocktonRiverside
Fresno
Kern County
Number of tech companies per thousand jobs since 2009*
Finally, not all new businesses are the same. The vast majority of entrepreneurs are in locally-serving businesses, not driven to growth or oriented toward innovation. The impact of entrepreneurship relies on concentrations of “high-growth” firms. A longitudinal Census analysis showed that businesses reaching one-year employment growth of 25% or higher account for nearly 60% of job creation nationwide. Similarly, the 12% of businesses with a one-year revenue growth rate of at least 25% generate 50% of economy-wide total revenue growth.
88B3K Market Assessment |
Competitiveness Drivers: Infrastructure
Why infrastructure matters:
Transportation efficiency, broadband connectivity, and land use policies support regional productivity, access to talent, and promotion of density for agglomeration and proximity benefits.
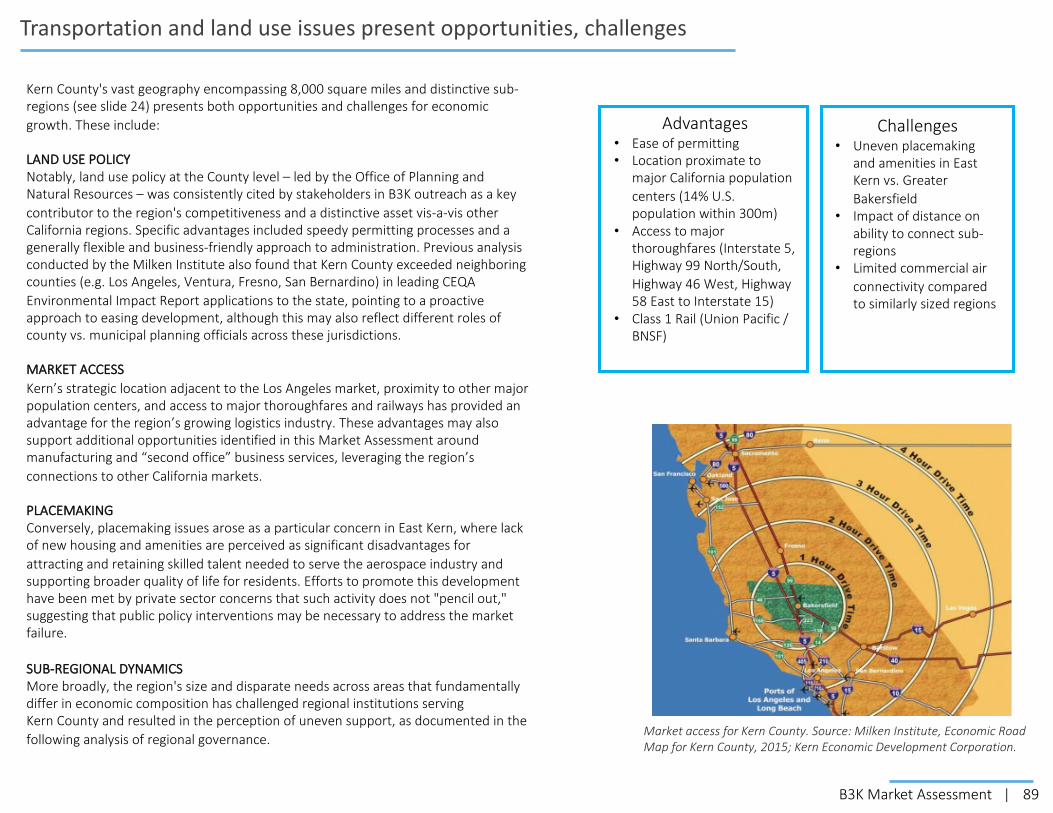
89B3K Market Assessment |
Transportation and land use issues present opportunities, challenges
Kern County's vast geography encompassing 8,000 square miles and distinctive sub-regions (see slide 24) presents both opportunities and challenges for economic growth. These include:
LAND USE POLICYNotably, land use policy at the County level – led by the Office of Planning and Natural Resources – was consistently cited by stakeholders in B3K outreach as a key contributor to the region's competitiveness and a distinctive asset vis-a-vis other California regions. Specific advantages included speedy permitting processes and a generally flexible and business-friendly approach to administration. Previous analysis conducted by the Milken Institute also found that Kern County exceeded neighboring counties (e.g. Los Angeles, Ventura, Fresno, San Bernardino) in leading CEQA Environmental Impact Report applications to the state, pointing to a proactive approach to easing development, although this may also reflect different roles of county vs. municipal planning officials across these jurisdictions.
MARKET ACCESSKern’s strategic location adjacent to the Los Angeles market, proximity to other major population centers, and access to major thoroughfares and railways has provided an advantage for the region’s growing logistics industry. These advantages may also support additional opportunities identified in this Market Assessment around manufacturing and “second office” business services, leveraging the region’s connections to other California markets.
PLACEMAKINGConversely, placemaking issues arose as a particular concern in East Kern, where lack of new housing and amenities are perceived as significant disadvantages for attracting and retaining skilled talent needed to serve the aerospace industry and supporting broader quality of life for residents. Efforts to promote this development have been met by private sector concerns that such activity does not "pencil out," suggesting that public policy interventions may be necessary to address the market failure.
SUB-REGIONAL DYNAMICSMore broadly, the region's size and disparate needs across areas that fundamentally differ in economic composition has challenged regional institutions serving Kern County and resulted in the perception of uneven support, as documented in the following analysis of regional governance.
Advantages• Ease of permitting• Location proximate to
major California population centers (14% U.S. population within 300m)
• Access to major thoroughfares (Interstate 5, Highway 99 North/South, Highway 46 West, Highway 58 East to Interstate 15)
• Class 1 Rail (Union Pacific / BNSF)
Market access for Kern County. Source: Milken Institute, Economic Road Map for Kern County, 2015; Kern Economic Development Corporation.
Challenges• Uneven placemaking
and amenities in East Kern vs. Greater Bakersfield
• Impact of distance on ability to connect sub-regions
• Limited commercial air connectivity compared to similarly sized regions

90B3K Market Assessment |
Job proximity is above average, but declined with suburban job growth
While economies function at the regional level drawing workers from across the metropolitan labor shed, job proximity also matters for residents’ ability to access job opportunities and achieve economic mobility, as well as business success.
Research has connected job proximity with employment outcomes, including for poor, Black, female, and older individuals. Intuitively, distance from jobs imposes greater costs associated with transportation (e.g. car ownership, gas, childcare), which particularly impacts lower-income workers. Achieving quality job creation within neighborhoods at scale and suited to residents is unrealistic, but promoting more access via regional job hubs is practical.
Additionally, spatial efficiency is an important factor in business competitiveness, notwithstanding the potential impacts of more remote work. Firms located in more connected job hubs are advantaged by easier reach to a greater number of workers.
Analysis of physical job accessibility -- defined as the ”share of metro area employment that is found within the typical (median) commute distance for a given metro area” -- between 2007 and 2017 shows mixed results for Kern County.
Overall job proximity has declined, with the region’s median commute distance increasing from 5.6 miles to 8.7 miles.
The share of jobs within that commute distance is 35.6%, exceeding the national average of 29.2% among the U.S.’s 96 largest metropolitan areas. However, this share declined 2.4% between 2007 and 2017, above the average national decline of 1.7%.
Increases in suburban employment tend to drive lower rates of job access, distributing jobs to areas with lower density of resident population. This is also a factor in Kern County – between 2007 and 2017, suburban employment growth (33.4%) vastly exceeded increases in urban areas (3.6%), and rural areas experienced a substantial decline (-12.7%).
Source for image and data: Cleveland Federal Reserve, The Decline in Access to Jobs and the Location of Employment Growth in US Metro Areas, 2020; Brookings, The growing distance between people and jobs in metropolitan America, 2015.
Housing start distribution and the sectors that have generated job growth in the region likely are contributors to this dynamic.
Expansion of logistics in warehousing and distribution, as well as agricultural production jobs, tend to create less urban, more dispersed activity.
Recognizing the region’s solid overall standing relative to the nation as a whole, future economic development, land use, and transportation choices remain important considerations to advance job quality and access objectives. A factor for evening out the geography of opportunity includes prioritizing sectors, economic corridors, and housing around more compact job hubs closer to population centers.
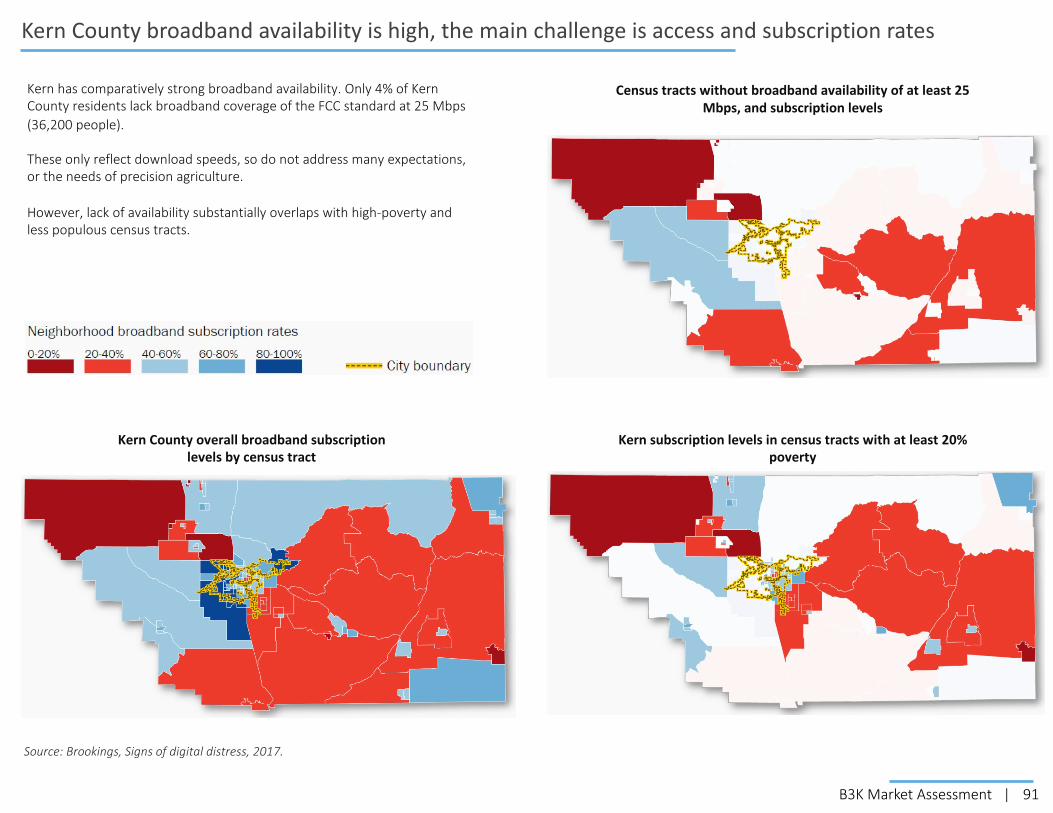
91B3K Market Assessment |
Kern County broadband availability is high, the main challenge is access and subscription rates
Kern County overall broadband subscription levels by census tract
Census tracts without broadband availability of at least 25 Mbps, and subscription levels
Kern has comparatively strong broadband availability. Only 4% of Kern County residents lack broadband coverage of the FCC standard at 25 Mbps (36,200 people).
These only reflect download speeds, so do not address many expectations, or the needs of precision agriculture.
However, lack of availability substantially overlaps with high-poverty and less populous census tracts.
Kern subscription levels in census tracts with at least 20% poverty
Source: Brookings, Signs of digital distress, 2017.
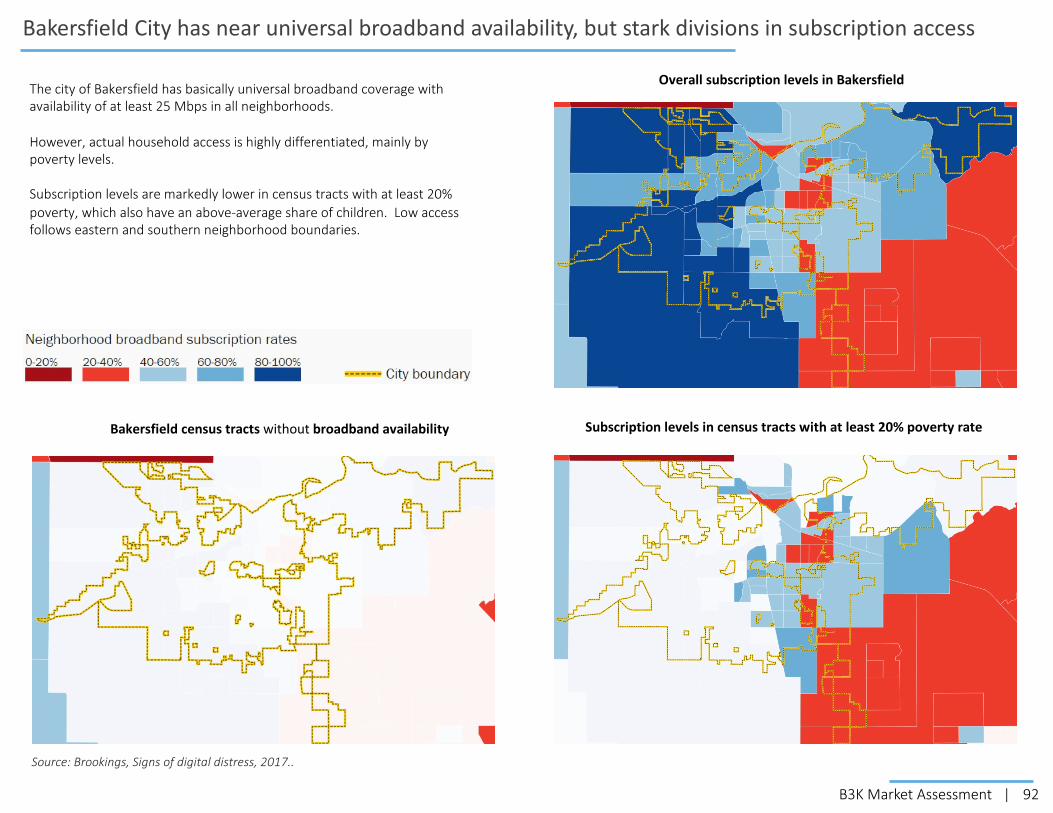
92B3K Market Assessment |
Bakersfield City has near universal broadband availability, but stark divisions in subscription access
The city of Bakersfield has basically universal broadband coverage with availability of at least 25 Mbps in all neighborhoods.
However, actual household access is highly differentiated, mainly by poverty levels.
Subscription levels are markedly lower in census tracts with at least 20% poverty, which also have an above-average share of children. Low access follows eastern and southern neighborhood boundaries.
Subscription levels in census tracts with at least 20% poverty rate
Overall subscription levels in Bakersfield
Bakersfield census tracts without broadband availability
Source: Brookings, Signs of digital distress, 2017..
93B3K Market Assessment |
Competitiveness Drivers: Governance
Why governance matters:
Governance is the formulation and execution of collective action across political and institutional boundaries.
Jurisdictional lines do not define the geography at which the economy operates; there is no national, state, or city economy, but regional scale at which competitiveness driver assets are shared – workforce commutes, business networks, university access, transportation systems.
Further, the economy relies on contributions of many actors across sectors with different institutional responsibilities and resources.
Regional competitiveness relies on the capacity of private, public, and civic institutions to focus, marshal, and execute strategy and investment for a common economic development agenda.
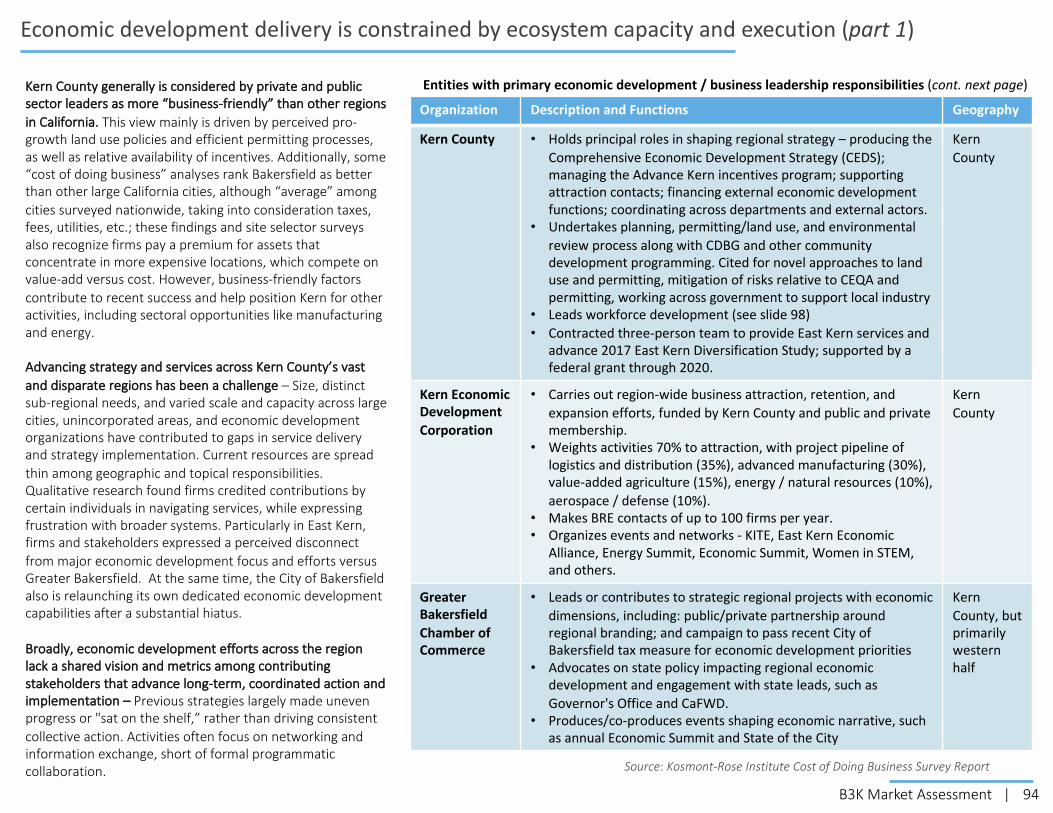
94B3K Market Assessment |
Economic development delivery is constrained by ecosystem capacity and execution (part 1)
Kern County generally is considered by private and public sector leaders as more “business-friendly” than other regions in California. This view mainly is driven by perceived pro-growth land use policies and efficient permitting processes, as well as relative availability of incentives. Additionally, some “cost of doing business” analyses rank Bakersfield as better than other large California cities, although “average” among cities surveyed nationwide, taking into consideration taxes, fees, utilities, etc.; these findings and site selector surveys also recognize firms pay a premium for assets that concentrate in more expensive locations, which compete on value-add versus cost. However, business-friendly factors contribute to recent success and help position Kern for other activities, including sectoral opportunities like manufacturing and energy.
Advancing strategy and services across Kern County’s vast and disparate regions has been a challenge – Size, distinct sub-regional needs, and varied scale and capacity across large cities, unincorporated areas, and economic development organizations have contributed to gaps in service delivery and strategy implementation. Current resources are spread thin among geographic and topical responsibilities. Qualitative research found firms credited contributions by certain individuals in navigating services, while expressing frustration with broader systems. Particularly in East Kern, firms and stakeholders expressed a perceived disconnect from major economic development focus and efforts versus Greater Bakersfield. At the same time, the City of Bakersfield also is relaunching its own dedicated economic development capabilities after a substantial hiatus.
Broadly, economic development efforts across the region lack a shared vision and metrics among contributing stakeholders that advance long-term, coordinated action and implementation – Previous strategies largely made uneven progress or "sat on the shelf,” rather than driving consistent collective action. Activities often focus on networking and information exchange, short of formal programmatic collaboration.
Organization Description and Functions Geography
Kern County • Holds principal roles in shaping regional strategy – producing the Comprehensive Economic Development Strategy (CEDS); managing the Advance Kern incentives program; supporting attraction contacts; financing external economic development functions; coordinating across departments and external actors.
• Undertakes planning, permitting/land use, and environmental review process along with CDBG and other community development programming. Cited for novel approaches to land use and permitting, mitigation of risks relative to CEQA and permitting, working across government to support local industry
• Leads workforce development (see slide 98)• Contracted three-person team to provide East Kern services and
advance 2017 East Kern Diversification Study; supported by a federal grant through 2020.
Kern County
Kern Economic Development Corporation
• Carries out region-wide business attraction, retention, and expansion efforts, funded by Kern County and public and private membership.
• Weights activities 70% to attraction, with project pipeline of logistics and distribution (35%), advanced manufacturing (30%), value-added agriculture (15%), energy / natural resources (10%), aerospace / defense (10%).
• Makes BRE contacts of up to 100 firms per year.• Organizes events and networks - KITE, East Kern Economic
Alliance, Energy Summit, Economic Summit, Women in STEM, and others.
Kern County
Greater Bakersfield Chamber of Commerce
• Leads or contributes to strategic regional projects with economic dimensions, including: public/private partnership around regional branding; and campaign to pass recent City of Bakersfield tax measure for economic development priorities
• Advocates on state policy impacting regional economic development and engagement with state leads, such as Governor's Office and CaFWD.
• Produces/co-produces events shaping economic narrative, such as annual Economic Summit and State of the City
Kern County, but primarily western half
Entities with primary economic development / business leadership responsibilities (cont. next page)
Source: Kosmont-Rose Institute Cost of Doing Business Survey Report

95B3K Market Assessment |
Organization Description and Functions Geography
Local governments
• Varies with capacity, but most often focused on responsibilities related to physical development and amenities, planning and zoning, local business, and tax base expansion.
• Typically one to maximum three agency staff; City of Bakersfield relaunching separate economic development division at scale after tax measure approval.
Individualcities, e.g. Shafter, Delano, Tehachapi, Ridgecrest
Local business and economic development organizations
• Chambers of Commerce offering basic local business information, shared services, networking, and advocacy.
• Nonprofit economic development organizations providing local market information, site selection navigation, and promotion; and sometimes collaborations with local schools on work entry.
• Merged chambers and economic development organizations.
• Coalitions focused on support and advocacy around specific economic assets, such as military bases.
Local subregions or cities, e.g. California City Chamber of Commerce, Indian Wells Economic Development Corporation, China Lake Alliance
Kern County Black Chamber of Commerce
• Offers cross-jurisdiction business development, and small business / entrepreneurship resources (detailed on slide 97).
• Organizes events, networking, and advocacy.
Kern County, but primarily Bakersfield
Kern County Hispanic Chamber of Commerce
• Provides assistance with business planning, loans, marketing, organizational development, referrals, and information on local market and demographics.
• Undertakes workshops and other events, plus engagement with elected officials.
Kern County
AV EDGE • Reformed economic development organization combining the Greater Antelope Valley Economic Alliance and Antelope Valley Board of Trade, centered in Palmdale / Lancaster, but seeking to engage East Kern.
• Target activities include business retention, expansion, and attraction, with an aerospace sector emphasis.
Northeastern Los Angeles County / eastern Kern County
Entities with primary economic development / business leadership responsibilities (continued)Efforts to organize and support key clusters for joint problem-solving and growth opportunities are underdeveloped – While existing economic development strategic plans consistently identify industry “cluster” strengths, the region lacks focused action to advance them through cluster initiatives. Rather, cluster identification is more oriented to highlighting the presence of a particular sector than addressing shared needs and assets that drive the region’s niche – building coalitions or intermediaries that bolster talent; research, commercialization, and applied problem-solving; value chain leverage; infrastructure; capital; global visibility. Most sector activities center on regulatory advocacy rather than competitive inputs, or individual firms versus interdependent needs.
For example, despite universal recognition of the distinctive aerospace sector anchoring East Kern, the region lacks a dedicated, ongoing, proactive effort among principal economic development actors to work with industry and deliver a comprehensive cluster support strategy. No personnel or entity is assigned to lead this as a primary responsibility. Subregional groups have emerged, but with few resources or written strategies; programs tend to be siloed. Companies noted difficulty securing County or other assistance for service needs, and limited special attention. Functional programmatic collaboration does not cross political boundaries for scale.
Compared to other regions, the public sector plays a more dominant role than business leadership in economic development strategy – In many peer markets, the business community takes a more active role in shaping, funding, and implementing economic development efforts for collective benefit. Working through or in partnership with EDC structures, these business groups advance a longer-term strategic vision, lead catalytic initiatives, inject expertise, act as ambassadors, and contribute higher levels of investment, among other things.
Non-white stakeholders feel underrepresented at leadership tables – They report difficulty engaging some decision-makers, reducing the ability to target certain strategies or align with distinct community needs.
Economic development delivery is constrained by ecosystem capacity and execution (part 2)

96B3K Market Assessment |
Clusters are geographic concentrations of interconnected companies and institutions in a specialized field, that gain competitive advantages through proximity and complementarities. § Critical mass of firms related by products and supply chains, occupations and skills, or technology and know-how.§ Intermediaries and enabling organizations – such as government, universities, think tanks, training providers, trade
associations -- that facilitate innovation, commercialization, technical support, and a deep talent base.§ Tailored facilities and infrastructure that enhance productivity.
Regions can support the growth and competitiveness of a cluster through efforts including:• Promoting information-sharing and building networks around common needs and challenges• Supporting cluster-specific talent development, in collaboration with universities, community colleges, other providers• Advancing research, commercialization, and tech transfer• Improving infrastructure and placemaking• Expanding capital access• Promoting global visibility and reputation
Sources: Brookings, Rethinking Cluster Initiatives
Regional economies grow or decline based on their ability to specialize in high-value traded industry sectors and evolve over time. Cluster presence is shown to generate greater productivity and innovation, higher wages, and more entrepreneurial activity.
Dedicated support for clusters -- a distinct gap in the region -- is particularly important to ensuring the region’s economic success.
Examples of cluster efforts include:• Central Indiana Corporate Partnership: BioCrossroads, AgriNovus, Energy Systems Network-- life sciences, agbioscience, energy • The Water Center (Milwaukee) -- water technology • BioSTL Coalition (St. Louis) – agtech and biosciences• Data to Decisions NUAIR / CenterState CEO (Syracuse) -- unmanned aerial systems • Cultivation Corridor (Des Moines) -- agtech innovation• We Build Green Cities (Portland) – urban environmental sustainability design, products, and solutions
Clusters are core to regional competitiveness, elevating the imperative to organize beyond marketing

97B3K Market Assessment |
Foundational entrepreneurship and business supports are absent or not scaled to needs
Organization Description and Functions Geography
SBDC (at CSUB) • Provides basic training, consulting, and online resources on topics such as business planning, financial management, social media; connects to other expertise through Central CA SBDC network.
• Serves approximately 550 individual firm clients per year across three counties, plus approx. 2,000 participants on training webinars, etc.
Kern, Inyo, and Mono counties; based at CSUB
Kern Women's Business Center
• Provides training, technical assistance, workshops, and networking, serving 15% traded sector firms, housed at Mission Community Services Corporation.
• Initiating collaboration with Access Plus Capital CDFI.
Kern County
Kern Black Chamber
• Provides direct assistance and referrals for small business owners, such as a new free four-part Small Business Academy program with Old Gold Ventures (small minority business trainer) with support from City of Bakersfield.
Kern County, primarily focused on Bakersfield
Kern Hispanic Chamber
• Offers business planning, business loans, marketing, organizational development, and local market data.
Kern County
BC Launchpad • Offers workshops, webinars, physical space / computer lab in downtown Bakersfield, established in 2019.
Bakersfield
Kern Venture Group
• $2 million venture capital / angel seed fund targeting Kern-based businesses, or others with some Kern connections.
Kern County
KITE • Convenes networking and organizing for the entrepreneurial community (Kern Initiative on Talent and Entrepreneurship).
Kern County
Bitwise Industries • Proposes a tech business incubator, along with digital skills training / apprenticeships and shared workspace.
Bakersfield
CSUB FabLab • Maker Space 3D printing, laser cutting, and other technologies/services to help entrepreneurs (associated with CSUB and general public) prototype innovations.
Bakersfield
Basic business and entrepreneurship resources are missing, not scaled to needs and service area, and/or not targeted to highest-impact opportunities – The region lacks a rudimentary business incubator of any sort, let alone an accelerator, tech alliance, angel conference, or related supports. Other services primarily focus on local businesses needs and generic needs, versus engaging young tech firms or traded sector growth opportunities. Promoting durability and growth of young firms is a services gap. Several co-working spaces have been established in recent years, but offer limited development. Bitwise Industries expansion into Bakersfield proposes to include an innovation lab.
Constraints on access to capital and other fundamentals inhibit start-up and growth. Investment is limited by availability and firm capability. The region lacks a Kern-focused or sizeable Community Development Financial Institution (CDFI), combined with cautious banking culture and tradition of lending within elite networks. However, some firms seeking capital also lack sophistication or need additional support to absorb the investment.
Support for inclusive entrepreneurship is limited and not integrated with mainstream economic development –Notwithstanding efforts by the Hispanic and Black Chambers of Commerce, efforts to support non-white and women-owned businesses are not at sufficient scale or featured in conventional services. Needs include accessing capital, financial literacy training, and assistance navigating contracting / procurement processes.
Positive "start-up" activity and organizing has expanded --Recent "bottom up" efforts to foster entrepreneurship provide a foundation for more efforts, including networking, co-working, education, and exposure.
Other organizations / initiatives include: small-scale CDFI branch (Access Plus Capital), Mid-State Development physical , co-working (Mesh CoWork, Kernville CoWork), entrepreneurship programs or clubs (CSUB, BC, Kern High School).
Organizations / initiatives supporting entrepreneurship (representative)

98B3K Market Assessment |
Workforce system has practical strengths, could target more on job quality and traded sector goals
Organization Description and Functions Geography
Kern County • Convenes Workforce Development Board and serves as hub for WIOA investment and additional program delivery, ranging from the America's Job Center to on-the-job training.
Kern County
California State University –Bakersfield (CSUB)
• Focuses on role as a “metropolitan university” serving regional needs as the only four-year university.
• Seeking to increase capacity for contributing to innovation and problem-solving, such as a new Energy Research Center; new Agribusiness Center; and enhanced School of Natural Sciences, Mathematics, and Engineering.
Bakersfield-based; EK satellite
Kern CommunityCollege District
• Delivers industry-driven coursework, including degree programs, certificates, not-for-credit training, and contract education, such as cybersecurity training for defense contractors.
• Initiated a new industrial automation baccalaureate program at BC.
• Awards approximately 5,000 degrees per year district-wide, with BC representing 75% and the remainder roughly split between CC and PC.
Bakersfield College, Cerro Coso, and Porterville (inTulare Co.)
Taft College • Offers STEM programs, among others, preparing students for baccalaureate study in seven engineering disciplines.
Southwest Kern County
Kern County Superintendent of Schools
• Partners with 46 independent school districts to coordinate intensive CTE programming, including 15 career pathways.
• Aligned with KCCD focus by shared Central Mother Lode Regional Consortium data.
• Serves as anchor for Kern Education Pledge.
Kern County
Organizations with primary workforce responsibilitiesThe region has been building a notable set of strategies and offerings around career and technical education and work-based learning – In comparison to other areas, workforce development activities take greater advantage of on-the-job training models and expansion of technical education, in part sparked by response to the Great Recession and seeded by the California Career Pathways Trust. Additionally, the region has a number of social enterprises, labor apprenticeships, and other ventures alongside the traditional workforce system.
Workforce strategies reference prioritizing major traded clusters, but most efforts center on a subset of locally-serving industries with abundant demand for lower-quality jobs (e.g. healthcare) – Subsidized on the job programs are not proactively targeted to reach priority sectors, such as advanced manufacturing. Meanwhile, research indicated smaller and mid-size firms are not aware of help, have trouble navigating it, or do not align with the talent being produced, relying on a “grow your own” approach.
Tech or digital skills talent is a general gap – Both job postings data and qualitative input from tech entrepreneurs and business leaders indicate difficulty in procuring tech talent relative to other markets. New efforts like Bitwise digital academies can begin to address this through training and apprenticeships.
The workforce system grapples with and reflects broader regional challenges to equity – The high out-of-work population among both young and prime working age adults are linked to issues other than training services –disconnection, childcare, language.
Efforts to improve overall educational outcomes have launched – The region’s extraordinary deficit in educational attainment is the focus of cross-sectoral leaders who initiated the Kern Education Pledge. This collective impact effort is a foundation for workforce and education interests around common goals.
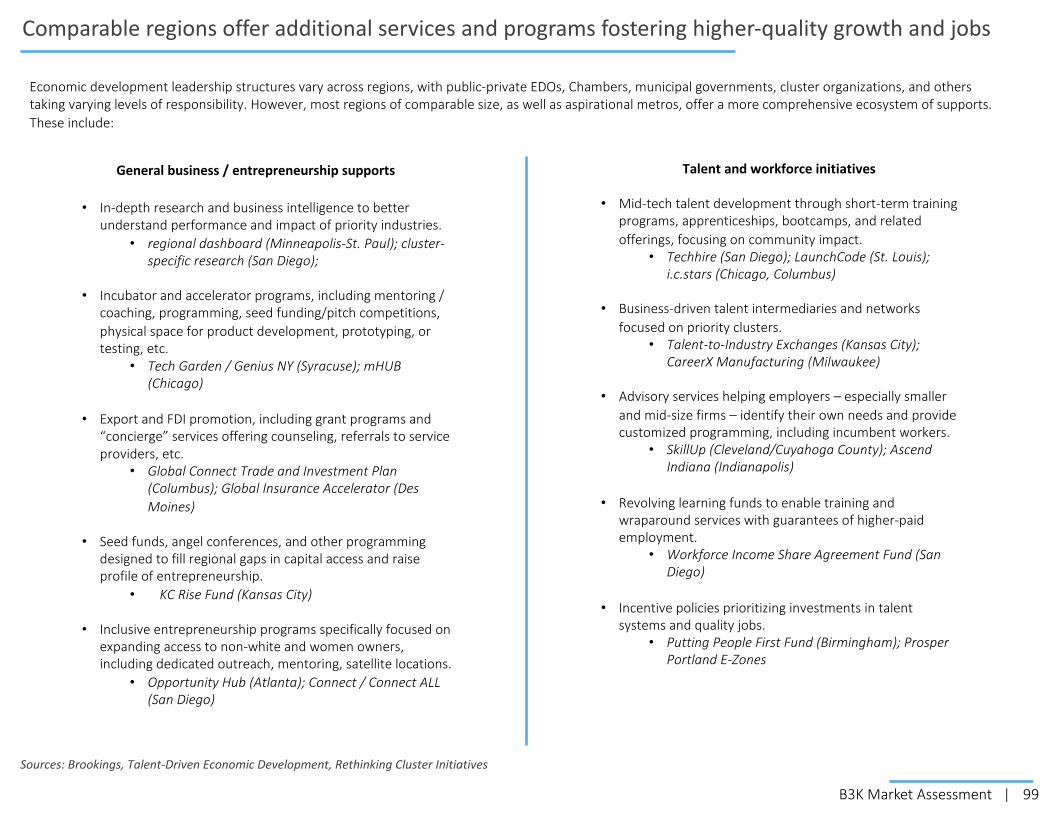
99B3K Market Assessment |
General business / entrepreneurship supports Talent and workforce initiatives
• In-depth research and business intelligence to better understand performance and impact of priority industries.
• regional dashboard (Minneapolis-St. Paul); cluster-specific research (San Diego);
• Incubator and accelerator programs, including mentoring / coaching, programming, seed funding/pitch competitions, physical space for product development, prototyping, or testing, etc.
• Tech Garden / Genius NY (Syracuse); mHUB(Chicago)
• Export and FDI promotion, including grant programs and “concierge” services offering counseling, referrals to service providers, etc.
• Global Connect Trade and Investment Plan (Columbus); Global Insurance Accelerator (Des Moines)
• Seed funds, angel conferences, and other programming designed to fill regional gaps in capital access and raise profile of entrepreneurship.
• KC Rise Fund (Kansas City)
• Inclusive entrepreneurship programs specifically focused on expanding access to non-white and women owners, including dedicated outreach, mentoring, satellite locations.
• Opportunity Hub (Atlanta); Connect / Connect ALL (San Diego)
• Mid-tech talent development through short-term training programs, apprenticeships, bootcamps, and related offerings, focusing on community impact.
• Techhire (San Diego); LaunchCode (St. Louis); i.c.stars (Chicago, Columbus)
• Business-driven talent intermediaries and networks focused on priority clusters.
• Talent-to-Industry Exchanges (Kansas City); CareerX Manufacturing (Milwaukee)
• Advisory services helping employers – especially smaller and mid-size firms – identify their own needs and provide customized programming, including incumbent workers.
• SkillUp (Cleveland/Cuyahoga County); Ascend Indiana (Indianapolis)
• Revolving learning funds to enable training and wraparound services with guarantees of higher-paid employment.
• Workforce Income Share Agreement Fund (San Diego)
• Incentive policies prioritizing investments in talent systems and quality jobs.
• Putting People First Fund (Birmingham); Prosper Portland E-Zones
Sources: Brookings, Talent-Driven Economic Development, Rethinking Cluster Initiatives
Economic development leadership structures vary across regions, with public-private EDOs, Chambers, municipal governments, cluster organizations, and others taking varying levels of responsibility. However, most regions of comparable size, as well as aspirational metros, offer a more comprehensive ecosystem of supports. These include:
Comparable regions offer additional services and programs fostering higher-quality growth and jobs

100B3K Market Assessment |
Additional perspectives could play a greater role in economic strategy
Community and social justice groups represent important viewpoints on how strategy, programming, and services should be targeted to ensure that all residents have the opportunity to succeed, and to address specific disparities and barriers. These groups already provide services to and advocate for the interests of their constituencies, and they serve as direct access points for residents. However, the dynamic with institutional decision-making is often perceived as a win-lose conflict; these groups tend to lack substantive representation or connections to institutional decision-making, nor do they have a background in economic development principles or practices. Closing these gaps in knowledge and perspective between community development and economic development will be necessary for the cooperation to achieve inclusive economic goals in both job quality and access.
Community-based and social justice groups engaged in the B3K outreach and processes
Organization Focus GeographyBuilding Healthy Communities Health-focused California Endowment-supported project advancing "just
transition" and addressing impacts of regional industries. Particular focus on local capacity-building and organizing.
South Kern including Arvin and Lamont
California Farmworkers Foundation Serving and supporting California farmworkers by providing programs and services to better their quality of life and enable them to develop personal and professional skills.
Headquartered in Delano but serving agricultural communities throughout California
Covenant Community Services Youth-focused organization offering life development and coaching, employment and training (including through Covenant Coffee social enterprise), and mentoring to foster youth.
Serving the Oildale Community, just north of the Bakersfield City limits
Dolores Huerta Foundation Creating a network of organized communities pursuing social justice through systemic and structural transformation.
Kern priorities include Arvin, Lamont, Weedpatch, Greenfield, Bakersfield, California City
FIELD (Farmworker Institute of Education & Leadership)
Promoting social and economic prosperity in rural communities through education.
Headquartered in Tehachapi, CA, serving California's San Joaquin and Sacramento Valleys
Leadership Counsel for Justice and Accountability
Focused on areas including public health/basic services, land use, infrastructure, and housing. Two-person office in Bakersfield.
San Joaquin and Coachella Valleys
Oildale Community Action Team Restoring hope in Oildale and Greater Bakersfield through community activities and partnerships with local government and community agencies.
A grass-roots effort serving the Oildale Community, just north of the Bakersfield City limits
UFW Foundation Offers services in areas including immigration, worker rights, public health, public benefits, and broader organizing. Current focus on financial assistance for farmworkers impacted by COVID-19.
Headquartered in Los Angeles with regional offices in Bakersfield and throughout the Central Valley
Additional organizations active in the region include (but are not limited to) the African-American Network; Center for Race, Place, and Environment; Faith in the Valley; and California Rural Legal Assistance.

101B3K Market Assessment |
Other intermediaries offer leadership and investment
Organization Description and Functions Geography
Kern Council of Governments
• Metropolitan planning organization governed by elected leaders from across the County.
• Responsible for development and administration of Regional Transportation Plan and Sustainable Communities Strategy.
• Provides input on transportation and land use dimensions of economic development.
• Leading development of inland port and automated trucking pilot concepts as transport-related contributor to or anchor for other aspects of economic growth.
Kern County
Kern Community Foundation
• Community foundation with $32.5 million in total assets, and a primary focus on nonprofit strengthening and educational attainment.
• Plays an increasing role as a convenor or facilitator for regional economic and workforce tables, including B3K and Kern Education Pledge, following emerging state and national models.
• Can enable access to philanthropic funding outside the region, such as state or national networks.
Kern County
Additional civic organizations influencing economic / workforce strategyLeadership from regional and local institutions without direct economic and workforce development responsibilities provide opportunities for additional alignment and resources.
Networked civic leadership from across sectors is integral to making progress on Kern's significant challenges and ensuring that resources are aligned for maximum impact.
That effective governance relies on neutral intermediaries that can bridge jurisdictional, sectoral, and political boundaries to foster joint action on a common agenda. Few organizations are positioned to advance that function without a vested interest or institutional stake in the execution.
While the Kern Council of Governments focuses primarily on its transportation and environmental missions, it also is the regional forum for collective action among local jurisdictions; and makes infrastructure choices that significantly influence economic outcomes, such as current contemplation of inland logistics and automation pilots. Use of its research and data capabilities can extend to the “economic value atlas” concept explored by other MPOs to evaluate infrastructure or land use decisions through an economic context, overlaying traditional efficiency considerations with factors like workforce access or redevelopment priorities.
The Kern Community Foundation’s efforts on regional economic and workforce collective action, such as B3K, also follows evolving models in California and nationwide. Increasingly, community foundations are turned to as a cross-sector facilitator with the credibility, flexibility, and broad civic networks to offer a neutral space and bridge typically opposing views. They also serve as primary vehicles to access larger-scale external philanthropy and blend resources, in contrast to support for individual organizational projects. This aggregator role is especially prominent in regions that lack significant local corporate giving or foundation presence.

102B3K Market Assessment |
Governance and ecosystem findings
1. Kern needs to engage in ambitious collective action, invest in public goods to address economic and social challenges, and create mechanisms for accountability -- As this Data Book describes, Kern faces significant barriers to ensuring long-term growth that advances the region’s competitiveness and improves living standards for all of its residents. Addressing these issues will require the region to act collaboratively, at scale, across systems and sub-regions, over a sustained period. This almost assuredly requires additional investments in structures, programs, and partnerships (such as those described on slide 99) that have not existed to date in Kern, but increasingly form the mainstream of economic development in leading and peer regions. Crucially, this will also require the development of shared metrics and accountability to ensure strategies and tactics are ultimately implemented and effective.
2. Kern needs to more fully direct economic and workforce development efforts towards growing and sustaining a broader range of priority clusters -- Like this Data Book, previous analyses and strategies have identified the significance of specific clusters to the region’s economic future. While the region has succeeded in logistics attraction, regional efforts have been largely unable to support identified clusters at either the depth or breadth matching the vision. Ensuring Kern remains competitive in aerospace and defense and adapts legacy strengths in oil/gas and other industries into new growth drivers will require sustained effort and expertise to organize industry to address market failures; identify and develop customized programming; engage with partners in workforce institutions and universities; fast-track local service needs, and advance effective advocacy at the state and federal levels. Until Kern does so, it runs the risk of losing opportunities to other regions seeking a foothold in similar areas.
3. Kern also needs to enhance resources supporting entrepreneurs and other general enablers of business dynamism --While Kern needs to bolster support for specific clusters, it also needs to add capacity to broader services promoting entrepreneurship and business growth. This includes expanding capital access and potentially providing more comprehensive entrepreneurship supports through a dedicated incubator or accelerator. Public sector leaders can also continue to look for ways to streamline local service delivery and regulations.
4. Kern needs to expand access to leadership tables and ensure governance reflects its increasingly diverse population --While Kern has an active social justice community, these efforts have typically been disconnected from mainstream strategy and decision-making. Improving connections could help target and facilitate interventions to ensure more residents benefit from cluster development through targeted workforce training, broaden access to entrepreneurship services, and address challenges around educational attainment and disconnected youth.

103B3K Market Assessment |
1
2
3
4
Market Assessment Data Book
Kern County: Economic performance and traded sectors
Opportunity Industries: Job quality and economic mobility
Fundamentals of growth: Competitiveness Drivers
Findings: Implications and next steps
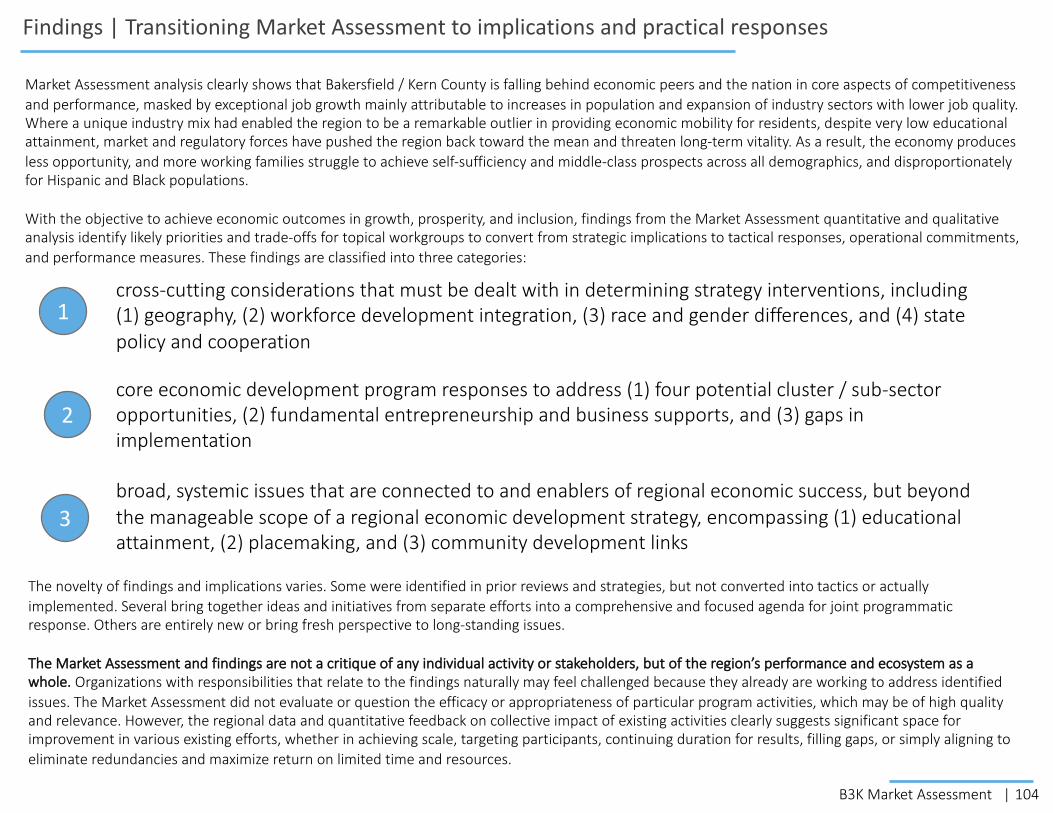
104B3K Market Assessment |
Findings | Transitioning Market Assessment to implications and practical responses
cross-cutting considerations that must be dealt with in determining strategy interventions, including (1) geography, (2) workforce development integration, (3) race and gender differences, and (4) state policy and cooperation
core economic development program responses to address (1) four potential cluster / sub-sector opportunities, (2) fundamental entrepreneurship and business supports, and (3) gaps in implementation
broad, systemic issues that are connected to and enablers of regional economic success, but beyond the manageable scope of a regional economic development strategy, encompassing (1) educational attainment, (2) placemaking, and (3) community development links
2
3
1
Market Assessment analysis clearly shows that Bakersfield / Kern County is falling behind economic peers and the nation in core aspects of competitiveness and performance, masked by exceptional job growth mainly attributable to increases in population and expansion of industry sectors with lower job quality. Where a unique industry mix had enabled the region to be a remarkable outlier in providing economic mobility for residents, despite very low educational attainment, market and regulatory forces have pushed the region back toward the mean and threaten long-term vitality. As a result, the economy produces less opportunity, and more working families struggle to achieve self-sufficiency and middle-class prospects across all demographics, and disproportionately for Hispanic and Black populations.
With the objective to achieve economic outcomes in growth, prosperity, and inclusion, findings from the Market Assessment quantitative and qualitative analysis identify likely priorities and trade-offs for topical workgroups to convert from strategic implications to tactical responses, operational commitments, and performance measures. These findings are classified into three categories:
The novelty of findings and implications varies. Some were identified in prior reviews and strategies, but not converted into tactics or actually implemented. Several bring together ideas and initiatives from separate efforts into a comprehensive and focused agenda for joint programmatic response. Others are entirely new or bring fresh perspective to long-standing issues.
The Market Assessment and findings are not a critique of any individual activity or stakeholders, but of the region’s performance and ecosystem as a whole. Organizations with responsibilities that relate to the findings naturally may feel challenged because they already are working to address identified issues. The Market Assessment did not evaluate or question the efficacy or appropriateness of particular program activities, which may be of high quality and relevance. However, the regional data and quantitative feedback on collective impact of existing activities clearly suggests significant space for improvement in various existing efforts, whether in achieving scale, targeting participants, continuing duration for results, filling gaps, or simply aligning to eliminate redundancies and maximize return on limited time and resources.
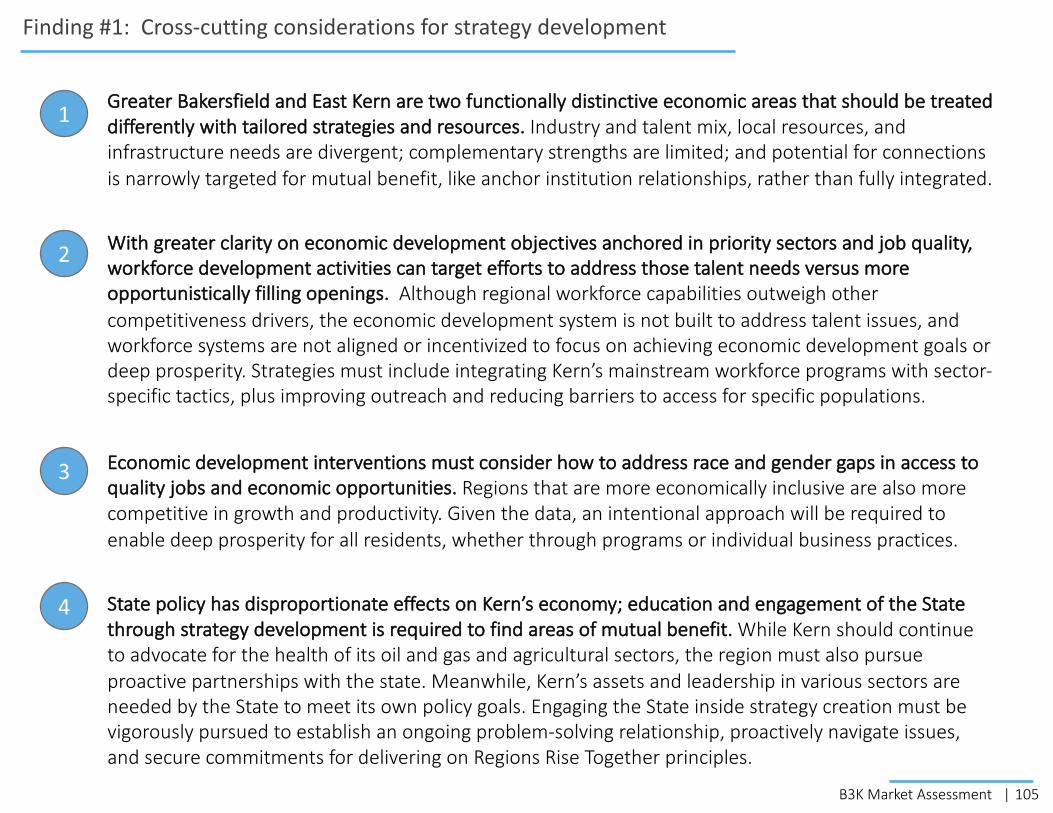
105B3K Market Assessment |
Finding #1: Cross-cutting considerations for strategy development
Greater Bakersfield and East Kern are two functionally distinctive economic areas that should be treated differently with tailored strategies and resources. Industry and talent mix, local resources, and infrastructure needs are divergent; complementary strengths are limited; and potential for connections is narrowly targeted for mutual benefit, like anchor institution relationships, rather than fully integrated.
With greater clarity on economic development objectives anchored in priority sectors and job quality, workforce development activities can target efforts to address those talent needs versus more opportunistically filling openings. Although regional workforce capabilities outweigh other competitiveness drivers, the economic development system is not built to address talent issues, and workforce systems are not aligned or incentivized to focus on achieving economic development goals or deep prosperity. Strategies must include integrating Kern’s mainstream workforce programs with sector-specific tactics, plus improving outreach and reducing barriers to access for specific populations.
Economic development interventions must consider how to address race and gender gaps in access to quality jobs and economic opportunities. Regions that are more economically inclusive are also more competitive in growth and productivity. Given the data, an intentional approach will be required to enable deep prosperity for all residents, whether through programs or individual business practices.
State policy has disproportionate effects on Kern’s economy; education and engagement of the State through strategy development is required to find areas of mutual benefit. While Kern should continue to advocate for the health of its oil and gas and agricultural sectors, the region must also pursue proactive partnerships with the state. Meanwhile, Kern’s assets and leadership in various sectors are needed by the State to meet its own policy goals. Engaging the State inside strategy creation must be vigorously pursued to establish an ongoing problem-solving relationship, proactively navigate issues, and secure commitments for delivering on Regions Rise Together principles.
1
2
3
4
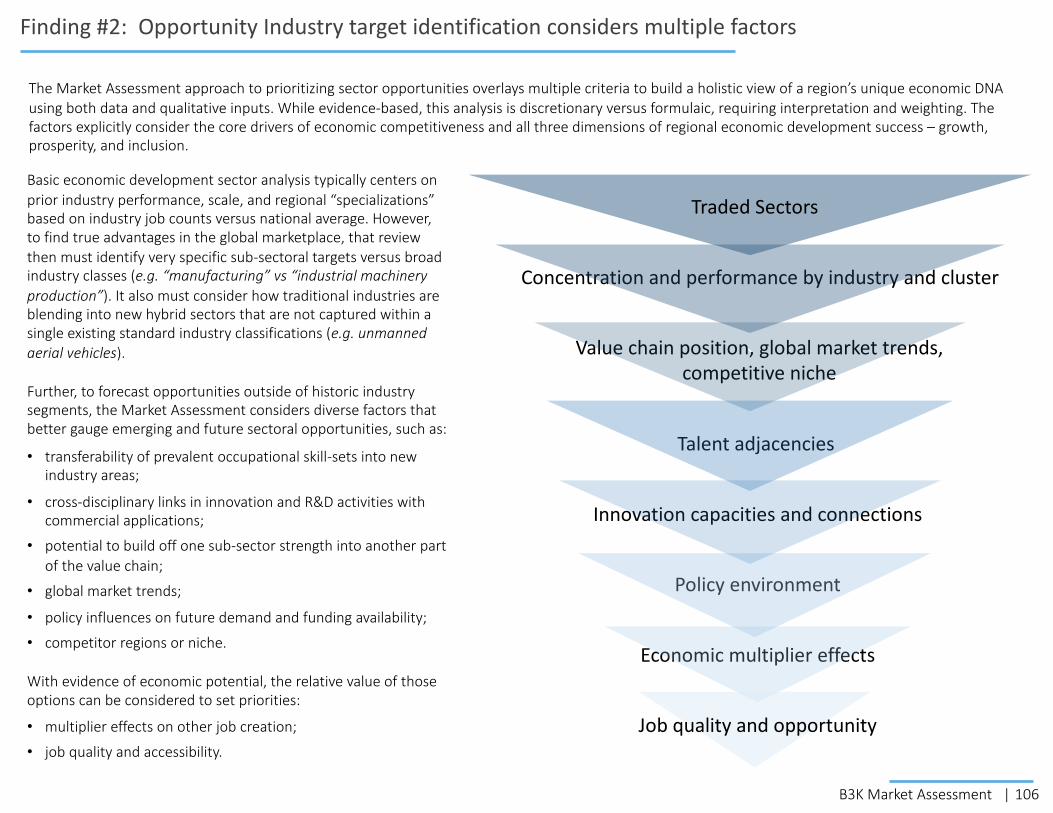
106B3K Market Assessment |
Finding #2: Opportunity Industry target identification considers multiple factors
Basic economic development sector analysis typically centers on prior industry performance, scale, and regional “specializations” based on industry job counts versus national average. However, to find true advantages in the global marketplace, that review then must identify very specific sub-sectoral targets versus broad industry classes (e.g. “manufacturing” vs “industrial machinery production”). It also must consider how traditional industries are blending into new hybrid sectors that are not captured within a single existing standard industry classifications (e.g. unmanned aerial vehicles).
Further, to forecast opportunities outside of historic industry segments, the Market Assessment considers diverse factors that better gauge emerging and future sectoral opportunities, such as:
• transferability of prevalent occupational skill-sets into new industry areas;
• cross-disciplinary links in innovation and R&D activities with commercial applications;
• potential to build off one sub-sector strength into another part of the value chain;
• global market trends;
• policy influences on future demand and funding availability;
• competitor regions or niche.
With evidence of economic potential, the relative value of those options can be considered to set priorities:
• multiplier effects on other job creation;
• job quality and accessibility.
The Market Assessment approach to prioritizing sector opportunities overlays multiple criteria to build a holistic view of a region’s unique economic DNA using both data and qualitative inputs. While evidence-based, this analysis is discretionary versus formulaic, requiring interpretation and weighting. The factors explicitly consider the core drivers of economic competitiveness and all three dimensions of regional economic development success – growth, prosperity, and inclusion.
Talent adjacencies
Innovation capacities and connections
Value chain position, global market trends, competitive niche
Concentration and performance by industry and cluster
Economic multiplier effects
Policy environment
`
Traded Sectors
Job quality and opportunity

107B3K Market Assessment |
Finding #2: Sector analysis seeks to gauge comparative advantages, adjacencies, potential
Recognizing that targeting clusters plays a pivotal role as the global economy rewards regional specialization and concentration, the challenge is how to identify and prioritize opportunities to achieve economic development goals. Rarely do these emerge from scratch, and then most often by good fortune versus intervention. Virtually every successful cluster has emerged from entrepreneurial activity that relates to evolution off a historic strength, via convergence of disciplines, commercialization of research, or talent spinning off into new ventures. Otherwise, accelerated outcomes are linked to major public or philanthropic investments such as establishing centers of excellence that draw new innovators and businesses looking to be close to assets, subsidizing capture of very high-value anchors, or defense spending.
Sometimes the sectoral choices are obvious – a critical mass of interdependent firms that jointly benefit from sharing upstream and downstream supply chains and tailored infrastructure, matching specialized talent from a deep common labor market, and learning through open innovation assets and knowledge transfers.
More often, “emerging” subsector strengths are hidden by lack of regional scale or specialization relative to other markets, but can be uncovered by observing growth off a relatively low base complemented by data on other selection factors. However, these data often present an inconsistent picture across criteria, so weighting and evaluation depends on discretion.
To identify these possibilities, the region’s industry mix set was assessed for deeper consideration based on a minimum threshold of factors –1. Traded sector activity2. National job growth3. Regional job growth4. Contain industry categories that are individually or collectively either:
(i) specialized in Greater Bakersfield and/or East Kern; or(ii) exceeding national performance in Greater Bakersfield and/or East Kern.
5. Indirect job multipliers greater than 1.06. Offer a combined good and promising job concentration above the regional average (with “other jobs” less than the average)
In some instances, subsectors were retained that did not meet all threshold criteria but were frequently raised in qualitative discussions or appeared strategic for review based on regional outlier characteristics or contiguity to other industries, institutional assets, or supply chain links.
Categories that passed were evaluated using data on growth and demand trajectories, economic effects, institutional research capacity relevance, skills transferability, and concentration of job quality. Current job counts were used to interpret growth, but not factored heavily given the purpose of identifying emerging and adjacent potential.
Applying these techniques to the evidence base, the Market Assessment prioritization suggested four sets of Opportunity Industry subsectors that would benefit most from greater economic development focus to generate higher quality, accessible job growth built on the region’s assets – (1) renewable fuels and carbon management; (2) aerospace; (3) “advanced” manufacturing subsectors like chemicals, plastics, metalworking, and machinery, as well as aerospace and food; and (4) business services outsourcing / “second office.”
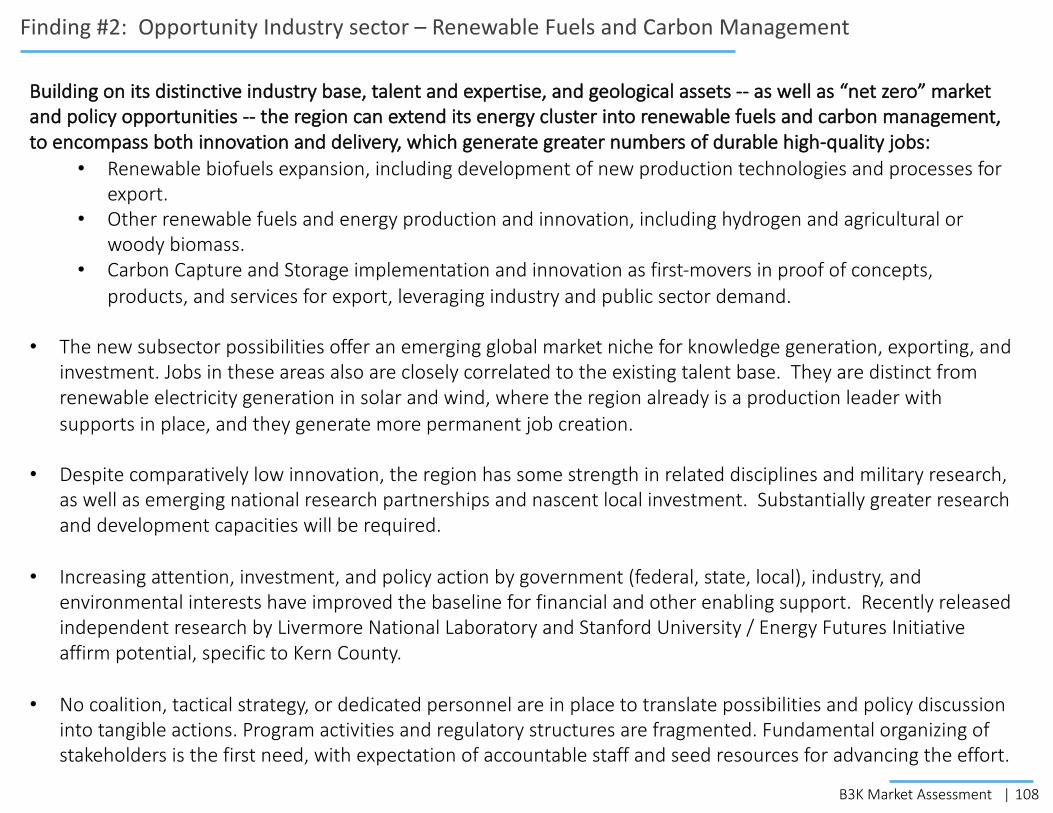
108B3K Market Assessment |
Finding #2: Opportunity Industry sector – Renewable Fuels and Carbon Management
Building on its distinctive industry base, talent and expertise, and geological assets -- as well as “net zero” market and policy opportunities -- the region can extend its energy cluster into renewable fuels and carbon management, to encompass both innovation and delivery, which generate greater numbers of durable high-quality jobs:
• Renewable biofuels expansion, including development of new production technologies and processes for export.
• Other renewable fuels and energy production and innovation, including hydrogen and agricultural or woody biomass.
• Carbon Capture and Storage implementation and innovation as first-movers in proof of concepts, products, and services for export, leveraging industry and public sector demand.
• The new subsector possibilities offer an emerging global market niche for knowledge generation, exporting, and investment. Jobs in these areas also are closely correlated to the existing talent base. They are distinct from renewable electricity generation in solar and wind, where the region already is a production leader with supports in place, and they generate more permanent job creation.
• Despite comparatively low innovation, the region has some strength in related disciplines and military research, as well as emerging national research partnerships and nascent local investment. Substantially greater research and development capacities will be required.
• Increasing attention, investment, and policy action by government (federal, state, local), industry, and environmental interests have improved the baseline for financial and other enabling support. Recently released independent research by Livermore National Laboratory and Stanford University / Energy Futures Initiative affirm potential, specific to Kern County.
• No coalition, tactical strategy, or dedicated personnel are in place to translate possibilities and policy discussion into tangible actions. Program activities and regulatory structures are fragmented. Fundamental organizing of stakeholders is the first need, with expectation of accountable staff and seed resources for advancing the effort.
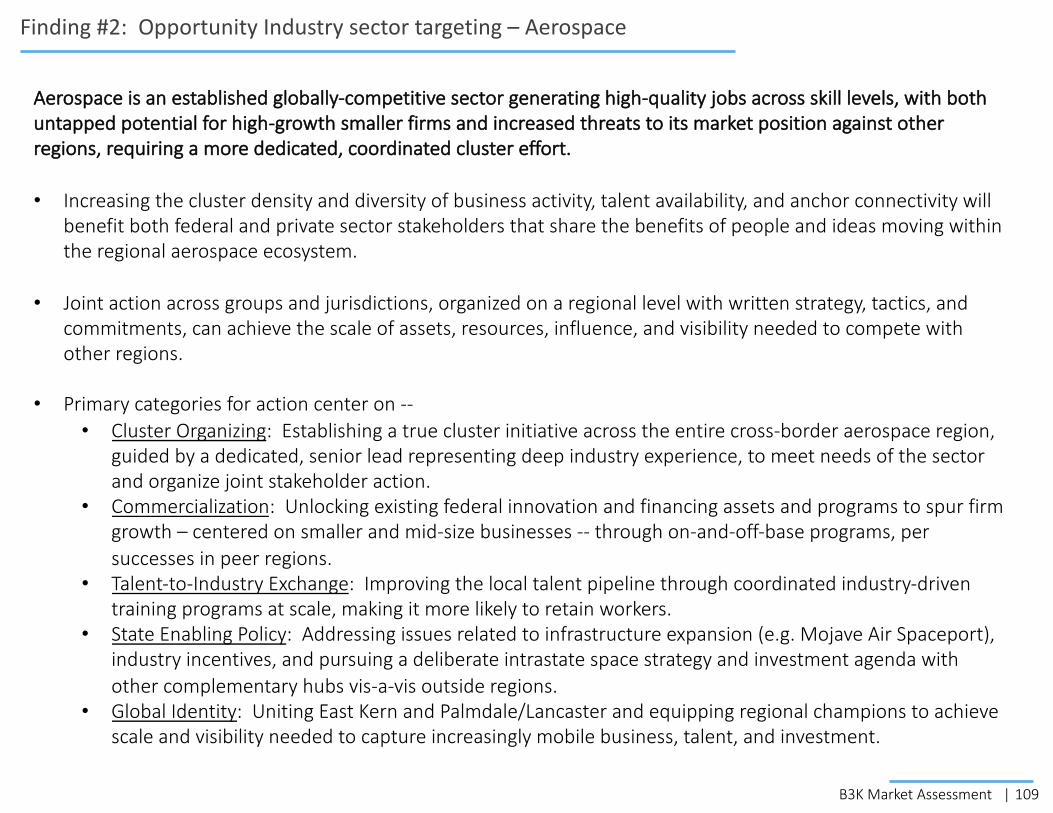
109B3K Market Assessment |
Finding #2: Opportunity Industry sector targeting – Aerospace
Aerospace is an established globally-competitive sector generating high-quality jobs across skill levels, with both untapped potential for high-growth smaller firms and increased threats to its market position against other regions, requiring a more dedicated, coordinated cluster effort.
• Increasing the cluster density and diversity of business activity, talent availability, and anchor connectivity will benefit both federal and private sector stakeholders that share the benefits of people and ideas moving within the regional aerospace ecosystem.
• Joint action across groups and jurisdictions, organized on a regional level with written strategy, tactics, and commitments, can achieve the scale of assets, resources, influence, and visibility needed to compete with other regions.
• Primary categories for action center on --• Cluster Organizing: Establishing a true cluster initiative across the entire cross-border aerospace region,
guided by a dedicated, senior lead representing deep industry experience, to meet needs of the sector and organize joint stakeholder action.
• Commercialization: Unlocking existing federal innovation and financing assets and programs to spur firm growth – centered on smaller and mid-size businesses -- through on-and-off-base programs, per successes in peer regions.
• Talent-to-Industry Exchange: Improving the local talent pipeline through coordinated industry-driven training programs at scale, making it more likely to retain workers.
• State Enabling Policy: Addressing issues related to infrastructure expansion (e.g. Mojave Air Spaceport), industry incentives, and pursuing a deliberate intrastate space strategy and investment agenda with other complementary hubs vis-a-vis outside regions.
• Global Identity: Uniting East Kern and Palmdale/Lancaster and equipping regional champions to achieve scale and visibility needed to capture increasingly mobile business, talent, and investment.

110B3K Market Assessment |
Finding #2: Opportunity Industry sector targeting – Advanced Manufacturing Subsectors
Certain manufacturing subsectors that generate accessible quality jobs show a notable concentration and/or growth against trends, which could be accelerated – through expansion or attraction -- by providing supports targeted to industry needs that are more common in other regions.
• Evaluation of subsector characteristics indicate foundations in specific “advanced” categories that emphasize STEM research and workers – aspects of chemicals, plastics, metalworking, and machinery, as well as aerospace; suggesting potential for expansion within or adjacent to their current market activities. Although food manufacturing does not perform as well on opportunity metrics, it also offers potential for improving the number and quality of jobs within regional strengths.
• Evaluation first triaged whether the region met a minimum competitive position against others. Then, after determining an advantage, the data compared the relative strength and opportunity for each subsector against each other within the region itself to help prioritize options.
• Notwithstanding common state impediments of higher costs and regulation, authentic enablers for expanded manufacturing include growing logistics capabilities and location advantages, talent adjacency, and emerging workforce training assets.
• Typical acceleration supports for manufacturing firms – especially benefitting smaller and middle-market establishments – include intermediaries that create scale and coordinated access to talent pipelines and incumbent worker development, innovation identification and adoption, and problem-solving in product or processes.
• Identifying and securing manufacturing attraction and expansion opportunities might be better achieved by prioritizing and linking efforts among various contributors -- commercial real estate developers, economic developers, workforce program leads, and university / federal researchers, plus more targeted government incentives and infrastructure investments.
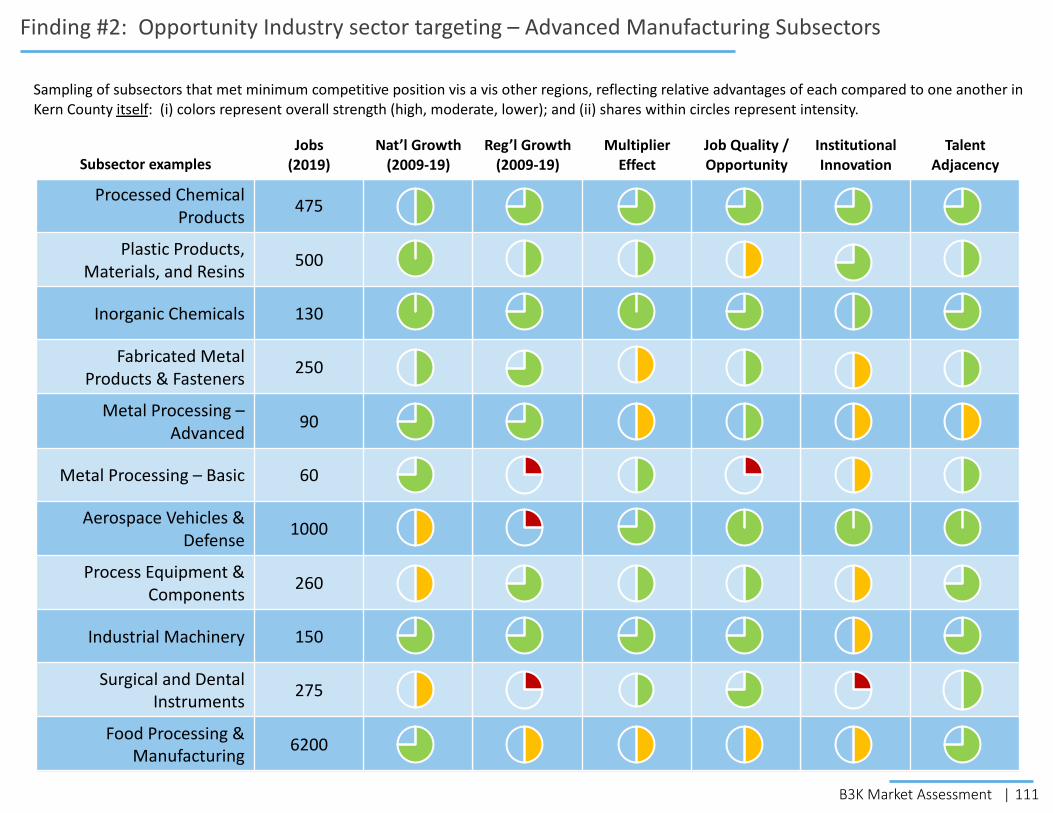
111B3K Market Assessment |
Finding #2: Opportunity Industry sector targeting – Advanced Manufacturing Subsectors
Subsector examplesJobs
(2019)Nat’l Growth
(2009-19)Reg’l Growth
(2009-19)Multiplier
EffectJob Quality / Opportunity
Institutional Innovation
TalentAdjacency
Processed Chemical Products 475
Plastic Products, Materials, and Resins 500
Inorganic Chemicals 130
Fabricated Metal Products & Fasteners 250
Metal Processing –Advanced 90
Metal Processing – Basic 60
Aerospace Vehicles & Defense 1000
Process Equipment & Components 260
Industrial Machinery 150
Surgical and Dental Instruments 275
Food Processing & Manufacturing 6200
Sampling of subsectors that met minimum competitive position vis a vis other regions, reflecting relative advantages of each compared to one another in Kern County itself: (i) colors represent overall strength (high, moderate, lower); and (ii) shares within circles represent intensity.
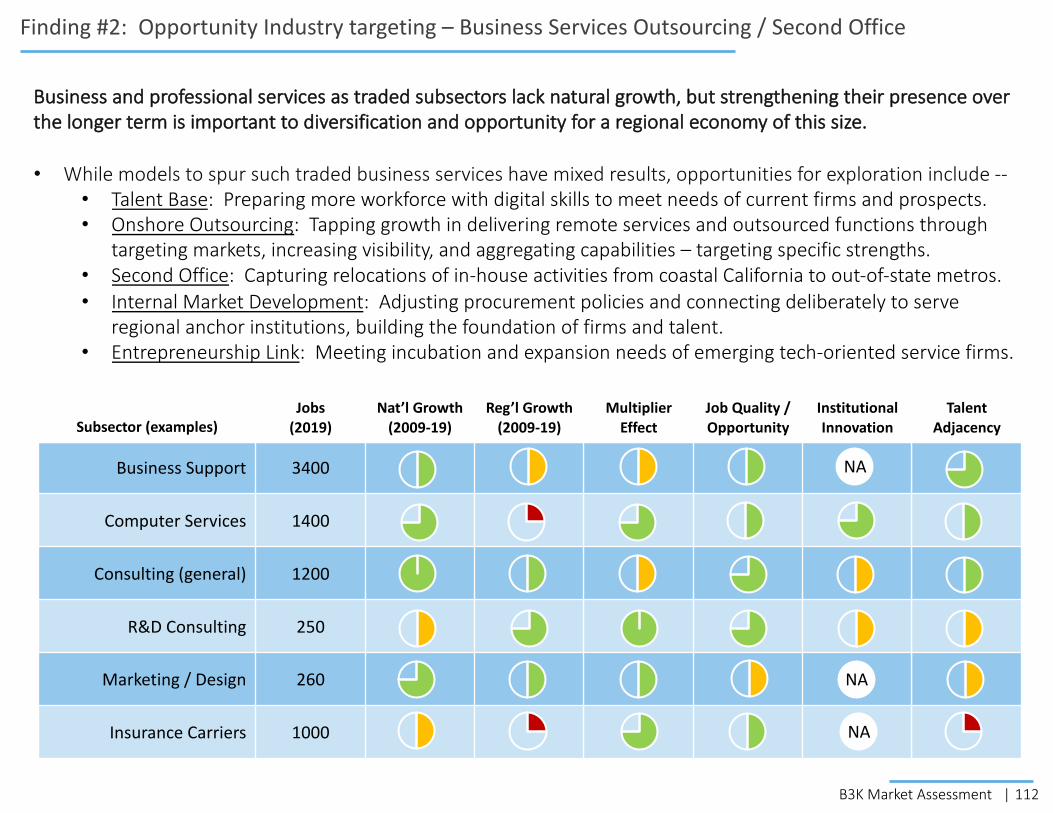
112B3K Market Assessment |
Finding #2: Opportunity Industry targeting – Business Services Outsourcing / Second Office
Subsector (examples)Jobs
(2019)Nat’l Growth
(2009-19)Reg’l Growth
(2009-19)Multiplier
EffectJob Quality / Opportunity
Institutional Innovation
TalentAdjacency
Business Support 3400
Computer Services 1400
Consulting (general) 1200
R&D Consulting 250
Marketing / Design 260
Insurance Carriers 1000
NA
NA
NA
Business and professional services as traded subsectors lack natural growth, but strengthening their presence over the longer term is important to diversification and opportunity for a regional economy of this size.
• While models to spur such traded business services have mixed results, opportunities for exploration include --• Talent Base: Preparing more workforce with digital skills to meet needs of current firms and prospects. • Onshore Outsourcing: Tapping growth in delivering remote services and outsourced functions through
targeting markets, increasing visibility, and aggregating capabilities – targeting specific strengths.• Second Office: Capturing relocations of in-house activities from coastal California to out-of-state metros.• Internal Market Development: Adjusting procurement policies and connecting deliberately to serve
regional anchor institutions, building the foundation of firms and talent.• Entrepreneurship Link: Meeting incubation and expansion needs of emerging tech-oriented service firms.
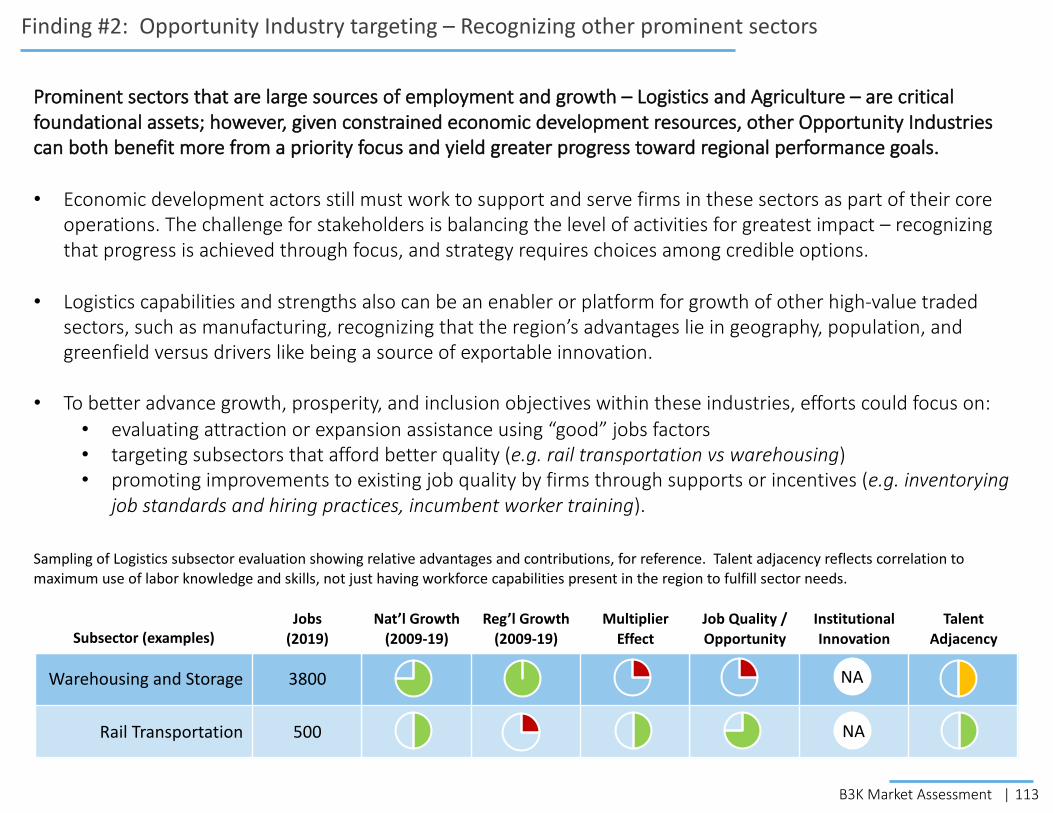
113B3K Market Assessment |
Finding #2: Opportunity Industry targeting – Recognizing other prominent sectors
Prominent sectors that are large sources of employment and growth – Logistics and Agriculture – are critical foundational assets; however, given constrained economic development resources, other Opportunity Industries can both benefit more from a priority focus and yield greater progress toward regional performance goals.
• Economic development actors still must work to support and serve firms in these sectors as part of their core operations. The challenge for stakeholders is balancing the level of activities for greatest impact – recognizing that progress is achieved through focus, and strategy requires choices among credible options.
• Logistics capabilities and strengths also can be an enabler or platform for growth of other high-value traded sectors, such as manufacturing, recognizing that the region’s advantages lie in geography, population, and greenfield versus drivers like being a source of exportable innovation.
• To better advance growth, prosperity, and inclusion objectives within these industries, efforts could focus on: • evaluating attraction or expansion assistance using “good” jobs factors• targeting subsectors that afford better quality (e.g. rail transportation vs warehousing)• promoting improvements to existing job quality by firms through supports or incentives (e.g. inventorying
job standards and hiring practices, incumbent worker training).
Subsector (examples)Jobs
(2019)Nat’l Growth
(2009-19)Reg’l Growth
(2009-19)Multiplier
EffectJob Quality / Opportunity
Institutional Innovation
TalentAdjacency
Warehousing and Storage 3800
Rail Transportation 500
NA
NA
Sampling of Logistics subsector evaluation showing relative advantages and contributions, for reference. Talent adjacency reflects correlation to maximum use of labor knowledge and skills, not just having workforce capabilities present in the region to fulfill sector needs.

114B3K Market Assessment |
Finding #3: Fundamental entrepreneurship and business supports are required to fill gaps
Basic business and entrepreneurship supports need to be established or scaled to address core issues: durability of young firms, creation of more traded sector firms with high growth potential, and expansion of mid-sized companies.
• The region lacks foundational resources common in comparably-sized areas, such as business incubators or accelerators.
• Existing technical assistance resources and access to problem-solving for innovation adoption or workforce support are not at a scale to have impact.
• Entrepreneurs face challenges raising capital without the presence of a well-resourced, locally-based CDFI or transparency around alternative funding sources.
• Targeted programming and interventions to address barriers to women and minority entrepreneurs are underdeveloped throughout the region.
• Efforts can be (1) organized by stage of firm life cycle; (2) differentiated between “Main Street” locally-serving businesses versus traded sector growth businesses; and (3) categorized among technical assistance, capital, and infrastructure needs.

115B3K Market Assessment |
Finding #4: Economic Development Delivery Ecosystem requires adjustments to achieve vision
The economic development delivery ecosystem currently has significant implementation gaps that must be filled to execute a comprehensive regional strategy.
• The region lacks a shared vision, goals, and metrics for regional economic success toward which all economic development contributors can orient.
• Implementation of prior strategic ideas has faltered without clear ownership, attention, accountability, or authority for execution, and attendant resource commitments.• “Clusters” previously named as regional priorities were not supported by any actual cluster development
strategies or initiatives, nor was structure established for targeted, ongoing collaboration with industry to identify and fill distinctive needs.
• Interactions among economic development contributors rarely result in functional collaborations or joint programmatic implementation, versus information exchange and networking.• Impediments to more substantive collaboration include outcomes against which organizations and
individual performance is measured, with few incentives or resources rewarding such efforts; institutional self-interest and competition for limited resources; difficulty changing long-standing practices; and no agreed “center of gravity” or consistent forum to transparently vet, organize, and partner around opportunities.
• The delivery system is not structured to sufficiently account for race and gender disparities and the distinctive needs of specific populations.
• Compared to other regions, the business community does not take a leadership role in setting and implementing an economic development agenda for collective benefit.
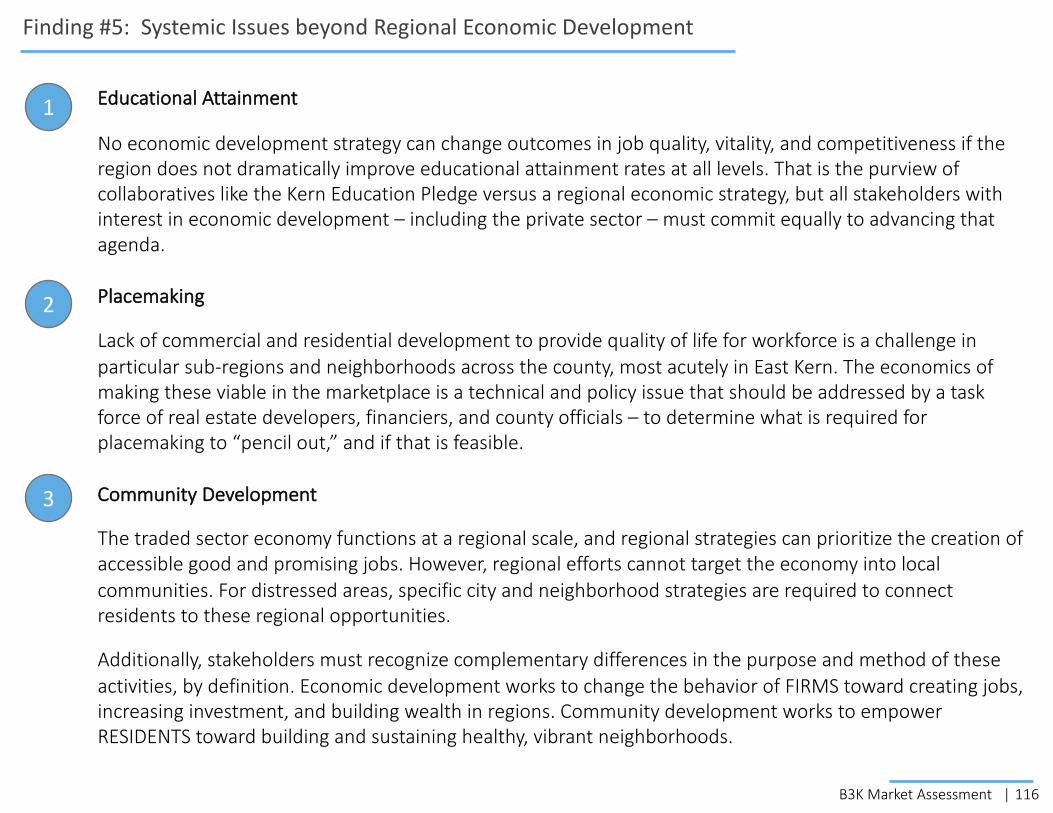
116B3K Market Assessment |
Finding #5: Systemic Issues beyond Regional Economic Development
Educational Attainment
No economic development strategy can change outcomes in job quality, vitality, and competitiveness if the region does not dramatically improve educational attainment rates at all levels. That is the purview of collaboratives like the Kern Education Pledge versus a regional economic strategy, but all stakeholders with interest in economic development – including the private sector – must commit equally to advancing that agenda.
Placemaking
Lack of commercial and residential development to provide quality of life for workforce is a challenge in particular sub-regions and neighborhoods across the county, most acutely in East Kern. The economics of making these viable in the marketplace is a technical and policy issue that should be addressed by a task force of real estate developers, financiers, and county officials – to determine what is required for placemaking to “pencil out,” and if that is feasible.
Community Development
The traded sector economy functions at a regional scale, and regional strategies can prioritize the creation of accessible good and promising jobs. However, regional efforts cannot target the economy into local communities. For distressed areas, specific city and neighborhood strategies are required to connect residents to these regional opportunities.
Additionally, stakeholders must recognize complementary differences in the purpose and method of these activities, by definition. Economic development works to change the behavior of FIRMS toward creating jobs, increasing investment, and building wealth in regions. Community development works to empower RESIDENTS toward building and sustaining healthy, vibrant neighborhoods.
1
2
3
117B3K Market Assessment |
Acknowledgements
This data book was made possible by generous support from: State of California – Labor & Workforce Development AgencyKern CountyKern Inyo Mono Counties Workforce Development BoardCity of BakersfieldBank of America and Stria.
More than 250 people contributed to quantitative and qualitative research undertaken to generate insights, contextualize findings, inventory programs, and consider civic governance capacity. These individuals dedicated time as members of the Steering, Executive, or Research Committees; participants in community engagement sessions or roundtables; interviewees representing civic, government, academic, or business perspectives; continuing topical advisors; and outside peer practitioners and experts. For many, this assistance represented weeks of volunteer effort providing input or regular consultation to ensure local relevance and resonance.
In particular among these contributors, the “core team” leadership and staff of the Kern Community Foundation, Greater Bakersfield Chamber of Commerce, Kern County, Kern County Economic Development Corporation, Kern Community College District, California State University Bakersfield, and City of Bakersfield provided extensive support to aid production of the data book. This assistance included in-kind research, outreach, communications, and project management support.
Special thanks and recognition goes to Kristen Beall Watson and Cristina Camacho at the Kern Community Foundation and Nick Ortiz, Kaelyn Peterson and Frances Klingenberger at the Bakersfield Chamber who provided day to day project support and management. Your passion and vision for the future of Bakersfield and Kern County brought this project to life and we are grateful for your partnership.
The analysis, conclusions, and recommendations presented in this data book are solely those of its authors, and do not reflect the views of any organizations or individuals that sponsored or contributed to the work, or with whom the authors are otherwise affiliated. The authors of this data book recognize that the value they provide are based on an absolute commitment to objective, candid, high-quality research and practical problem-solving for policymakers and the public. All activities or work products reflect this dedication to independence and impact.