mark scheme: paper 2 challenges in the human environment
TRANSCRIPT
GCSE
GEOGRAPHY
8035/2 Paper 2 Challenges in the human environment
Mark scheme June 2019 Version: 1.0 Final
*196G8035/2/MS*
MARK SCHEME – GCSE GEOGRAPHY – 8035/2 – JUNE 2019
Mark schemes are prepared by the Lead Assessment Writer and considered, together with the relevant questions, by a panel of subject teachers. This mark scheme includes any amendments made at the standardisation events which all associates participate in and is the scheme which was used by them in this examination. The standardisation process ensures that the mark scheme covers the students’ responses to questions and that every associate understands and applies it in the same correct way. As preparation for standardisation each associate analyses a number of students’ scripts. Alternative answers not already covered by the mark scheme are discussed and legislated for. If, after the standardisation process, associates encounter unusual answers which have not been raised they are required to refer these to the Lead Examiner. It must be stressed that a mark scheme is a working document, in many cases further developed and expanded on the basis of students’ reactions to a particular paper. Assumptions about future mark schemes on the basis of one year’s document should be avoided; whilst the guiding principles of assessment remain constant, details will change, depending on the content of a particular examination paper. Further copies of this mark scheme are available from aqa.org.uk
Copyright © 2019 AQA and its licensors. All rights reserved. AQA retains the copyright on all its publications. However, registered schools/colleges for AQA are permitted to copy material from this booklet for their own internal use, with the following important exception: AQA cannot give permission to schools/colleges to photocopy any material that is acknowledged to a third party even for internal use within the centre.
2

MARK SCHEME – GCSE GEOGRAPHY – 8035/2 – JUNE 2019
Point marked questions marking instructions
The mark scheme will state the correct answer or a range of possible answers, although these may not be exhaustive. It may indicate how a second mark is awarded for a second point or developed idea. It may give an indication of unacceptable answers. Each mark should be shown by placing a tick where credit is given. The number of ticks must equal the mark awarded. Do not use crosses to indicate answers that are incorrect.
Level of response marking instructions
Level of response mark schemes are broken down into levels, each of which has a descriptor. The descriptor is linked to the assessment objective(s) being addressed. The descriptor for the level shows the average performance for the level.
Before you apply the mark scheme to a student’s answer read through the answer and annotate it (as instructed) to show the qualities that are being looked for. You can then apply the mark scheme. You should read the whole answer before awarding marks on levels response questions.
Step 1 Determine a level
Descriptors for the level indicate the different qualities that might be seen in the student’s answer for that level. When assigning a level you should look at the overall quality of the answer and not look to pick holes in small and specific parts of the answer where the student has not performed quite as well as the rest. If the answer covers different aspects of different levels of the mark scheme you should use a best fit approach for defining the level and then use the variability of the response to help decide the mark within the level, ie if the response is predominantly Level 2 with a small amount of Level 3 material it would be placed in Level 2 but be awarded a mark near the top of the level because of the Level 3 content. For instance, in a 9 mark question with three levels of response, an answer may demonstrate thorough knowledge and understanding (AO1 and AO2) but fail to respond to command words such as assess or evaluate (AO3). The script could still access Level 2 marks. Note that the mark scheme is not progressive in the sense that students don’t have to fulfil all the requirements of Level 1 in order to access Level 2.
Step 2 Determine a mark
Once you have assigned a level you need to decide on the mark. The descriptors on how to allocate marks can help with this. The exemplar materials used during standardisation will also help. There will generally be an answer in the standardising materials which will correspond with each level of the mark scheme. This answer will have been awarded a mark by the Lead Examiner. You can compare the student’s answer with the example to determine if it is the same standard, better or worse than the example. You can then use this to allocate a mark for the answer based on the Lead Examiner’s mark on the example.
You may well need to read back through the answer as you apply the mark scheme to clarify points and assure yourself that the level and the mark are appropriate.
Indicative content in the mark scheme is provided as a guide for examiners. It is not intended to be exhaustive and you must credit other valid points. Students do not have to cover all of the points mentioned in the indicative content to reach the highest level of the mark scheme.
An answer which contains nothing of relevance to the question must be awarded no marks.
3
MARK SCHEME – GCSE GEOGRAPHY – 8035/2 – JUNE 2019
Assessment of spelling, punctuation, grammar and use of specialist terminology (SPaG)
Accuracy of spelling, punctuation, grammar and the use of specialist terminology will be assessed via the indicated 9 mark questions. In each of these questions, three marks are allocated for SPaG as follows:
• High performance – 3 marks
• Intermediate performance – 2 marks
• Threshold performance – 1 mark
General guidance
• Mark schemes should be applied positively. Examiners should look for qualities to reward rather than faults to penalise. They are looking to find credit in each response they mark. Unless the mark scheme specifically states, candidates must never lose marks for incorrect answers.
• The full range of marks should be used. Examiners should always award full marks if deserved, ie if the answer matches the mark scheme.
• When examiners are in doubt regarding the application of the mark scheme to a candidate’s response, the team leader must be consulted.
• Crossed out work should be marked unless the candidate has replaced it with an alternative response. • Do NOT add ticks to level-marked questions – use the highlight tool/brackets to signify what is
relevant. • Sometimes there are specific “triggers” in the mark scheme that enable higher level marks to be
awarded. For instance, an example or case study may be required for Level 3 if it is stated within the question.
• Where a source, such as a photograph or map, is provided as a stimulus it should be used if requested in the question, but credit can often be given for inferred as well as direct use of the source.
• Always be consistent – accept the guidelines given in the mark scheme and apply them to every script.
• If necessary make comments to support the level awarded and to help clarify a decision you have made.
• Examiners should revisit standardised script answers as they apply the mark scheme in order to confirm that the level and the mark allocated is appropriate to the response provided.
• Mark all answers written on the examination paper.
4
MARK SCHEME – GCSE GEOGRAPHY – 8035/2 – JUNE 2019
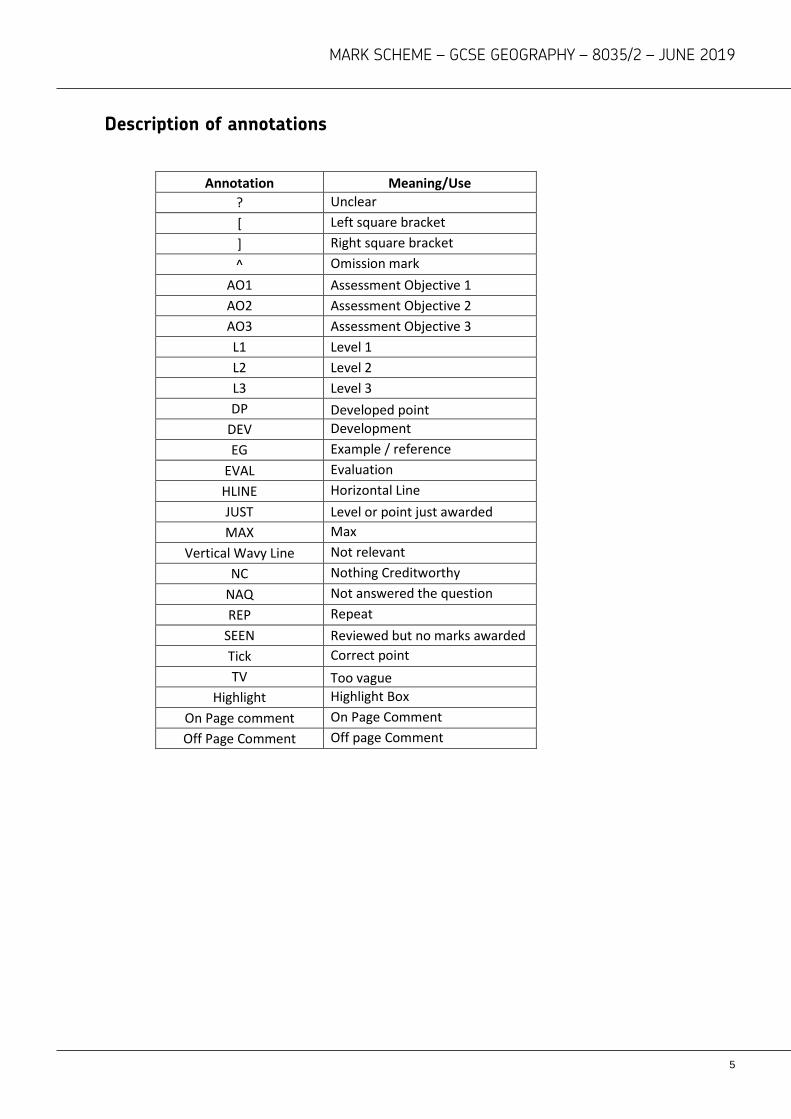
Description of annotations
Annotation Meaning/Use ? Unclear [ Left square bracket ] Right square bracket ^ Omission mark
AO1 Assessment Objective 1 AO2 Assessment Objective 2 AO3 Assessment Objective 3 L1 Level 1 L2 Level 2 L3 Level 3 DP Developed point
DEV Development EG Example / reference
EVAL Evaluation HLINE Horizontal Line JUST Level or point just awarded MAX Max
Vertical Wavy Line Not relevant NC Nothing Creditworthy
NAQ Not answered the question REP Repeat
SEEN Reviewed but no marks awarded Tick Correct point TV Too vague
Highlight Highlight Box On Page comment On Page Comment Off Page Comment Off page Comment
5

MARK SCHEME – GCSE GEOGRAPHY – 8035/2 – JUNE 2019
Section A Qu Pt Marking Guidance Total
marks 01 1 Use the following data to complete Figure 1.
One mark for correct completion of each element of the bar, with some shading of lower section. They should be ‘stacked’, not superimposed or adjacent, in the same order as the other bars, Width can be ignored. AO4 = 2 marks
2
01 2 Outline one reason why rates of natural increase are high in many cities
in LIC/NEEs. The question focuses on natural increase, it should be clear the candidate is referring to this and not migration. One mark for an initial overall comment or single relevant statement eg: • there is better healthcare (1) • the population is younger (1) • the birth rate is higher in cities than rural areas (1) Second mark for developing the comment eg: • there is better healthcare (1) so more children survive and the population
grows (d)(1)/reducing the death rate in relation to the birth rate and leading to natural increase (d)(1)
• the population is younger (1) so they are more likely to have children and increase the population (d)(1)
• the birth rate is higher in cities than rural areas (1) because of the relatively youthful population (d)(1).
No credit for definition of natural increase. Allow 1 mark for generic comment on population increase re LIC/NEE population increase AO1 = 2 marks
2
01 3 Give one way in which a major city in a LIC/NEE is internationally
important. Credit any reasonable statement in relation to the named city. Eg: • Lagos – the main financial centre for West Africa
1
6

MARK SCHEME – GCSE GEOGRAPHY – 8035/2 – JUNE 2019
• Mumbai – the home of ‘Bollywood’, the Indian film industry.
No credit for HIC city. AO1 = 1 marks
7
MARK SCHEME – GCSE GEOGRAPHY – 8035/2 – JUNE 2019
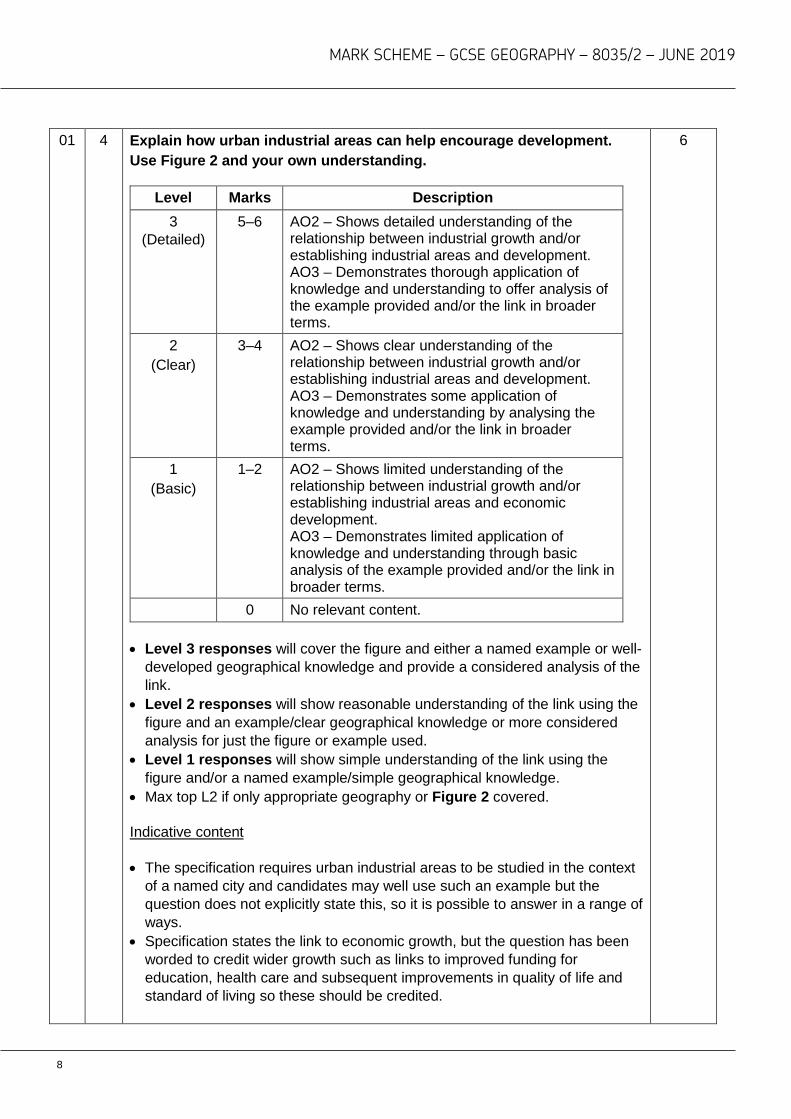
01 4 Explain how urban industrial areas can help encourage development.
Use Figure 2 and your own understanding.
Level Marks Description 3
(Detailed) 5–6 AO2 – Shows detailed understanding of the
relationship between industrial growth and/or establishing industrial areas and development. AO3 – Demonstrates thorough application of knowledge and understanding to offer analysis of the example provided and/or the link in broader terms.
2 (Clear)
3–4 AO2 – Shows clear understanding of the relationship between industrial growth and/or establishing industrial areas and development. AO3 – Demonstrates some application of knowledge and understanding by analysing the example provided and/or the link in broader terms.
1 (Basic)
1–2 AO2 – Shows limited understanding of the relationship between industrial growth and/or establishing industrial areas and economic development. AO3 – Demonstrates limited application of knowledge and understanding through basic analysis of the example provided and/or the link in broader terms.
0 No relevant content. • Level 3 responses will cover the figure and either a named example or well-
developed geographical knowledge and provide a considered analysis of the link.
• Level 2 responses will show reasonable understanding of the link using the figure and an example/clear geographical knowledge or more considered analysis for just the figure or example used.
• Level 1 responses will show simple understanding of the link using the figure and/or a named example/simple geographical knowledge.
• Max top L2 if only appropriate geography or Figure 2 covered. Indicative content
• The specification requires urban industrial areas to be studied in the context
of a named city and candidates may well use such an example but the question does not explicitly state this, so it is possible to answer in a range of ways.
• Specification states the link to economic growth, but the question has been worded to credit wider growth such as links to improved funding for education, health care and subsequent improvements in quality of life and standard of living so these should be credited.
6
8

MARK SCHEME – GCSE GEOGRAPHY – 8035/2 – JUNE 2019
• Question does not insist on LIC/NEE context, HIC development could be valid.
• Reference to Figure 2 may be inferred even if not explicitly stated through comment on the infrastructure nearby, a Pacific Rim location or the variety of industries developed.
• Figure shows how a central location within the country and proximity to roads, rail, port and airport attract foreign investment allowing a range of industries to develop.
• The command ‘explain’ requires a link to be established between establishing opportunity and subsequent wider growth such as the creation of home markets as incomes rise and broader ideas of a multiplier effect.
• Specific examples may be used such as the Delhi-Mumbai Industrial Corridor or more general approaches such as Lagos as a major west African centre.
• DMIC: aiming to double employment in the region and quadruple exports by developing a wide corridor of improved infrastructure, pre-built factory sites and ‘smart cities’.
• Lagos has developed with good transport connections and expanding market for goods and services have attracted other industries to locate there.
AO2 = 3 marks, AO3 = 3 marks
01 5 What is the approximate area covered by Area Y?
One mark for the correct answer. A 0.1 km2 No credit if two or more statements are shaded. AO4 = 1 mark
1
01 6 Give the four-figure grid reference for the Albert Dock.
One mark for the correct answer. 3489 No credit for 6 figure GR AO4 = 1 mark
1
9
MARK SCHEME – GCSE GEOGRAPHY – 8035/2 – JUNE 2019
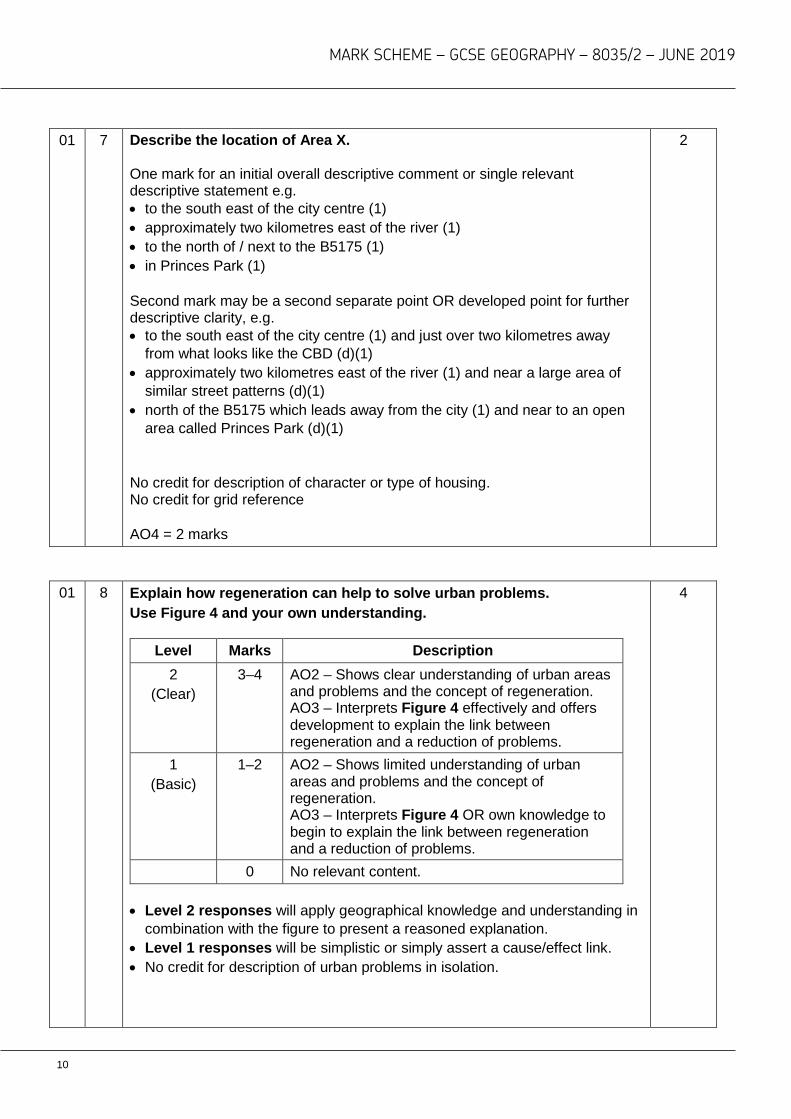
01 7 Describe the location of Area X.
One mark for an initial overall descriptive comment or single relevant descriptive statement e.g. • to the south east of the city centre (1) • approximately two kilometres east of the river (1) • to the north of / next to the B5175 (1) • in Princes Park (1) Second mark may be a second separate point OR developed point for further descriptive clarity, e.g. • to the south east of the city centre (1) and just over two kilometres away
from what looks like the CBD (d)(1) • approximately two kilometres east of the river (1) and near a large area of
similar street patterns (d)(1) • north of the B5175 which leads away from the city (1) and near to an open
area called Princes Park (d)(1)
No credit for description of character or type of housing. No credit for grid reference AO4 = 2 marks
2
01 8 Explain how regeneration can help to solve urban problems.
Use Figure 4 and your own understanding.
Level Marks Description 2
(Clear) 3–4 AO2 – Shows clear understanding of urban areas
and problems and the concept of regeneration. AO3 – Interprets Figure 4 effectively and offers development to explain the link between regeneration and a reduction of problems.
1 (Basic)
1–2 AO2 – Shows limited understanding of urban areas and problems and the concept of regeneration. AO3 – Interprets Figure 4 OR own knowledge to begin to explain the link between regeneration and a reduction of problems.
0 No relevant content. • Level 2 responses will apply geographical knowledge and understanding in
combination with the figure to present a reasoned explanation. • Level 1 responses will be simplistic or simply assert a cause/effect link. • No credit for description of urban problems in isolation.
4
10
MARK SCHEME – GCSE GEOGRAPHY – 8035/2 – JUNE 2019
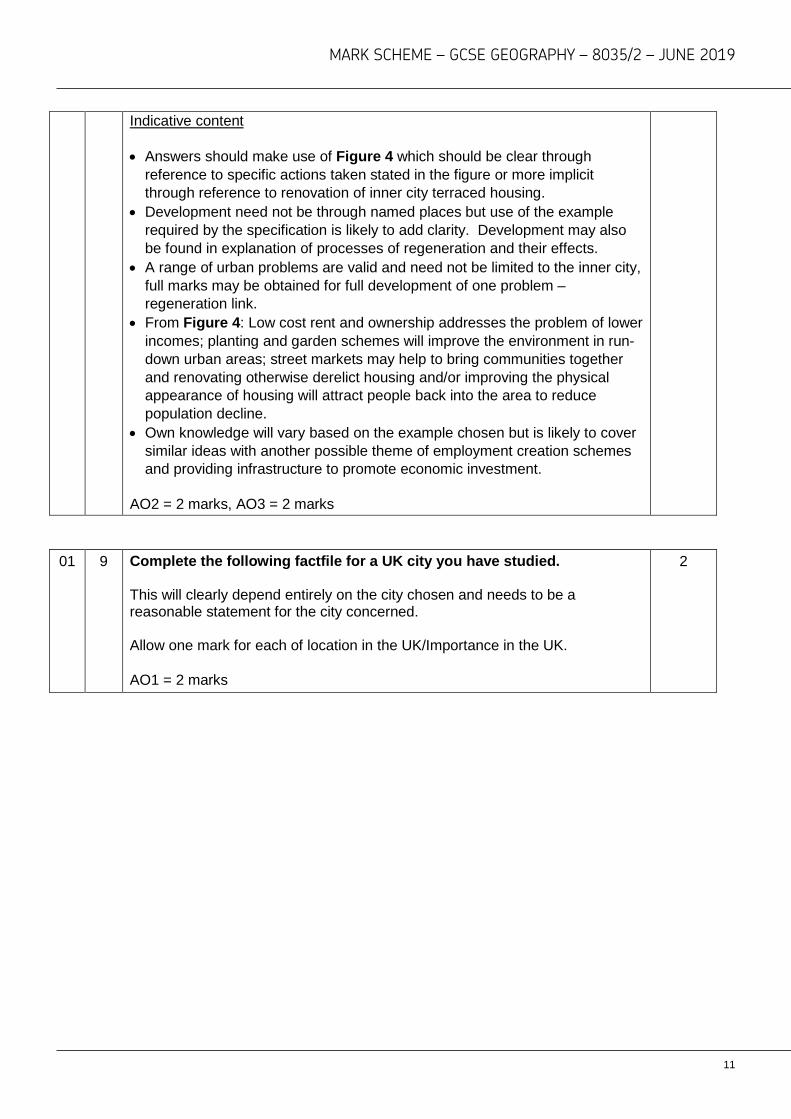
Indicative content
• Answers should make use of Figure 4 which should be clear through reference to specific actions taken stated in the figure or more implicit through reference to renovation of inner city terraced housing.
• Development need not be through named places but use of the example required by the specification is likely to add clarity. Development may also be found in explanation of processes of regeneration and their effects.
• A range of urban problems are valid and need not be limited to the inner city, full marks may be obtained for full development of one problem – regeneration link.
• From Figure 4: Low cost rent and ownership addresses the problem of lower incomes; planting and garden schemes will improve the environment in run-down urban areas; street markets may help to bring communities together and renovating otherwise derelict housing and/or improving the physical appearance of housing will attract people back into the area to reduce population decline.
• Own knowledge will vary based on the example chosen but is likely to cover similar ideas with another possible theme of employment creation schemes and providing infrastructure to promote economic investment.
AO2 = 2 marks, AO3 = 2 marks
01 9 Complete the following factfile for a UK city you have studied.
This will clearly depend entirely on the city chosen and needs to be a reasonable statement for the city concerned. Allow one mark for each of location in the UK/Importance in the UK. AO1 = 2 marks
2
11
MARK SCHEME – GCSE GEOGRAPHY – 8035/2 – JUNE 2019
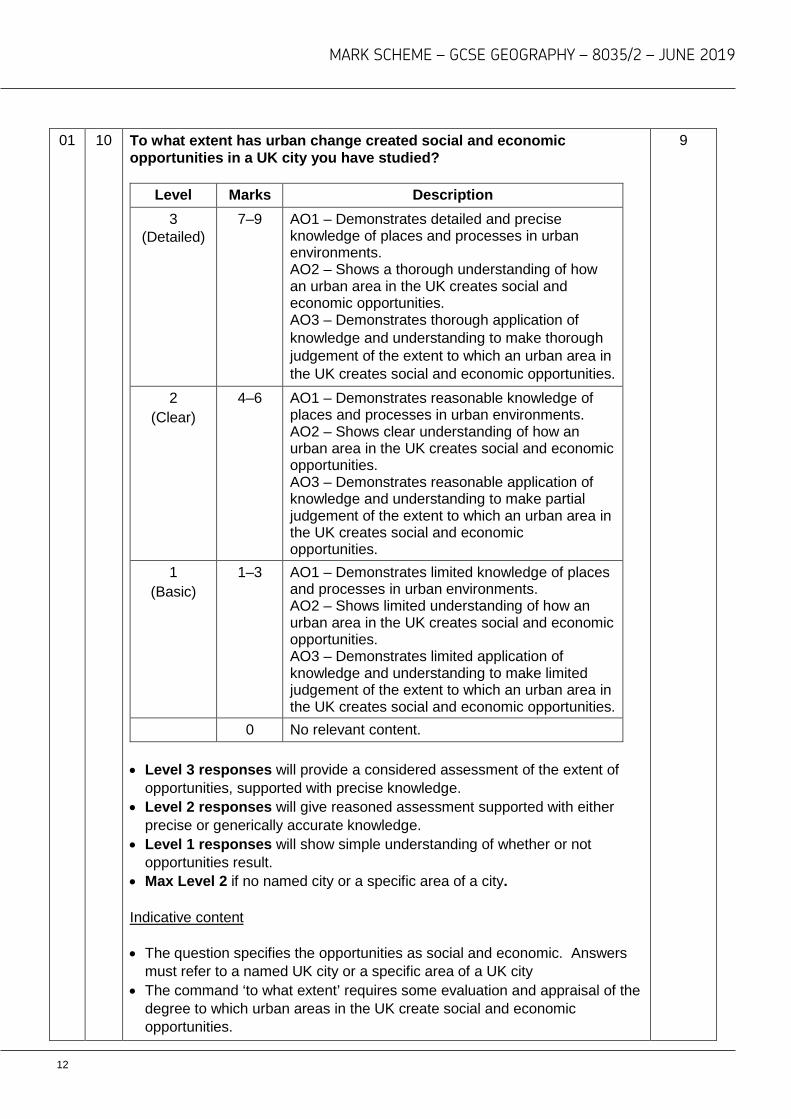
01 10 To what extent has urban change created social and economic
opportunities in a UK city you have studied?
Level Marks Description 3
(Detailed) 7–9 AO1 – Demonstrates detailed and precise
knowledge of places and processes in urban environments. AO2 – Shows a thorough understanding of how an urban area in the UK creates social and economic opportunities. AO3 – Demonstrates thorough application of knowledge and understanding to make thorough judgement of the extent to which an urban area in the UK creates social and economic opportunities.
2 (Clear)
4–6 AO1 – Demonstrates reasonable knowledge of places and processes in urban environments. AO2 – Shows clear understanding of how an urban area in the UK creates social and economic opportunities. AO3 – Demonstrates reasonable application of knowledge and understanding to make partial judgement of the extent to which an urban area in the UK creates social and economic opportunities.
1 (Basic)
1–3 AO1 – Demonstrates limited knowledge of places and processes in urban environments. AO2 – Shows limited understanding of how an urban area in the UK creates social and economic opportunities. AO3 – Demonstrates limited application of knowledge and understanding to make limited judgement of the extent to which an urban area in the UK creates social and economic opportunities.
0 No relevant content.
• Level 3 responses will provide a considered assessment of the extent of opportunities, supported with precise knowledge.
• Level 2 responses will give reasoned assessment supported with either precise or generically accurate knowledge.
• Level 1 responses will show simple understanding of whether or not opportunities result.
• Max Level 2 if no named city or a specific area of a city.
Indicative content
• The question specifies the opportunities as social and economic. Answers must refer to a named UK city or a specific area of a UK city
• The command ‘to what extent’ requires some evaluation and appraisal of the degree to which urban areas in the UK create social and economic opportunities.
9
12
MARK SCHEME – GCSE GEOGRAPHY – 8035/2 – JUNE 2019
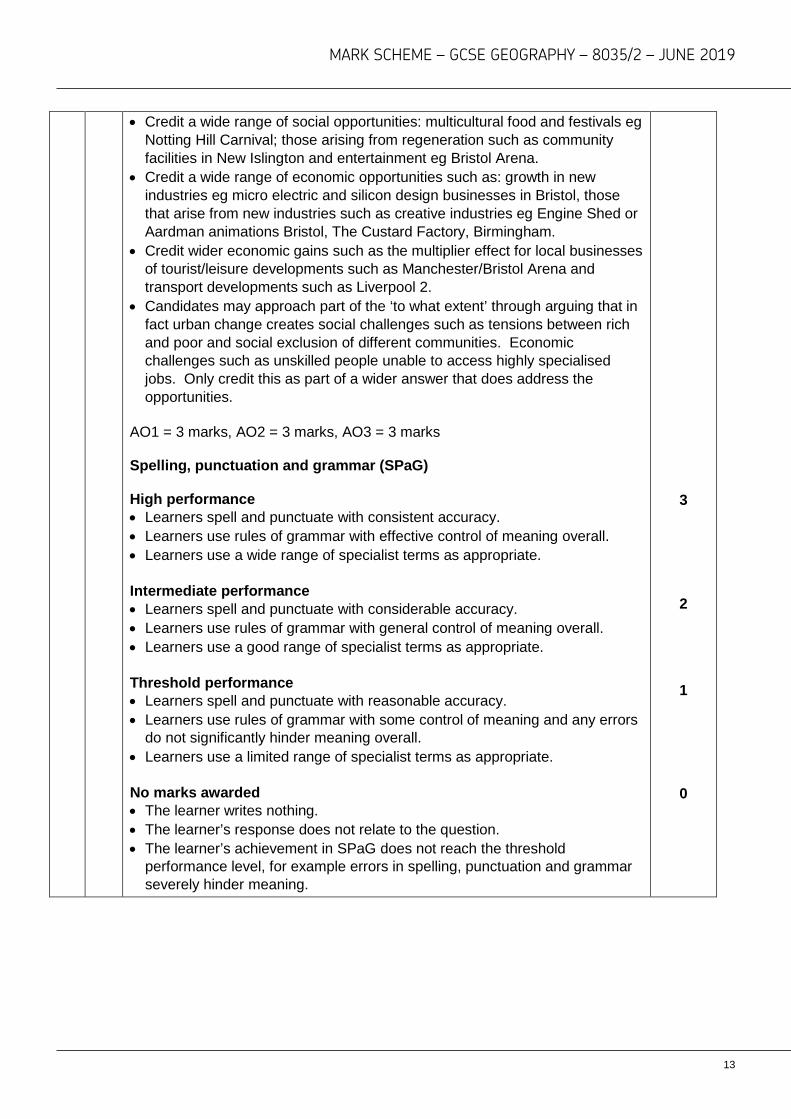
• Credit a wide range of social opportunities: multicultural food and festivals eg Notting Hill Carnival; those arising from regeneration such as community facilities in New Islington and entertainment eg Bristol Arena.
• Credit a wide range of economic opportunities such as: growth in new industries eg micro electric and silicon design businesses in Bristol, those that arise from new industries such as creative industries eg Engine Shed or Aardman animations Bristol, The Custard Factory, Birmingham.
• Credit wider economic gains such as the multiplier effect for local businesses of tourist/leisure developments such as Manchester/Bristol Arena and transport developments such as Liverpool 2.
• Candidates may approach part of the ‘to what extent’ through arguing that in fact urban change creates social challenges such as tensions between rich and poor and social exclusion of different communities. Economic challenges such as unskilled people unable to access highly specialised jobs. Only credit this as part of a wider answer that does address the opportunities.
AO1 = 3 marks, AO2 = 3 marks, AO3 = 3 marks Spelling, punctuation and grammar (SPaG) High performance • Learners spell and punctuate with consistent accuracy. • Learners use rules of grammar with effective control of meaning overall. • Learners use a wide range of specialist terms as appropriate.
Intermediate performance • Learners spell and punctuate with considerable accuracy. • Learners use rules of grammar with general control of meaning overall. • Learners use a good range of specialist terms as appropriate.
Threshold performance • Learners spell and punctuate with reasonable accuracy. • Learners use rules of grammar with some control of meaning and any errors
do not significantly hinder meaning overall. • Learners use a limited range of specialist terms as appropriate.
No marks awarded • The learner writes nothing. • The learner’s response does not relate to the question. • The learner’s achievement in SPaG does not reach the threshold
performance level, for example errors in spelling, punctuation and grammar severely hinder meaning.
3 2 1 0
13

MARK SCHEME – GCSE GEOGRAPHY – 8035/2 – JUNE 2019
Section B Qu Pt Marking Guidance Total
marks 02 1 Plot the following data on to Figure 5.
One mark for the correct alignment of each value in the plot. Germany does not have to be named AO4 = 1 mark
1
02 2 Draw a best fit line on Figure 5.
Line should be straight, approximately in the centre of the scatter and inclined top left to bottom right. AO4 = 1 mark
1
02 3 ‘Japan is in stage 5 of the Demographic Transition Model (DTM) and is a
highly developed country.’ Explain this statement. Use Figure 5 and your own understanding. Candidates should make reference to Figure 5 through using country name(s) and/or data provided. They should show that they can apply knowledge and understanding in analysing Japan’s position on the graph. Expect recognition of Japan’s place in a negative correlation showing that with a high level of wealth the birth rate has fallen very low. The connection should be made with the DTM such that it marks a general progression of population structure associated with corresponding economic changes. Figure 5 shows a negative correlation between GNI and birth rate. (1) The birth rate falls as the DTM progresses, which generally happens alongside economic growth, shown here by Japan’s high GNI/low BR. (1) As people become wealthier they realise they don’t need to have so many children (1) As countries’ GNI grows they can invest in health care which means lower infant mortality so fewer children need to be born in an effort to make sure some survive. (1) As the birth rate begins to fall more money will become available in households and more widely in the economy for investment which will increase GNI (1). At stage 5 will be Japan with very low birth rate and high wealth (1). Max 1 mark if no reference to Fig 5, at least implicitly. Reserve 3rd mark for the link between DTM and development. AO3 = 3 marks
3
02 4 Outline how one historical factor can lead to uneven development.
Candidates should clarify the factor and its resultant impact upon development. There is no requirement for an example though it may aid clarity and development.
2
14

MARK SCHEME – GCSE GEOGRAPHY – 8035/2 – JUNE 2019
Specification states this in the context of LIC/NEE but question does not, therefore allow valid positive points re HICs. One mark for a basic statement, eg: • countries used to be colonies (1) • past wars left the country worse off (1). Two marks for a developed idea, eg: • many African countries were European colonies (1) this meant their
resources were exploited for European gain and hindered their independent development (d) (1)
• past civil wars such as Mozambique 1977-1992 (1) left much of the infrastructure damaged and therefore hampered development (d) (1).
No credit for factors other than historic ones. AO1 = 2 marks
02 5 Explain how fairtrade can reduce the development gap.
Level Marks Description 2 (Clear) 3–4 AO1 – Demonstrates clear knowledge of the
principles/operation of fairtrade. AO2 – Shows clear understanding of the process of development.
1 (Basic) 1–2 AO1 – Demonstrates basic knowledge of the principles/operation of fairtrade. AO2 – Shows limited understanding of the process of development.
0 No relevant content. • Level 2 answers will provide reasoning that connects the operation of
fairtrade with a reduction in development problems. • Level 1 answers will provide basic reasons or merely assert the
connections between fairtrade and reducing development problems. • No credit for description of economic development in isolation. Indicative content
• Answers might draw straightforward connections such that the link between
the two are clear. • The specification does not require an example and nor does the question
expect one, but candidates may structure their answer around the use of an example.
• Fair prices for primary products means that farmers and therefore countries will be much less subject to changing prices on world markets and can have a more stable income.
• Fairtrade means that farmers in LICs are paid a fair price for their goods, eg: coffee and bananas so they can provide an income for their families.
• Increasing individual farmer income means they will no longer be as poor
4
15
MARK SCHEME – GCSE GEOGRAPHY – 8035/2 – JUNE 2019
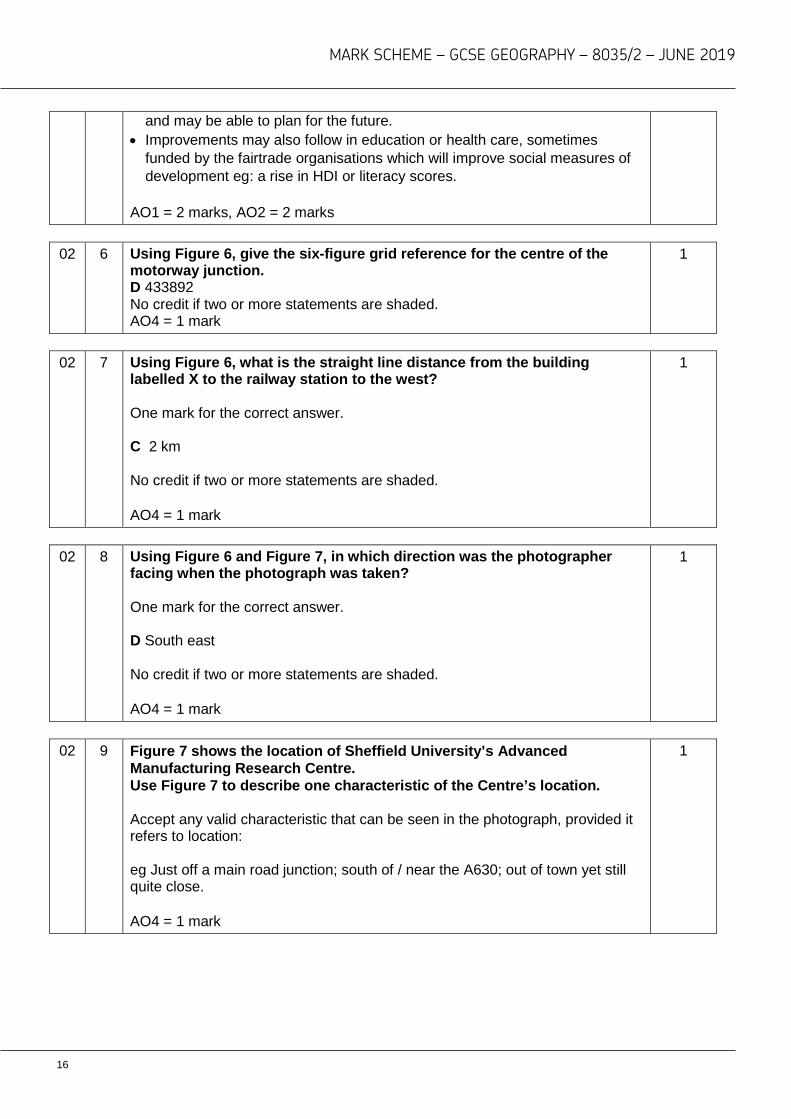
and may be able to plan for the future. • Improvements may also follow in education or health care, sometimes
funded by the fairtrade organisations which will improve social measures of development eg: a rise in HDI or literacy scores.
AO1 = 2 marks, AO2 = 2 marks
02 6 Using Figure 6, give the six-figure grid reference for the centre of the
motorway junction. D 433892 No credit if two or more statements are shaded. AO4 = 1 mark
1
02 7 Using Figure 6, what is the straight line distance from the building
labelled X to the railway station to the west? One mark for the correct answer. C 2 km No credit if two or more statements are shaded. AO4 = 1 mark
1
02 8 Using Figure 6 and Figure 7, in which direction was the photographer
facing when the photograph was taken? One mark for the correct answer. D South east No credit if two or more statements are shaded. AO4 = 1 mark
1
02 9 Figure 7 shows the location of Sheffield University’s Advanced
Manufacturing Research Centre. Use Figure 7 to describe one characteristic of the Centre’s location. Accept any valid characteristic that can be seen in the photograph, provided it refers to location: eg Just off a main road junction; south of / near the A630; out of town yet still quite close. AO4 = 1 mark
1
16

MARK SCHEME – GCSE GEOGRAPHY – 8035/2 – JUNE 2019
02 10 Suggest how the UK is moving towards a post-industrial economy.
Use Figure 8 and your own understanding.
Level Marks Description 3
(Detailed) 5–6 AO2 – Shows thorough understanding of the
concept of a post-industrial economy. AO3 – Demonstrates thorough application of knowledge and understanding to interpret the evidence for the UK as a post-industrial economy.
2 (Clear)
3–4 AO2 – Shows clear understanding of the concept of a post-industrial economy. AO3 – Demonstrates reasonable application of knowledge and understanding to interpret the evidence for the UK as a post-industrial economy.
1 (Basic)
1–2 AO2 – Shows limited understanding of the concept of a post-industrial economy. AO3 – Demonstrates limited application of knowledge and understanding to make limited interpretation of the evidence for the UK as a post-industrial economy.
0 No relevant content.
• Level 3 responses will provide specific detail of the UK’s transition to a post industrial economy supported by evidence from the figure.
• Level 2 responses will either provide specific detail of post-industrial transition in the UK with implicit use of the evidence or generic information about the UK with precise use of the evidence.
• Level 1 responses will give basic link(s) between post-industrial development in the UK and the evidence or merely assert the connection.
• Max top L2 if information does not relate to the UK. Indicative content
• Answers should be explaining how the UK is growing tertiary and quaternary
industries as raw material extraction, heavy industry and manufacturing continue to decline.
• R&D are increasing in the UK, particularly in cities which have a high number of university graduates.
• The figure illustrates this clearly as the research and innovation is clearly linked to the fact that the centre is run by Sheffield University.
• The centre is built on a brownfield site reclaimed from one of these former types of industries, showing the change perfectly.
• It shows how there is still a need for manufacture but it is more specialised and primarily in the ‘knowledge economy’ by developing research related to improvements rather than large scale manufacture.
AO2 = 3 marks, AO3 = 3 marks
6
17
MARK SCHEME – GCSE GEOGRAPHY – 8035/2 – JUNE 2019
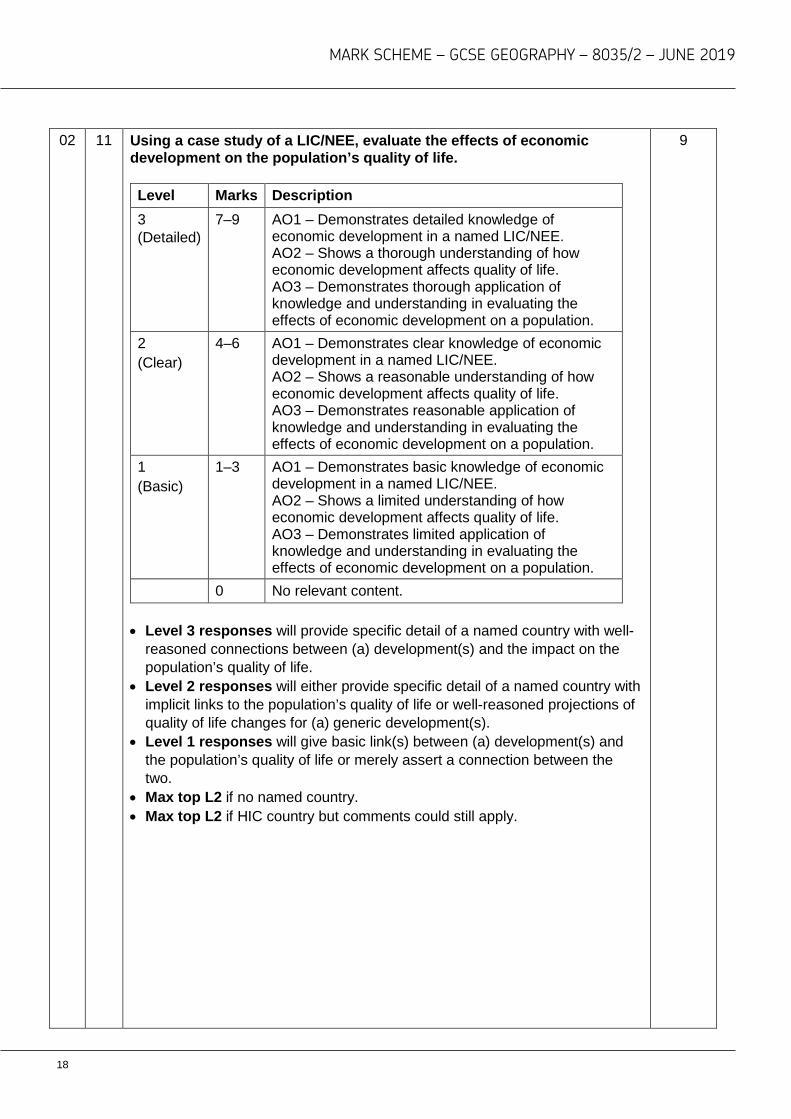
02 11 Using a case study of a LIC/NEE, evaluate the effects of economic
development on the population’s quality of life. Level Marks Description 3 (Detailed)
7–9 AO1 – Demonstrates detailed knowledge of economic development in a named LIC/NEE. AO2 – Shows a thorough understanding of how economic development affects quality of life. AO3 – Demonstrates thorough application of knowledge and understanding in evaluating the effects of economic development on a population.
2 (Clear)
4–6 AO1 – Demonstrates clear knowledge of economic development in a named LIC/NEE. AO2 – Shows a reasonable understanding of how economic development affects quality of life. AO3 – Demonstrates reasonable application of knowledge and understanding in evaluating the effects of economic development on a population.
1 (Basic)
1–3 AO1 – Demonstrates basic knowledge of economic development in a named LIC/NEE. AO2 – Shows a limited understanding of how economic development affects quality of life. AO3 – Demonstrates limited application of knowledge and understanding in evaluating the effects of economic development on a population.
0 No relevant content.
• Level 3 responses will provide specific detail of a named country with well-reasoned connections between (a) development(s) and the impact on the population’s quality of life.
• Level 2 responses will either provide specific detail of a named country with implicit links to the population’s quality of life or well-reasoned projections of quality of life changes for (a) generic development(s).
• Level 1 responses will give basic link(s) between (a) development(s) and the population’s quality of life or merely assert a connection between the two.
• Max top L2 if no named country. • Max top L2 if HIC country but comments could still apply.
9
18

MARK SCHEME – GCSE GEOGRAPHY – 8035/2 – JUNE 2019
Indicative content
• Candidates are likely to have studied a range of countries, with likely
textbook examples being Brazil, Nigeria and India. • Answers should suggest possible positive impacts such as: More reliable, better paid jobs which lead to a higher disposable income
which can then be used for better clothing, food and recreation, all of which improve quality of life.
Increased national/regional wealth can be used to improve health care, water and sanitation which will all reduce incidence of disease and directly impact QoL through better health.
Disposable incomes and government tax revenue will allow better access to schooling which leads to a multiplier effect and the benefit of higher paid jobs and the benefits listed above.
• However answers should also evaluate and will need to show alternative,
less positive viewpoints such as: × Much industrial development is unregulated and therefore health and safety
are neglected so that rates of work-related illness and injury are high. × Corruption means that the taxes do not reach the government for the benefit
of the population and that the gap between rich and poor continues to grow. × The fact that much industrial development is controlled by TNCs means the
profits and therefore any benefits are ‘leaked’. Credit an answer which is only positive or negative, potentially to full marks provided AO3 evaluation is addressed with judgement of relative significance / scale of effect. AO1 = 3 marks, AO2 = 3 marks, AO3 = 3 marks
19

MARK SCHEME – GCSE GEOGRAPHY – 8035/2 – JUNE 2019
Section C Qu Pt Marking Guidance Total
marks 03 1 Calculate the percentage increase in mango imports into the UK between
2012 and 2016. Answer to the nearest whole percentage. One mark for correct working if final answer incorrect. Allow one mark for mathematically correct answer (73.68/73.7%) without rounding correctly to a whole number. Allow 2 marks for correct answer and no working. 74% Percentage not required AO4 = 2 marks
2
03 2 State one environmental effect of the increase shown in Figure 9.
Credit any reasonable answer eg: Increased carbon emissions; increased carbon footprint for the UK; increase in food miles. No credit for any consequence other than environmental AO3 = 1 mark
1
03 3 Outline one advantage of sourcing food locally in the UK.
Credit one advantage only. Candidates should clarify how the advantage arises, which may be at any scale. One mark for a basic statement, eg: • money goes straight to the farmer (1) • lower food miles (1) • people know where their food comes from (1). Two marks for a developed idea, eg: • money goes straight to the farmer (1) which means they have an increased
share/are more profitable (d)(1) • lower food miles (1) which means the carbon emissions associated with food
will decrease (d) (1) • people know where their food comes from (1) which helps connect
producers and consumers for community benefits (d)(1). No credit for disadvantages of imported food. AO2 = 2 marks
2
20
MARK SCHEME – GCSE GEOGRAPHY – 8035/2 – JUNE 2019
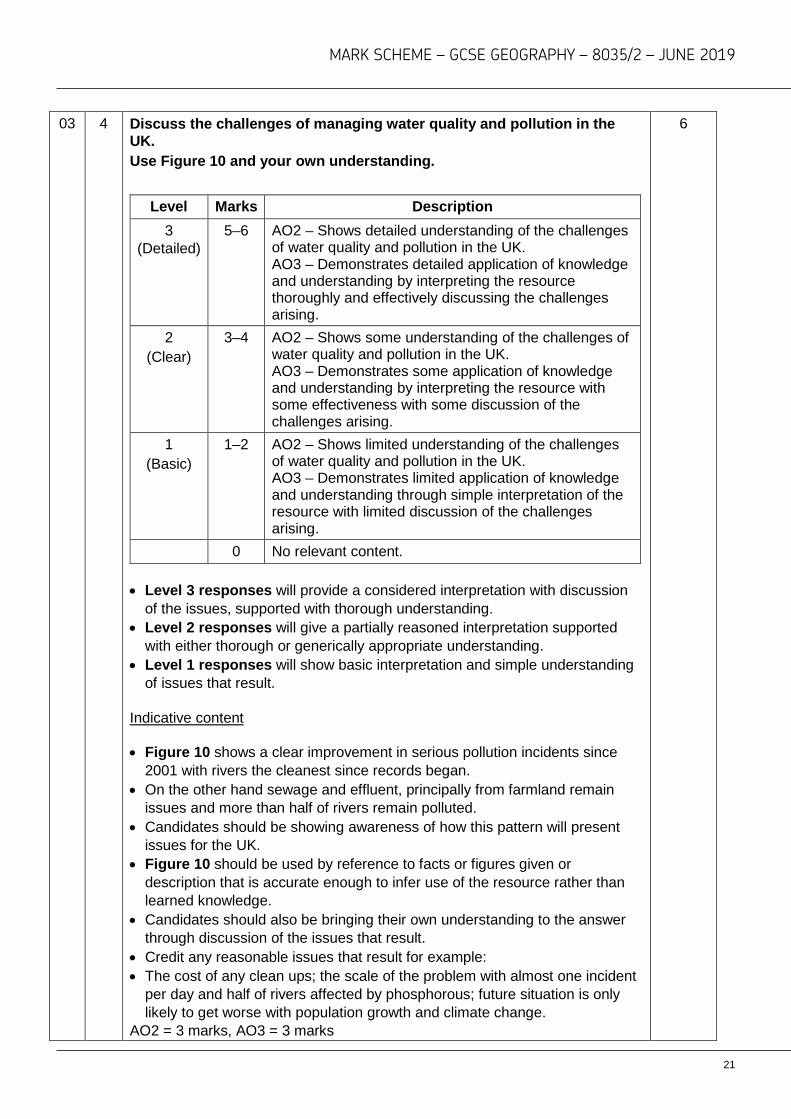
03 4 Discuss the challenges of managing water quality and pollution in the UK. Use Figure 10 and your own understanding.
Level Marks Description 3
(Detailed) 5–6 AO2 – Shows detailed understanding of the challenges
of water quality and pollution in the UK. AO3 – Demonstrates detailed application of knowledge and understanding by interpreting the resource thoroughly and effectively discussing the challenges arising.
2 (Clear)
3–4 AO2 – Shows some understanding of the challenges of water quality and pollution in the UK. AO3 – Demonstrates some application of knowledge and understanding by interpreting the resource with some effectiveness with some discussion of the challenges arising.
1 (Basic)
1–2 AO2 – Shows limited understanding of the challenges of water quality and pollution in the UK. AO3 – Demonstrates limited application of knowledge and understanding through simple interpretation of the resource with limited discussion of the challenges arising.
0 No relevant content. • Level 3 responses will provide a considered interpretation with discussion
of the issues, supported with thorough understanding. • Level 2 responses will give a partially reasoned interpretation supported
with either thorough or generically appropriate understanding. • Level 1 responses will show basic interpretation and simple understanding
of issues that result. Indicative content • Figure 10 shows a clear improvement in serious pollution incidents since
2001 with rivers the cleanest since records began. • On the other hand sewage and effluent, principally from farmland remain
issues and more than half of rivers remain polluted. • Candidates should be showing awareness of how this pattern will present
issues for the UK. • Figure 10 should be used by reference to facts or figures given or
description that is accurate enough to infer use of the resource rather than learned knowledge.
• Candidates should also be bringing their own understanding to the answer through discussion of the issues that result.
• Credit any reasonable issues that result for example: • The cost of any clean ups; the scale of the problem with almost one incident
per day and half of rivers affected by phosphorous; future situation is only likely to get worse with population growth and climate change.
AO2 = 3 marks, AO3 = 3 marks
6
21
MARK SCHEME – GCSE GEOGRAPHY – 8035/2 – JUNE 2019
Qu Pt Marking Guidance Total
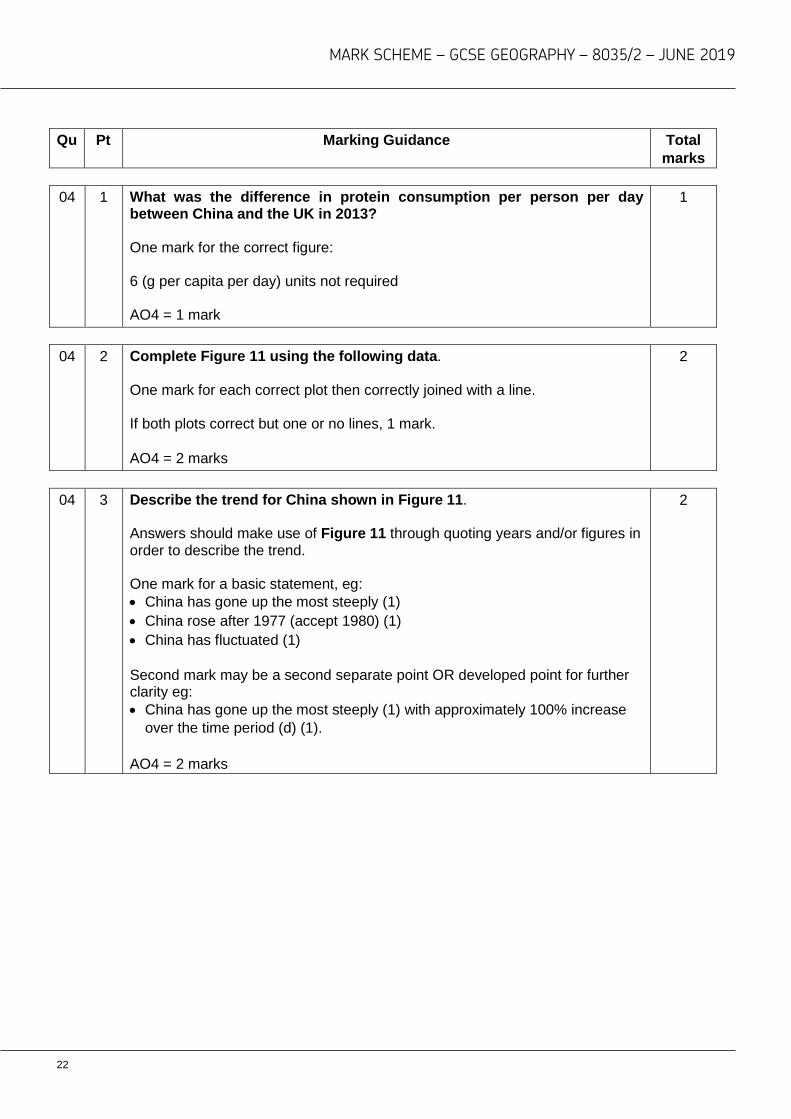
marks 04 1 What was the difference in protein consumption per person per day
between China and the UK in 2013? One mark for the correct figure: 6 (g per capita per day) units not required AO4 = 1 mark
1
04 2 Complete Figure 11 using the following data.
One mark for each correct plot then correctly joined with a line. If both plots correct but one or no lines, 1 mark. AO4 = 2 marks
2
04 3 Describe the trend for China shown in Figure 11.
Answers should make use of Figure 11 through quoting years and/or figures in order to describe the trend. One mark for a basic statement, eg: • China has gone up the most steeply (1) • China rose after 1977 (accept 1980) (1) • China has fluctuated (1) Second mark may be a second separate point OR developed point for further clarity eg: • China has gone up the most steeply (1) with approximately 100% increase
over the time period (d) (1). AO4 = 2 marks
2
22
MARK SCHEME – GCSE GEOGRAPHY – 8035/2 – JUNE 2019
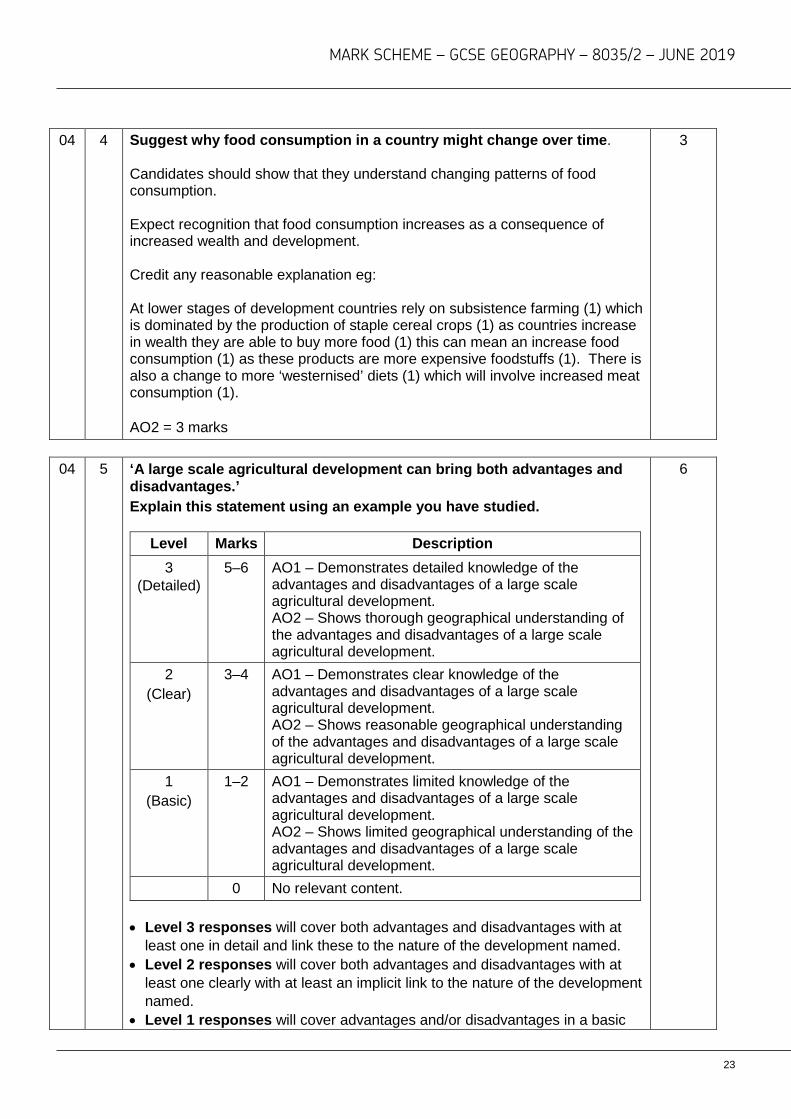
04 4 Suggest why food consumption in a country might change over time.
Candidates should show that they understand changing patterns of food consumption. Expect recognition that food consumption increases as a consequence of increased wealth and development. Credit any reasonable explanation eg: At lower stages of development countries rely on subsistence farming (1) which is dominated by the production of staple cereal crops (1) as countries increase in wealth they are able to buy more food (1) this can mean an increase food consumption (1) as these products are more expensive foodstuffs (1). There is also a change to more ‘westernised’ diets (1) which will involve increased meat consumption (1). AO2 = 3 marks
3
04 5 ‘A large scale agricultural development can bring both advantages and
disadvantages.’ Explain this statement using an example you have studied.
Level Marks Description 3
(Detailed) 5–6 AO1 – Demonstrates detailed knowledge of the
advantages and disadvantages of a large scale agricultural development. AO2 – Shows thorough geographical understanding of the advantages and disadvantages of a large scale agricultural development.
2 (Clear)
3–4 AO1 – Demonstrates clear knowledge of the advantages and disadvantages of a large scale agricultural development. AO2 – Shows reasonable geographical understanding of the advantages and disadvantages of a large scale agricultural development.
1 (Basic)
1–2 AO1 – Demonstrates limited knowledge of the advantages and disadvantages of a large scale agricultural development. AO2 – Shows limited geographical understanding of the advantages and disadvantages of a large scale agricultural development.
0 No relevant content. • Level 3 responses will cover both advantages and disadvantages with at
least one in detail and link these to the nature of the development named. • Level 2 responses will cover both advantages and disadvantages with at
least one clearly with at least an implicit link to the nature of the development named.
• Level 1 responses will cover advantages and/or disadvantages in a basic
6
23

MARK SCHEME – GCSE GEOGRAPHY – 8035/2 – JUNE 2019
manner and merely assert the connection to the large-scale nature of the development.
• Max top L2 if development not named or cannot be inferred and if comments applicable
• Max top L1 for small scale or local development Indicative content • Clearly the exact content will vary according to the development chosen, but
is likely to include: Advantages Increased food production Increase in cash crops/export earnings Cheaper food Improved food security Job creation Disadvantages × Fewer rural jobs × Profits made by large companies × Small scale farmers lose land/priced out × Increased water/pesticide/energy use × Plastic pollution × Visual pollution AO1 = 3 marks, AO2 = 3 marks
24

MARK SCHEME – GCSE GEOGRAPHY – 8035/2 – JUNE 2019
Qu Pt Marking Guidance Total marks
05 1 Calculate the difference between the average Californian usage and
restrictions in Cape Town on 1 February 2018. One mark for the correct figure: 271 litres units not required AO4 = 1 mark
1
05 2 Use the data in Figure 12 to complete the graph in Figure 13.
One mark for each correctly drawn bar (width can be ignored). Bar need not be shaded AO4 = 2 marks
2
05 3 Describe the trend shown in Figure 13.
Answers should make use of Figure 13 through quoting figures and dates in order to describe the trend. One mark for a basic statement, eg: • the amount of water people can use has gone down (1) • people are now allowed only half what they were in Feb 2017 (1). Second mark may be a second separate point or developed point for further clarity eg: • the amount of water people can use has gone down (1) though it has not
been a steady decline (1) • people are now allowed only half what they were in Feb 2017 (1) so that now
they can only use 1/6 of what a Californian uses (d) (1). No credit for explanation. AO4 = 2 marks
2
25
MARK SCHEME – GCSE GEOGRAPHY – 8035/2 – JUNE 2019
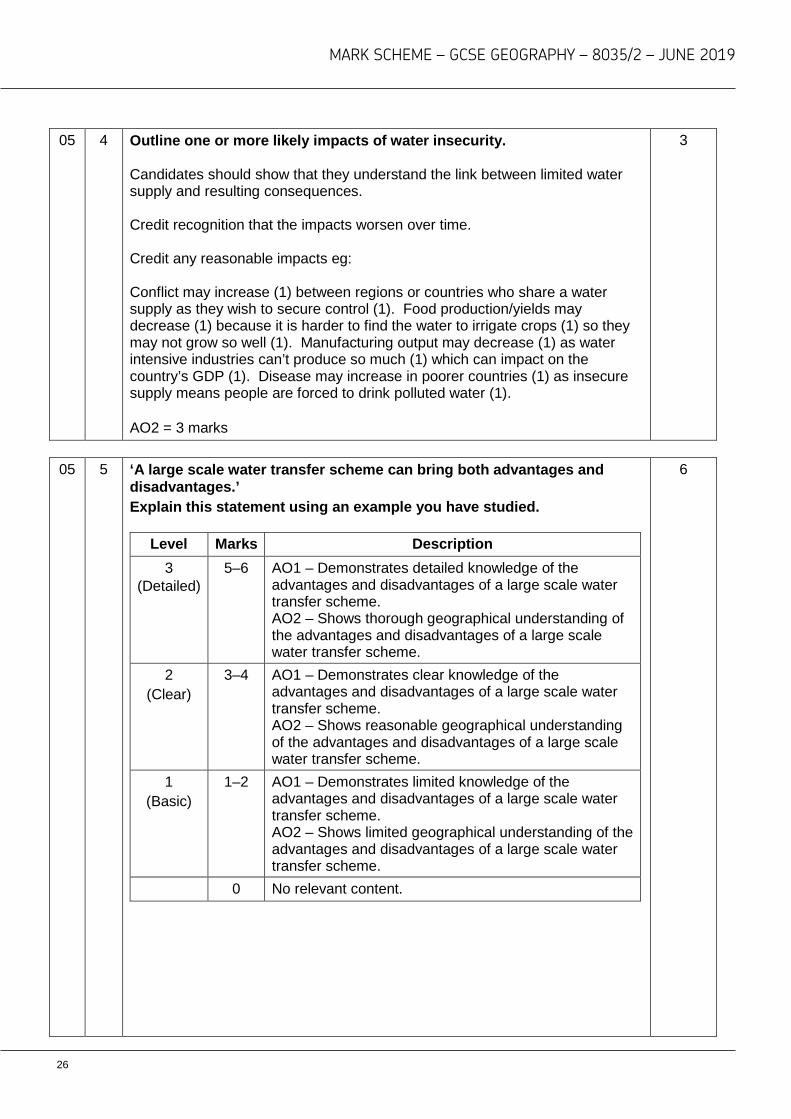
05 4 Outline one or more likely impacts of water insecurity.
Candidates should show that they understand the link between limited water supply and resulting consequences. Credit recognition that the impacts worsen over time. Credit any reasonable impacts eg: Conflict may increase (1) between regions or countries who share a water supply as they wish to secure control (1). Food production/yields may decrease (1) because it is harder to find the water to irrigate crops (1) so they may not grow so well (1). Manufacturing output may decrease (1) as water intensive industries can’t produce so much (1) which can impact on the country’s GDP (1). Disease may increase in poorer countries (1) as insecure supply means people are forced to drink polluted water (1). AO2 = 3 marks
3
05 5 ‘A large scale water transfer scheme can bring both advantages and
disadvantages.’ Explain this statement using an example you have studied.
Level Marks Description 3
(Detailed) 5–6 AO1 – Demonstrates detailed knowledge of the
advantages and disadvantages of a large scale water transfer scheme. AO2 – Shows thorough geographical understanding of the advantages and disadvantages of a large scale water transfer scheme.
2 (Clear)
3–4 AO1 – Demonstrates clear knowledge of the advantages and disadvantages of a large scale water transfer scheme. AO2 – Shows reasonable geographical understanding of the advantages and disadvantages of a large scale water transfer scheme.
1 (Basic)
1–2 AO1 – Demonstrates limited knowledge of the advantages and disadvantages of a large scale water transfer scheme. AO2 – Shows limited geographical understanding of the advantages and disadvantages of a large scale water transfer scheme.
0 No relevant content.
6
26
MARK SCHEME – GCSE GEOGRAPHY – 8035/2 – JUNE 2019
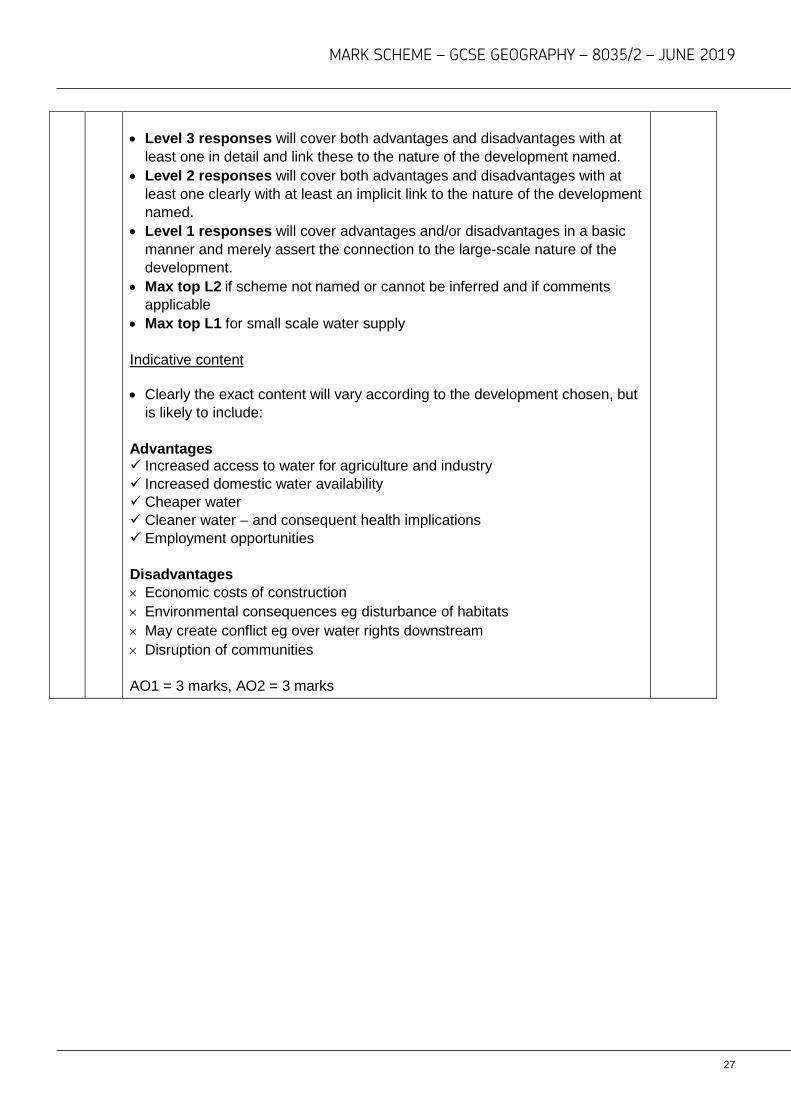
• Level 3 responses will cover both advantages and disadvantages with at
least one in detail and link these to the nature of the development named. • Level 2 responses will cover both advantages and disadvantages with at
least one clearly with at least an implicit link to the nature of the development named.
• Level 1 responses will cover advantages and/or disadvantages in a basic manner and merely assert the connection to the large-scale nature of the development.
• Max top L2 if scheme not named or cannot be inferred and if comments applicable
• Max top L1 for small scale water supply
Indicative content • Clearly the exact content will vary according to the development chosen, but
is likely to include:
Advantages Increased access to water for agriculture and industry Increased domestic water availability Cheaper water Cleaner water – and consequent health implications Employment opportunities
Disadvantages × Economic costs of construction × Environmental consequences eg disturbance of habitats × May create conflict eg over water rights downstream × Disruption of communities AO1 = 3 marks, AO2 = 3 marks
27
MARK SCHEME – GCSE GEOGRAPHY – 8035/2 – JUNE 2019
Qu Pt Marking Guidance Total
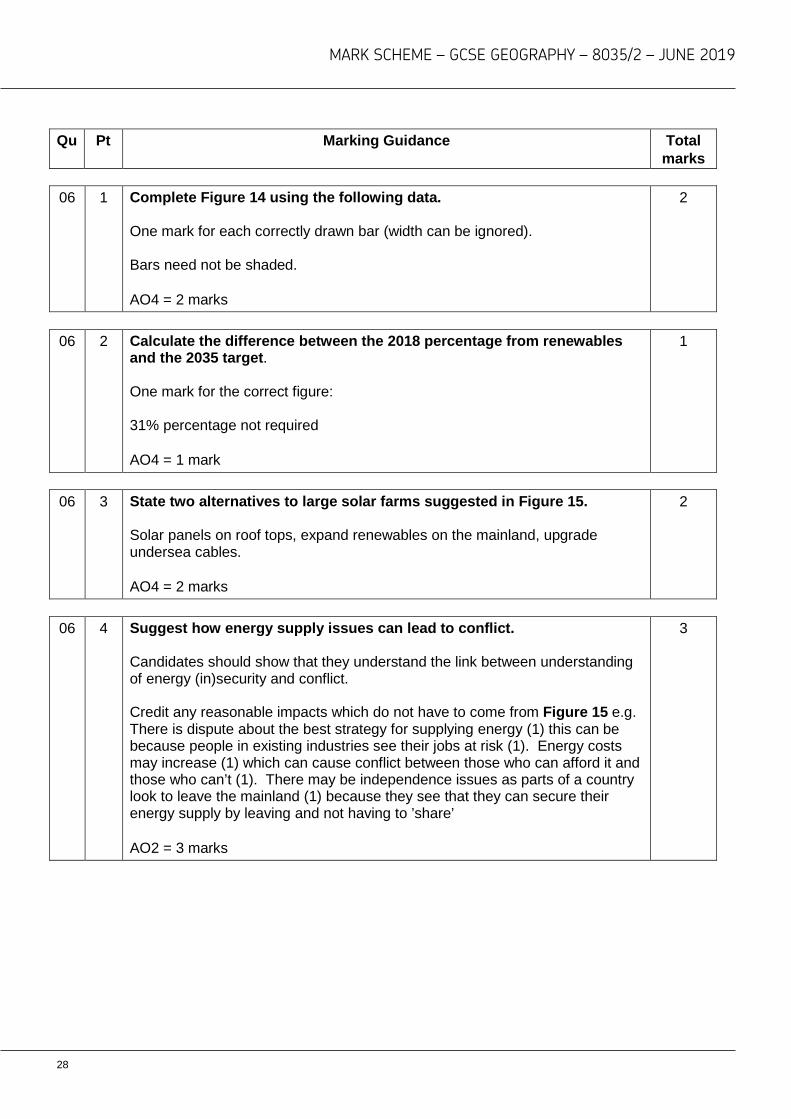
marks 06 1 Complete Figure 14 using the following data.
One mark for each correctly drawn bar (width can be ignored). Bars need not be shaded. AO4 = 2 marks
2
06 2 Calculate the difference between the 2018 percentage from renewables
and the 2035 target. One mark for the correct figure: 31% percentage not required AO4 = 1 mark
1
06 3 State two alternatives to large solar farms suggested in Figure 15.
Solar panels on roof tops, expand renewables on the mainland, upgrade undersea cables. AO4 = 2 marks
2
06 4 Suggest how energy supply issues can lead to conflict.
Candidates should show that they understand the link between understanding of energy (in)security and conflict. Credit any reasonable impacts which do not have to come from Figure 15 e.g. There is dispute about the best strategy for supplying energy (1) this can be because people in existing industries see their jobs at risk (1). Energy costs may increase (1) which can cause conflict between those who can afford it and those who can’t (1). There may be independence issues as parts of a country look to leave the mainland (1) because they see that they can secure their energy supply by leaving and not having to ’share’ AO2 = 3 marks
3
28

MARK SCHEME – GCSE GEOGRAPHY – 8035/2 – JUNE 2019
06 5 ‘Extraction of fossil fuels can bring both advantages and disadvantages.’ Explain this statement using an example you have studied.
Level Marks Description 3
(Detailed) 5–6 AO1 – Demonstrates detailed knowledge of the
advantages and disadvantages of fossil fuel extraction. AO2 – Shows thorough geographical understanding of the advantages and disadvantages of fossil fuel extraction.
2 (Clear)
3–4 AO1 – Demonstrates clear knowledge of the advantages and disadvantages of fossil fuel extraction. AO2 – Shows reasonable geographical understanding of the advantages and disadvantages of fossil fuel extraction.
1 (Basic)
1–2 AO1 – Demonstrates limited knowledge of the advantages and disadvantages of fossil fuel extraction. AO2 – Shows limited geographical understanding of the advantages and disadvantages of fossil fuel extraction.
0 No relevant content.
• Level 3 responses will cover both advantages and disadvantages of a named fossil fuel with at least one in detail.
• Level 2 responses will cover both advantages and disadvantages with at least one clear, this may be for generic fossil fuels.
• Level 1 responses will cover advantages and/or disadvantages in a basic manner without stating the fossil fuel concerned.
• Max top L2 if fossil fuel not named or cannot be inferred and comments are applicable
• Max top L1 if not fossil fuel Indicative content
• Extraction includes the use of the fossil fuel • Clearly the exact content will vary according to the fossil fuel chosen,
but is likely to include:
Advantages Employment opportunities Increased energy security (at least in the short term) Development of local infrastructure Provide energy for new industries Export opportunities Reliable source of energy
Disadvantages × Disruption of local communities × May affect other industries eg tourism, agriculture × Water contamination × Habitat destruction × Land contamination × Increased traffic × CO2 emissions
AO1 = 3 marks, AO2 = 3 marks
6
29