mark scheme h081/02 geographical debates june 2018
TRANSCRIPT

GCE
Geography
Unit H081/02: Geographical debates
Advanced Subsidiary GCE
Mark Scheme for June 2018
Oxford Cambridge and RSA Examinations

OCR (Oxford Cambridge and RSA) is a leading UK awarding body, providing a wide range of qualifications to meet the needs of candidates of all ages and abilities. OCR qualifications include AS/A Levels, Diplomas, GCSEs, Cambridge Nationals, Cambridge Technicals, Functional Skills, Key Skills, Entry Level qualifications, NVQs and vocational qualifications in areas such as IT, business, languages, teaching/training, administration and secretarial skills. It is also responsible for developing new specifications to meet national requirements and the needs of students and teachers. OCR is a not-for-profit organisation; any surplus made is invested back into the establishment to help towards the development of qualifications and support, which keep pace with the changing needs of today’s society. This mark scheme is published as an aid to teachers and students, to indicate the requirements of the examination. It shows the basis on which marks were awarded by examiners. It does not indicate the details of the discussions which took place at an examiners’ meeting before marking commenced. All examiners are instructed that alternative correct answers and unexpected approaches in candidates’ scripts must be given marks that fairly reflect the relevant knowledge and skills demonstrated. Mark schemes should be read in conjunction with the published question papers and the report on the examination. © OCR 2018

H081/02 Mark Scheme June 2018
Annotations
Annotation Meaning
Point has been seen and noted
Indicates questionable points / comments
Must be used on all blank pages where there is no candidate response
Irrelevant; a significant amount of material that does not answer the question
Level 1
Level 2
Level 3
Level 4
Rubric error (place at start of Question not being counted)
Highlighting an issue e.g. irrelevant paragraph. Use in conjunction with another stamp e.g IRRL
3

H081/02 Mark Scheme June 2018
Subject-specific Marking Instructions
INTRODUCTION Your first task as an Examiner is to become thoroughly familiar with the material on which the examination depends. This material includes: • the specification, especially the assessment objectives • the question paper and its rubrics • the mark scheme.
You should ensure that you have copies of these materials. You should ensure also that you are familiar with the administrative procedures related to the marking process. These are set out in the OCR booklet Instructions for Examiners. If you are examining for the first time, please read carefully Appendix 5 Introduction to Script Marking: Notes for New Examiners.
4

H081/02 Mark Scheme June 2018
USING THE MARK SCHEME
Please study this Mark Scheme carefully. The Mark Scheme is an integral part of the process that begins with the setting of the question paper and ends with the awarding of grades. Question papers and Mark Schemes are developed in association with each other so that issues of differentiation and positive achievement can be addressed from the very start.
This Mark Scheme is a working document; it is not exhaustive; it does not provide ‘correct’ answers. The Mark Scheme can only provide ‘best guesses’ about how the question will work out, and it is subject to revision after we have looked at a wide range of scripts.
The Examiners’ Standardisation Meeting will ensure that the Mark Scheme covers the range of candidates’ responses to the questions, and that all Examiners understand and apply the Mark Scheme in the same way. The Mark Scheme will be discussed and amended at the meeting, and administrative procedures will be confirmed. Co-ordination scripts will be issued at the meeting to exemplify aspects of candidates’ responses and achievements; the co-ordination scripts then become part of this Mark Scheme.
Before the Standardisation Meeting, you should read and mark in pencil a number of scripts, in order to gain an impression of the range of responses and achievement that may be expected.
In your marking, you will encounter valid responses which are not covered by the Mark Scheme: these responses must be credited. You will encounter answers which fall outside the ‘target range’ of Bands for the paper which you are marking. Please mark these answers according to the marking criteria.
Please read carefully all the scripts in your allocation and make every effort to look positively for achievement throughout the ability range. Always be prepared to use the full range of marks.
5

H081/02 Mark Scheme June 2018
LEVELS OF RESPONSE QUESTIONS: The indicative content indicates the expected parameters for candidates’ answers, but be prepared to recognise and credit unexpected approaches where they show relevance. Using ‘best-fit’, decide first which set of level descriptors best describes the overall quality of the answer. Once the level is located, adjust the mark concentrating on features of the answer which make it stronger or weaker following the guidelines for refinement. Highest mark: If clear evidence of all the qualities in the level descriptors is shown, the HIGHEST Mark should be awarded. Lowest mark: If the answer shows the candidate to be borderline (i.e. they have achieved all the qualities of the levels below and show limited evidence of meeting the criteria of the level in question) the LOWEST mark should be awarded. Middle mark: This mark should be used for candidates who are secure in the level. They are not ‘borderline’ but they have only achieved some of the qualities in the level descriptors. Be prepared to use the full range of marks. Do not reserve (e.g.) highest level marks ‘in case’ something turns up of a quality you have not yet seen. If an answer gives clear evidence of the qualities described in the level descriptors, reward appropriately.
Quality of extended response will be assessed in questions marked with an (*). Quality of extended response is not attributed to any single assessment objective but instead is assessed against the entire response for the question.
6

H081/02 Mark Scheme June 2018
AO1 AO2 AO3 Quality of extended response
Comprehensive A wide range of detailed and accurate knowledge that demonstrates fully developed understanding that shows full relevance to the demands of the question. Precision in the use of question terminology.
Knowledge and understanding shown is consistently applied to the context of the question, in order to form a: clear, developed and convincing analysis that is fully accurate. clear, developed and convincing interpretation that is fully accurate. detailed and substantiated evaluation that offers secure judgements leading to rational conclusions that are evidence based.
Quantitative, qualitative and/or fieldwork skills are used in a consistently appropriate and effective way and with a high degree of competence and precision.
There is a well-developed line of reasoning which is clear and logically structured. The information presented is relevant and substantiated.
Thorough A range of detailed and accurate knowledge that demonstrates well developed understanding that is relevant to the demands of the question. Generally precise in the use of question terminology.
Knowledge and understanding shown is mainly applied to the context of the question, in order to form a : clear and developed analysis that shows accuracy. clear and developed interpretation that shows accuracy. detailed evaluation that offers generally secure judgements, with some link between rational conclusions and evidence.
Quantitative, qualitative and/or fieldwork skills are used in a suitable way and with a good level of competence and precision.
There is a line of reasoning presented with some structure. The information presented is in the most-part relevant and supported by some evidence.
7

H081/02 Mark Scheme June 2018
AO1 AO2 AO3 Quality of extended response
Reasonable Some sound knowledge that demonstrates partially developed understanding that is relevant to the demands of the question. Awareness of the meaning of the terms in the question.
Knowledge and understanding shown is partially applied to the context of the question, in order to form a: sound analysis that shows some accuracy. sound interpretation that shows some accuracy. sound evaluation that offers generalised judgements and conclusions, with limited use of evidence.
Quantitative, qualitative and/or fieldwork skills are used in a mostly suitable way with a sound level of competence but may lack precision.
The information has some relevance and is presented with limited structure. The information is supported by limited evidence.
Basic Limited knowledge that is relevant to the topic or question with little or no development. Confusion and inability to deconstruct terminology as used in the question.
Knowledge and understanding shows limited application to the context of the question in order to form a: simple analysis that shows limited accuracy. simple interpretation that shows limited accuracy. Un-supported evaluation that offers simple conclusions.
Quantitative, qualitative and/or fieldwork skills are used inappropriately with limited competence and precision.
The information is basic and communicated in an unstructured way. The information is supported by limited evidence and the relationship to the evidence may not be clear.
8

H081/02 Mark Scheme June 2018
Question Answer Marks Guidance 1 (a) Explain two methods used to reconstruct past
climates.
• Ice cores (✓) contain air which records the gaseous composition at the time of freezing (✓) Lower frequency of hydrogen and oxygen atoms suggest colder climate. (✓)
• Tree rings (✓) show the age of trees as well as the climatic conditions (✓) – the wider the ring the more growth due to warmer climate and more moisture availability. (✓)
• Fossils of plants and animals (✓) can be used to suggest what the climate was like (✓) as plants and animals require specific conditions to survive. (✓)
• Sea-floor sediments (✓) are made up of shells of foraminifera (✓), the chemical composition of which can be used to indicate ocean temperature (✓).
• Lake sediments (✓) contain pollen, spores and diatoms which can be used to infer climatic conditions (✓) based on vegetation types. (✓) Varves can be used to identify seasonal variations. (✓)
4 AO1 – 4 marks 2 x 2 mark (✓) for each correct method and explanation. Only two methods can be credited.
(b) Suggest how changes in atmospheric factors influence the global mean energy balance.
Level 3 (5-6 marks) Demonstrates thorough knowledge and understanding of the global mean energy balance (AO1).
Place specific details should be accurate with the amount helping determine where within the level the response lies.
Demonstrates thorough application of knowledge and understanding to provide an accurate, clear and developed analysis as to how changes in atmospheric factors influence the global mean energy balance (AO2).
6 AO1 – 3 marks Knowledge and understanding of the global mean energy balance could potentially include:
• It is a closed system • Input is solar radiation and output is terrestrial
radiation. • Balanced inputs and outputs (i.e. Global Mean
Energy Balance) result in stable temperatures • Atmospheric factors include the make-up of the
atmosphere / gaseous composition / cloud cover • 1/3 incoming solar radiation is reflected by clouds
9

H081/02 Mark Scheme June 2018
Question Answer Marks Guidance Level 2 (3-4 marks) Demonstrates reasonable knowledge and understanding of the global mean energy balance (AO1). Place specific material is present which is partially accurate with the amount helping determine where within the level the response lies. Demonstrates reasonable application of knowledge and understanding to provide a sound analysis showing some accuracy and development as to how changes in atmospheric factors influence the global mean energy balance (AO2). Level 1 (1-2 marks) Demonstrates basic knowledge and understanding of the global mean energy balance (AO1). Little or no place specific material is present and or is inaccurate. Demonstrates basic application of knowledge and understanding to provide a simple analysis showing limited accuracy and little development as to how changes in atmospheric factors influence the global mean energy balance (AO2). 0 marks No response worthy of credit.
• 1/3 outgoing radiation is absorbed by greenhouse gases including CO2, CH4 and water vapour.
AO2 – 3 marks Application of knowledge and understanding to analyse how atmospheric factors influence the global mean energy balance could potentially include:
• An increase in greenhouse gases means more terrestrial radiation is absorbed and reflected back to earth increasing the temperature.
• Higher temperatures increase evaporation which increases cloud coverage and amount of water vapour in the atmosphere.
• Volcanic eruptions emitting ash into the atmosphere will decrease the amount of incoming solar radiation.
10

H081/02 Mark Scheme June 2018
Question Answer Marks Guidance (c) (i) Study Fig. 1, which shows carbon dioxide emissions in
2013 (metric tons per capita) for a number of countries, and one stage of the standard deviation calculation. Using the data from Fig 1 and the formula provided, calculate the standard deviation value. You must show your working. Give your answer correct to 1 decimal place. Standard Deviation Formula
𝜎𝜎 = �∑(x − 𝐱𝐱𝐱)2
𝑛𝑛
• ∑(x- x̄)2 =375.785 • ∑(x- x̄)2/n = 37.5785 • Standard deviation to 1 d.p. = 6.1
4
AO3 – 4 marks
• ∑(x- x̄)2 - 1 mark (✓) • ∑(x- x̄)2/n - 1 mark (✓) • Standard deviation to 1 d.p. - 1 mark (✓) • Showing working - 1 mark (✓) • Allow max 2 marks for error carried forward if
subsequent calculations are formulaically correct.
(ii) Using evidence from Fig 1, analyse reasons for differences in carbon dioxide emissions between countries. Level 3 (5-6 marks) Demonstrates thorough application of knowledge and understanding to provide clear and developed analysis that shows accuracy as to reasons for differences in carbon dioxide emissions between countries (AO2). Demonstrates thorough investigation and interpretation of the quantitative data resource to fully evidence differences in carbon dioxide emissions. There must be strong ideas linking resource evidence to the possible reasons for differences in carbon dioxide emissions (AO3).
6
AO2 – 3 marks Application of knowledge and understanding to analyse reasons for differences in carbon dioxide emissions between countries could potentially include:
• ACs tend to use more fossil fuels therefore produce more CO2.
• Demand for energy is greater in ACs /EDCs. • Some countries have greater fossil fuel deposits so
are able to use more fossil fuels • Some countries are applying strong regulations and
have started to move to renewables • Some countries have a greater energy demand due
to their climate eg for heating or air conditioning • Countries with large geographical areas will require
longer journeys using more fossil fuels and therefore create more CO2 emissions from travelling vast distances.
11

H081/02 Mark Scheme June 2018
Question Answer Marks Guidance Level 2 (3-4 marks) Demonstrates reasonable application of knowledge and understanding to provide clear and developed analysis that shows accuracy as to reasons for differences in carbon dioxide emissions between countries (AO2). Demonstrates reasonable investigation and interpretation of the quantitative data resource to fully evidence differences in carbon dioxide emissions. There must be good ideas linking resource evidence to the possible reasons for differences in carbon dioxide emissions (AO3). Level 1 (1-2 marks) Demonstrates basic application of knowledge and understanding to provide clear and developed analysis that shows accuracy as to reasons for differences in carbon dioxide emissions between countries (AO2). Demonstrates basic investigation and interpretation of the quantitative data resource to fully evidence differences in carbon dioxide emissions. There must be some ideas linking resource evidence to resource evidence to the possible reasons for differences in carbon dioxide emissions (AO3). 0 marks No response worthy of credit.
• Countries not signing up to international agreements.
AO3 – 3 marks Evidence from investigation and interpretation of the data could potentially include:
• 3 countries (Russia, USA and Saudi Arabia) stand out with high or fairly high CO2 emissions i.e. over 12 metric tons per capita - there may be different reasons including being ACs rather than EDCs/LIDCs)
• 3 countries (Sudan, Zimbabwe and Vietnam) have emissions of less than 2 metric tons per capita of CO2 and in this case they are all EDCs
• 4 countries have emissions between 2.5 and 7.1 (Brazil, Argentina, Italy and UK). This group includes EDCs and ACs, so the reasons may range from awareness of/action to reduce climate change to limited demand until the economy grows further.
• Candidates may also offer country-specific knowledge to support answers such as: - United States is high because of its climate
leading to increased demand on air conditioning and heating, and its geographical size, resulting in lots of domestic air travel.
- Brazil is low because it has invested heavily in renewable HEP which does not produce carbon, so emissions are less.
12

H081/02 Mark Scheme June 2018
Question Answer Marks Guidance (d) ‘The media is as influential in the climate change
debate as scientific evidence.’ How far do you agree with this statement? Level 4 (10–12 marks) Demonstrates comprehensive and accurate knowledge and understanding of the different agendas shaping the climate change debate (AO1). Demonstrates comprehensive application of knowledge and understanding to provide a detailed and convincing evaluation offering secure judgements leading to rational conclusions that are evidence based as to the extent to which the media is as influential in the climate change debate as scientific evidence (AO2). Level 3 (7-9 marks) Demonstrates thorough and mainly accurate knowledge and understanding of the different agendas shaping the climate change debate (AO1). Demonstrates thorough application of knowledge and understanding to provide a detailed evaluation offering generally secure judgements with some link between rational conclusions and evidence as to the extent to which the media is as influential in the climate change debate as scientific evidence (AO2). Level 2 (4-6 marks) Demonstrates reasonable and some accurate knowledge and understanding of the different agendas shaping the climate change debate (AO1).
12
AO1 – 6 marks Knowledge and understanding of the media and the climate change debate could potentially include:
• Most scientists agree in human-caused climate change yet the issue remains hugely controversial.
• The International Panel on Climate Change is the most authoritative scientific body involved in climate change research.
• The climate change debate involves access to information
• Sources of information include the media, scientific and subject specific publications and the internet.
• Different elements of the media are aimed at specific groups of people.
• The media is not always strictly accurate and does not have the requirement to be as stringently evidence-based as scientists do.
• Evidence based on science aims to be accurate • There are different agendas linked to:
o Historical background including periods of greenhouse and icehouse earth
o The part played by humans in the greenhouse effect compared with the part played by natural factors
o The part the stakeholders play on the global stage and their access to resources which may contribute to climate change and their stage of development (e.g. China not signing the Kyoto Protocol, or the USA leaving the Paris Accord).
AO2 – 6 marks Application of knowledge and understanding to analyse and evaluate the extent to which the media is as important in
13

H081/02 Mark Scheme June 2018
Question Answer Marks Guidance Demonstrates reasonable application of knowledge and understanding to provide a sound evaluation offering generalised judgements and conclusions with limited links to evidence as to the extent to which media is as influential in the climate change debate as scientific evidence (AO2). Level 1 (1-3 marks) Demonstrates basic and/or inaccurate knowledge and understanding of the different agendas shaping the climate change debate (AO1). Demonstrates basic application of knowledge and understanding offering either unsupported or minimal if any evaluation. Judgements and conclusions, if any, are simplistic regarding the extent to which the media is as influential in the climate change debate as scientific evidence (AO2). 0 marks No response worthy of credit.
the climate change debate as evidence based on science could potentially include:
• Science journals and subject-specific publications are required to be based on data collection and evaluation (and to be peer-reviewed) whereas newspapers are not and therefore more likely to be based on objective ‘truth’ rather than any bias of the newspaper or media outlet.
• Energy companies (Shell, BP, ExxonMobil etc) are likely to want to distance climate change from human causes and have the means to do so, such as by purchasing advertising or influencing politicians.
• The wider reach of media versus scientific journals means that more people are going to come into contact with their information rather than from scientists.
• The media will have a wider influence than scientists • Media outlets have biases which may influence their
coverage (Guardian is left-leaning whereas The Times is more right of centre)
• Media simplifies facts for a wider audience • The general public are unlikely to read scientific
papers so any content they access will be from media outlets
• Some media, in an attempt to be seen as unbiased, give as much attention to the very small number of climate change ‘deniers’ as the overwhelming weight of evidence pointing to human causes.
• Social Media, such as Twitter, can give an un-edited platform for people to share their opinions as fact.
• Social Media more widely available. • Technological developments have allowed media
and other organisations the ability to produce detailed computer models about climate changes.
14

H081/02 Mark Scheme June 2018
Question Answer Marks Guidance 2 (a) Explain two ways physical barriers negatively affect
disease mitigation.
• Physical barriers such as mountain ranges or rivers (✓) can create remoteness from large centres of population (✓) which can make access difficult (✓) e.g. to bring assistance and aid in dealing with disease. (✓)
• Remoteness and lack of contact with the outside world (✓) can reduce a person’s knowledge of available disease mitigations (✓) and their ability to fight off diseases (✓) such as measles and chickenpox (✓) because people have not been able to build up an immunity over time (✓).
• Natural hazards, such as earthquakes (✓) can disrupt water supplies and increase the spread of water-borne diseases such as cholera (✓). Excess water, such as from a flood or storm (✓), can help spread diseases and make them harder to contain (✓).
4
AO1 – 4 marks 2 x 2 mark (✓) for each correct explanatory point. Focus should be on the knowledge and understanding of the relationship between physical barriers and disease mitigation.
(b) Suggest how rising standards of living influence a country’s epidemiological transition.
Level 3 (5-6 marks) Demonstrates thorough knowledge and understanding of the epidemiological transition (AO1).
Place specific details should be accurate with the amount helping determine where within the Level the response lies.
Demonstrates thorough application of knowledge and understanding to provide an accurate, clear and developed analysis as to how rising standards of living influence a country’s epidemiological transition (AO2).
6
AO1 – 3 marks Knowledge and understanding of the process of epidemiological transition could potentially include:
• There is a relationship between a country’s demographics, stage of development and epidemiological factors.
• Four stages are suggested: The age of pestilence and famine; The age of receding pandemics, Post-industrial societies - the age of degenerative and manmade diseases and the age of delayed degenerative diseases.
15

H081/02 Mark Scheme June 2018
Question Answer Marks Guidance Level 2 (3-4 marks) Demonstrates reasonable knowledge and understanding of the epidemiological transition (AO1). Place specific material is present which is partially accurate with the amount helping determine where within the Level the response lies. Demonstrates reasonable application of knowledge and understanding to provide a sound analysis showing some accuracy and development as to how rising standards of living influence a country’s epidemiological transition (AO2). Level 1 (1-2 marks) Demonstrates basic knowledge and understanding of the epidemiological transition (AO1). Little or no place specific material is present and or is inaccurate. Demonstrates basic application of knowledge and understanding to provide a simple analysis showing limited accuracy and little development as to how rising standards of living influence a country’s epidemiological transition (AO2). 0 marks No response worthy of credit.
• The rate of communicable diseases tends to fall whilst the rate of non-communicable diseases increases with development.
• Rising standards of living can be measured in many ways, such as an increase in GNI per capita; persons per doctor; calorie intake per person
AO2 – 3 marks Application of knowledge and understanding to analyse how rising standards of living influence a country’s epidemiological transition could potentially include:
• Rising standard of living sees an increase in clean water supplies which are less likely to spread communicable diseases
• Rising standard of living sees increased government income to provide health care such as immunisation programmes
• Higher standards of living are linked to: - a shift in the employment structure; people
working in industry are more likely to be affected by related issues (asbestos / exposure to harmful chemicals)
- Longer life expectancy so non-communicable such as cancer and degenerative diseases are more prevalent as causes of death.
- Greater access to food, so starvation and malnutrition reduce as diabetes and obesity become more frequent
- More personal transport (e.g. cars/motorbikes that emit dangerous gases in their exhaust) so air-pollution-linked conditions (respiratory diseases) are more common.
16
H081/02 Mark Scheme June 2018
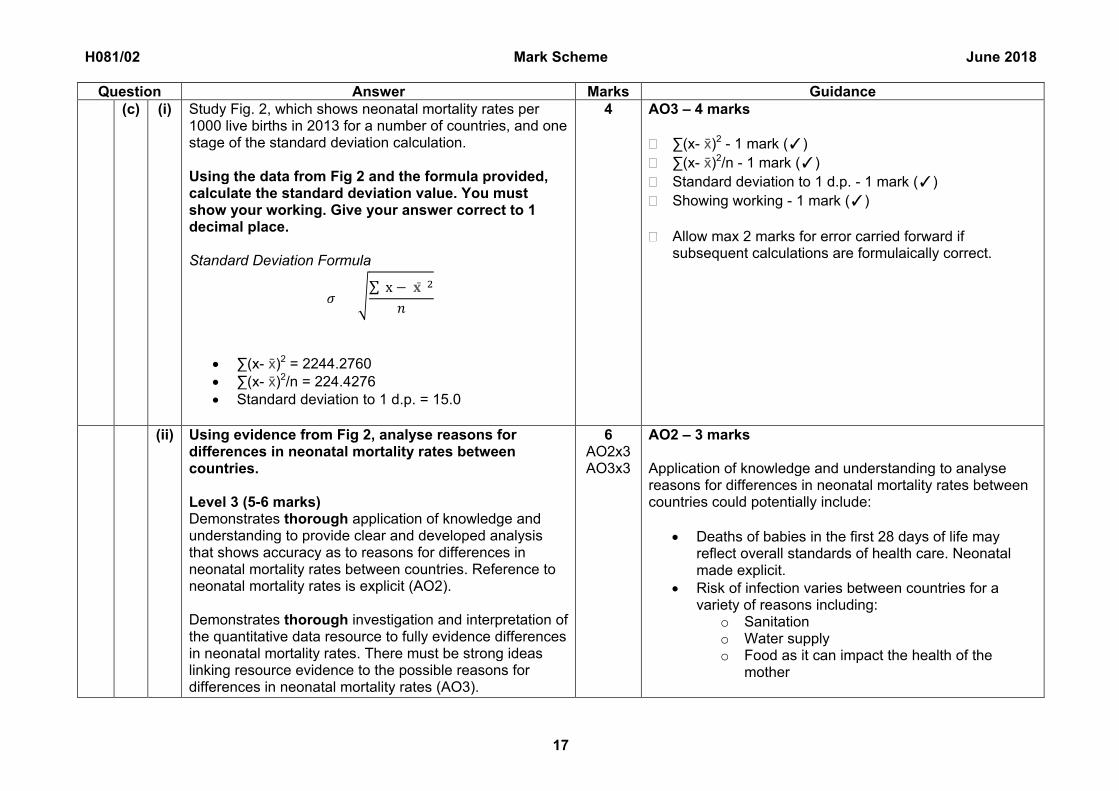
Question Answer Marks Guidance (c) (i) Study Fig. 2, which shows neonatal mortality rates per
1000 live births in 2013 for a number of countries, and one stage of the standard deviation calculation. Using the data from Fig 2 and the formula provided, calculate the standard deviation value. You must show your working. Give your answer correct to 1 decimal place. Standard Deviation Formula
𝜎𝜎 = �∑(x − 𝐱𝐱𝐱)2
𝑛𝑛
• ∑(x- x̄)2 = 2244.2760 • ∑(x- x̄)2/n = 224.4276 • Standard deviation to 1 d.p. = 15.0
4
AO3 – 4 marks � ∑(x- x̄)2 - 1 mark (✓) � ∑(x- x̄)2/n - 1 mark (✓) � Standard deviation to 1 d.p. - 1 mark (✓) � Showing working - 1 mark (✓) � Allow max 2 marks for error carried forward if
subsequent calculations are formulaically correct.
(ii) Using evidence from Fig 2, analyse reasons for differences in neonatal mortality rates between countries. Level 3 (5-6 marks) Demonstrates thorough application of knowledge and understanding to provide clear and developed analysis that shows accuracy as to reasons for differences in neonatal mortality rates between countries. Reference to neonatal mortality rates is explicit (AO2). Demonstrates thorough investigation and interpretation of the quantitative data resource to fully evidence differences in neonatal mortality rates. There must be strong ideas linking resource evidence to the possible reasons for differences in neonatal mortality rates (AO3).
6 AO2x3 AO3x3
AO2 – 3 marks Application of knowledge and understanding to analyse reasons for differences in neonatal mortality rates between countries could potentially include:
• Deaths of babies in the first 28 days of life may reflect overall standards of health care. Neonatal made explicit.
• Risk of infection varies between countries for a variety of reasons including:
o Sanitation o Water supply o Food as it can impact the health of the
mother
17

H081/02 Mark Scheme June 2018
Question Answer Marks Guidance Level 2 (3-4 marks) Demonstrates reasonable application of knowledge and understanding to provide clear and developed analysis that shows accuracy as to reasons for differences in neonatal mortality rates between countries (AO2). Demonstrates reasonable investigation and interpretation of the quantitative data resource to fully evidence differences in neonatal mortality rates. There must be good ideas linking resource evidence to the possible reason for differences in neonatal mortality rates (AO3). Level 1 (1-2 marks) Demonstrates basic application of knowledge and understanding to provide clear and developed analysis that shows accuracy as to reason for differences in neonatal mortality rates between countries (AO2). Demonstrates basic investigation and interpretation of the quantitative data resource to fully evidence differences in neonatal mortality rates. There must be some ideas linking resource evidence to resource evidence to the possible reasons for differences in neonatal mortality rates (AO3). 0 marks No response worthy of credit.
• Education/status in society of mothers affects their attitude to pregnancy and birth, and their awareness of ways to reduce risk.
• Standard of medical care available to mothers and babies depends on a variety of factors including ability of families to access the services that are available depending on:
o Distance from facilities o Possible temporary barriers e.g. natural
disasters o Urban or rural – usually urban residents can
access services more easily AO3 – 3 marks Evidence from investigation and interpretation of the data could potentially include:
• 3 countries have neonatal mortality rates under 6, (Chile, UK and USA) – ACs / EDCs with ability to provide appropriate medical services.
• 5 countries have neonatal mortality rates over 28 but under 40 (Afghanistan, Democratic Republic of Congo, India, Mozambique, Sudan). As LIDCs it is difficult to afford the healthcare of richer nations.
• The highest neonatal mortality rate is 47.4, Pakistan, another LIDC.
18

H081/02 Mark Scheme June 2018
Question Answer Marks Guidance (d) ‘Disease vectors are influenced more by physical
factors than by human factors.’ How far do you agree with this statement? Level 4 (10–12 marks) Demonstrates comprehensive and accurate knowledge and understanding of how disease vectors are influenced by physical and human factors. (AO1).
Demonstrates comprehensive application of knowledge and understanding to provide a detailed and convincing evaluation offering secure judgements leading to rational conclusions that are evidence based as to the extent to which disease vectors are influenced more by physical than human factors (AO2).
Level 3 (7-9 marks) Demonstrates thorough and mainly accurate knowledge and understanding of how disease vectors are influenced by physical and human factors. (AO1).
Demonstrates thorough application of knowledge and understanding to provide a detailed evaluation offering generally secure judgements with some link between rational conclusions and evidence as to the extent to which disease vectors are influenced more by physical than human factors (AO2).
Level 2 (4-6 marks) Demonstrates reasonable and some accurate knowledge and understanding of how disease vectors are influenced by physical and human factors. (AO1).
Demonstrates reasonable application of knowledge and understanding to provide a sound evaluation offering generalised judgements and conclusions with limited links to evidence as to the extent to which disease vectors are influenced more by physical than human factors (AO2).
12
AO1 – 6 marks Knowledge and understanding of how disease vectors are influenced by physical and human factors could potentially include:
• A vector is a carrier e.g. mosquitoes, that transmits an infectious disease such as malaria
• Climate allows mosquitoes which carry diseases such as Dengue to thrive in certain areas.
• Many disease vectors are more prevalent in tropical / sub-tropical rainy seasons
• Certain types of physical landscape support vector-borne diseases like Malaria including low-lying coastal or river-side areas; highlands and mountains tend to act as barriers.
• Human vaccination can prevent the spread of these diseases.
• Human settlement and concentration of population can increase the number of people who are infected.
• Human actions can increase or decrease the effectiveness of a physical vector, through factors like healthcare, access to clean water, education and sanitation.
AO2 – 6 marks Application of knowledge and understanding to analyse and evaluate the extent to which disease vectors are influenced more by physical than human factors could potentially include:
• Globalisation and increase in travel means that people are more able to carry and spread diseases (Zika virus / Swine Flu) meaning that physical conditions are less important.
19

H081/02 Mark Scheme June 2018
Question Answer Marks Guidance Level 1 (1-3 marks) Demonstrates basic and/or inaccurate knowledge and understanding of how disease vectors are influenced by physical and human factors. (AO1). Demonstrates basic application of knowledge and understanding offering either unsupported or minimal if any evaluation. Judgements and conclusions, if any, are simplistic regarding the extent to which disease vectors are influenced more by physical than human factors (AO2). 0 marks No response worthy of credit.
• Natural disasters can foster the outbreak and spread of disease by disrupting clean water supplies, creating habitats for insects to breed such as stagnant water. This can destroy human-made barriers to disease and increase the coverage.
• As population density increases, disease will spread more easily, demonstrating that human actions cause the spread.
• Vaccination is more effective at stopping disease than physical barriers.
• War / conflict influencing the prevalence of disease vectors e.g. broken water / sewage pipes leads to stagnant pools of water.
• Human-caused climate change creates conditions which will impact the ability of insects to carry disease faster than natural climate change: - Warmer winters will reduce the prevalence of
influenza strains, given that it is most efficient at lower temperatures
- Warmer and wetter conditions will increase the spread of diseases such as West Nile Virus, Lyme’s disease, and malaria because the insects carrying them will have preferable conditions for longer over a wider geographical area.
20

H081/02 Mark Scheme June 2018
Question Answer Marks Guidance 3 (a) Explain two ways ocean ecosystems are influenced
by changes in temperature. • Higher temperatures lead to melting ice so rising
sea level (✓) which leads to coastal squeeze (✓), loss of salt marsh (✓) and coral reefs become too deep so less light penetration (✓)
• Higher temperatures can lead to coral bleaching
(✓) leading to increased stress on the algae (✓), expulsion of algae from the coral (✓) and subsequent loss of colour (✓)
• Temperature changes are usually linked to energy
from sunlight (✓) so increase in temperature will see an increase in light in the photic zone (✓) therefore more plant-life. (✓)
• Temperatures are low, or fall - cold water stores more oxygen than warm water (✓) so a drop in temperature will see an increase in the amount of oxygen (✓) which is required for plants and animals to survive. E.g. the Antarctic Ocean ecosystem is richer in the winter as a result. (✓)
4
AO1 – 4 marks 2 x 2 marks (✓) for each correct explanatory point. Focus should be on the knowledge and understanding of the way ocean ecosystems are influenced by changes in temperature.
(b) Suggest how pollution can impact marine organisms. Level 3 (5-6 marks) Demonstrates thorough knowledge and understanding of pollution that can impact on marine organisms (AO1). Place specific details should be accurate with the amount helping determine where within the Level the response lies.
6
AO1 – 3 marks Knowledge and understanding of the types of pollution that can impact on marine organisms could potentially include:
• Pollution from fossil fuels burnt at sea by cruise ships and container ships, or from land-based sources creates vast amounts of CO2, SO2 and NO2
• Marine debris, including plastics, is accidentally and deliberately dumped at sea
• Nitrates and phosphates from agriculture can be washed off fields by heavy rain into the oceans
21

H081/02 Mark Scheme June 2018
Question Answer Marks Guidance Demonstrates thorough application of knowledge and understanding to provide an accurate, clear and developed analysis as to how pollution can impact on marine organisms (AO2). Level 2 (3-4 marks) Demonstrates reasonable knowledge and understanding of pollution that can impact on marine organisms (AO1). Place specific material is present which is partially accurate with the amount helping determine where within the Level the response lies. Demonstrates reasonable application of knowledge and understanding to provide a sound analysis showing some accuracy and development as to how pollution can impact on marine organisms (AO2). Level 1 (1-2 marks) Demonstrates basic knowledge and understanding of pollution that can impact on marine organisms (AO1). Little or no place specific material is present and or is inaccurate. Demonstrates basic application of knowledge and understanding to provide a simple analysis showing limited accuracy and little development as to how pollution can impact on marine organisms (AO2). 0 marks No response worthy of credit.
• Sewage can be pumped out to sea instead of being treated on land.
• Industrial processes can produce effluent which is washed out to sea
• Proximity to nuclear power plants can create radioactive pollutants (especially after a disaster such as in Fukushima)
• Oil spills (such as Deepwater Horizon) AO2 – 3 marks Application of knowledge and understanding to analyse how pollution can impact on marine organisms could potentially include;
• CO2, SO2 and NO2 can be dissolved in water and turn the ocean acidic, which affects the ability of plants and animals to survive, such as the impact on ability of organisms to form shells made from calcium carbonate.
• Impact on foodchains and webs as a result of loss of lower trophic levels.
• Debris can be eaten by birds and animals which kills them, affecting the food chain higher up.
• Animals can be caught in debris/pollutants (e.g. turtles in plastic 4-can ring holders, sea birds in oil spills) which restricts their growth.
• Nitrates and phosphates can cause eutrophication in coastal waters where the resulting algal bloom blocks out light and prevents photosynthesis, leading to deoxygenation and breakdown of ecosystem.
• Nuclear pollution can cause mutation of cells which is passed on through the food chain.
22

H081/02 Mark Scheme June 2018
Question Answer Marks Guidance (c) i Study Fig 3, which shows the amount of cargo imported
via oceans (in millions TEUs) in 2014 for a number of countries, and one stage of the standard deviation calculation. Using the data from Fig 3 and the formula provided, calculate the standard deviation value. You must show your working. Give your answer correct to 1 decimal place. Standard Deviation Formula
𝜎𝜎 = �∑(x − 𝐱𝐱𝐱)2
𝑛𝑛
• ∑(x- x̄)2 =327.196 • ∑(x- x̄)2/n = 32.7196 • Standard deviation to 1 d.p. = 5.7
4
AO3 – 4 marks
• ∑(x- x̄)2 - 1 mark (✓) • ∑(x- x̄)2/n - 1 mark (✓) • Standard deviation to 1 d.p. - 1 mark (✓) • Showing working - 1 mark (✓)
Allow max 2 marks for error carried forward if subsequent calculations are formulaically correct.
ii Using evidence from Fig 3, analyse reasons for differences in the amount of cargo imported via oceans between countries Level 3 (5-6 marks) Demonstrates thorough application of knowledge and understanding to provide clear and developed analysis that shows accuracy as to reasons for differences in the amount of cargo imported via oceans between countries (AO2). Demonstrates thorough investigation and interpretation of the quantitative data resource to fully evidence differences in the amount of cargo imported via oceans. There must be strong ideas linking resource evidence to the possible reasons for differences in the amount of cargo imported via oceans (AO3).
6
AO2 – 3 marks Application of knowledge and understanding to analyse reasons for differences in the amount of cargo imported via oceans between countries could potentially include:
• Countries have a different import/export balance • Not all countries have a coastline and are therefore
unable to import via oceans • Not all countries have access to trade routes and
are therefore unable to import via oceans • Some countries may import more goods as a hub to
transport to land-locked countries • Ocean-cargo is mainly suitable for bulky non-
perishable goods due to the time it takes to transport – countries requiring fresh or high-value goods might import via airfreight instead.
23

H081/02 Mark Scheme June 2018
Question Answer Marks Guidance Level 2 (3-4 marks) Demonstrates reasonable application of knowledge and understanding to provide clear and developed analysis that shows accuracy as to reasons for differences in the amount of cargo imported via oceans between countries (AO2). Demonstrates reasonable investigation and interpretation of the quantitative data resource to fully evidence differences in the amount of cargo imported via oceans There must be good ideas linking resource evidence to the possible reasons for differences in the amount of cargo imported via oceans (AO3). Level 1 (1-2 marks) Demonstrates basic application of knowledge and understanding to provide clear and developed analysis that shows accuracy as to reasons for differences in the amount of cargo imported via oceans between countries (AO2). Demonstrates basic investigation and interpretation of the quantitative data resource to fully evidence differences in the amount of cargo imported via oceans There must be some ideas linking resource evidence to resource evidence to the possible reasons for differences in the amount of cargo imported via oceans (AO3). 0 marks No response worthy of credit.
• Containerization has made ocean transport more flexible / easier / more specialized e.g. for manufactured goods / refrigerated food stuffs.
• Countries with a large population may import more goods to service the population.
AO3 – 3 marks Evidence from investigation and interpretation of the data could potentially include:
• China and the US have the largest imports – they have large populations. Whilst it does not specify what they imports are, China imports lots of raw materials which it them processes and exports to countries such as the US, which is more likely to import goods rather than materials.
• Japan has a high number of imports – given that it is an island nation, it required resources from abroad as it cannot be self-sufficient.
• Whilst India a very large population, it has the lowest imports on the table; this could be due to the lower GDP and hence the inability of people to afford expensive imported goods.
24

H081/02 Mark Scheme June 2018
Answer Marks Guidance (d) ‘Treating the oceans as ‘global commons’ has been
detrimental to them.’ How far do you agree with this statement? Level 4 (10–12 marks) Demonstrates comprehensive and accurate knowledge and understanding of oceans as ‘global commons’ (AO1). Demonstrates comprehensive application of knowledge and understanding to provide a detailed and convincing evaluation offering secure judgements leading to rational conclusions that are evidence based as to whether treating the oceans as ‘global commons’ has been detrimental to them (AO2). Level 3 (7-9 marks) Demonstrates thorough and mainly accurate knowledge and understanding of ‘global commons’ (AO1). Demonstrates thorough application of knowledge and understanding to provide a detailed evaluation offering generally secure judgements with some link between rational conclusions and evidence as to whether treating the oceans as ‘global commons’ has been detrimental to them (AO2). Level 2 (4-6 marks) Demonstrates reasonable and some accurate knowledge and understanding of ‘global commons’ (AO1). Demonstrates reasonable application of knowledge and understanding to provide a sound evaluation offering generalised judgements and conclusions with limited links to evidence as to whether treating the oceans as ‘global commons’ has been detrimental to them (AO2).
12
AO1 – 6 marks Knowledge and understanding of the oceans as ‘global commons’ could potentially include:
• Global Commons are the Earth’s shared natural resources, e.g. the oceans and the atmosphere.
• The tragedy of the commons is a metaphor illustrating how individuals can overexploit a resource in common ownership (e.g. fish in the deep ocean), leading to its depletion or degradation.
• United Nations Convention on the Law of the Sea (UNCLOS) provides a framework for governance of the oceans.
o Distance from the coastline of a country determines the ‘ownership’
- 0-3 nautical miles is territorial waters - 3-24 nautical miles a country has
sovereignty although others can travel through
- 24-200 nautical miles a country has the rights to the contents of the water and sea-bed
- 200+ nautical miles from shore is not under sovereign rule.
• Some agreements (UNCLOS) are widely adhered to, but others such as the International Whaling Commission has less than half of the world’s countries signed up, meaning that some countries (Japan) do not recognise the IWC’s authority.
AO2 – 6 marks Application of knowledge and understanding to analyse and evaluate the extent to which treating the oceans as ‘global commons’ has been detrimental to them could potentially include:
25

H081/02 Mark Scheme June 2018
Answer Marks Guidance Level 1 (1-3 marks) Demonstrates basic and/or inaccurate knowledge and understanding of ‘global commons’ (AO1). Demonstrates basic application of knowledge and understanding offering either unsupported or minimal if any evaluation. Judgements and conclusions, if any, are simplistic regarding whether treating the oceans as ‘global commons’ has been detrimental to them (AO2). 0 marks No response worthy of credit.
• Allowing countries to have rights over parts of the ocean means that they can be controlled and protected. The UK designated the Chagos Marine Reserve (in its British Indian Ocean Territory) as a No Take Zone (NTZ) and as a result has been able to protect the environment and have some of the cleanest seas in the world.
• Oceans designated as global commons means that no one country is in charge, sharing the responsibility of the oceans so
o cannot impose restrictions. All have to agree to certain conditions (eg for a NTZ to be created) which works as long as the shared interest always outweighs the individuals.
o Individuals [people or nations] therefore can act selfishly as they will benefit in the short-term with the detriment being shared across everyone.
o Degradation of this shared resource is called a ‘tragedy of the commons’.
o Makes policing of offenders difficult. • Voluntary codes of conduct mean that if a country
does not sign up to them, the others are powerless to do anything (as in the IWC)
• The oceans are interconnected so the impact of an action, such as plastic pollution, can be concentrated in far-away places. Garbage gyres in the Pacific collect debris which impacts on the marine ecosystems, but as they are more than 200 nautical miles from the coast, they are no country’s responsibility hence they have not been cleaned up.
26

H081/02 Mark Scheme June 2018
Question Answer Marks Guidance 4 (a) Explain two ways globalisation of the food industry
has created opportunities.
• Greater scrutiny of food in the media (✓) means that people all over the world can be informed (✓), pick up on trends in food. (✓)
• The distribution network is interlinked (✓) so people can eat (fresh) food grown elsewhere (✓) get food out of season (✓)
• People with specific skills in cooking can travel (✓) like Tandoori chefs (✓) being able to work in the UK. (✓)
• Technology has been able to assist in genetically modifying crops (✓) so they can be grown in marginal areas (✓) that was not possible before (✓).
4
AO1 – 4 marks 2 x 2 marks (✓) for explanation of each correct way. Focus should be on the knowledge and understanding of each of the ways opportunities have been created by the globalisation of the food industry. There are lots of possibilities for this answer, so be prepared to credit any two reasonable responses.
(b) Suggest why the pattern of food security within a country is dynamic. Level 3 (5-6 marks) Demonstrates thorough knowledge and understanding of the pattern of food security within a county (AO1). Place specific details should be accurate with the amount helping determine where within the Level the response lies. Demonstrates thorough application of knowledge and understanding to provide an accurate, clear and developed analysis as to why the pattern of food security within a country is dynamic (AO2).
6
AO1 – 3 marks Knowledge and understanding of the pattern of food security within a country could potentially include:
• Food security is defined by the World Food Programme (WFP) as having three pillars; availability, access and utilisation.
• Pattern can be temporal (seasonal) or spatial (varying over a geographical area)
• Pattern can exist within a country (urban vs rural / East vs West China)
• African countries are in the region with the lowest Global Food Security Index.
• The trend is for the higher the GDP the greater the food security
• The changes in patterns of food security can be both positive and negative.
27

H081/02 Mark Scheme June 2018
Question Answer Marks Guidance Level 2 (3-4 marks) Demonstrates reasonable knowledge and understanding of the pattern of food security within a county (AO1). Place specific material is present which is partially accurate with the amount helping determine where within the Level the response lies. Demonstrates reasonable application of knowledge and understanding to provide a sound analysis showing some accuracy and development as to why the pattern of food security within a country is dynamic (AO2). Level 1 (1-2 marks) Demonstrates basic knowledge and understanding of the pattern of food security within a county (AO1). Little or no place specific material is present and or is inaccurate. Demonstrates basic application of knowledge and understanding to provide a simple analysis showing limited accuracy and little development as to why the pattern of food security within a country is dynamic (AO2). 0 marks No response or no material worthy of credit.
AO2 – 3 marks Application of knowledge and understanding to analyse how the pattern of food security within a country changes could potentially include:
• Change in climate can make areas once able to produce food unviable or vice versa
• Natural disasters / disease can wipe out an entire crop.
• Change in political systems can see the alterations in international trade agreements which may affect food security in some parts of a country more than others
• Conflict in an area can: - Change who has control of the land - Prevent men from working the land as they are
called to fight - Make it unsafe to travel to market to trade
28

H081/02 Mark Scheme June 2018
Question Answer Marks Guidance c i Study Fig. 4, which shows the Global Food Security Index
score in 2016 for a number of countries, and one stage of the standard deviation calculation. Using the data from Fig 4 and the formula provided, calculate the standard deviation value. You must show your working. Give your answer correct to 1 decimal place. Standard Deviation Formula
𝜎𝜎 = �∑(x − 𝐱𝐱𝐱)2
𝑛𝑛
• ∑(x- x̄)2 = 4145.776 • ∑(x- x̄)2/n = 414.5776 • Standard deviation to 1 d.p. = 20.4
4
AO3 – 4 marks
• ∑(x- x̄)2 - 1 mark (✓) • ∑(x- x̄)2/n - 1 mark (✓) • Standard deviation to 1 d.p. - 1 mark (✓) • Showing working - 1 mark (✓)
Allow max 2 marks for error carried forward if subsequent calculations are formulaically correct.
ii Using evidence from Fig 4, analyse reasons for differences in the Global Food Security Index score between countries. Level 3 (5-6 marks) Demonstrates thorough application of knowledge and understanding to provide clear and developed analysis that shows accuracy as to reasons for differences in the Global Food Security Index score between countries. (AO2). Demonstrates thorough investigation and interpretation of the quantitative data resource to fully evidence differences in the Global Food Security Index score. There must be strong ideas linking resource evidence to possible reasons for differences in the Global Food Security Index Score (AO3).
6
AO2 – 3 marks Application of knowledge and understanding to analyse reasons for differences in the Global Food Security Index Score between countries could potentially include:
• Global Food Security Index Score is a measure of how secure a country is with regards to food. The higher the score the more able they are to be secure.
• GFSI can be affected by the climate, the landscape, the political situation.
• Countries with a higher GDP will be in a position to buy supplies to bolster provision in times of need; something not available to poorer countries.
29

H081/02 Mark Scheme June 2018
Question Answer Marks Guidance Level 2 (3-4 marks) Demonstrates reasonable application of knowledge and understanding to provide clear and developed analysis that shows accuracy as to reasons for differences in the Global Food Security Index score between countries. (AO2). Demonstrates reasonable investigation and interpretation of the quantitative data resource to fully evidence differences in the Global Food Security Index score. There must be good ideas linking resource evidence to possible reasons for differences in the Global Food Security Index score (AO3). Level 1 (1-2 marks) Demonstrates basic application of knowledge and understanding to provide clear and developed analysis that shows accuracy as to reasons for differences in the Global Food Security Index score between countries. (AO2). Demonstrates basic investigation and interpretation of the quantitative data resource to fully evidence differences in the Global Food Security Index score. There must be some ideas linking resource evidence to possible reasons for differences in the Global Food Security Index score between countries. (AO3). 0 marks No response worthy of credit.
AO3 – 3 marks Evidence from investigation and interpretation of the data could potentially include:
• 3 countries (USA, Ireland and UK) have scores of >80 – meaning they are very secure with regards to food; they are ACs so have ability to import and stockpile, but they also have climates suitable for growing crops.
• Qatar is just outside this group; whilst it is an AC, it is also very hot and does not have the climatic advantages of the countries higher up.
• Haiti is at the bottom of the list as it has been affected by both natural disasters and conflict which reduce its capacity to provide security for food.
30

H081/02 Mark Scheme June 2018
Question Answer Marks Guidance (d) ‘Food security is most likely to be affected by human
factors.’ How far do you agree with this statement? Level 4 (10–12 marks) Demonstrates comprehensive and accurate knowledge and understanding of how food security is likely to be affected by human factors (AO1). Demonstrates comprehensive application of knowledge and understanding to provide a detailed and convincing evaluation offering secure judgements leading to rational conclusions that are evidence based as to the extent to which food security is most likely to be affected by human factors (AO2). Level 3 (7-9 marks) Demonstrates thorough and mainly accurate knowledge and understanding of how food security is likely to be affected by human factors (AO1). Demonstrates thorough application of knowledge and understanding to provide a detailed evaluation offering generally secure judgements with some link between rational conclusions and evidence as to the extent to which food security is most likely to be affected by human factors (AO2). Level 2 (4-6 marks) Demonstrates reasonable and some accurate knowledge and understanding of how food security is likely to be affected by human factors (AO1).
12
AO1 – 6 marks Knowledge and understanding of how food security is likely to be affected by human factors could potentially include:
• Food security is defined by the World Food Programme (WFP) as having three pillars; availability, access and utilisation.
Human:
• Land ownership – land owners can influence where the crop goes
• Capital – investment can provide motivation to increase yields
• Competition – price wars can impact farmers • Technology – can increase yields e.g. through
genetic modification. • Land grabbing – countries buying up land in
other countries to service their needs • Storage and distribution – can benefit food
security if effective and the opposite if inadequate
• Human causes of desertification – reduce food supply
• Trade agreements – can have positive and negative effects on food security
• Conflict e.g. civil war – usually leads to reduced food security
AO2 – 6 marks Application of knowledge and understanding to analyse and evaluate the extent to which food security is most likely to be affected by human factors could potentially include:
• Human factors are more dynamic as they can change faster so likely to impact food security quickly whether positive or negative.
31

H081/02 Mark Scheme June 2018
Question Answer Marks Guidance Demonstrates reasonable application of knowledge and understanding to provide a sound evaluation offering generalised judgements and conclusions with limited links to evidence as to the extent to which food security is most likely to be affected by human factors (AO2). Level 1 (1-3 marks) Demonstrates basic and/or inaccurate knowledge and understanding of how food security is likely to be affected by human factors (AO1). Demonstrates basic application of knowledge and understanding offering either unsupported or minimal if any evaluation. Judgements and conclusions, if any, are simplistic regarding the extent to which food security is most likely to be affected by human factors (AO2). 0 marks No response worthy of credit.
• Trade agreements can be changed overnight (e.g. Trump and the Trans-Pacific Partnership) which will impact quickly on competition issues.
• Advances in technology occur rapidly, and there is no way of know what new technology will be available in the future and when this might happen. Implementation depends on a range of human factors e.g. level of development
• Land-grabbing is (partly) in response to the climate change issue.
• Most of the physical factors, such as climate, temperature, aspect, altitude and slope are long term issues which are known about. Therefore, countries will have adapted to their own physical conditions – i.e. will grow crops suited to their environment thus creating relatively good food security.
• Climate change may be the biggest non-human factor impacting on food security - temperature and rainfall will change which will have an impact, but this is likely to be slow enough for provision to be put in place.
• Natural disasters are physical events which could quickly threaten food security and these tend to be in defined (tectonically or climatically) areas so people are aware of the threat, even if they are taken by surprise when it strikes.
• In some places factors such as unreliable rainfall – unexpected flood or drought – can affect food security.
• Human factors include national and international short-term food relief.
32

H081/02 Mark Scheme June 2018
Question Answer Marks Guidance 5 (a) Explain two pieces of evidence that support the
theory of continental drift.
• Evidence for sea-floor spreading (✓) where paleomagnetism (✓) has been used to determine the age of sea floor rocks (✓).
• Evidence from ancient glaciations (✓) where the geology matches in two places (✓) with anomalous geology in between (✓).
• Continents (Africa and South America) (✓) shapes of west and east coasts (✓) seem to fit together like pieces of a jigsaw puzzle (✓).
• Fossils from land-based animals (✓) found in South America and Africa (✓) suggesting that the continents were once joined (✓).
4
AO1 – 4 marks 2 x 2 mark (✓) for each correct difference. Focus should be on the knowledge and understanding of each of the two pieces of evidence that support the theory of continental drift
(b) Suggest how volcanic hazards are affected by types of volcanic eruption. Level 3 (5-6 marks) Demonstrates thorough knowledge and understanding of volcanic hazards and types of volcanic eruption (AO1). Place specific details should be accurate with the amount helping determine where within the Level the response lies. Demonstrates thorough application of knowledge and understanding to provide an accurate, clear and developed analysis as to how volcanic hazards are affected by types of volcanic eruption (AO2). Level 2 (3-4 marks) Demonstrates reasonable knowledge and understanding of volcanic hazards and types of volcanic eruption (AO1).
6
AO1 – 3 marks Knowledge and understanding of the volcanic hazards and types of volcanic eruption could potentially include:
• Types of volcanic eruptions include explosive / effusive / hot-spot
• Lava flows; pyroclastic flows; gas emissions; tephra; and ash.
• Lahars and flooding associated with the melting of ice.
• Tsunamis associated with explosive eruptions. AO2 – 3 marks Application of knowledge and understanding to analyse how volcanic hazards are affected by types of volcanic eruption could potentially include:
33

H081/02 Mark Scheme June 2018
Question Answer Marks Guidance Place specific material is present which is partially accurate with the amount helping determine where within the Level the response lies. Demonstrates reasonable application of knowledge and understanding to provide a sound analysis showing some accuracy and development as to how volcanic hazards are affected by types of volcanic eruption (AO2). Level 1 (1-2 marks) Demonstrates basic knowledge and understanding of volcanic hazards and types of volcanic eruption (AO1). Little or no place specific material is present and or is inaccurate. Demonstrates basic application of knowledge and understanding to provide a simple analysis showing limited accuracy and little development as to how volcanic hazards are affected by type of volcanic eruption (AO2). 0 marks No response worthy of credit.
• Explosive volcanoes, found at destructive plate boundaries, will have pyroclastic flows and other projectiles given the pressure build up from the complex magma network and plugging of vents due to the high silica content of the magma. Lava flows will be slow moving. Tsunamis may be caused when the eruption is close to the coast / underwater and results in a significant shift in the plates leading to massive displacement of water.
• Effusive volcanoes, found at constructive plate boundaries, will have a lower viscosity lava which moves much faster. Less pressure build-up before eruption means little tephra and ash, but gas emissions still possible. If under an ice-sheet (i.e. Iceland) then flooding from meltwater possible.
• Hot-spot volcanoes (such as Hawaii) tend to have long-lasting effusive eruptions (see above).
34

H081/02 Mark Scheme June 2018
Question Answer Marks Guidance c i Study Fig.5, which shows the number of deaths from
volcanoes in thousands between 1900 – 2014 for a number of countries, and one stage of the standard deviation calculation. Using the data from Fig 5 and the formula provided, calculate the standard deviation value. You must show your working. Give your answer correct to 1 decimal place. Standard Deviation Formula
𝜎𝜎 = �∑(x − 𝐱𝐱𝐱)2
𝑛𝑛
• ∑(x- x̄)2 = 63.06844 • ∑(x- x̄)2/n = 6.306844 • Standard deviation to 1 d.p. = 2.5
4
AO3 – 4 marks
• ∑(x- x̄)2 - 1 mark (✓) • ∑(x- x̄)2/n - 1 mark (✓) • Standard deviation to 1 d.p. - 1 mark (✓) • Showing working - 1 mark (✓)
Allow max 2 marks for error carried forward if subsequent calculations are formulaically correct.
ii Using evidence from Fig 5, analyse reasons for differences in the number of deaths from volcanoes between countries. Level 3 (5-6 marks) Demonstrates thorough application of knowledge and understanding to provide clear and developed analysis that shows accuracy as to reasons for differences in the number of deaths from volcanoes between countries. (AO2). Demonstrates thorough investigation and interpretation of the quantitative data resource to fully evidence differences in the number of deaths from volcanoes. There must be strong ideas linking resource evidence to the possible reasons for differences in the number of deaths from volcanoes (AO3).
6
AO2 – 3 marks Application of knowledge and understanding to analyse reasons for differences in the number of deaths from volcanoes between countries could potentially include:
• The extent to which the volcanoes are active • The way in which the volcano was being monitored
and whether people were given warning to evacuate • The time and duration of the eruption • Whether the technology was available at the time to
predict the eruption • How close the country was to a fault line
AO3 – 3 marks Evidence from investigation and interpretation of the data
35

H081/02 Mark Scheme June 2018
Question Answer Marks Guidance Level 2 (3-4 marks) Demonstrates reasonable application of knowledge and understanding to provide clear and developed analysis that shows accuracy as to reasons for differences in the number of deaths from volcanoes between countries. (AO2). Demonstrates reasonable investigation and interpretation of the quantitative data resource to fully evidence differences in the number of deaths from volcanoes. There must be good ideas linking resource evidence to the possible reasons for differences in the number of deaths from volcanoes (AO3). Level 1 (1-2 marks) Demonstrates basic application of knowledge and understanding to provide clear and developed analysis that shows accuracy as to reasons for differences in the number of deaths from volcanoes between countries. (AO2). Demonstrates basic investigation and interpretation of the quantitative data resource to fully evidence differences in the number of deaths from volcanoes. There must be some ideas linking resource evidence to resource evidence to the possible reasons for differences in the number of deaths from volcanoes (AO3). 0 marks No response worthy of credit.
could potentially include: • Indonesia has the highest volcanic death toll. It is an
EDC and therefore not as wealthy as an AC which would have been able to provide more investment into the monitoring of the volcano.
• ACs e.g. US able to provide more investment into the monitoring and evacuation.
• Democratic Republic of Congo is an LIDC has not had many eruptions, showing that it is a physical rather than economic factor.
• Chile has the lowest number of deaths. People tend not to live near volcanoes and there are infrequent eruptions.
36

H081/02 Mark Scheme June 2018
Question Answer Marks Guidance (d) ‘Volcanic hazards are easier to manage than
earthquake hazards.’ How far do you agree with this statement?
Level 4 (10–12 marks) Demonstrates comprehensive and accurate knowledge and understanding of volcanic and earthquake hazards (AO1).
Demonstrates comprehensive application of knowledge and understanding to provide a detailed and convincing evaluation offering secure judgements leading to rational conclusions that are evidence based as to the extent to which volcanic hazards are easier to manage than earthquake hazards (AO2).
Level 3 (7-9 marks) Demonstrates thorough and mainly accurate knowledge and understanding of volcanic and earthquake hazards (AO1).
Demonstrates thorough application of knowledge and understanding to provide a detailed evaluation offering generally secure judgements with some link between rational conclusions and evidence as to the extent to which volcanic hazards are easier to manage than earthquake hazards (AO2).
Level 2 (4-6 marks) Demonstrates reasonable and some accurate knowledge and understanding of volcanic and earthquake hazards (AO1).
Demonstrates reasonable application of knowledge and understanding to provide a sound evaluation offering generalised judgements and conclusions with limited links to evidence as to the extent to which volcanic hazards are easier to manage than earthquake hazards (AO2).
12
AO1 – 6 marks Knowledge and understanding of the hazards posed by volcanic and earthquake events and their management could potentially include:
• volcanic hazards – lava flows; pyroclastic flows; tephra; toxic gases (CO, CO2, SO2); lahars
• Volcanic hazards can be managed by: - Building barriers to divert the lava flows around
settlements - Monitoring volcanoes for changes in temperature, size,
gas emissions - Preparing and practicing evacuation drills and response
scenarios - Spraying lava to cool, solidify and stop its flow.
• seismic hazards – ground shaking + ground displacement; liquefaction; landslides + avalanches; tsunami Seismic hazards can be managed by:
- building aseismically on flat land with reinforcement, cross-bracing and deep foundations to prevent building collapse
- Preparing and practicing evacuation drills and response scenarios
AO2 – 6 marks Application of knowledge and understanding to analyse and evaluate the extent to which volcanic hazards are easier to manage than earthquake hazards could potentially include: • Some of the methods are easier and cheaper to do
than others – practicing evacuation drills is cheaper than building an earthquake-proof building.
37

H081/02 Mark Scheme June 2018
Question Answer Marks Guidance Level 1 (1-3 marks) Demonstrates basic and/or inaccurate knowledge and understanding of volcanic and earthquake hazards (AO1). Demonstrates basic application of knowledge and understanding offering either unsupported or minimal if any evaluation. Judgements and conclusions, if any, are simplistic regarding the extent to which volcanic hazards are easier to manage than earthquake hazards (AO2). 0 marks No response worthy of credit.
• Some techniques are more effective than others – spraying lava to cool it requires a supply of water and people in the area to do it whereas barriers can be set up and left. It is perhaps cheaper to spray rather than build the barriers, and is less unsightly, but may be less effective.
• There is no way to predict exactly when a seismic event will occur, although there are methods which are becoming increasingly more effective, so there is usually less warning than with a volcano, hence harder to take action.
• Prediction of volcanic eruption is easier and more effective so taking action can be more thorough.
• Some of the hazards created by both events are the same, including disruption of infrastructure, homelessness and death, so the management of these factors would be similar in terms of their demand.
• Seismic events tend to impact more people so the management of them is harder.
• There are more people living in seismically active zones than live in danger areas near volcanoes.
6 (a) With reference to Fig. 6 suggest how the impact of climate change on landscape systems might vary globally Level 3 (6-8 marks) Demonstrates thorough knowledge and understanding of climate change and its impact on landscape systems (AO1). Demonstrates thorough application of knowledge and understanding to provide a clear and developed interpretation that shows accuracy of how the impact of climate change on landscape systems might vary globally (AO2).
8
Indicative Content AO1 – 4 marks Knowledge and understanding of the impact of climate change and landscape systems could potentially include:
• climate change, in particular effects, on geomorphic systems, of changes such as temperatures and levels and types of precipitation
• idea that landscape systems are open systems with energy and materials flowing through them
• specific points will depend on the landscape system studied by the candidate, coastal (e.g. sea level rise or change in sea temperature), glaciated (e.g. ice
38

H081/02 Mark Scheme June 2018
Question Answer Marks Guidance This will be shown by including well-developed ideas linking resource evidence of changes in temperature to global variations in the impact of climate change on landscape systems. There are clear attempts to make synoptic links between content from different parts of the course of study. Level 2 (3-5 marks) Demonstrates reasonable knowledge and understanding of climate change and its impact on landscape systems (AO1). Demonstrates reasonable application of knowledge and understanding to provide a sound interpretation that shows some accuracy of how the impact of climate change on landscape systems might vary globally (AO2). This will be shown by including developed ideas linking resource evidence of changes in temperature to global variations in the impact of climate change on landscape systems. There are some attempts to make synoptic links between content from different parts of the course of study but these are not always relevant. Level 1 (1-2 marks) Demonstrates basic knowledge and understanding of climate change and its impact on landscape systems (AO1). Demonstrates basic application of knowledge and understanding to provide a simple interpretation that shows limited accuracy of how the impact of climate change on landscape systems might vary globally (AO2).
melt or temperature change) or dryland (e.g. spread of deserts or increased drought)
• Climate change is going to be uneven across the globe as shown on the resource.
• General trend is for an increase in temperature although the resource shows some decreases especially over ocean areas
• Temperature fluctuations have been seen in the past and the landscape systems have been impacted by them.
AO2 – 4 marks Application of knowledge and understanding to interpret how the impact of climate change on landscape systems may vary globally could potentially include:
• Increase in temperature in high latitude / altitude areas could result in ice melt which would lead to increased fluvial erosion.
• Biggest change in temperature has been across Alaska, Canada and norther Russia which will have affected permafrost and melted ice.
• Few places on land are going to have a decrease in temperature – South East Russia is the only notable place which might lead to an advance of glaciers.
• Parts of northern Africa are warmer, so likely to see increased desertification of marginal lands.
• West coast of North / South America has warmed more than the west coast of Europe / Africa which means that the impact on landscape systems will not be consistent across the globe.
• Higher sea temperature in the Pacific will see greater evaporation, and higher orographic rainfall on west coast, so more fluvial erosion, or glacial erosion higher up in the mountains (e.g. Andes).
39

H081/02 Mark Scheme June 2018
Question Answer Marks Guidance There will be simple ideas linking resource evidence of changes in temperature to global variations in the impact of climate change on landscape systems. There are limited attempts to make synoptic links between content from different parts of the course of study. 0 marks No response worthy of credit
• Higher sea temperatures will lead to focusing of wave energy closer to the shore and cliff faces, increasing coastal erosion, particularly in places with soft rock geology (e.g. Holderness).
• Climate change may lead to more storms through deeper low-pressure events, creating storm surges which could threaten current coastlines and endanger coastal settlements.
(b) Examine how climate change could influence the informal representation of place. Level 3 (6-8 marks) Demonstrates thorough knowledge and understanding of climate change and the informal representation of place (AO1). Demonstrates thorough application of knowledge and understanding to provide a clear and developed analysis that shows accuracy of how climate change could influence the informal representation of place (AO2). There must be well-developed ideas of how climate change influences the informal representation of place. There are clear attempts to make synoptic links between content from different parts of the course of study. Level 2 (3-5 marks) Demonstrates reasonable knowledge and understanding of climate change and the informal representation of place (AO1).
8
Indicative Content AO1 – 4 marks Knowledge and understanding of climate change and the informal representation of place could potentially include:
• Climate change e.g. rising temperatures leading to; rising sea levels / stronger winds / changing rainfall patterns
• People associate place with a particular climate – mountains are cold with snow, beaches with palm trees are hot etc.
• If climate changes, a place is likely to change. • Informal representation of place influence people’s
perception e.g. advertising a place where different activities are possible will contribute to the informal representation of that place.
• Informal representation of place provides a globalized view of the world, through the internet and media
AO2 – 4 marks Application of knowledge and understanding to analyse how climate change could influence the informal representation of place could potentially include:
40

H081/02 Mark Scheme June 2018
Question Answer Marks Guidance Demonstrates reasonable application of knowledge and understanding to provide a sound analysis that shows some accuracy of how climate change could influence the informal representation of place (AO2). There must be developed ideas of how climate change influences the informal representation of place. There are some attempts to make synoptic links between content from different parts of the course of study but these are not always relevant. Level 1 (1-2 marks) Demonstrates basic knowledge and understanding of climate change and the informal representation of place (AO1). Demonstrates basic application of knowledge and understanding to provide a simple analysis that shows limited accuracy of how climate change could influence the informal representation of place (AO2). This will be shown by including simple ideas of how climate change influences the informal representation of place. There are limited attempts to make synoptic links between content from different parts of the course of study. 0 marks No response worthy of credit.
• Increase in temperature could melt snow and ice and change a ‘ski village’ to just a village.
• Sea level rise could wipe out low-lying coastal settlements relying on their beach as a tourist attraction and removing the ‘sea-front’ identity.
• Increased erosion could change the landscape to make it inaccessible i.e. through deepening of a river channel.
• Desertification could make an area ‘more extreme’ so people feel it is more dangerous / harder to live in than before.
• Destinations could become more favourable as a ‘summer retreat’ – Margate could become the new Majorca if temperatures increased.
• The South Downs could become as revered as Champagne for their production of sparkling wine if the temperature increases sufficiently to produce a reliable grape harvest.
• People’s perception of place is reinforced by informal representations of place through contrasting media such as TV, film, music, art, photography, literature, graffiti and blogs. If the place changes through climate change its informal representation will have to change.
41

H081/02 Mark Scheme June 2018
Question Answer Marks Guidance 7 (a) With reference to Fig 7, suggest how the healthcare
mitigation strategies of organisations might impact social inequality in places. Level 3 (6-8 marks) Demonstrates thorough knowledge and understanding of healthcare mitigation strategies of organisations and social inequality in places (AO1). Demonstrates thorough application of knowledge and understanding to provide a clear and developed interpretation that shows accuracy of how the healthcare mitigation strategies of organisations might impact social inequality in places (AO2). This will be shown by including well-developed ideas linking resource evidence on healthcare mitigation strategies and impacts on social inequality. There are clear attempts to make synoptic links between content from different parts of the course of study. Level 2 (3-5 marks) Demonstrates reasonable knowledge and understanding of healthcare mitigation strategies of organisations and social inequality in places (AO1). Demonstrates reasonable application of knowledge and understanding to provide a sound interpretation that shows some accuracy of how the healthcare mitigation strategies of organisations might impact social inequality in places (AO2). This will be shown by including developed ideas linking resource evidence on healthcare mitigation strategies and impacts on social inequality strategies.
8
Indicative Content AO1 – 4 marks Knowledge and understanding of healthcare mitigation strategies put in place by organisations, and social inequality, could potentially include:
• Organisations could include NGOs / Governments / Charities
• Healthcare mitigation strategies might include legislation passed down by government (e.g. Obamacare) or specific programmes delivered by NGOs (e.g. the Gates’ Foundation “Decade of Vaccines”) or a policy of paid healthcare alongside other/basic provision.
• Government intervention is usually through top down initiatives affecting healthcare mitigation strategies. The NHS is an example of top down healthcare
• NGOs and charities more likely to use bottom-up methods
• Social inequality can be thought of in a number of ways, including through wealth or access to healthcare through
o wealth and poverty in different areas or demographic groups
o access to healthcare which varies according to a range of factors including urban/rural, cost, availability of trained medical staff.
• Obamacare was an attempt to reduce social inequality through universal healthcare.
42

H081/02 Mark Scheme June 2018
Question Answer Marks Guidance There are some attempts to make synoptic links between content from different parts of the course of study but these are not always relevant. Level 1 (1-2 marks) Demonstrates basic knowledge and understanding of healthcare mitigation strategies of organisations and social inequality in places (AO1). Demonstrates basic application of knowledge and understanding to provide a simple interpretation that shows limited accuracy of how the healthcare mitigation strategies of organisations might impact social inequality in places (AO2). There will be simple ideas linking resource evidence on healthcare mitigation strategies and impacts on social inequality. There are limited attempts to make synoptic links between content from different parts of the course of study. 0 marks No response worthy of credit
AO2 – 4 marks Application of knowledge and understanding to interpret how the healthcare mitigation strategies of organisations might impact social inequality in places could potentially include:
• Mitigation strategies of different organisations include vaccination programmes which
o help to reduce the incidence and spread of communicable diseases thus impacting social inequality
o Free vaccination of all children e.g. UK measles vaccination of babies or cholera vaccination in high risk areas – if taken up benefits all so reduces inequality; if not, can have a detrimental effect to the wider population
• Those who want to can pay for private medical support but some people cannot afford this, hence impacting inequality in ACs, EDCs.
• Chicago is highlighted in the figure – suggests that others not living in the city might still access this support and as a result there is inequality based on location.
• Free healthcare available 24/7 as in UK (reduces inequality) compared with USA where payment / insurance has been the norm increasing inequality.
• Government campaigns on preventive measures (e.g. healthy diet/non-smoking lifestyle etc) may be rejected by some cultures/communities leading to inequality e.g. higher prevalence of non-communicable diseases such as diabetes in ACs (e.g. Japan) and people are less likely to pay
43

H081/02 Mark Scheme June 2018
Question Answer Marks Guidance for/accept the need for preventative medicine as opposed to immediately-required intervention.
• The role of government on education, housing, availability of work/income, social support etc all ultimately affect healthcare as well as social inequality (reflected in distribution of deprivation in ACs e.g. UK).
(b) Examine how patterns of disease and landscape systems can both be influenced by climatic factors. Level 3 (6-8 marks) Demonstrates thorough knowledge and understanding of patterns of disease / landscape systems and climatic factors that influence them (AO1). Demonstrates thorough application of knowledge and understanding to provide a clear and developed analysis that shows accuracy of how patterns of disease and landscape systems can both be influenced by climatic factors (AO2). There must be well-developed ideas of the influence of climatic factors on landscape systems and patterns of disease. There are clear attempts to make synoptic links between content from different parts of the course of study. Level 2 (3-5 marks) Demonstrates reasonable knowledge and understanding of patterns of disease / landscape systems and climatic factors that influence them (AO1).
8
Indicative Content AO1 – 4 marks Knowledge and understanding of patterns of disease / landscape systems and climatic factors that influence them could potentially include:
- Knowledge + understanding of landscape systems will focus on one of coastal, glaciated or dryland
- Both Landscape systems and patterns of disease are influenced by climate (temperature, precipitation, wind); climate change.
- Patterns of disease vary according to
o the disease (eg malaria which requires water sources in warm humid areas)
o factors affecting spread of disease (eg tsetse fly/sleeping sickness)
AO2 – 4 marks Application of knowledge and understanding to analyse how patterns of disease and landscape systems can both be influenced by climatic factors could potentially include:
- Some diseases are constrained by climatic factors eg Dengue fever requires specific open, relatively still water sources for mosquitoes to breed which carry the disease, malaria – deserts too hot or dry for mosquitoes to breed
44

H081/02 Mark Scheme June 2018
Question Answer Marks Guidance Demonstrates reasonable application of knowledge and understanding to provide a sound analysis that shows some accuracy of how patterns of disease and landscape systems can both be influenced by climatic factors (AO2). There must be developed ideas of the influence of the influence of climatic factors on landscape systems and patterns of disease. There are some attempts to make synoptic links between content from different parts of the course of study but these are not always relevant. Level 1 (1-2 marks) Demonstrates basic knowledge and understanding of patterns of disease / landscape systems and climatic factors that influence them (AO1). Demonstrates basic application of knowledge and understanding to provide a simple analysis that shows limited accuracy of how patterns of disease and landscape systems can both be influenced by climatic factors (AO2). This will be shown by including simple ideas of the influence of the influence of climatic factors on landscape systems and patterns of disease. There are limited attempts to make synoptic links between content from different parts of the course of study. 0 marks No response worthy of credit.
- Landscapes where it is hard for humans to survive because of the climate are likely to reduce vectors of disease thus affecting patters of disease.
- Landscapes with strong winds make it difficult for some airborne pathogens to be effective, (or malarial mosquitoes to survive).
- Seasonal changes in climate affect patterns of disease and landscape systems.
o Winter weather in the UK raises the incidence of flu and respiratory diseases. It also affects landscapes (strong winds, high rainfall, low temperatures) eg by increasing coastal erosion, freeze-thaw weathering, replenishing aquifers and rivers in dry areas.
o Periods of drought or monsoon rains influence disease outbreaks and can affect landscapes eg by increasing weathering, erosion, transportation and deposition.
.
45
H081/02 Mark Scheme June 2018
Question Answer Marks Guidance 8 (a) With reference to Fig 8, suggest how oceans are used
in determining place profiles. Level 3 (6-8 marks) Demonstrates thorough knowledge and understanding of oceans and determining place profiles (AO1). Demonstrates thorough application of knowledge and understanding to provide a clear and developed interpretation that shows accuracy of how oceans are used in determining place profiles (AO2). This will be shown by including well-developed ideas linking resource evidence on how oceans are used in determining place profiles. There are clear attempts to make synoptic links between content from different parts of the course of study. Level 2 (3-5 marks) Demonstrates reasonable knowledge and understanding of oceans and determining place profiles (AO1). Demonstrates reasonable application of knowledge and understanding to provide a sound interpretation that shows some accuracy of how oceans are used in determining place profiles (AO2). This will be shown by including developed ideas linking resource evidence on how oceans are used in determining place profiles. There are some attempts to make synoptic links between content from different parts of the course of study but these are not always relevant.
8
Indicative Content AO1 – 4 marks Knowledge and understanding of oceans and determining place profiles could potentially include:
• Place profile is a composite picture of the place. • A range of factors contribute to representation of
place profiles including demographic, socioeconomic, cultural, political, built and natural characteristics.
• The use of oceans in determining place profiles is best done along ocean margins.
• Given the changeability of the oceans, depending on the weather, the impact oceans have on determining place profiles can also be changeable.
• Oceans are large bodies of water that touch various parts of land and are often shared by many countries.
• The same ocean may be part of different ‘place profiles’ at different locations.
AO2 – 4 marks Application of knowledge and understanding to interpret how oceans are used in determining place profiles could potentially include:
• The Great Ocean Road in Fig 8 is used in determining the place profile because
o it is somewhere that people who are visiting Melbourne might like to visit.
o It is a means of getting from A to B and also a way to see and experience the ocean because follows the coastline
• The ocean shown in Fig 8 is used to represent this particular place profile in a strong way
o it is the main natural feature
46

H081/02 Mark Scheme June 2018
Question Answer Marks Guidance Level 1 (1-2 marks) Demonstrates basic knowledge and understanding of oceans and determining place profiles (AO1). Demonstrates basic application of knowledge and understanding to provide a simple interpretation that shows limited accuracy of how oceans are used in determining place profiles (AO2). There will be simple ideas linking resource evidence on how oceans are used in determining place profiles. There are some attempts to make synoptic links between content from different parts of the course of study but these are not always relevant. 0 marks No response worthy of credit
o it is highly relevant to the composite picture of the place, including scenery and leisure activities.
• Other aspects of oceans may also be used to determine place profiles e.g. economic (ports/natural harbours, off shore oil production), environmental (melting ice, pollution).
• The ocean coast has a particular set of characteristics of which there is a generalised shared understanding amongst people using them for relaxation in determining the place profile (beaches, open spaces, wind, sand, and horizon).
(b) Examine how oceans and landscape systems can both be influenced by climate change. Level 3 (6-8 marks) Demonstrates thorough knowledge and understanding of oceans / landscape systems and the influence of climate change. (AO1). Demonstrates thorough application of knowledge and understanding to provide a clear and developed analysis that shows accuracy of how oceans and landscape systems can both be influenced by climate change (AO2). There must be well-developed ideas of the influence of climate change on oceans and landscape systems. There are clear attempts to make synoptic links between content from different parts of the course of study.
8
Indicative Content AO1 – 4 marks Knowledge and understanding of oceans / landscape systems and the influence of climate change could potentially include:
• Knowledge and understanding of landscape systems will focus on one of coastal, glaciated or dryland so answer will depend on which the candidate has chosen.
• Both landscape systems and oceans are influenced by climate (temperature, precipitation, wind); climate change.
• Knowledge and understanding of the impacts of climate change on the oceans which may include:
• rising temperatures leading to sea level rise.
47

H081/02 Mark Scheme June 2018
Question Answer Marks Guidance Level 2 (3-5 marks) Demonstrates reasonable knowledge and understanding of oceans / landscape systems and the influence of climate change. (AO1).
Demonstrates reasonable application of knowledge and understanding to provide a sound analysis that shows some accuracy of how oceans and landscape systems can both be influenced by climate change (AO2).
There must be developed ideas of impacts of the influence of climate change on oceans and landscape systems.
There are some attempts to make synoptic links between content from different parts of the course of study but these are not always relevant.
Level 1 (1-2 marks) Demonstrates basic knowledge and understanding of oceans / landscape systems and the influence of climate change. (AO1).
Demonstrates basic application of knowledge and understanding to provide a simple analysis that shows limited accuracy of how oceans and landscape systems can both be influenced by climate change (AO2).
This will be shown by including simple ideas of the influence of climate change on oceans and landscape systems.
There are limited attempts to make synoptic links between content from different parts of the course of study.
0 marks No response worthy of credit.
• melting ice caps (Ice sheets may have greater contact with water which would increase melting and calving.)
• thermal expansion of water. • Increased wind creates larger and more powerful
waves • Incidence of storms may increase with higher rainfall
AO2 – 4 marks Application of knowledge and understanding to analyse how oceans and landscape systems can both be influenced by climate change could potentially include:
• Greater coastal erosion through more powerful waves.
• Some coastal areas will become submerged due to sea level rise and as a result will no longer be part of the coastal system but rather the sea bed.
• Rising temperatures will lead to glaciers melting, hence changes to the glacial systems through increased melt water flow.
• Ice sheets may have greater contact with water which would increase melting and calving.
• Dryland areas may be encroached upon by rising sea level or receive more precipitation.
• Increased ocean temperature could lead to more precipitation as a result of greater evaporation resulting in the possibility of flash flooding (in dryland landscapes), or higher snowfall (in glaciated areas).
• Increase in storms, with a higher rainfall, will increase the rate of erosion in some areas
48

H081/02 Mark Scheme June 2018
Question Answer Marks Guidance 9 (a) With reference to Fig. 9, suggest how food security
may be affected by migration to cities. Level 3 (6-8 marks) Demonstrates thorough knowledge and understanding of food security and migration to cities (AO1). Demonstrates thorough application of knowledge and understanding to provide a clear and developed interpretation that shows accuracy of how food security may be affected by migration to cities (AO2). This will be shown by including well-developed ideas linking resource evidence on food security and migration to cities. There are clear attempts to make synoptic links between content from different parts of the course of study. Level 2 (3-5 marks) Demonstrates reasonable knowledge and understanding of food security and migration to cities (AO1). Demonstrates reasonable application of knowledge and understanding to provide a sound interpretation that shows some accuracy of how food security may be affected by migration to cities (AO2). This will be shown by including developed ideas linking resource evidence on food security and migration to cities. There are some attempts to make synoptic links between content from different parts of the course of study but these are not always relevant.
8
Indicative Content AO1 – 4 marks Knowledge and understanding of food security and migration to cities could potentially include:
• Food security is defined by the World Food Programme (WFP) as having three pillars; availability, access and utilisation.
• Pattern of food security is dynamic – varying within countries
• A number of interrelated factors influence food security e.g. physical, social, economic and political
• Contrasting levels of economic development has implications for food security
• Strategies and techniques to improve food security – technology innovation
• Shifting flows of people (migration) and resources (natural e.g. food) changed over time
• Distribution of resources are not evenly spread within and between places
• Strategies to rebrand places e.g. food
AO2 – 4 marks Application of knowledge and understanding to interpret how food security is affected by migration to cities could potentially include:
• From Fig.9, There is an increasing number of migrants / urban population which will increase demand on limited food resources, reducing food security.
• Most migration to cities now occurs in LIDCs where infrastructure for importing food from surrounding regions and countries is less comprehensive than cities in ACs such as London.
49

H081/02 Mark Scheme June 2018
Question Answer Marks Guidance Level 1 (1-2 marks) Demonstrates basic knowledge and understanding of food security and migration to cities (AO1). Demonstrates basic application of knowledge and understanding to provide a simple interpretation that shows limited accuracy of how food security may be affected by migration to cities (AO2). There will be simple ideas linking resource evidence on food security and migration to cities. There are limited attempts to make synoptic links between content from different parts of the course of study. 0 marks No response worthy of credit
• Rate of migration to cities, increases the geographical size of an urban area which reduces the availability of agricultural land, putting pressure on food security e.g. Shanghai
• Whilst much of the food comes from rural areas as shown in Fig. 9, if populations migrate to cities, there may be fewer people to work the land. This could compromise food security in both areas
• Volume of migrants to particular city areas can improve food security due to the pressure on government to supply / import food.
• Migration improves food security as remittances can ensure populations have access to food for consumption
• Shifting flows of people could be acknowledged as part of a sustainable food system
• Migrant populations in marginal city areas may want / need to provide their own food supplies and become urban gardeners therefore improving their food supplies e.g. sack gardening in Nairobi, Kenya
• FAO encourages sustainable rural development with changes in food production to ensure food security and rural livelihoods. Therefore the volume of migrants could be impacted.
• Inequalities in cities and the uneven distribution of resources (food) so poorer families will have less to spend on food, thus reducing their food security e.g. Study in New York found 1.4 million people were food insecure between 2013-2015 due to the price of food. There was a 64% increase in the number of immigrants accessing food supplies.
50

H081/02 Mark Scheme June 2018
Question Answer Marks Guidance (b) Examine how food security can be negatively affected
by landscape systems. Level 3 (6-8 marks) Demonstrates thorough knowledge and understanding of food security and landscape systems (AO1). Demonstrates thorough application of knowledge and understanding to provide a clear and developed analysis that shows accuracy of how food security can be negatively affected by landscape systems (AO2). There must be well-developed ideas of the effect of landscape systems on food security. There are clear attempts to make synoptic links between content from different parts of the course of study. Level 2 (3-5 marks) Demonstrates reasonable knowledge and understanding of food security and landscape systems (AO1). Demonstrates reasonable application of knowledge and understanding to provide a sound analysis that shows some accuracy of how food security can be negatively affected by landscape systems (AO2). There must be developed ideas of the effect of landscape systems on food security. There are some attempts to make synoptic links between content from different parts of the course of study but these are not always relevant. Level 1 (1-2 marks) Demonstrates basic knowledge and understanding of food security and landscape systems (AO1).
8
Indicative Content AO1 – 4 marks Knowledge and understanding of food security and landscape systems could potentially include:
• knowledge + understanding of landscape systems will focus on one of coastal, glaciated or dryland landscape systems linked to:
o climate: temperature – weathering processes; optimum temperatures for crop and livestock growth;
o water – weathering + erosional processes (including ice); water needs of plants and animals
o relief: altitude, slope angle and aspect influence climatic factors; altitude + aspect influence micro-climate; slope angle
• Food security is linked to physical conditions required for growing food including, air, climate, soil and water and is affected by geology, soil, length of growing season
• Food security is a dynamic status and is dependent on the physical factors associated with landscape systems, some of which are unpredictable.
AO2 – 4 marks Application of knowledge and understanding to analyse how food security can be negatively affected by landscape systems could potentially include:
• Some coastal areas have higher rainfall and cooler conditions which may prevent some crops growing.
• Coastal areas are subject to sea level rise through climate change hence may suffer reduced food security over time.
51

H081/02 Mark Scheme June 2018
Question Answer Marks Guidance Demonstrates basic application of knowledge and understanding to provide a simple analysis that shows limited accuracy of how food security can be negatively affected by landscape systems (AO2). This will be shown by including simple ideas of the effect of landscape systems on food security. There are limited attempts to make synoptic links between content from different parts of the course of study. 0 marks No response worthy of credit.
• Drylands tend to support little crop growth; farmers have had to adapt techniques over time to be able to harvest crops in marginal areas (such as using diguettes to collect water and prevent soil erosion).
• Food security in dryland landscape systems can be improved with irrigation (California) but on a large scale this requires significant economic investment.
• Glacial areas have rich fluvioglacial valley deposits which can be prevented from providing fertile farm land if dammed.
• Glacial areas can also be cold (at higher altitude) for some or all the year, so crop yield might be low.
• Fast moving landscapes (eg coastal, where erosion and flooding may occur) may be more susceptible to quick changes in food security than others.
10 (a) With reference to Figure 10, suggest how tectonically active areas are important in influencing the representation of place. Level 3 (6-8 marks) Demonstrates thorough knowledge and understanding of tectonically active areas and the representation of place. (AO1). Demonstrates thorough application of knowledge and understanding to provide a clear and developed interpretation that shows accuracy of how tectonically active areas are important in influencing the representation of place. (AO2). This will be shown by including well-developed ideas linking resource evidence on tectonically active areas and the representation of place.
8
Indicative Content AO1 – 4 marks Knowledge and understanding of tectonically active areas and the representation of place could potentially include:
• tectonically active areas can include both volcano (as in the resource) and earthquake events
• tectonically active areas are clearly defined across the globe
• ways of representing a place can be categorised as o either formal – census, geospatial data o informal – wide diversity of media (television
/ film / music / art / photography / literature / graffiti / blogs) offer representations of a place
52

H081/02 Mark Scheme June 2018
Question Answer Marks Guidance There are clear attempts to make synoptic links between content from different parts of the course of study.
Level 2 (3-5 marks) Demonstrates reasonable knowledge and understanding of tectonically active areas and the representation of place. (AO1).
Demonstrates reasonable application of knowledge and understanding to provide a sound interpretation that shows some accuracy of how tectonically active areas are important in influencing the representation of place. (AO2).
This will be shown by including developed ideas linking resource evidence on tectonically active areas and the representation of place.
There are some attempts to make synoptic links between content from different parts of the course of study but these are not always relevant.
Level 1 (1-2 marks) Demonstrates basic knowledge and understanding of tectonically active areas and the representation of place. (AO1).
Demonstrates basic application of knowledge and understanding to provide a simple interpretation that shows limited accuracy of how tectonically active areas are important in influencing the representation of place. (AO2).
There will be simple ideas linking resource evidence on tectonically active areas and the representation of place.
There are limited attempts to make synoptic links between content from different parts of the course of study.
0 marks No response worthy of credit.
• Representation of place can change over time, both via the medium of representation but also via the stakeholders.
AO2 – 4 marks Application of knowledge and understanding to interpret how tectonically active areas are important in influencing the representation of place could potentially include:
• Stakeholders in tectonically actives areas want to represent the place as ‘safe’ to attract people to live and to visit
• The resource represents how people still can choose to live in areas with tectonic hazards
• Many tectonically active areas (e.g. Tokyo) are densely populated, so it is important to ensure o Buildings are safe o The representation of place through national
and international media makes that clear, and
o Spreads information out to people in the event of an earthquake.
• Areas of tectonic activity, such as Etna and Vesuvius, are located in areas of high tourism and economic value, so it might be important to represent these in such a way that the tectonic risk is not the overarching theme.
• Social media and the internet can show a volcano such as that in the resource to be dangerous and frightening whilst erupting, but placid and safe when not.
53

H081/02 Mark Scheme June 2018
Question Answer Marks Guidance (b) Examine how responses to tectonic hazards might be
influenced by landscape systems. Level 3 (6-8 marks) Demonstrates thorough knowledge and understanding of landscape systems and responses to tectonic hazards (AO1). Demonstrates thorough application of knowledge and understanding to provide a clear and developed analysis that shows accuracy of how responses to tectonic hazards might be influenced by landscape systems (AO2). There must be well-developed ideas of how responses to tectonic hazards are influenced by landscape systems. There are clear attempts to make synoptic links between content from different parts of the course of study. Level 2 (3-5 marks) Demonstrates reasonable knowledge and understanding of landscape systems and responses to tectonic hazards (AO1). Demonstrates reasonable application of knowledge and understanding to provide a sound analysis that shows some accuracy of how responses to tectonic hazards might be influenced by landscape systems (AO2). There must be developed ideas of how responses to tectonic hazards are influenced by landscape systems. There are some attempts to make synoptic links between content from different parts of the course of study but these are not always relevant.
8
Indicative Content AO1 – 4 marks Knowledge and understanding of responses to tectonic hazards and landscape systems could potentially include:
• knowledge + understanding of landscape systems will focus on one of coastal, glaciated or dryland o Coastal – threat of tsunamis after an
earthquake. o Glaciated – likely to be a cold, mountainous
area which may be difficult to access and have challenges such as avalanches and rock falls following the destabilisation of an earthquake.
o Drylands – existing harsh conditions make it harder for rescuers to operate with damaged infrastructure.
• Responses to tectonic hazards will vary to some extent with hazard e.g. spraying lava to cool, solidify and stop its flow after a volcano, moving people inland to higher ground when there is a tsunami.
• Many responses to hazards will be similar such as rescue and emergency relief following disruption of infrastructure, homelessness and death
AO2 – 4 marks Application of knowledge and understanding to analyse how responses to tectonic hazards might be influenced by landscape systems could potentially include:
• Drylands are likely to be more susceptible to a breakdown in water infrastructure and will require fresh water as a priority in response to a tectonic hazard such as a disruptive earthquake.
54

H081/02 Mark Scheme June 2018
Question Answer Marks Guidance Level 1 (1-2 marks) Demonstrates basic knowledge and understanding of landscape systems and responses to tectonic hazards (AO1). Demonstrates basic application of knowledge and understanding to provide a simple analysis that shows limited accuracy of how responses to tectonic hazards might be influenced by landscape systems (AO2). This will be shown by including simple ideas of how responses to tectonic hazards are influenced by landscape systems. There are limited attempts to make synoptic links between content from different parts of the course of study. 0 marks No response worthy of credit.
• Coastal areas will have the added threat of tsunamis and the way that this will influence responses to a tectonic hazard may be to interrupt rescue work
• Glacial landscapes will have the additional challenge of low temperatures and possible meltwater from lava contact with ice to contend with for example in Iceland with the additional risk of flooding.
• Landscape could make access difficult for rescue effort to reach the epicentre or volcanic hazard.
• Some landscapes might require specialist knowledge or equipment to access and operate within the area.
11* ‘There is strong evidence that the world has warmed since the late-nineteenth century.’ To what extent is this true? AO1 Level 4 (8-10 marks) Demonstrates comprehensive knowledge and understanding of evidence that the world has warmed since the late nineteenth century. Level 3 (5–7 marks) Demonstrates thorough knowledge and understanding of evidence that the world has warmed since the late-nineteenth century. Level 2 (3-4 marks) Demonstrates reasonable knowledge and understanding of evidence that the world has warmed since the late-nineteenth century.
20 AO1 x10 AO2 x10
Indicative content AO1 – 10 marks Knowledge and understanding of evidence that the world has warmed since the late nineteenth century could potentially include:
• Consistent rise in global land surface and atmospheric temperatures. Many facts and figures available to support this e.g. 1°C rise on average land temperatures recorded in 2014, which was also the 38th consecutive year recording above average annual global temperatures.
• Rate of increase seems to be accelerating. 9 out of 10 of the warmest years on record between 2001 and 2011.
• Increases in ocean surface temperatures recorded. UK waters have increased 0.7°C in the past 30 years.
55

H081/02 Mark Scheme June 2018
Question Answer Marks Guidance Level 1 (1–2 marks) Demonstrates basic knowledge and understanding of evidence that the world has warmed since the late-nineteenth century. 0 marks - No response worthy of credit. AO2 Level 4 (8–10 marks) Demonstrates comprehensive application of knowledge and understanding to provide a clear, developed and convincing analysis that is fully accurate of evidence of climate change. Higher level answers should address the evidence of more sceptical views. Demonstrates comprehensive application of knowledge and understanding to provide a detailed and substantiated evaluation that offers secure judgements leading to rational conclusions that are evidence based as to the extent to which it is true that there is strong evidence that the world has warmed since the late-nineteenth century. Level 3 (5–7 marks) Demonstrates thorough application of knowledge and understanding to provide a clear and developed analysis that shows accuracy of evidence of climate change. Demonstrates thorough application of knowledge and understanding to provide a detailed evaluation that offers generally secure judgements, with some link between rational conclusions and evidence as to the extent to which it is true that there is strong evidence that the world has warmed since the late-nineteenth century.
• Shrinking of valley glaciers and ice sheets – today 98% of the world’s valley glaciers are retreating e.g. Alps, Andes. Greenland and Antarctic ice sheets are shrinking, 1/5 of Antarctic sea ice melted 1950-2000.
• Rising sea levels – melting of ice and thermal expansion leading to sea level rise of 20cm 1900-2000.
• Increased atmospheric water vapour. For every 1°C increase in temperature rising levels of water vapour will double the effect.
• Decreasing snow cover and sea ice. Satellite images enable measurement of the decline of snow cover and sea ice extent.
• Ecological evidence – habitat change, change in migration patterns, relocating of species, impacts such as the progress of coral bleaching.
AO2 – 10 marks Application of knowledge and understanding to analyse and evaluate the extent to which it is true that there is strong evidence that the world has warmed since the late-nineteenth century could potentially include:
• To what extent is the data quoted accurate and reliable.
• Debate that climate records show predominantly that the world’s climate is ‘unstable’ and fluctuating rather than consistently warming.
• There are anomalies in the warming trend particularly in the 60s and 70s.
• The rate of change in global temperatures has not been totally constant e.g. cool periods of 1960-1970s.
56

H081/02 Mark Scheme June 2018
Question Answer Marks Guidance Level 2 (3–4 marks) Demonstrates reasonable application of knowledge and understanding to provide a sound analysis that shows some accuracy of evidence of climate change. Demonstrates reasonable application of knowledge and understanding to provide a sound evaluation that offers generalised judgements and conclusions, with limited use of evidence as to the extent to which it is true that there is strong evidence that the world has warmed since the late-nineteenth century. Level 1 (1–2 marks) Demonstrates basic application of knowledge and understanding to provide a simple analysis that shows limited accuracy of the evidence of climate change. Demonstrates basic application of knowledge and understanding to provide an un-supported evaluation that offers simple conclusions as to the extent to which it is true that there is strong evidence that the world has warmed since the late-nineteenth century. 0 marks No response worthy of credit. Quality of extended response Level 4 There is a well-developed line of reasoning which is clear and logically structured. The information presented is relevant and substantiated. Level 3 There is a line of reasoning presented with some structure. The information presented is in the most-part relevant and supported by some evidence.
• There is a question of scale and the location of recorded evidence. In some areas glaciers, have been recorded as advancing and data from the northern and southern hemisphere can be different e.g. cooling in the northern hemisphere 1946-75 but warming patterns in the southern hemisphere.
• There are different views on the ‘strength’ of the evidence e.g. IPCC, NGOs, national governments.
• The view that the atmosphere is extremely complex and often behaves in a fluctuating manner.
• The question of the reliability and accuracy of historical evidence that may be less accurate than new technologies e.g. satellites, radar and sonar.
• High level responses may differentiate further between medium and short term evidence e.g. over the past 6 decades and over the past 4 decades.
• Views that contradict climate change may include: land-based temperature recording stations vary in their data, some suggest an over reliance on computer modelling that is inaccurate, the sensitivity of the Earth’s atmosphere makes accurate prediction very difficult, some believe a modest amount of warming could be beneficial to human activities, some question the balance of the cost of implementing GGE targets and the potential gain of just 0.14°C reduction in temperature.
57

H081/02 Mark Scheme June 2018
Question Answer Marks Guidance Level 2 The information has some relevance and is presented with limited structure. The information is supported by limited evidence. Level 1 The information is basic and communicated in an unstructured way. The information is supported by limited evidence and the relationship to the evidence may not be clear.
12* Discuss the view that effective responses to climate change require more than international directives. AO1 Level 4 (8-10 marks) Demonstrates comprehensive knowledge and understanding of responses to climate change. Level 3 (5–7 marks) Demonstrates thorough knowledge and understanding of responses to climate change. Level 2 (3-4 marks) Demonstrates reasonable knowledge and understanding of responses to climate change. Level 1 (1–2 marks) Demonstrates basic knowledge and understanding of the responses to climate change. 0 marks No response worthy of credit.
20
Indicative content AO1 – 10 marks Knowledge and understanding of responses to climate change could potentially include:
• Scale is an important consideration and can extend from global to local.
• Global scale responses include for example: the role of the IPCC in shaping global policy.
• International directives such as Kyoto Protocol, Paris, Rio Earth Summit, Bali conference.
• National level – may refer to any named example. • Local or sub-national level – policy of local councils,
local schools, local interest groups. • Policies such as carbon trading and carbon credits –
a response which exists at a variety of scales. • Land use change – increases planting of grasslands
and afforestation. • Transport innovations for road and air transport. • Responses of NGOs such as met office, British
Antarctic Survey, Friends of the Earth. Some candidates may focus on mitigation and adaptation strategies to demonstrate their knowledge and understanding of responses to climate change.
58

H081/02 Mark Scheme June 2018
Question Answer Marks Guidance AO2 Level 4 (8–10 marks) Demonstrates comprehensive application of knowledge and understanding to provide a clear, developed and convincing analysis that is fully accurate of the effectiveness of responses to climate change.
Demonstrates comprehensive application of knowledge and understanding to provide a detailed and substantiated evaluation that offers secure judgements leading to rational conclusions that are evidence based as to whether effective responses to climate change require more than international directives.
Level 3 (5–7 marks) Demonstrates thorough application of knowledge and understanding to provide a clear and developed analysis that shows accuracy of the effectiveness of responses to climate change.
Demonstrates thorough application of knowledge and understanding to provide a detailed evaluation that offers generally secure judgements, with some link between rational conclusions and evidence as to whether effective responses to climate change require more than international directives.
Level 2 (3–4 marks) Demonstrates reasonable application of knowledge and understanding to provide a sound analysis that shows some accuracy of the effectiveness of responses to climate change.
Demonstrates reasonable application of knowledge and understanding to provide a sound evaluation that offers generalised judgements and conclusions, with limited use of evidence as to whether effective responses to climate change require more than international directives.
AO2 – 10 marks Application of knowledge and understanding to analyse and evaluate the view that the most effective responses to climate change require more than international directives could potentially include:
• A cost and benefit analysis of international directives – the expense, the complexity of reaching a consensus, agreements are often not fully ratified, countries fail to meet their individual targets with no real penalty raises the question of meaningful enforcement.
• A co-ordinated response at a range of scales is often called for.
• Carbon trading schemes have advantages and disadvantages – they may act as an incentive to develop new technologies which reduce carbon emissions, however, they are also complex and there are difficulties in accurately measuring a firm’s or country’s pollution.
• Climate change is a global problem and needs a global solution, therefore, international directives are key.
• International directives that are not fair and consistent may cause industrial development to shift from countries with tight controls on carbon emissions to those with less controls, therefore not addressing the problem – just shifting/concentrating it.
• Local engagement at the individual level is effective as it is lifestyle changes that can make an impact. Individuals evaluate the costs and benefits of decisions such as insulation, white goods with economy settings, renewable energy supplies.
59

H081/02 Mark Scheme June 2018
Question Answer Marks Guidance Level 1 (1–2 marks) Demonstrates basic application of knowledge and understanding to provide a simple analysis that shows limited accuracy of the effectiveness of responses to climate change. Demonstrates basic application of knowledge and understanding to provide an un-supported evaluation that offers simple conclusions as to whether effective responses to climate change require more than international directives. 0 marks No response worthy of credit. Quality of extended response Level 4 There is a well-developed line of reasoning which is clear and logically structured. The information presented is relevant and substantiated. Level 3 There is a line of reasoning presented with some structure. The information presented is in the most-part relevant and supported by some evidence. Level 2 The information has some relevance and is presented with limited structure. The information is supported by limited evidence. Level 1 The information is basic and communicated in an unstructured way. The information is supported by limited evidence and the relationship to the evidence may not be clear.
• Differences of opinion at the national level create obstacles to progress e.g. EDCs and LIDCs believing that it is ACs that have created the problem and that their development should not be held back as a result.
60

H081/02 Mark Scheme June 2018
Question Answer Marks Guidance 13* Evaluate the success of mitigation and response
strategies for a named noncommunicable disease. AO1 Level 4 (8-10 marks) Demonstrates comprehensive knowledge and understanding of mitigation and response strategies for a named noncommunicable disease. Level 3 (5–7 marks) Demonstrates thorough knowledge and understanding of mitigation and response strategies for a named noncommunicable disease. Level 2 (3-4 marks) Demonstrates reasonable knowledge and understanding of mitigation and response strategies for a named noncommunicable disease. Level 1 (1–2 marks) Demonstrates basic knowledge and understanding of the mitigation and response strategies for a named noncommunicable disease. 0 marks No response worthy of credit. AO2 Level 4 (8–10 marks) Demonstrates comprehensive application of knowledge and understanding to provide a clear, developed and convincing analysis that is fully accurate of mitigation and response strategies for a named noncommunicable disease.
20
Indicative content AO1 – 10 marks
• The answer will be dependent on the named disease and the country context; note the specification requires one noncommunicable disease at a country scale either an AC or EDC.
Knowledge and understanding of mitigation and response strategies for a named noncommunicable disease could potentially include:
• Noncommunicable diseases (non-infectious or non-contagious) include for example: cardio-vascular diseases, diabetes, different types of cancer, chronic respiratory disease, obesity. The response will depend on the named disease.
• Direct and indirect strategies used by governments and international agencies – research, drug development, direct government legislation, targets for diagnosis and treatment, investment in technology, screening programmes, campaigns aimed at prevention.
• Role of international organisations e.g. World Health Organisation and their strategies to mitigate and respond to noncommunicable diseases. WHO Global Action Plan for the prevention and control of NCDs 2013-2015 – has 9 targets.
• The role of NGOs and charities. • Lessening the risk and education on prevention is a
key mitigation response. • Responses by the pharmaceutical industry –
investment in treatment. • Response strategies often focus on the process of
ageing or lifestyle choices depending on the • disease.
61

H081/02 Mark Scheme June 2018
Question Answer Marks Guidance Demonstrates comprehensive application of knowledge and understanding to provide a detailed and substantiated evaluation that offers secure judgements leading to rational conclusions that are evidence based as to the success of mitigation and response strategies for a named noncommunicable disease.
Level 3 (5–7 marks) Demonstrates thorough application of knowledge and understanding to provide a clear and developed analysis that shows accuracy of mitigation and response strategies for a named noncommunicable disease.
Demonstrates thorough application of knowledge and understanding to provide a detailed evaluation that offers generally secure judgements, with some link between rational conclusions and evidence as to the success of mitigation and response strategies for a named noncommunicable disease. Level 2 (3–4 marks) Demonstrates reasonable application of knowledge and understanding to provide a sound analysis that shows some accuracy of mitigation and response strategies for a named noncommunicable disease.
Demonstrates reasonable application of knowledge and understanding to provide a sound evaluation that offers generalised judgements and conclusions, with limited use of evidence as to the success of mitigation and response strategies for a named noncommunicable disease. Level 1 (1–2 marks) Demonstrates basic application of knowledge and understanding to provide a simple analysis that shows limited accuracy of the mitigation and response strategies for a named noncommunicable disease.
AO2 – 10 marks Application of knowledge and understanding to analyse and evaluate the success of mitigation and response strategies for a named noncommunicable disease could potentially include:
• The outcome of the evaluation will depend on the chosen disease and the country context e.g. AC or EDC.
• To be successful a comprehensive approach works best which requires input from health, finance, education and planning departments.
• Success of detection, prevention and treatment can result from advancing technology, particularly for ACs.
• Direct intervention into screening programmes for detection can be very cost effective as it reduces the need for expensive treatments.
• The capacity for prevention and control is more limited in lower income countries, therefore success is related to economic factors and affordability of treatment.
• Mitigation success often requires a ‘whole-person’ view in which treatment, support, advice and rehab all combine. This is very costly and requires high levels of integrated planning throughout healthcare systems.
• Mitigation strategies can be successful when the link between noncommunicable disease and social determinants is taken into account e.g. the social context of those at risk from certain cancers or obesity.
• Solutions need to be culturally appropriate. • Not all mitigation and response strategies are cost
effective.
62

H081/02 Mark Scheme June 2018
Question Answer Marks Guidance Demonstrates basic application of knowledge and understanding to provide an un-supported evaluation that offers simple conclusions as to the success of mitigation and response strategies for a named noncommunicable disease. 0 marks No response worthy of credit. Quality of extended response Level 4 There is a well-developed line of reasoning which is clear and logically structured. The information presented is relevant and substantiated. Level 3 There is a line of reasoning presented with some structure. The information presented is in the most-part relevant and supported by some evidence. Level 2 The information has some relevance and is presented with limited structure. The information is supported by limited evidence. Level 1 The information is basic and communicated in an unstructured way. The information is supported by limited evidence and the relationship to the evidence may not be clear.
• For a focus on a communicable disease, marks for AO1 for knowledge and understanding up to a maximum of 5 marks, but not above bottom level in AO2.
63

H081/02 Mark Scheme June 2018
Question Answer Marks Guidance 14* Discuss the view that global mobility makes it more
difficult to respond to disease diffusion. AO1 Level 4 (8-10 marks) Demonstrates comprehensive knowledge and understanding of global mobility and disease diffusion. Level 3 (5–7 marks) Demonstrates thorough knowledge and understanding of global mobility and disease diffusion. Level 2 (3-4 marks) Demonstrates reasonable knowledge and understanding of global mobility and disease diffusion. Level 1 (1–2 marks) Demonstrates basic knowledge and understanding of global mobility and disease diffusion. 0 marks No response worthy of credit. AO2 Level 4 (8–10 marks) Demonstrates comprehensive application of knowledge and understanding to provide a clear, developed and convincing analysis that is fully accurate of the role of global mobility in responses to disease diffusion. Demonstrates comprehensive application of knowledge and understanding to provide a detailed and substantiated evaluation that offers secure judgements leading to rational conclusions that are evidence based as to whether global mobility makes it more difficult to respond to disease diffusion.
20
Indicative content AO1 – 10 marks Knowledge and understanding of global mobility and disease diffusion could potentially include:
• Disease diffusion is the spread of disease from its source into new areas.
• Global mobility of people linked to the globalisation process and international travel can lead to more widespread and rapid disease diffusion.
• Increased personal mobility due to increased affluence, (eg increased car ownership/infrastructure development and travel on a larger scale than ever before), involves more people and from a wider range of countries.
• Increased personal mobility allows the spread of disease at an intercontinental scale e.g. Ebola to UK/Europe and Zika virus to USA/between North and South America.
• Increased global mobility also allows response to disease outbreaks in a number of global locations.
• Reference to the Hagerstrand model of disease diffusion may be made.
AO2 – 10 marks Application of knowledge and understanding to analyse and evaluate the view that global mobility makes it more difficult to respond to disease diffusion could potentially include:
• Disease diffusion occurs when a disease is transmitted to a new location. Responses to disease diffusion can include; border closures, travel bans or management of methods of transmission.
• High levels of personal global mobility have caused
the diffusion of disease to be more widespread and thereby potentially more difficult to contain.
64

H081/02 Mark Scheme June 2018
Question Answer Marks Guidance Level 3 (5–7 marks) Demonstrates thorough application of knowledge and understanding to provide a clear and developed analysis that shows accuracy of the role of global mobility in responses to disease diffusion. Demonstrates thorough application of knowledge and understanding to provide a detailed evaluation that offers generally secure judgements, with some link between rational conclusions and evidence as to whether global mobility makes it more difficult to respond to disease diffusion. Level 2 (3–4 marks) Demonstrates reasonable application of knowledge and understanding to provide a sound analysis that shows some accuracy of the role of global mobility in responses to disease diffusion. Demonstrates reasonable application of knowledge and understanding to provide a sound evaluation that offers generalised judgements and conclusions, with limited use of evidence as to whether global mobility makes it more difficult to respond to disease diffusion. Level 1 (1–2 marks) Demonstrates basic application of knowledge and understanding to provide a simple analysis that shows limited accuracy of the role of global mobility in responses to disease diffusion. Demonstrates basic application of knowledge and understanding to provide an un-supported evaluation that offers simple conclusions as to whether global mobility makes it more difficult to respond to disease diffusion.
• However, the increased mobility of people and goods also makes a widespread and rapid response more achievable.
• High levels of mobility also lead to diseases spreading faster. .
• It is not just global mobility that makes it difficult to respond to disease diffusion, other potential factors could be categorised into physical, social, economic and political factors:
• Social factors – physical contact, lack of access to education, poor literacy rates, overcrowding
• Political factors – national policies, international strategies which can limit/restrict travel in times of a disease outbreak or allow travel for trained medical staff and goods for treatment during an outbreak.
• Physical factors may make it difficult to respond to disease diffusion – relief, remoteness, natural hazards, lack of/disrupted internal communication (roads, landing strips)
• Economic factors – technological capabilities, polarisation of wealth, within and between countries and the restrictions of finance.
65

H081/02 Mark Scheme June 2018
Question Answer Marks Guidance 0 marks No response worthy of credit. Quality of extended response Level 4 There is a well-developed line of reasoning which is clear and logically structured. The information presented is relevant and substantiated. Level 3 There is a line of reasoning presented with some structure. The information presented is in the most-part relevant and supported by some evidence. Level 2 The information has some relevance and is presented with limited structure. The information is supported by limited evidence. Level 1 The information is basic and communicated in an unstructured way. The information is supported by limited evidence and the relationship to the evidence may not be clear.
66

H081/02 Mark Scheme June 2018
Question Answer Marks Guidance 15* To what extent could impacts of climate change on
high latitude oceans provide opportunities as well as threats?
AO1 Level 4 (8-10 marks) Demonstrates comprehensive knowledge and understanding of impacts of climate change on high latitude oceans.
Level 3 (5–7 marks) Demonstrates thorough knowledge and understanding of impacts of climate change on high latitude oceans.
Level 2 (3-4 marks) Demonstrates reasonable knowledge and understanding of impacts of climate change on high latitude oceans.
Level 1 (1–2 marks) Demonstrates basic knowledge and understanding of impacts of climate change on high latitude oceans.
0 marks No response worthy of credit.
AO2 Level 4 (8–10 marks) Demonstrates comprehensive application of knowledge and understanding to provide a clear, developed and convincing analysis that is fully accurate of the opportunities and threats provided by impacts of climate change on high latitude oceans.
Demonstrates comprehensive application of knowledge and understanding to provide a detailed and substantiated evaluation that offers secure judgements leading to rational conclusions that are evidence based as to the extent to which impacts of climate change on high latitude oceans provide opportunities and threats.
20
Indicative content AO1 – 10 marks Knowledge and understanding of impacts of climate change on high latitude oceans could potentially include:
• Marine life is affected by the increase in sea surface temperature.
• Climate change has led to acidification of oceans as increased levels of CO² in the atmosphere is dissolved in water, this has an impact on the ecosystems of high latitude oceans.
• A warming climate has led to melting of glaciers and ice sheets so raising sea levels and impacting on the extent of sea ice in high latitude oceans, particularly the Arctic.
• The feedback between ice cover and warming, that is, ice and snow reflect the sun’s energy, as the Arctic loses snow and ice, bare rock and water absorb more of the sun’s energy, leading to further melting and an irreversible cycle, sea levels rise further.
• Climate change has led to changes in the extent (decreasing) and the thickness (thinning) of sea ice, especially in the Arctic.
• Rising ocean temperatures impact on the local communities, ecosystems and biodiversity of the high latitude oceans.
• Higher level answers may refer to the evidence that the two poles represent different trends with Antarctic sea ice growing and Arctic sea ice shrinking.
AO2 – 10 marks Application of knowledge and understanding to analyse and evaluate the extent to which impacts of climate change on high latitude oceans provide opportunities as well as threats could potentially include:
67

H081/02 Mark Scheme June 2018
Question Answer Marks Guidance Level 3 (5–7 marks) Demonstrates thorough application of knowledge and understanding to provide a clear and developed analysis that shows accuracy of the opportunities and threats provided by impacts of climate change on high latitude oceans.
Demonstrates thorough application of knowledge and understanding to provide a detailed evaluation that offers generally secure judgements, with some link between rational conclusions and evidence as to the extent to which impacts of climate change on high latitude oceans provide opportunities and threats.
Level 2 (3–4 marks) Demonstrates reasonable application of knowledge and understanding to provide a sound analysis that shows some accuracy of the opportunities and threats provided by impacts of climate change on high latitude oceans.
Demonstrates reasonable application of knowledge and understanding to provide a sound evaluation that offers generalised judgements and conclusions, with limited use of evidence as to the extent to which impacts of climate change on high latitude oceans provide opportunities and threats.
Level 1 (1–2 marks) Demonstrates basic application of knowledge and understanding to provide a simple analysis that shows limited accuracy of the opportunities and threats provided by impacts of climate change on high latitude oceans.
Demonstrates basic application of knowledge and understanding to provide an un-supported evaluation that offers simple conclusions as to the extent to which impacts of climate change on high latitude oceans provide opportunities and threats.
• The potential for large scale threats to indigenous people of the Arctic as hunting and fishing is less reliable (changing ecosystems threaten populations of seals etc) and more dangerous.
• Wide ranging impacts on culture – with less ‘wild resources’ people turn to store-bought foods with health threats such as obesity.
• Some Arctic fisheries could disappear with social and economic impacts.
• High latitudes could become vulnerable to storms which impact and threaten coastal communities in the Arctic.
• A warming Arctic could halt the Gulf Stream which brings warmer water and weather to north-western Europe. This could threaten climate, then farming etc in these regions.
• There is the ongoing threat of an accelerating problem as positive feedback of less sea ice and less reflection of the sun’s energy leads to more melting.
• A high-level threat to fishing – the Antarctic krill is sensitive to oceanic temperature and as krill is a food source for many other species the potential for a wider impact on food chains and food webs is great.
• There are opportunities as less sea ice opens up the commercial benefits for trade and shipping in the Arctic.
• Opportunities for increased numbers of some species e.g. cod and herring which favour warmer waters.
• Opportunities for energy and mineral exploitation as less sea ice means more accessibility.
68

H081/02 Mark Scheme June 2018
Question Answer Marks Guidance 0 marks No response worthy of credit. Quality of extended response Level 4 There is a well-developed line of reasoning which is clear and logically structured. The information presented is relevant and substantiated. Level 3 There is a line of reasoning presented with some structure. The information presented is in the most-part relevant and supported by some evidence. Level 2 The information has some relevance and is presented with limited structure. The information is supported by limited evidence. Level 1 The information is basic and communicated in an unstructured way. The information is supported by limited evidence and the relationship to the evidence may not be clear.
16* Assess the extent to which oceans have become locations of conflict. AO1 Level 4 (8-10 marks) Demonstrates comprehensive knowledge and understanding of the international nature of oceans. Level 3 (5–7 marks) Demonstrates thorough knowledge and understanding of the international nature of oceans.
20
Indicative content AO1 – 10 marks Knowledge and understanding of the international nature of oceans could potentially include:
• The concept of the global commons and shared resources.
• Concept of the tragedy of the commons where self-interest undermines the common good leading to the need for global governance.
69

H081/02 Mark Scheme June 2018
Question Answer Marks Guidance Level 2 (3-4 marks) Demonstrates reasonable knowledge and understanding of the international nature of oceans. Level 1 (1–2 marks) Demonstrates basic knowledge and understanding of how the international nature of oceans. 0 marks No response worthy of credit. AO2 Level 4 (8–10 marks) Demonstrates comprehensive application of knowledge and understanding to provide a clear, developed and convincing analysis that is fully accurate of how oceans have become locations of conflict. Demonstrates comprehensive application of knowledge and understanding to provide a detailed and substantiated evaluation that offers secure judgements leading to rational conclusions that are evidence based as to the extent to which oceans have become locations of conflict. Level 3 (5–7 marks) Demonstrates thorough application of knowledge and understanding to provide a clear and developed analysis that shows accuracy of how oceans have become locations of conflict. Demonstrates thorough application of knowledge and understanding to provide a detailed evaluation that offers generally secure judgements, with some link between rational conclusions and evidence as to the extent to which oceans have become locations of conflict.
• Oceans have a wealth of resources such as fish, minerals, energy resources.
• Oceans provide transport routes for trade, port access and flows of people.
• Oceans present areas of political and strategic importance e.g Naval strongholds – superpowers such as China and USA exerting their influence and power in the oceans.
AO2 – 10 marks Application of knowledge and understanding to analyse and evaluate the extent to which oceans have become locations of conflict could potentially include:
• As population increases and the demand for food, products and services increases, the Earth’s stock of physical resources will be depleted and the richness of oceanic resources will increasingly become a source of political and economic conflict.
• Issues of territorial waters for resources is a growing source of conflict e.g. Specific conflict examples may include disputes over oil reserves between Cameroon and Nigeria or Japan and Korea contesting island ownership.
• The oceans are simply so vast that conflict tends to be spatially concentrated e.g. South China Sea between China, Vietnam, Taiwan and the Philippines over fishing rights and shipping routes is an increasing concern. The US condemning the action of China has started a diplomatic crisis which could escalate further.
• Piracy off the coast of east Africa is a growing problem with goods vessels and also tourism being affected.
70

H081/02 Mark Scheme June 2018
Question Answer Marks Guidance Level 2 (3–4 marks) Demonstrates reasonable application of knowledge and understanding to provide a sound analysis that shows some accuracy of how oceans have become locations of conflict. Demonstrates reasonable application of knowledge and understanding to provide a sound evaluation that offers generalised judgements and conclusions, with limited use of evidence as to the extent to which oceans have become locations of conflict. Level 1 (1–2 marks) Demonstrates basic application of knowledge and understanding to provide a simple analysis that shows limited accuracy of how oceans have become locations of conflict. Demonstrates basic application of knowledge and understanding to provide an un-supported evaluation that offers simple conclusions as to the extent to which oceans have become locations of conflict. 0 marks No response worthy of credit. Quality of extended response Level 4 There is a well-developed line of reasoning which is clear and logically structured. The information presented is relevant and substantiated. Level 3 There is a line of reasoning presented with some structure. The information presented is in the most-part relevant and supported by some evidence.
• Growing potential for resource conflicts e.g. Spratly islands and Scarborough Shoal in the South China Sea are now being contested by six different countries including China, Vietnam, there is a concern that such is the level of conflict that it could escalate to armed conflict.
• Credit should be given for different types of conflict e.g. economic and political.
• Political/social conflict: use of oceans as escape routes to escape conflict e.g. refugees escaping war in East Africa, Syria, the Yemen and using the Mediterranean to cross to southern Europe.
• Economic conflict; the rights of trade routes and the direction and type of trade across oceans.
• The potential for political conflict e.g. The growth of China and its expansion of naval and military strongholds in the South China Sea. Conflict zones exist where countries dispute territorial and marine boundaries. Political conflict over exclusive economic zones (EEZs)
• The structure of the response may look at conflict over different oceanic resources: Navigation space; Mineral resources – sand, gravel, minerals; Living resources – fish; Energy resources – coal, oil, natural gas; Waste – conflict over where the waste is produced and where it ends up.
Key evaluative points • a large proportion of the oceans has no conflict • oceans are viewed as mutually beneficial e.g. trade
and cruise ship routes which operate unhindered, underwater cables linking countries and continents
71

H081/02 Mark Scheme June 2018
Question Answer Marks Guidance Level 2 The information has some relevance and is presented with limited structure. The information is supported by limited evidence.
Level 1 The information is basic and communicated in an unstructured way. The information is supported by limited evidence and the relationship to the evidence may not be clear.
17* To what extent are shocks to the food system the result of natural rather than human factors?
AO1 Level 4 (8-10 marks) Demonstrates comprehensive knowledge and understanding of the food system and shocks to it.
Level 3 (5–7 marks) Demonstrates thorough knowledge and understanding of the food system and shocks to it.
Level 2 (3-4 marks) Demonstrates reasonable knowledge and understanding of the food system and shocks to it.
Level 1 (1–2 marks) Demonstrates basic knowledge and understanding of the food system and shocks to it.
0 marks No response worthy of credit.
AO2 Level 4 (8–10 marks) Demonstrates comprehensive application of knowledge and understanding to provide a clear, developed and convincing analysis that is fully accurate of how natural and human factors result in shocks to the food system.
20
Indicative content AO1 – 10 marks Knowledge and understanding of the food system and shocks to it could potentially include:
• The food system as a broad term covering the production, processing, storage, distribution, access, consumption and waste disposal of food.
• Physical/natural shocks to the food system include: • Climatic events (which may or may not come under
the umbrella of climate change), such as wildfires, El-Nino, floods, storms and drought.
• Physical water scarcity • Tectonic hazards • Disease outbreaks in crops.
All events will affect supply of food and impact prices.
Human induced shocks to the food system such as: 1. Price crises 2. Economic water scarcity 3. Human induced transport and distribution issues
e.g. fuel strikes 4. Land use change leading to less food production
and a shortage of supply 5. Human impacts on biodiversity which may remove
species that prevent disease outbreaks in crops.
72

H081/02 Mark Scheme June 2018
Question Answer Marks Guidance Demonstrates comprehensive application of knowledge and understanding to provide a detailed and substantiated evaluation that offers secure judgements leading to rational conclusions that are evidence based as to the extent to which shocks to the food system the result of natural rather than human factors. Level 3 (5–7 marks) Demonstrates thorough application of knowledge and understanding to provide a clear and developed analysis that shows accuracy of how natural and human factors result in shocks to the food system. Demonstrates thorough application of knowledge and understanding to provide a detailed evaluation that offers generally secure judgements, with some link between rational conclusions and evidence as to the extent to which shocks to the food system the result of natural rather than human factors. Level 2 (3–4 marks) Demonstrates reasonable application of knowledge and understanding to provide a sound analysis that shows some accuracy of how natural and human factors result in shocks to the food system. Demonstrates reasonable application of knowledge and understanding to provide a sound evaluation that offers generalised judgements and conclusions, with limited use of evidence as to the extent to which shocks to the food system the result of natural rather than human factors. Level 1 (1–2 marks) Demonstrates basic application of knowledge and understanding to provide a simple analysis that shows limited accuracy of how natural and human factors result in shocks to the food system.
6. Political unrest e.g. war, civil unrest, leading to food shortages
7. Economic factors such as increased transport costs leading to distribution issues and potential shortages.
AO2 – 10 marks Application of knowledge and understanding to analyse and evaluate the extent to which shocks to the food system are the result of natural rather than human factors could potentially include:
• Sometimes shocks are the result of ‘purely’ human causes e.g. price fluctuations, land-use change and political unrest.
• Sometimes shocks are natural events which cannot be stopped e.g. tectonic activity, natural population explosion of pests/disease.
• Frequently the shock can be shown to have a combination of human and physical causes:
• Often an impact, be it natural or human induced, in one country can lead to a knock-on effect in another e.g. natural disaster and crop failure in country A leading to a shortage of supply due to higher demand in country. This can mean a combination of physical and human factors, natural disaster, pricing and distribution issues.
• Sometimes the same issue can result from a combination of natural and human factors e.g. water scarcity resulting from physical and economic stress.
• Physical factors which lead to food shocks such as climate change can be induced by human activity.
• Physical factors such as tectonic hazards which cause disruption to the production and distribution of food can be the result of a lack of mitigation by humans.
73

H081/02 Mark Scheme June 2018
Question Answer Marks Guidance Demonstrates basic application of knowledge and understanding to provide an un-supported evaluation that offers simple conclusions as to the extent to which shocks to the food system the result of natural rather than human factors. 0 marks No response worthy of credit. Quality of extended response Level 4 There is a well-developed line of reasoning which is clear and logically structured. The information presented is relevant and substantiated. Level 3 There is a line of reasoning presented with some structure. The information presented is in the most-part relevant and supported by some evidence. Level 2 The information has some relevance and is presented with limited structure. The information is supported by limited evidence. Level 1 The information is basic and communicated in an unstructured way. The information is supported by limited evidence and the relationship to the evidence may not be clear.
• It is difficult to measure the extent of the source of a food shock as the issues are often complex and interrelated, arising out of a range of human and physical factors.
• Food shocks affect countries across the development spectrum and the scale of the impact varies. A human induced problem may have a physical impact e.g. ACs contributing to climate change and bringing about climate variations which impact food production in LIDCs.
74

H081/02 Mark Scheme June 2018
Question Answer Marks Guidance 18* ‘International co-operation is essential to guarantee
future food security for all nations.’ Discuss.
AO1 Level 4 (8-10 marks) Demonstrates comprehensive knowledge and understanding of food security for all nations and international co-operation.
Level 3 (5–7 marks) Demonstrates thorough knowledge and understanding of food security for all nations and international co-operation.
Level 2 (3-4 marks) Demonstrates reasonable knowledge and understanding of food security for all nations and international co-operation.
Level 1 (1–2 marks) Demonstrates basic knowledge and understanding of food security for all nations and international co-operation.
0 marks No response worthy of credit.
AO2 Level 4 (8–10 marks) Demonstrates comprehensive application of knowledge and understanding to provide a clear, developed and convincing analysis that is fully accurate of how international co-operation could guarantee future food security.
Demonstrates comprehensive application of knowledge and understanding to provide a detailed and substantiated evaluation that offers secure judgements leading to rational conclusions that are evidence based as to whether international co-operation is essential to guarantee future food security.
20
Indicative content AO1 – 10 marks Knowledge and understanding of food security for all nations and international co-operation could potentially include: • The concept of food security is built on food access,
food affordability and food use • Food security - a spectrum from food-secure to
famine eg SE England compared with areas of South Sudan
• The pattern of food security is dynamic and varies both between and within countries
• Globalisation of the food industry means food security has international importance which can lead to international co-operation eg
1. Agricultural trading policies at the international level covering bilateral and multilateral trade deals.
2. The role of global organisations such as the World Trade Organisation and the Food and Agriculture Organisation of the UN.
3. The role of international aid where trade agreements have failed to achieve food security or where natural or human induced disasters have compromised food supplies.
4. International co-operation to share technological innovation in food production.
AO2 – 10 marks Application of knowledge and understanding to analyse and evaluate the extent to which international co-operation is essential to guarantee future food security could potentially include: • International organisations have varying levels of
success and are open to criticisms e.g. the WTO is mostly controlled by western nations and the rights
75

H081/02 Mark Scheme June 2018
Question Answer Marks Guidance Level 3 (5–7 marks) Demonstrates thorough application of knowledge and understanding to provide a clear and developed analysis that shows accuracy of how international co-operation could guarantee future food security. Demonstrates thorough application of knowledge and understanding to provide a detailed evaluation that offers generally secure judgements, with some link between rational conclusions and evidence as to whether international co-operation is essential to guarantee future food security. Level 2 (3–4 marks) Demonstrates reasonable application of knowledge and understanding to provide a sound analysis that shows some accuracy of how international co-operation could guarantee future food security. Demonstrates reasonable application of knowledge and understanding to provide a sound evaluation that offers generalised judgements and conclusions, with limited use of evidence as to whether international co-operation is essential to guarantee future food security. Level 1 (1–2 marks) Demonstrates basic application of knowledge and understanding to provide a simple analysis that shows limited accuracy of how international co-operation could guarantee future food security. Demonstrates basic application of knowledge and understanding to provide an un-supported evaluation that offers simple conclusions as to whether international co-operation is essential to guarantee future food security.
and views of poorer nations are not represented enough, some say that the WTO is not doing enough to achieve equitable food distribution.
• Some international agencies can work effectively with national governments e.g. the WFP.
• Many question the role and effectiveness of international food aid as it often reflects the interests of donor countries rather than the needs of poorer nations receiving the aid. Food aid can:
1. create a cycle of dependency and come with political ‘strings’ attached e.g. assurances of political support and its long-term success is questionable
2. be effective in restoring food security in the short term as a response to a natural disaster or humanitarian crisis.
• Trade in food is a critical component to ensure future food security and to distribute food. However, again the global pattern is dominated by Europe, USA and Asia.
• Some international food trade policies can result in food surpluses and depressed world prices that further marginalise poorer countries e.g. the EUs CAP in the 1980s.
Outside of international cooperation other key stakeholders will have an impact on any guarantee of future food security: • TNCs which often can be more powerful than
national governments in issues of food production and distribution.
• Agribusinesses they have a direct impact on food production and distribution but profit making incentives often affect decision making.
76

H081/02 Mark Scheme June 2018
Question Answer Marks Guidance 0 marks No response worthy of credit. Quality of extended response Level 4 There is a well-developed line of reasoning which is clear and logically structured. The information presented is relevant and substantiated. Level 3 There is a line of reasoning presented with some structure. The information presented is in the most-part relevant and supported by some evidence. Level 2 The information has some relevance and is presented with limited structure. The information is supported by limited evidence. Level 1 The information is basic and communicated in an unstructured way. The information is supported by limited evidence and the relationship to the evidence may not be clear.
• Food retailers – global supermarket chains have a high level of influence and the responsibility to provide affordable and accessible good quality food to the populations of the countries in which they operate.
• Fair trade organisations – have a significant role in supporting the interests of small scale producers on whom food security in many parts of the world depends.
Other ways to guarantee food security that candidates may include:
• Large-scale technological techniques down to small-
scale bottom up and other appropriate approaches • Evidence from case studies of two contrasting
places at different levels of development and the strategies and techniques that have been used to ensure or improve food security
19* To what extent are impacts of tectonic activity related to a country’s level of development? AO1 Level 4 (8-10 marks) Demonstrates comprehensive knowledge and understanding of the impacts of tectonic activity. Level 3 (5–7 marks) Demonstrates thorough knowledge and understanding of impacts of tectonic activity.
20
Indicative content AO1 – 10 marks Knowledge and understanding of impacts of tectonic activity could potentially include:
• Loss of life, injury. • Destruction of buildings and infrastructure. • Secondary impacts of fires, landslides, avalanches,
tsunamis. • Spread of disease
77
H081/02 Mark Scheme June 2018
Question Answer Marks Guidance Level 2 (3-4 marks) Demonstrates reasonable knowledge and understanding of impacts of tectonic activity. Level 1 (1–2 marks) Demonstrates basic knowledge and understanding of impacts of tectonic activity. 0 marks No response worthy of credit. AO2 Level 4 (8–10 marks) Demonstrates comprehensive application of knowledge and understanding to provide a clear, developed and convincing analysis that is fully accurate of how impacts of tectonic activity can be related to a country’s level of development. For credit at Level 4 candidates may differentiate between short and long term impacts plus the fact that poorer countries may cope in the short term but struggle with the long-term impacts. Demonstrates comprehensive application of knowledge and understanding to provide a detailed and substantiated evaluation that offers secure judgements leading to rational conclusions that are evidence based as to the extent to which impacts of tectonic activity are related to a country’s level of development. Level 3 (5–7 marks) Demonstrates thorough application of knowledge and understanding to provide a clear and developed analysis that shows accuracy of how impacts of tectonic activity can be related to a country’s level of development.
• Economic functioning disrupted – power, communications, stock markets, impact on a country’s finances due to the cost of rebuilding.
• Crime – looting. • Food supply issues due to crop destruction and food
distribution issues. • Destruction of natural habitats. • Psychological trauma of populations. • Displacement of people. • Damage to historical and cultural buildings. • Political instability. • Higher level responses which differentiate between
economic, physical, social, cultural and political impacts will be rewarded.
AO2 – 10 marks Much of the evaluation will depend on the chosen examples which can focus on earthquake or volcanic activity or both. The specification requires a comparison between two countries at contrasting levels of economic development.
Application of knowledge and understanding to analyse and evaluate the extent to which impacts of tectonic activity are related to a country’s level of development could potentially include:
• Level of development can affect the ability of a country to prepare for tectonic events – eg economic: building regulations, investment in infra structure, provision of emergency services.
• A country’s ability to react to and recover from tectonic events may also be affected by level of development with examples of a more rapid recovery in ACs.
78

H081/02 Mark Scheme June 2018
Question Answer Marks Guidance Demonstrates thorough application of knowledge and understanding to provide a detailed evaluation that offers generally secure judgements, with some link between rational conclusions and evidence as to the extent to which impacts of tectonic activity are related to a country’s level of development. Level 2 (3–4 marks) Demonstrates reasonable application of knowledge and understanding to provide a sound analysis that shows some accuracy of how impacts of tectonic activity can be related to a country’s level of development. Demonstrates reasonable application of knowledge and understanding to provide a sound evaluation that offers generalised judgements and conclusions, with limited use of evidence as to the extent to which impacts of tectonic activity are related to a country’s level of development. Level 1 (1–2 marks) Demonstrates basic application of knowledge and understanding to provide a simple analysis that shows limited accuracy of the how impacts of tectonic activity can be related to a country’s level of development. Demonstrates basic application of knowledge and understanding to provide an un-supported evaluation that offers simple conclusions as to the extent to which impacts of tectonic activity are related to a country’s level of development. 0 marks No response worthy of credit.
• It cannot be assumed that poor countries are more affected at every level as there are some good examples of the frequency of events and the local knowledge leading to some effective planning, prediction and coping strategies in LIDCs and EDCs.
• Analysis and evaluation of social, political and environmental:
1. Impacts may be social and related to a country’s economic development e.g. displacement of people – in LIDCs and EDCCs this may place more of a pressure on limited resources than in ACs.
2. Political impacts may be less severe in stable ACs where there is an assurance and confidence derived from economic stability.
3. In ACs there will be more resources and technology to deal with and recover from environmental impacts
• There are a range of other factors to which the impact of tectonic events can be related:
• Strength of the hazard, location of the epicentre, depth of focus, geology.
• Time of day. • Urban or rural focus. • An area of sparse or dense population.
79

H081/02 Mark Scheme June 2018
Question Answer Marks Guidance Quality of extended response Level 4 There is a well-developed line of reasoning which is clear and logically structured. The information presented is relevant and substantiated. Level 3 There is a line of reasoning presented with some structure. The information presented is in the most-part relevant and supported by some evidence. Level 2 The information has some relevance and is presented with limited structure. The information is supported by limited evidence. Level 1 The information is basic and communicated in an unstructured way. The information is supported by limited evidence and the relationship to the evidence may not be clear.
20* Assess the extent to which people’s ability to cope with tectonic hazards has changed over time. AO1 Level 4 (8-10 marks) Demonstrates comprehensive knowledge and understanding of people’s ability to cope with tectonic hazards. Level 3 (5–7 marks) Demonstrates thorough knowledge and understanding of people’s ability to cope with tectonic hazards.
20
Indicative content AO1 – 10 marks Knowledge and understanding of people’s ability to cope with tectonic hazards could potentially include:
• Definition of the concept of ‘coping’ i.e. to not be overwhelmed by a tectonic event.
• Reference to Parks model of disaster response divided into different time stages from hours to weeks to years.
80

H081/02 Mark Scheme June 2018
Question Answer Marks Guidance Level 2 (3-4 marks) Demonstrates reasonable knowledge and understanding of people’s ability to cope with tectonic hazards. Level 1 (1–2 marks) Demonstrates basic knowledge and understanding of the people’s ability to cope with tectonic hazards. 0 marks No response worthy of credit. AO2 Level 4 (8–10 marks) Demonstrates comprehensive application of knowledge and understanding to provide a clear, developed and convincing analysis that is fully accurate of how people’s ability to cope with tectonic hazards can change over time. Demonstrates comprehensive application of knowledge and understanding to provide a detailed and substantiated evaluation that offers secure judgements leading to rational conclusions that are evidence based as to the extent to which people’s ability to cope with tectonic hazards has changed over time. Level 3 (5–7 marks) Demonstrates thorough application of knowledge and understanding to provide a clear and developed analysis that shows accuracy of how people’s ability to cope with tectonic hazards can change over time. Demonstrates thorough application of knowledge and understanding to provide a detailed evaluation that offers generally secure judgements, with some link between rational conclusions and evidence as to the extent to which people’s ability to cope with tectonic hazards has changed over time.
Coping strategies include: • Modify the event – for volcanic eruptions – divert
lava, spray lava to cool and solidify it, drop concrete blocks to divert channels. Few options to modify an earthquake event.
• To cope with vulnerability – various methods of building design and techniques to improve building resilience.
• To enable people to cope at a personal level – education, community action, prediction and warning systems.
• Hazard mapping • Land-use zoning. • Insurance • Trained response teams. • Search and rescue strategies.
AO2 – 10 marks Application of knowledge and understanding to analyse and evaluate the extent to which people’s ability to cope with tectonic hazards has changed over time could potentially include:
• Time can be interpreted in the short/medium and long term.
• Frequency of tectonic activity cannot be influenced by humans
• Changes in the frequency and impacts of tectonic hazards over time
• The degree of risk posed by a hazard and the probability of the hazard event occurring (the disaster risk equation)
• People’s ability to cope can change with developments in technology that improve prediction and preparation.
81

H081/02 Mark Scheme June 2018
Question Answer Marks Guidance Level 2 (3–4 marks) Demonstrates reasonable application of knowledge and understanding to provide a sound analysis that shows some accuracy of how people’s ability to cope with tectonic hazards can change over time.
Demonstrates reasonable application of knowledge and understanding to provide a sound evaluation that offers generalised judgements and conclusions, with limited use of evidence as to the extent to which people’s ability to cope with tectonic hazards has changed over time.
Level 1 (1–2 marks) Demonstrates basic application of knowledge and understanding to provide a simple analysis that shows limited accuracy of how people’s ability to cope with tectonic hazards can change over time the.
Demonstrates basic application of knowledge and understanding to provide an un-supported evaluation that offers simple conclusions as to the extent to which people’s ability to cope with tectonic hazards has changed over time.
0 marks No response worthy of credit.
Quality of extended response Level 4 There is a well-developed line of reasoning which is clear and logically structured. The information presented is relevant and substantiated.
Level 3 There is a line of reasoning presented with some structure. The information presented is in the most-part relevant and supported by some evidence.
• As a country develops economically measures to help cope with tectonic events become more affordable, including technological developments.
• Over time scientists can build up more information on how particular volcanoes behave or the signs of an imminent eruption.
• Improvements over time in education and training increase people’s preparation,
• Short-term, immediately after an event people have a heightened awareness – coping ability is higher; medium/long term, particularly regarding infrequent volcanic or earthquake activity, people’s awareness and sensitivity may diminish – coping ability drops.
• Long term analysis of eruption behaviour has been very successful in informing planning for mitigation and response e.g. Italy.
Possible future strategies may include: • Governments need to evaluate effectiveness of
current strategies to draw lessons for the future. • Most geoscientists do not believe that there is a
realistic prospect of accurate prediction in the foreseeable future for tectonic events.
• In the long term a broader focus, potentially on the alleviation of poverty and land use planning may emerge as priorities to reduce the effects of earthquakes.
• Falling buildings are by far the greatest cause of casualties during earthquakes; it is essential that building design to withstand tectonic events continues to make advances in the future.
82

H081/02 Mark Scheme June 2018
Question Answer Marks Guidance Level 2 The information has some relevance and is presented with limited structure. The information is supported by limited evidence. Level 1 The information is basic and communicated in an unstructured way. The information is supported by limited evidence and the relationship to the evidence may not be clear.
83

H081/02 Mark Scheme June 2018
Assessment Objectives (AO) grid
Candidates answer either question 1, 2, 3, 4 or 5, either question 6, 7, 8, 9 or 10 and one of questions 11, 12, 13, 14, 15, 16, 17, 18, 19 or 20.
Question AO1 AO2 AO3 Marks
1, 2, 3, 4 or 5 (a)(i) 4 4 1, 2, 3, 4 or 5 (b) 3 3 6
1, 2, 3, 4 or 5 (c)(i) 4 4 1, 2, 3, 4 or 5 (c)(ii) 3 3 6
1, 2, 3, 4 or 5 (d) 6 6 12 6, 7, 8, 9 or 10 (a) 4 4 8 6, 7, 8, 9 or 10 (b) 4 4 8
11, 12, 13, 14, 15, 16, 17, 18, 19 or 20 10 10 20 Total 31 30 7 68
84

OCR (Oxford Cambridge and RSA Examinations) The Triangle Building Shaftesbury Road Cambridge CB2 8EA OCR Customer Contact Centre Education and Learning Telephone: 01223 553998 Facsimile: 01223 552627 Email: [email protected] www.ocr.org.uk For staff training purposes and as part of our quality assurance programme your call may be recorded or monitored
Oxford Cambridge and RSA Examinations is a Company Limited by Guarantee Registered in England Registered Office; The Triangle Building, Shaftesbury Road, Cambridge, CB2 8EA Registered Company Number: 3484466 OCR is an exempt Charity OCR (Oxford Cambridge and RSA Examinations) Head office Telephone: 01223 552552 Facsimile: 01223 552553 © OCR 2018