marine strategy implementation in finland
TRANSCRIPT

Instructions for use
Title MARINE STRATEGY IMPLEMENTATION IN FINLAND
Author(s) Laine, Anne
Citationフィンランド-日本 共同シンポジウムシリーズ : 北方圏の環境研究に関するシンポジウム2012(Joint Finnish-Japanese Symposium Series Northern Environmental Research Symposium 2012). 2012年9月10日-14日. オウル大学、オウランカ研究所, フィンランド.
Issue Date 2012-09-10
Doc URL http://hdl.handle.net/2115/51363
Type conference presentation
File Information 01_AnneLaine.pdf
Hokkaido University Collection of Scholarly and Academic Papers : HUSCAP

MARINE STRATEGY IMPLEMENTATION IN FINLAND
Anne Laine
21.1.2013 1 North Ostrobothnia

Baltic Sea - facts and features
Formed by the Ice Age, young sea
Unique brackish-water ecosystem in the north
Shallow, average depth ca 54 m
Hundreds of rivers on the catchment
Almost closed system
Retention time 30-50 years (total water mass)
85 million inhabitants in the catchment area; “the most
polluted sea in the world”
2
OULU

3
Land uplift – up to 9 mm per year
In 100 years 90 cm !
Flat profile > changing shoreline
Salinity

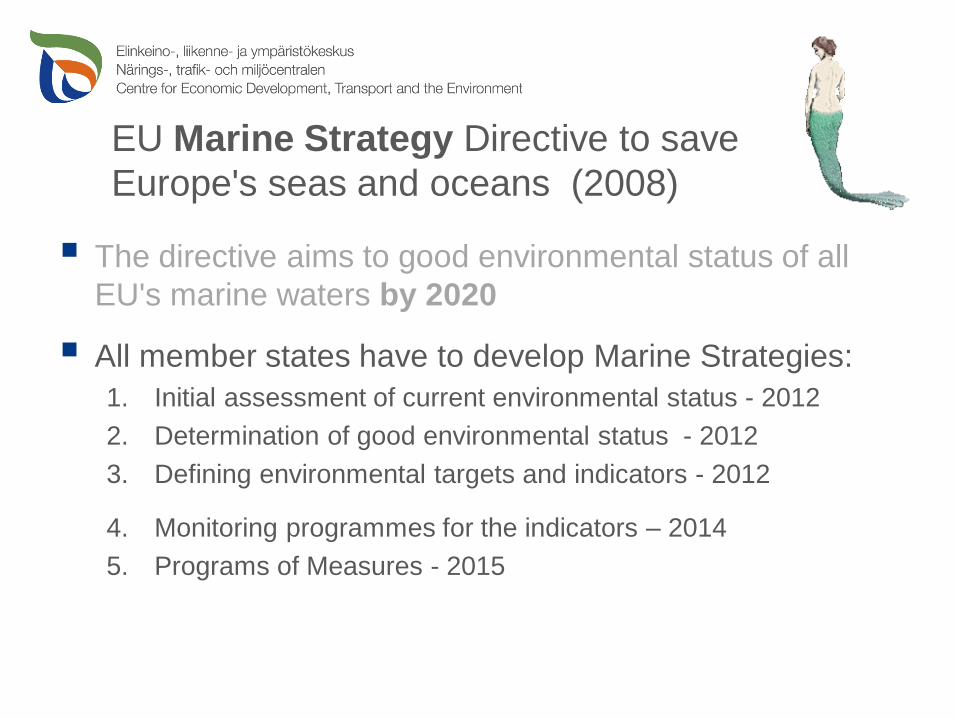
EU Marine Strategy Directive to save
Europe's seas and oceans (2008)
The directive aims to good environmental status of all
EU's marine waters by 2020
EU Marine Strategy Directive to save
Europe's seas and oceans (2008)
The directive aims to good environmental status of all
EU's marine waters by 2020
All member states have to develop Marine Strategies:
1. Initial assessment of current environmental status - 2012
2. Determination of good environmental status - 2012
3. Defining environmental targets and indicators - 2012
4. Monitoring programmes for the indicators – 2014
5. Programs of Measures - 2015

Utilizing existing programs and data
Conventions and programmes to harmonize policies
and actions in the neighbouring countries
Research programs and monitoring >> data
Baltic Sea Action Plan
The main threats are:
– eutrophication
– harmful substances
– chemical /oil spills
– invasive (i.e. alien) species
6

21.1.201301.01.200
8 ELY -tiekartta 7
A multitude of existing and
predicted human pressures on
the Finnish coastal area alone:
harbours, pipelines, dredging,
windmill parks, industry +
waste water, fish farming ….
Protected areas
on the coast
In addition,
human activities
on the catchment
& airborne
deposit

Sources for phosphorus loading (2008)
Agriculture 67,0 %
Rural Settlements 8,6 %
Forestry 5,6 %
Deposit
5,5 %
Municipalities
4,8 %
Pulp and Paper
Industry 3,9 %
Fish Farming
2,0 %
Fur Farming
1,1 %
Other Industry
0,7 %
Peat Production
0,7 %
0
100
200
300
400
500
600
700
800
1990
1991
1992
1993
1994
1995
1996
1997
1998
1999
2000
2001
2002
2003
2004
2005
2006
2007
2008
t/a
Industry Fish Farming Municipalities
Development of
phosphorus discharges
from point loading sources
Point loading: 13.2%
Diffuse loading: 81.2%

9
Long term
variation in
oxygen and
hydrogen
sulphide (H2S)
concentration in
one station
Lack of oxygen
near the bottom

10
Harmful substances
(HELCOM holistic assessment 2010).
high / good / moderate /poor / bad
A-chl (eutrophication)
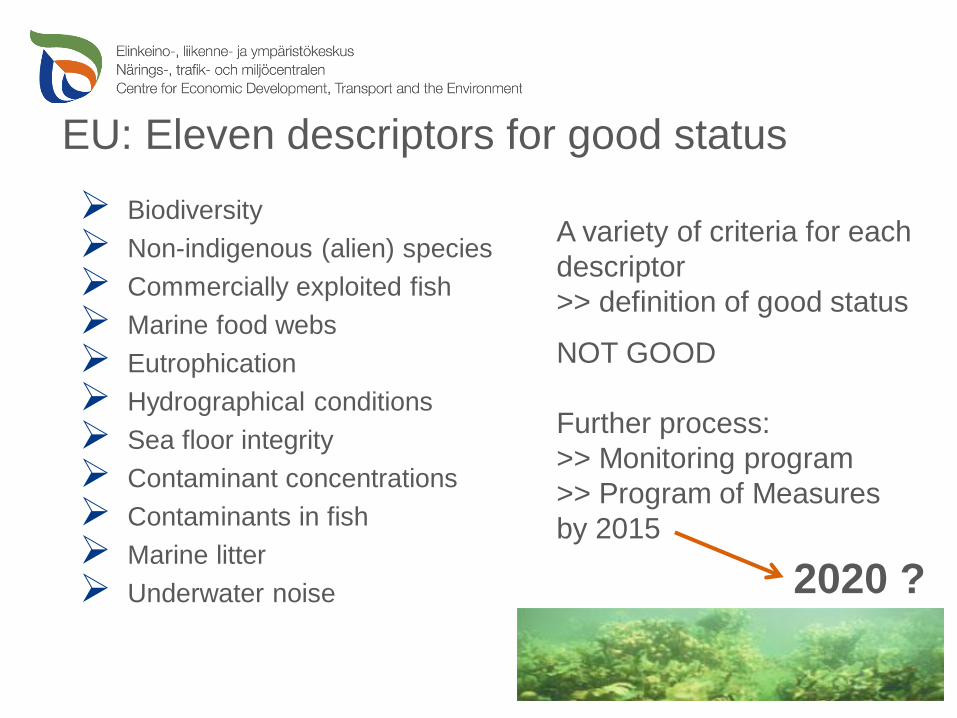
Biodiversity
Non-indigenous (alien) species
Commercially exploited fish
Marine food webs
Eutrophication
Hydrographical conditions
Sea floor integrity
Contaminant concentrations
Contaminants in fish
Marine litter
Underwater noise
) EU: Eleven descriptors for good status
A variety of criteria for each
descriptor
>> definition of good status
NOT GOOD
Further process:
>> Monitoring program
>> Program of Measures
by 2015
2020 ?

21.1.201301.01.200
8 ELY -tiekartta 12
Thank you