marine seismic-refl ection data acquired in the san francisco bay region ... · the san francisco...
TRANSCRIPT

63
AbstractBetween 1991 and 1997, the U.S. Geological Survey
conducted seismic-refl ection studies of earthquake faults in the San Francisco Bay region. The goal of these studies was to investigate the positions and structure of the region’s strike-slip faults, from shallow subsurface depths down through the entire crust, using various seismic-refl ection techniques with overlapping resolution and depths of pen-etration. The deep-crustal and midcrustal geometry of the San Andreas and Hayward Faults was the focus of the three-phase Bay Area Seismic Imaging eXperiment (BASIX) run in 1991, 1995, and 1997, which utilized large airgun arrays and widely distributed hydrophone receivers to obtain seis-mic-refl ection images of these faults to 22-km depth. A combination of higher-resolution seismic-refl ection methods were used to study the shallow crust. A small airgun mul-tichannel system was used to acquire seismic-refl ection pro-fi les with 1 to 2 km of penetration for detailed fault and shallow-structure studies. Very high resolution images of approximately the shallowest 25 m of the subsurface were collected along many of the multichannel tracklines, using a surface-towed, electromechanical (“boomer”) source and a vertically oriented transducer array. All seismic data were digitally recorded, processed, and archived. Positional data were acquired by using the Global Positioning System in either nondifferential (early 1990s) or differential (mid-1990s and late 1990s) mode.
IntroductionFrom the early 1970s through 1990, the U.S. Geological
Survey (USGS) routinely collected marine multichannel seis-
mic-refl ection data for use in regional geologic-framework studies. Most of this work was conventional, two-dimensional marine profi ling, using a 2.4-km multichannel hydrophone streamer and an array of 5 or 10 airguns totaling more than 32 L in volume. Since 1991, however, the focus of USGS marine research has shifted to shallow-water studies relevant to coastal processes, shallow aquifers, and geologic hazards. These programmatic changes necessitated the development of equipment and methods more suitable to shallow-water opera-tion and near-surface targets, including new high-resolution systems and novel uses of conventional seismic-refl ection sys-tems. In the San Francisco Bay region, long segments of the San Andreas and related earthquake faults lie submerged beneath shallow coastal and inland waters. Beginning in 1991, the USGS conducted a series of marine seismic-refl ection studies, using new systems and methods designed to image the region’s geologic structures and fault geometry, as sum-marized in table 1.
BASIX–1The fi rst Bay Area Seismic Imaging eXperiment
(BASIX–1) was the fi rst attempt to use marine seismic-refl ec-tion profi ling to defi ne the deep-crustal structure and fault geometry of the San Francisco Bay region. This experiment, which was designed to investigate a model proposed by Fur-long and others (1989) that the network of major regional earthquake faults are structurally linked by a horizontal fault beneath San Francisco Bay, was conducted in September 1991 by the USGS in collaboration with the University of California, Berkeley, Stanford University, Penn State Univer-sity, and Lawrence Berkeley Laboratory (McCarthy and Hart, 1993).
Although options for a large-scale seismic-refl ection study in the San Francisco Bay region are severely restricted by dense urban development, the bays and delta that dis-sect the region provide accessible pathways that cross the major faults. These inland waters were used for BASIX–1 and the followup experiments in 1995 and 1997, BASIX–2 and BASIX–3, respectively. The research vessel S.P. Lee was used as the main platform for BASIX–1 data acquisi-tion. A 12-airgun 96-L source array and a 120-channel digital seismic recording system were installed on the S.P. Lee. Because heavy ship traffi c, shallow water, and rap-idly changing tidal currents combined to make the use of a
Marine Seismic-Refl ection Data Acquired in the San Francisco Bay Region, 1991–97
By Patrick E. Hart, Jonathan R. Childs, Tom Parsons, Ray W. Sliter, Dennis M. Mann, and Jill McCarthy
CONTENTS
PageAbstract------------------------------------------------------------------------------ 63Introduction-------------------------------------------------------------------------- 63BASIX–1------------------------------------------------------------------------------ 63BASIX–2------------------------------------------------------------------------------ 66BASIX–3------------------------------------------------------------------------------ 71High-Resolution Data--------------------------------------------------------------- 72Conclusions-------------------------------------------------------------------------- 73Acknowledgments------------------------------------------------------------------ 73References Cited-------------------------------------------------------------------- 74
Marine Seismic-Refl ection Data Acquired in the San Francisco Bay Region, 1991-1997

June 1995G2–95–SF
Robert Gray 24-channel 150-m-long streamer; two 0.65-Lairguns; ~50–200-Hz bandwidth; 6–12-fold,with 3.12-m common-depth-point interval; 2-s record length; 2-ms sample interval.
Grid of high-quality multichannel profiles outsideGolden Gate imaging San Andreas and SanGregorio Fault zones to >1-km depth. A few fair-quality profiles in central San Francisco Bay andthe Sacramento River delta. Map: figure 8.
Mar. 1997J4–97–SF
David Johnston 24-channel 240-m-long streamer; 0.57./0.57-L dual-chamber airgun; ~50–200-Hzbandwidth; 6–12-fold, with 5.0-m common-depth-point interval; 2-s record length; 2-mssample interval.
A single southern San Francisco Bay profileacross the San Leandro Basin acquired to testimprovements made to the high-resolutionmultichannel seismic system. Map: figure 8; dataexample: figure 11.
64 Crustal Structure of the Coastal and Marine San Francisco Bay Region, California
Table 1.—Summary of marine seismic-refl ection data collected in the San Francisco Bay region, 1991–97.
DateCruise ID
Vessel Data Description Comments
Sept. 1991L1–91–NCBASIX–1
S.P. Lee60–120-channel data; radio telemetered fromsingle hydrophones buoyed at 100–200-mintervals along shot tracklines; 50-m shotinterval; 12-gun 96-L airgun array; source-receiver offsets, max 20 km; 16-s recordlength; 4-ms sample interval.
Stacked profiles and common-receiver gathersfrom San Francisco, San Pablo, and Suisun Bays,the Sacramento River delta, and 10 km out theGolden Gate. Low signal-to-noise ratio. Goodupper-crustal structural imaging in eastern part ofdelta. Deep (6–10 s) reflectivity observed incentral San Francisco Bay. Map: figure 1; dataexample: figures 2–4.
Sept. 1991L1–91–NCBASIX–1
S.P. LeeSingle-channel vertical incidence records ofthe BASIX–1 airgun shots acquired with atowed 50-m hydrophone streamer. 5-s recordlength; 4-ms sample interval.
Profiles acquired along most of the BASIX–1 shottracklines. Much less noise than in buoyed-hydrophone data. Map: figure 1.
Apr. 1995G1–95–SFBASIX–2
Robert Gray48-channel stationary streamer laid directlyon the bay floor. 12-gun 96-L airgun array;~200 m shot int. Radio trigger link. Source-receiver offsets, max 20 km; 16-s recordlength; 4-ms sample interval
Three streamer deployments in central andsouthern San Francisco Bay designed to betterdefine the deep reflectivity observed on BASIX–1data and to test the bottom cable recordingtechnique. Records show drastic reduction innoise relative to BASIX–1. Map: figure 5; data
Sept. 1997M1–97–SFBASIX–3
McGaw andAuriga
48-channel stationary streamer laid directlyon the bay floor. 12-gun 96-L airgun array;~200 m shot interval. Radio-trigger link.Source-receiver offsets, max 20 km; 16-srecord length; 4-ms sample interval.
Five streamer deployments made to extend theBASIX–2 data into San Pablo and Suisun Baysand to provide data acquired with the receiverarray perpendicular to the San Andreas andHayward Faults. Map: figure 5; data example:
High-resolution data available at URL http://geopubs.wr.usgs.gov/open-file/of00-494/
July 1993J8–93–SF
David Johnston24-channel 150-m-long streamer; two 0.65-Lairguns; ~50–200-Hz bandwidth; 6–12-fold,with 3.12-m common-depth-point interval;1–2-s record length; 2-ms sample interval.
Nine good-quality multichannel seismic profilesin southern San Francisco Bay imaging the SanLeandro Basin to 1 km depth. Map: figure 8.
May 1994J2–94–SF
David Johnston24-channel 150-m-long streamer; two 0.65-Lairguns; ~50–200-Hz bandwidth; 6–12-fold,with 3.12-m common-depth-point interval; 2-s record length; 2-ms sample interval.
Data acquired in four areas: southern SanFrancisco Bay, San Pablo Bay, Sacramento deltanear the town of Pittsburg, and a single east-westprofile out the Golden Gate. All good qualityexcept San Pablo lines. Map: figure 8; data
May 1994J2–94–SF
David JohnstonSurface-towed sled system; single channel;“boomer” source; inline cone receiver array;~1,000–4,000-Hz bandwidth; 200-ms recordlength; 0.0625-ms sample interval (16 kHz).
Very high resolution profiles acquiredconcurrently with most of the 1994 multichannelseismic profiles except the Golden Gate line.Good quality with 25-m penetration, except SanPablo data, which are obscured by shallow gas.Owing to recording problem, data have lowdynamic range. Map: figure 8; data example:
example: figure 6.
fig. 6.
example: figure 9.
figure 10.

65
Figure 1.—Gulf of the Farallones and San Francisco Bay region, Calif., showing locations of major faults and tracklines of high-resolution multichannel seismic-refl ection records acquired for this study. Shaded area, general area of the San Gregorio Basin as defi ned here; hachured area, the Bodega Basin of McCulloch (1987, 1989). Rectangle denotes area of fi gure 6.
conventional kilometers-long towed hydrophone streamer unfeasible, individual fl oating hydrophones with radio telemetry units were used as receivers. These receivers were anchored at 100- to 200-m intervals adjacent to the ship tracklines to record airgun blasts (fi g. 1) and transmit the data back to the shipboard recording system. Each day of the experiment, 60 to 120 receivers were deployed by using several small boats. The airguns were fi red at night along the receiver array and off end to distances of approximately 20 km. Over a 2-week period, 1,030 receiver stations were occupied, recording a total of 11,634 airgun blasts at a 50-m shot spacing. Telemetrically received data were recorded at a 4-ms sample interval to a 16-s record length. Receiver deployments began at the east limit of the experiment, near the town of Rio Vista, and progressed daily to the west, through Suisun Bay, San Pablo Bay, southward through San Francisco Bay and westward 10 km beyond the Golden
Gate. Airgun tracklines were constrained to the relatively deeper (>8 m) water of the dredged shipping channels.
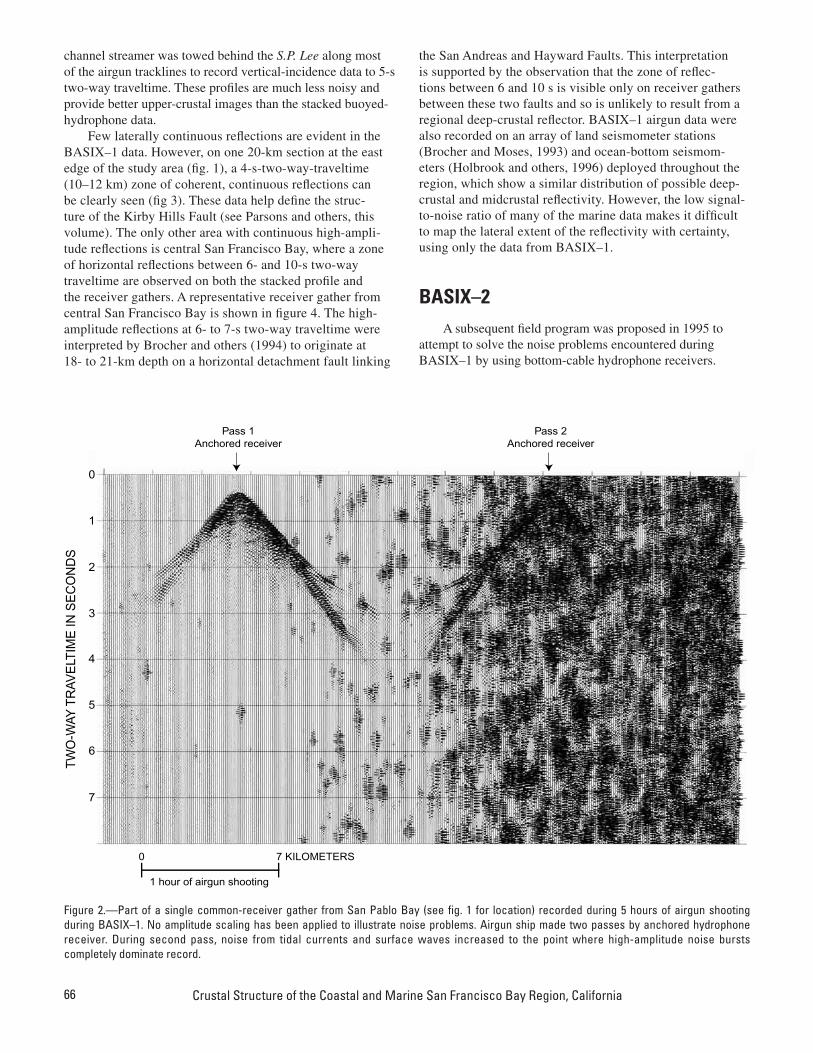
Data quality varies signifi cantly along the individual BASIX–1 tracklines (fi g. 2). Noise from tidal currents and strong winds dominates most of the far-offset data. Noise bursts, presumably from the hydrophones jostling in the choppy water, are common. Additional degradation of the far-offset data could be due to transmission noise in the radio signal from the hydrophone receivers to the recording ship. As a result, extensive editing of the data was necessary. After eliminating the noisiest data traces, a custom automatic noise-burst editor was applied, followed by conventional seismic-refl ection processing steps. Data were gained, band-pass-fi ltered at 14 to 44 Hz, and sorted to common-midpoint gathers; then, normal moveout velocities were picked and applied. Residual statics were calculated and applied, and the data were stacked at an average of 65-fold. A 50-m single-
Marine Seismic-Refl ection Data Acquired in the San Francisco Bay Region, 1991-1997
BASIX–1 receiver stations
BASIX–1 shotpoints
Cruise ID L1-91-NC
Fig.4
Fig.2
Fig.3
EXPLANATION
0 5 10 15 KILOMETERS
38°00'
38°15'
122°30' 122°15' 122°00' 121°45'
37°45'San
Francisco
RioVista
San Francisco
Bay
San PabloBay
SuisunBay
GoldenGate
66 Crustal Structure of the Coastal and Marine San Francisco Bay Region, California
channel streamer was towed behind the S.P. Lee along most of the airgun tracklines to record vertical-incidence data to 5-s two-way traveltime. These profi les are much less noisy and provide better upper-crustal images than the stacked buoyed-hydrophone data.
Few laterally continuous refl ections are evident in the BASIX–1 data. However, on one 20-km section at the east edge of the study area (fi g. 1), a 4-s-two-way-traveltime (10–12 km) zone of coherent, continuous refl ections can be clearly seen (fi g 3). These data help defi ne the struc-ture of the Kirby Hills Fault (see Parsons and others, this volume). The only other area with continuous high-ampli-tude refl ections is central San Francisco Bay, where a zone of horizontal refl ections between 6- and 10-s two-way traveltime are observed on both the stacked profi le and the receiver gathers. A representative receiver gather from central San Francisco Bay is shown in fi gure 4. The high-amplitude refl ections at 6- to 7-s two-way traveltime were interpreted by Brocher and others (1994) to originate at 18- to 21-km depth on a horizontal detachment fault linking
the San Andreas and Hayward Faults. This interpretation is supported by the observation that the zone of refl ec-tions between 6 and 10 s is visible only on receiver gathers between these two faults and so is unlikely to result from a regional deep-crustal refl ector. BASIX–1 airgun data were also recorded on an array of land seismometer stations (Brocher and Moses, 1993) and ocean-bottom seismom-eters (Holbrook and others, 1996) deployed throughout the region, which show a similar distribution of possible deep-crustal and midcrustal refl ectivity. However, the low signal-to-noise ratio of many of the marine data makes it diffi cult to map the lateral extent of the refl ectivity with certainty, using only the data from BASIX–1.
BASIX–2A subsequent fi eld program was proposed in 1995 to
attempt to solve the noise problems encountered during BASIX–1 by using bottom-cable hydrophone receivers.
TW
O-W
AYT
RAV
ELT
IME
INS
EC
ON
DS
0
1
2
3
4
5
6
7
Pass 1Anchored receiver
Pass 2Anchored receiver
7 KILOMETERS0
1 hour of airgun shooting
Figure 2.—Part of a single common-receiver gather from San Pablo Bay (see fi g. 1 for location) recorded during 5 hours of airgun shooting during BASIX–1. No amplitude scaling has been applied to illustrate noise problems. Airgun ship made two passes by anchored hydrophone receiver. During second pass, noise from tidal currents and surface waves increased to the point where high-amplitude noise bursts completely dominate record.

67
Deploying long arrays of hydrophones directly on the bay fl oor could enhance the signal-to-noise ratio of the deep-crustal refl ection data in several ways. Hydrophones enclosed within a fl exible cable lying in contact with the soft muddy bottom of the bay would not be as strongly affected by strong tidal currents and choppy waters as were the fl oating hydrophones used in 1991. In addition, linear arrays of hydro-phones would be used for each recorded channel, diminishing random noise in favor of coherent-refl ection energy arriving vertically from below. Finally, the stationary-receiver spread would be wired directly to the recording system, eliminating noise introduced by radio telemetry.
BASIX–2, which was conducted by the USGS in April 1995, was planned to be a relatively small pilot study of the bottom-cable recording technique that, if successful, would lead to a much larger program. The fi eld-operations budget was thus too small to allow the work to be contracted to a geophysical-data-acquisition company or to lease the special-ized equipment needed for bottom-cable recording. USGS personnel and equipment had to be used as much as pos-
sible. The USGS owns a 2.4-km-long oil-fi lled hydrophone streamer designed to be towed behind a recording ship during conventional open-ocean seismic profi ling. This streamer was modifi ed for use as a 48-channel bottom cable by taping 2,400 0.45-kg lead weights at 1-m intervals along its length. The weighted streamer and its storage reel was mounted on a 9- by 18-m leased barge, along with the multichannel record-ing system in a portable van. A 12-airgun array, deployment gantry, air compressor, and shot controller were installed on a second 9- by 21-m barge.
Three sites were chosen in central and southern San Francisco Bay for deployment of the weighted streamer (fi g. 5). These sites overlapped all the hydrophone-station loca-tions from BASIX–1 that recorded deep refl ectivity. Opera-tional considerations also infl uenced the locations of the deployment sites. To minimize risk of damage to the streamer during deployment or recovery, existing side-scan-sonar data were reviewed to ensure that the sites were fl at and that no debris or rocky outcrops existed along each 2.4-km-long deployment line. Because each deployment location was to be
Figure 3.—Approximately 65-fold stacked section of BASIX–1 data from west to east across the Kirby Hills Fault (see fi g. 1 for location). Extensive noise editing that was applied before stacking has caused gaps visible in upper 1 s of record.
TW
O-W
AYT
RA
VE
LTIM
EIN
SE
CO
ND
S
0
1
2
3
5 KILOMETERS0
W E
Marine Seismic-Refl ection Data Acquired in the San Francisco Bay Region, 1991-1997

68 Crustal Structure of the Coastal and Marine San Francisco Bay Region, California
0
1
2
3
4
5
6
7
8
9
TW
O-W
AYT
RA
VE
LTIM
EIN
SE
CO
ND
S
5 KILOMETERS0
Figure 4.—Common-receiver gather from central San Francisco Bay (see fi g. 1 for location) recorded during BASIX–1. Although this record has a low signal-to-noise, it shows a zone of coherent horizontal refl ectivity between 6- and 8-s two-way traveltime. One major goal of BASIX–2 and BASIX–3 was to determine origin of this refl ectivity.

69
occupied for 1 to 2 days, the deployment lines were chosen to be parallel to tidal currents so as to reduce the possibility that the streamer might roll a signifi cant distance if pushed perpendicularly by a strong current. The lines were in water depths greater than about 5 m to allow vessel access during deployment and recovery, and the shipping channel was avoided in case the streamer might fl oat up off the bottom in the turbulence of a passing ship and be damaged.
The fi eld operation for BASIX–2 was complex and fairly awkward. The procedure using equipment mounted on barges was the least expensive way to test bottom-cable recording in San Francisco Bay and was not intended to be a prototype for future work. The motor vessel Robert Gray was contracted to move the barges as needed for data acquisition, and to house all personnel during the experiment. The Robert Gray
towed the recording barge along the deployment lines as the streamer was rolled off its reel and laid onto the bay bottom in a straight line; the recording barge was then anchored at the end of the streamer. Airgun shooting was accomplished by the Robert Gray towing the shooting barge past the stationary streamer and to about 20 km beyond the ends of the deploy-ment lines as the airguns were fi red at a 90-s (approx 200 m) interval. A radio-trigger link synchronized the gun fi ring with the data recording. A total of 1,241 shots were recorded at the three deployment sites during 8 days of shooting.
BASIX–2 data quality is much higher than that of BASIX–1. High-amplitude refl ections are conspicuous between 6- and 10-s two-way traveltime on shot records from each of the deployments (fi g. 6). The BASIX–2 data suggest a highly refl ective lower crust beneath San Francisco Bay,
Figure 5.—San Francisco Bay region, showing locations of BASIX–2 (1995) and BASIX–3 (1997) airgun tracklines and hydrophone-streamer deploy-ments, BASIX–3 onland geophone-receiver stations, and data example from fi gure 6.
0 5 10 15 KILOMETERS
38°00'
122°30' 122°15' 122°00'
37°45'San
Francisco
San Francisco
Bay
San PabloBay
BASIX–2 streamer deployment
BASIX–2 air-gun shot locations
BASIX–3 air-gun shot locations
BASIX–3 streamer deployment
BASIX–3 land receivers
Cruise ID G1-95-SF
Cruise ID M1-97-SF
Fig. 6
EXPLANATION
Marine Seismic-Refl ection Data Acquired in the San Francisco Bay Region, 1991-1997

70 Crustal Structure of the Coastal and Marine San Francisco Bay Region, California
Figure 6.—Single-shot gathers from BASIX–2 and BASIX–3, showing records from airgun shots at similar locations (fi g. 5). Orientation of hydrophone streamer for BASIX–3 record is perpendicular to that of BASIX–2 record. Difference between the two records in moveout of refl ection event at 7-s two-way traveltime has been analyzed to determine that refl ection originates from steeply dipping San Andreas Fault plane.
0
1
2
3
4
5
6
7
8
9
TW
O-W
AYT
RA
VE
LTIM
EIN
SE
CO
ND
SBASIX 3 BASIX 2
SW NE NW SE
1 KILOMETERS0

71
in support of the model of a detachment-fault connection between the San Andreas and Hayward Faults. However, this interpretation is inconsistent with data acquired on the San Francisco peninsula in 1995 (Parsons, 1998), when large chemical-explosive sources were recorded on a spread of land seismometers deployed orthogonal to the San Andreas Fault. Those data showed conspicuous refl ections at 12- to 14-s two-way traveltime but not at 6- to 10-s two-way traveltime, as seen on the BASIX–2 data. Parsons (1998) concluded that the refl ections on land came from a 70º-SW.-dipping Hayward Fault between 18- and 24-km depth. A similar out-of-plane origin for the BASIX–2 refl ections was considered, but the acquisition geometry of BASIX–2 did not allow distinction between horizontal and dipping fault-plane refl ectors because the deployment lines and shooting tracklines nearly paralleled the region’s major faults (Parsons and Hart, 1999; see Parsons and others, this volume).
BASIX–3BASIX–3, which was completed in September 1997,
used the same airgun source array and weighted hydrophone
streamer as BASIX–2, although the fi eld operation was modi-fi ed to increase effi ciency and allow better access to new deployment lines. Two ships, instead of barges, were con-tracted to carry and deploy the equipment. The streamer reel and recording van were put on the research vessel McGaw, and the airgun system was installed on the motor vessel Auriga (fi g. 7). A small tugboat was used to help maneuver the McGaw during streamer deployment and recovery and to help set the four-point anchoring system that held the McGaw in place during acquisition.
Five streamer-deployment lines were occupied (fi g. 5), and a total of 2,751 airgun shots were recorded during 10 days of shooting. The southernmost deployment was just south of the San Francisco-Oakland Bay Bridge at a right angle to one of the 1995 BASIX–2 lines, to determine the orientation of the deep refl ection events observed in the BASIX–2 data by comparing the arrival times across these two orthogonal spreads (fi g. 6). Deployments were also made in San Pablo Bay and Suisun Bay to provide data east of and crossing the Hayward Fault. Analysis of the entire BASIX–2 and BASIX–3 data sets indicates that most, if not all, of the high-amplitude refl ectivity at >6-s two-way traveltime
Figure 7.—Motor vessel Auriga, with 12-airgun source array, working in San Pablo Bay (see fi gs. 1, 5) during BASIX–3.
Marine Seismic-Refl ection Data Acquired in the San Francisco Bay Region, 1991-1997

72 Crustal Structure of the Coastal and Marine San Francisco Bay Region, California
results from steeply dipping refl ectors interpreted to be fault planes (Parsons and Hart, 1999; see Parsons and others, this volume). The San Andreas and Hayward Faults are inter-preted to be vertical to about 10- to 12-km depth, then to dip toward each other at 60º and 70º, respectively, beneath San Francisco Bay to the base of the crust. The fault planes cannot be mapped with the BASIX data below the base of the crust at about 25-km depth.
High-Resolution DataWork began in 1993 on a multichannel seismic system
capable of imaging geologic structures to 1- to 2-km depth with a spatial resolution of 5 to 10 m in relatively shallow water environments (Childs and others, 2000). The main components of this system were a small airgun source, a short 24-channel streamer, and a compact PC-based digital recording instrument. The initial streamer was of solid-core construction with “thin fi lm” cylindrical hydrophones of poly-vinylidene fl uoride plastic, which is characterized by high sensitivity and a broadband (5–5,000 Hz) frequency response. The streamer was 150 m long, with a 6.25-m group interval and one hydrophone per channel. The source was a pair of 0.65-L airguns with “wave shape” kits installed in their chambers to suppress the bubble pulse. Navigation software developed by the USGS provided trackline following and position logging. Positioning was accomplished with a single Global Positioning System receiver with an absolute position accuracy of approximately ±30 m. Relative positions, from fi x to fi x, were accurate to within a few meters.
In July 1993, this system was installed on the USGS research vessel David Johnston for fi eld trials in southern San Francisco Bay. The major diffi culty encountered during the fi eld trials was proper ballasting of the streamer to allow it to “fl y” just below the water surface but not contact the bay fl oor when working in water as shallow as 2 m. Then, nine seismic-refl ection profi les were recorded (cruise J8–93–SF, fi g. 8). The shot-fi ring interval for these lines was either 6.25 or 12.5 m. Factors limiting the fi ring interval were air-com-pressor capacity and the shot-processing time required by the recording system. At speeds below 1.8 m/s, the 6.25-m fi re interval could be maintained; higher speeds (generally tidally controlled) necessitated the longer shot-fi ring interval. Result-ing common-midpoint data were either 12- or 6-fold, with a 3.125-m common-midpoint interval. Data were recorded at a 1-ms sample interval to a 2-s record length. The data-process-ing sequence used to create stacked profi les from the fi eld data is SEG–Y (Barry and others, 1974) input and resampling to 2 ms, trace edit, geometry assignment, bandpass fi lter (50–200 Hz), automatic gain control (100-ms window), water-bottom mute, frequency-wavenumber fi lter (50–200 Hz, ±2,400 m/s), spiking deconvolution, common-midpoint sort, stack-ing-velocity analysis, normal-moveout correction, stack, and SEG–Y output.
Data quality of the 1993 tests was high, allowing imag-ing of structure deeper than 1 km in places. On the basis of
this success, in May 1994, detailed surveys using the research vessel David Johnston were run over southern San Francisco Bay near San Bruno Shoal (Marlow and others, 1998), over the Kirby Hills Fault where it crosses the western part of the Sacramento River delta (see Parsons and others, this volume), and over the Hayward-to-Rodgers Creek Fault stepover in San Pablo Bay. A subsequent cruise was conducted in June 1995, using the motor vessel Robert Gray, over the offshore exten-sion of the San Andreas Fault system west of the Golden Gate (fi g. 8; table1; see Bruns and others, this volume). All data were processed using a sequence similar to that listed above. Dif-ferential GPS navigation used during the 1995 cruise improved absolute positional accuracy to approximately ±10 m.
In 1994, very high resolution refl ection profi les were acquired concurrently with the airgun data. The instrument used to acquire these profi les consisted of a source and a receiver mounted together on a 2-m-long catamaran sled towed behind and to the side of the survey vessel. The source was a wideband (500–4,500 Hz) electrodynamic “boomer” that generated a single positive-pressure transient of as much as approximately 218 dB referenced to 1 µPa at 1 m; the receiver was a line-in-cone hydrophone array oriented to max-imize vertical-incidence refl ected energy. Data were recorded digitally at 16-kHz sampling rate to a record length of 200 ms, at a repetition rate of 2 to 4 “pings” per second. Low power levels from the analog-signal conditioner resulted in recorded data with a relatively low dynamic range (<30 dB); however, a vertical resolution of >50 cm to a subbottom depth of ∼25 m and a lateral resolution of ∼1 m were achieved.
Part of a multichannel seismic profi le acquired in 1994 in the Sacramento River delta crossing the Kirby Hills Fault Zone is shown in fi gures 9 and 10. The steeply dipping near-surface sedimentary deposits are imaged at better than 10 times the multichannel seismic resolution by the very high resolution data. This combination of data-acquisition systems allows interpretations of the uppermost 1 or 2 km of crust to be tied to the shallowest subsurface. These data have been used in fault investigations of the Kirby Hills Fault zone (see Parsons and others, this volume) and southern San Francisco Bay (Marlow and others, 1996).
In March 1997, a single seismic profi le was recorded in southern San Francisco Bay during tests of changes made to refl ection profi ling system to improve the penetration and data signal-to-noise ratio. A new 240-m solid-core hydro-phone streamer and a dual-chamber generator-injector airgun were used. The streamer was of the same type as used pre-viously but featured a 10-m group interval (240-m overall active length) and three hydrophones per channel. The airgun consists of a 0.57-L “injector” chamber timed to discharge a short time (typically, 20–30 ms) after the 0.57-L “generator” chamber so as to suppress the bubble pulse and create an opti-mal signal. This gun was fi red as frequently as the air com-pressor would allow, typically at 10- to 12-s intervals. Stack fold therefore ranged from 4 to 12, depending on the vessel speed. A migrated version of this profi le is shown in fi gure 11 to demonstrate the data quality and resolution that are achiev-able with this system in shallow water.

73
Conclusions
Modeling and analysis of the BASIX data sets is continu-ing to refi ne the interpretation of the crustal structure in the San Francisco Bay region. Refraction data from arrays of land seismometers deployed during BASIX–3, and data from the eastern streamer deployments of BASIX–3, have not yet been studied in detail. Although much work remains to be completed, results from BASIX have given the best picture yet of the deeply buried segments of the San Francisco Bay region’s earthquake fault system.
The USGS high-resolution multichannel seismic and very high resolution systems have proved capable of acquiring high-quality seismic-refl ection profi les in the shallow water of San Francisco Bay. These data combine to provide a continu-ous image of subsurface geologic structure and fault geometry
that ties 5- to 10-m resolution and 1- to 2-km penetration with less than 1-m resolution in the uppermost few tens of meters.
The data described here are all available for download from the USGS Web site at URL http://walrus.wr.usgs.gov/reports/. Because of recent regulatory changes pertaining to the use of airgun sources within San Francisco Bay region waters (Childs and others, 1999), additional surveys of the type described here will probably not be undertaken.
AcknowledgmentsThe success of the USGS marine seismic programs in
the San Francisco Bay region during the 1990s is largely attributable to the technicians, engineers, and staff at the USGS marine facility in Redwood City, Calif., whose work before and during the often-diffi cult fi eld operations directly
Figure 8.—San Francisco Bay region, showing locations of tracklines for four high-resolution marine seismic-refl ection surveys completed from 1993 to 1997 and data examples in fi gures 9 through 11.
Figs. 9 and 10
Fig. 11
122°30'122°45' 122°15' 122°00' 121°45'
38°00'
38°15'
37°45'
37°30'
1995 Cruise ID G2-95-SF
1993 Cruise ID J8-93-SF
1994 Cruise ID J2-94-SF
1997 Cruise ID J4-97-SF
0 5 10 15 KILOMETERS
San PabloBay
SanFrancisco
EXPLANATION
Marine Seismic-Refl ection Data Acquired in the San Francisco Bay Region, 1991-1997

74 Crustal Structure of the Coastal and Marine San Francisco Bay Region, California
resulted in new data-acquisition capabilities and a compre-hensive regional data set collected with minimal time lost to technical problems. In particular, we thank Steve Wallace, Kevin O’Toole, Hal Williams, Walt Olson, Dave Hogg, Larry Kooker, Bill Robinson, Mike Boyle, Fred Payne, Sue Hunt, Gerry O’Brien, and Gordon Smith, the master of the research vessel David Johnston. We are grateful to Diane Minasian for her work in preparing all the maps and fi gures for this chap-ter.
References CitedBarry, K.M., Cavers, D.A., and Kneale, C.W., 1975, Recommended
standards for digital tape formats: Geophysics, v. 40, no. 2, p. 344–352.
Brocher, T.M., McCarthy, Jill., Hart, P.E., Holbrook, W.S., Furlong, K.P., McEvilly, T.V., Hole, J.A., and Klemperer, S.L., 1994, Seismic evidence for a possible lower-crustal detachment beneath San Francisco Bay, California: Science, v. 265, no. 5177, p. 1436–1439.
Brocher, T.M., and Moses, M.J., 1993, Onshore-offshore wide-angle seismic recordings of the San Francisco Bay Area seismic
imaging experiment (BASIX); the fi ve-day recorder data: U.S. Geological Survey Open-File Report 93–276, 89 p.
Childs, J.R., Hart, P.E., Sliter, R.W., Bruns, T.R., and Marlow, M.S., 2000, High-resolution marine seismic refl ection data from the San Francisco Bay area; 1993–1997: U.S. Geological Survey Open-File Report 00–494 [URL: http://geopubs.wr.usgs.gov/open-fi le/of00-494/].
Childs, J.R., Normark, W.R., and Fisher, M.A., 1999, Permit application and approval chronology for a small airgun survey offshore southern California, June 1999: U.S. Geological Survey Open-File Report 99–572 [URL: http://geopubs.wr.usgs.gov/open-fi le/of99-572/].
Furlong, K.P., Hugo, W.D., and Zandt, George, 1989, Geometry and evolution of the San Andreas fault zone in northern California: Journal of Geophysical Research, v. 94, no. B3, p. 3100–3110.
Holbrook, W.S., Brocher, T.M., ten Brink, U.S., and Hole, J.A., 1996, Crustal structure of a transform plate boundary, San Fran-cisco Bay and the central California continental margin: Journal of Geophysical Research, v. 101, no. B10, p. 22311–22334.
Marlow, M.S., Hart, P.E., Carlson, P.R., Childs, J.R., Mann, D.M., Anima, R.J., and Kayen, R.E., 1996, Misinterpretation of lateral acoustic variations on high-resolution seismic refl ection profi les as fault offsets of Holocene bay mud beneath the
TW
O-W
AYT
RA
VE
LTIM
EIN
SE
CO
ND
S
1 KILOMETER0 0.5
0.0
0.1
0.2
0.3
0.4
0.5
0.6
W E
Figure 10A Figure 10B
Figure 9.—Section of a high-resolution multichannel seismic profi le acquired in the Sacramento River delta crossing the Kirby Hills Fault zone (see fi g. 8 for location), showing approximately 500 m of penetration. Two rectangular boxes indicate coverage of coincident very high resolution data examples in fi gure 10.

75
TW
O-W
AYT
RA
VE
LTIM
EIN
MIL
LIS
EC
ON
DS
TW
O-W
AYT
RA
VE
LTIM
EIN
MIL
LIS
EC
ON
DS
0 50 100 METERS
15M
ET
ER
S10
50
A
B
20
30
40
50
20
30
40
50
Figure 10.—Two sections of a very high resolution seismic refl ection profi le acquired in 20 to 25 m of water in the Sacramento River delta near the Kirby Hills Fault (see fi g. 8 for location), showing a “zoomed in” image of two zones (A, B) outlined in fi gure 9. These data, which have more than 20 m of subbottom imaging with approximately 30 cm of vertical resolution, allow interpreta-tions to be extended to shallowest subsurface in much greater detail than is possible with multichannel seismic data alone.
Marine Seismic-Refl ection Data Acquired in the San Francisco Bay Region, 1991-1997

76 Crustal Structure of the Coastal and Marine San Francisco Bay Region, California
southern part of San Francisco Bay, California: Marine and Petroleum Geology, v. 13, no. 3, p. 341–348.
Marlow, M.S., Jachens, R.S., Hart, P.E., Carlson, P.R., Anima, R.J., and Childs, J.R, 1998, Development of San Leandro synform and neotectonics of the San Francisco Bay Block, California: Marine and Petroleum Geology, v. 16, no. 5, p. 431–442.
McCarthy, Jill, and Hart, P.E., 1993, Data report for the 1991 Bay Area seismic imaging experiment (BASIX): U.S. Geological Survey
Open-File Report, 93–301, 26 p.Parsons, Tom, 1998, Seismic-refl ection evidence that the Hayward
fault extends into the lower crust of the San Francisco Bay area, California: Seismological Society of America Bulletin, v. 88, no. 5, p. 1212–1223.
Parsons, Tom, and Hart, P.E., 1999, Dipping San Andreas and Hay-ward faults revealed beneath San Francisco Bay, California: Geology, v. 27, no. 9, p. 839–842.
Figure 11. Migrated multichannel seismic-refl ection profi le acquired in southern San Francisco Bay (see fi g. 8 for location). This airgun line shows approximately 1 km of penetration into folded sedimentary deposits of the San Leandro Basin.
0.1
0.2
0.3
0.4
0.5
0.6
0.7
0.8
0.9
TW
O-W
AYT
RA
VE
LTIM
EIN
SE
CO
ND
S
0 1 2 KILOMETERS
SW NESan Leandro Basin