marine eia study for seawater intake and marine outfall of...
TRANSCRIPT
Marine EIA Study for Seawater Intake and Marine Outfall of 5x660 MW Coal Based
Thermal Power Plant Village Bhadreswar, Taluka Mundra, Kutch
Submitted to
Kutchh Power Generation Limited
Prepared by
Cholamandalam MS Risk Services Limited
An ISO 9001: 2008 Certified Organization
A QCI Accredited EIA Consulting Organization Parry House 4th Floor, No:2, N.S.C Bose Road,
Chennai 600 001
Marine Environmental Impact Assessment Report of Kutchh Power Generation Limited, Bhadreswar & Wadala
Villages, Mundra Taluka, Kutchh District
Declaration from EIA Consultant Organization
Marine EIA Study for Seawater Intake and Marine Outfall of 5x660 MW
Coal Based Thermal Power Plant
Village Bhadreswar, Taluka Mundra, District Kutch, Gujarat State Project Proponent
Kutch Power Generation Limited
Marine EIA report has been prepared by Cholamandalam MS Risk Services Limited
(CMSRSL), is in line with the EIA Notification, 2006, seeking prior Environment and CRZ
Clearance from Ministry of Environment and Forest (MoEF), Govt of India.
The work has been undertaken in accordance with CMSRSL Quality Management System with
all reasonable skill, care and diligence within the terms of the contract with the client,
incorporating our General Terms & Conditions of Business and taking into account of the
resources devoted to it by agreement with the client.
We disclaim any responsibility to the client and others in respect of any matters outside the scope
of the above.
Further, the report is confidential to the client and the use of this report by unauthorized third
parties without written authorization from CMSRSL shall be at their own risk.
For and on behalf of Cholamandalam MS Risk Services Limited
Approved by: N V Subba Rao
Signed: Position: Chief Executive Officer Date: 22nd April 2013
DECLARATION BY EIA CONSULTANT

Marine Environmental Impact Assessment Report of Kutchh Power Generation Limited, Bhadreswar & Wadala
Villages, Mundra Taluka, Kutchh District
Details of Experts/Consultants Engaged for EIA Studies
S.No Name Role in the EIA Studies
1 Mr. V S Bhaskar
EIA Coordinator – Thermal Power Plants Functional Area Expert (FAE) – Meteorology, Air Quality Modeling and Prediction FAE –Water Pollution Monitoring, Prevention and
Control FAE – Noise and Vibration
2 Mr. D Ravishankar
Associate EIA Coordinator Functional Area Expert – Air Pollution Monitoring,
Prevention and Control FAE – Solid and Hazardous Waste Management
3 Mr. Vikrant A Kulkarni FAE -Ecology and Bio-diversity (EB)
4 Dr. Mangalam Balasubramaniam
FAE – Socio-Economic
5 Mr. C S Karthick AFAE – Socio-Economic
Environmental Monitoring Agency Engaged
A Marine Environment – Sea Water Quality, Sediment Quality
M/s. Ultra-Tech Environmental Consultancy and Laboratory, Thane
C Biological Sampling and Analysis M/s Murugappa Chettiar Research Centre, Taramani,
Chennai
Name Role Signature
Mr. N. V. Subba Rao Chief Executive Officer
Mr. V. S. Bhaskar EIA Coordinator
Mr. D. Ravi Shankar Associate EIA Coordinator
Marine Environmental Impact Assessment Report of Kutchh Power Generation Limited, Bhadreswar & Wadala
Villages, Mundra Taluka, Kutchh District
Cholamandalam MS Risk Services - 1 -
Abbreviations
ABC Abundance Biomass Comparison
ACWS Auxillary Cooling Water System
avg Average
BDL Below Detectable Limit
BOD Biological Oxygen Demand
CD Chart Datum
CMSRSL Cholamandalam Mitsui Sumitomo Risk Services Limited
CPCB Central Pollution Control Board
DO Dissolved Oxygen
EIA Environment Impact Assessment
EMC Environmental Management Cell
EMP Environmental Management Plant
EPA Environment Protection Act
GEBCO General Bathymetric Chart of the Oceans
GETCO Gujarat Energy Transmission Corporation Ltd.
GLC Ground Level Concentrations
GoG Government of Gujarat
GPCB Gujarat Pollution Control Board
GUVINL Gujarat Urja Vikas Nigam Ltd.
Kcal kilo calorie
km kilo meter
KPGL Kutch Power Generation Limited
MCM Million Cubic Meter
mg milli gram
ml milli liter
MNP Marine Natonal Park
MoEF Ministry of Environment and Forest
MoP Ministry of Power
MOU Memorandum of understanding
MPSEZ Mundra Port and Special Economic Zone
MW Mega Watt
Marine Environmental Impact Assessment Report of Kutchh Power Generation Limited, Bhadreswar & Wadala
Villages, Mundra Taluka, Kutchh District
Cholamandalam MS Risk Services - 2 -
NABET National Accreditation Board for Education and Training
NE Northeast
NOx Nitrous Oxides
NTU Nephelometric Turbidity Units
NW Northwest
PGCIL Power Grid Corporation of India Ltd.
PHc Petroleum Hydrocarbons
PHE Plate Heat Exchangers
ppt parts per thousand
SE Southeast
SEZ Special Economic Zone
SO2 Sulphur Dioxide
SPM Suspended Particulate Matter
SW sea water
SW Southwest
TOR Terms of Reference
µm micro meter
Marine Environmental Impact Assessment Report of Kutchh Power Generation Limited, Bhadreswar & Wadala
Villages, Mundra Taluka, Kutchh District
Cholamandalam MS Risk Services - 3 -
Table of Contents
1. Introduction .......................................................................................................................... 12
1.1 Project Background ........................................................................................................ 12
1.2 Environment Laws ......................................................................................................... 12
1.2.1 Wastewater Discharge Standards for Thermal Power plants .................................. 12
1.2.2 Temperature Limit for Discharge of condenser Cooling water from Thermal Power Plant .................................................................................................................................. 14
1.2.3 Water Quality Standards for Coastal Waters Marine Outfalls ................................ 15
1.3 Project location and outfall location............................................................................... 16
1.4 Objectives ....................................................................................................................... 17
1.5 Methodology .................................................................................................................. 17
1.5.1 Site Reconnaissance Survey .................................................................................... 17
1.5.2 Marine Water quality ............................................................................................... 17
1.5.3 Sediment quality ...................................................................................................... 17
1.5.4 Biological characteristics ......................................................................................... 17
1.5.5 Marine Monitoring .................................................................................................. 18
1.5.6 Numerical Modeling ................................................................................................ 24
1.5.7 Socio-economic survey in the study area with a specific reference to fisheries ..... 24
2. Project Description............................................................................................................... 25
2.1 Overview of the project .................................................................................................. 25
2.2 Water Requirement ........................................................................................................ 25
2.3 Plant Water System ........................................................................................................ 25
2.3.1 Sea Water Intake System ......................................................................................... 25
2.3.2 Circulating and Auxiliary Cooling Water System ................................................... 26
2.3.3 Demineralised Cooling Water (DMCW) ................................................................. 26
Marine Environmental Impact Assessment Report of Kutchh Power Generation Limited, Bhadreswar & Wadala
Villages, Mundra Taluka, Kutchh District
Cholamandalam MS Risk Services - 4 -
2.3.4 Water Pre - Treatment System................................................................................. 26
2.3.5 DM Plant and Reverse Osmosis (RO) System ........................................................ 27
2.3.6 Condensate Polishing Plant (CPU) .......................................................................... 27
2.3.7 Service Water & Potable Water System .................................................................. 28
2.3.8 Effluent Treatment Plant ......................................................................................... 28
2.4. Marine outfall characteristics ....................................................................................... 29
2.5. Marine outfall design details ........................................................................................ 29
3. Marine Environmental Settings of Study Area ................................................................... 30
3.1 Geomorphology of study area ........................................................................................ 30
3.2 Meteorological Conditions ............................................................................................. 31
3.3 Physical Processes .......................................................................................................... 34
3.3.1 Tides ........................................................................................................................ 34
3.3.2 Currents ................................................................................................................... 35
3.4 Physico-chemical properties of seawater and Sediments ............................................... 35
3.4.1 Temperature ............................................................................................................. 36
3.4.2 pH ............................................................................................................................ 36
3.4.3 Salinity ..................................................................................................................... 36
3.4.4 Total Suspended Solids ........................................................................................... 36
3.4.5 Dissolved Oxygen.................................................................................................... 36
3.4.6 Biological Oxygen Demand .................................................................................... 36
3.4.7 Oil and Grease ......................................................................................................... 37
3.4.8 Residual Chlorine and Phosphates .......................................................................... 37
3.4.9 Sulphides ................................................................................................................. 37
3.5 Flora and Fauna .............................................................................................................. 39
3.5.1 Phytopigments ......................................................................................................... 39
3.5.2 Phytoplankton .......................................................................................................... 40

Marine Environmental Impact Assessment Report of Kutchh Power Generation Limited, Bhadreswar & Wadala
Villages, Mundra Taluka, Kutchh District
Cholamandalam MS Risk Services - 5 -
3.5.2.1 Species composition and distribution ............................................................... 41
3.5.3 Zooplankton ............................................................................................................. 51
3.5.3.1 Abundance and richness ................................................................................... 51
3.5.3.2 Composition ...................................................................................................... 51
3.5.4 Benthos .................................................................................................................... 58
3.6 Fishery ............................................................................................................................ 62
3.7 Statistical Analysis ......................................................................................................... 64
3.7.1 Diversity Index ........................................................................................................ 64
3.7.2 Abundance – Biomass Comparison ......................................................................... 67
3.7.3 Draftsman Plot ......................................................................................................... 68
3.8 Coastal Eco-systems within the impact zone (mangroves, coastal biological components) ......................................................................................................................... 69
3.9 Socio-economics with respect to fisheries ..................................................................... 69
4. Marine Environmental Impact Assessment ......................................................................... 70
4.1. Impacts of thermal and salinity dispersion on marine environment ............................. 70
4.2 Hydrodynamic Model .................................................................................................... 71
4.2.1 Introduction ............................................................................................................. 71
4.2.2 Model Setup ............................................................................................................. 72
4.2.3 Bathymetry .............................................................................................................. 73
4.2.4 Local bathymetry ..................................................................................................... 74
4.2.5 Physical processes ................................................................................................... 75
4.2.6 Tides ........................................................................................................................ 76
4.2.7 Currents ................................................................................................................... 77
4.2.8 Input parameters ...................................................................................................... 77
4.2.9 Boundary Conditions ............................................................................................... 78
4.2.10 Flow velocities ....................................................................................................... 80
4.3 Thermal Dispersion Modelling ...................................................................................... 85
Marine Environmental Impact Assessment Report of Kutchh Power Generation Limited, Bhadreswar & Wadala
Villages, Mundra Taluka, Kutchh District
Cholamandalam MS Risk Services - 6 -
4.3.1 Neap tide condition .................................................................................................. 86
4.3.2 Spring tide condition ............................................................................................... 90
4.4 Salinity Dispersion Modelling ....................................................................................... 93
4.4.1 Neap tide condition .................................................................................................. 93
4.4.2 Spring tide condition ............................................................................................... 97
4.5 Impacts of dredging on marine ecology ....................................................................... 100
4.5.1 Impacts during Construction of coal conveyer ...................................................... 100
4.5.2 Impacts during operation of coal conveyer ........................................................... 101
4.6 Miscellaneous Impacts ................................................................................................. 101
5. Environment Management Plan ......................................................................................... 103
5.1 Water Pollution ............................................................................................................ 103
5.2 Dredging ....................................................................................................................... 105
5.3 Storage of hazardous materials .................................................................................... 106
5.4. Post Project Environmental Management Plan ........................................................... 106
5.5 Environment Monitoring Program ............................................................................... 106
5.6 Environmental Management Cell................................................................................. 108
6. References .......................................................................................................................... 110
Marine Environmental Impact Assessment Report of Kutchh Power Generation Limited, Bhadreswar & Wadala
Villages, Mundra Taluka, Kutchh District
Cholamandalam MS Risk Services - 7 -
List of Tables
Table 1.1: Discharge Standards for Thermal Power Plants ..................................................... 13
Table 1.2: Primary Marine Water Quality Criteria .................................................................. 15
Table 1.3: Primary Water Quality Criteria for Class SW-III Waters ...................................... 15
Table 1.4: Salient Features of the Project Location ................................................................. 16
Table 1.5: Sampling Period and Methods of Sampling ........................................................... 19
Table 1.6: Geo-coordinates of sampling stations off Mundra - Luni – Bhadreshwar ............. 20
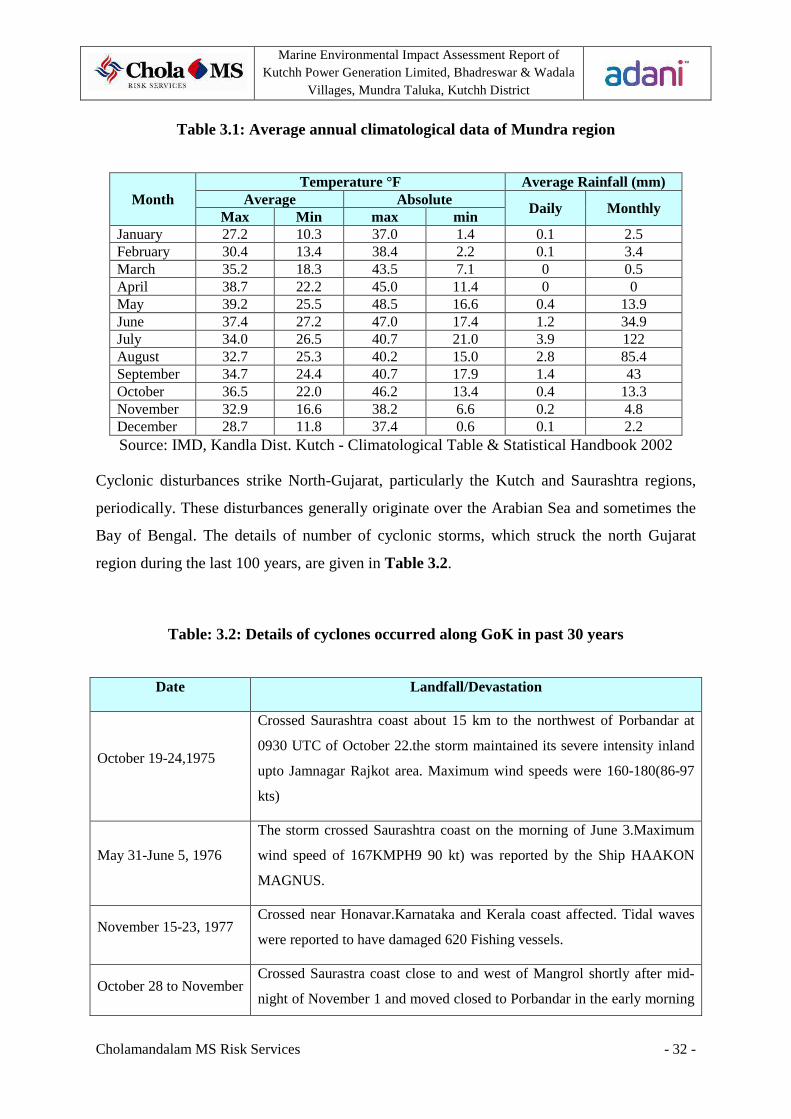
Table 3.1: Average annual climatological data of Mundra region .......................................... 32
Table: 3.2: Details of cyclones occurred along GoK in past 30 years ..................................... 32
Table 3.3: Chemical Properties of Seawater off Bhadreshwar during March 2012 (Post-monsoon).................................................................................................................................. 37
Table 3.4: Chemical Properties of Seawater off Bhadreshwar during May 2012 (pre monsoon).................................................................................................................................. 38
Table 3.5: Chemical Properties of Sediments off Bhadreshwar during March 2012 (Post-monsoon).................................................................................................................................. 38
Table 3.6: Chemical Properties of Sediments off Bhadreshwar during May 2012 (pre -monsoon).................................................................................................................................. 39
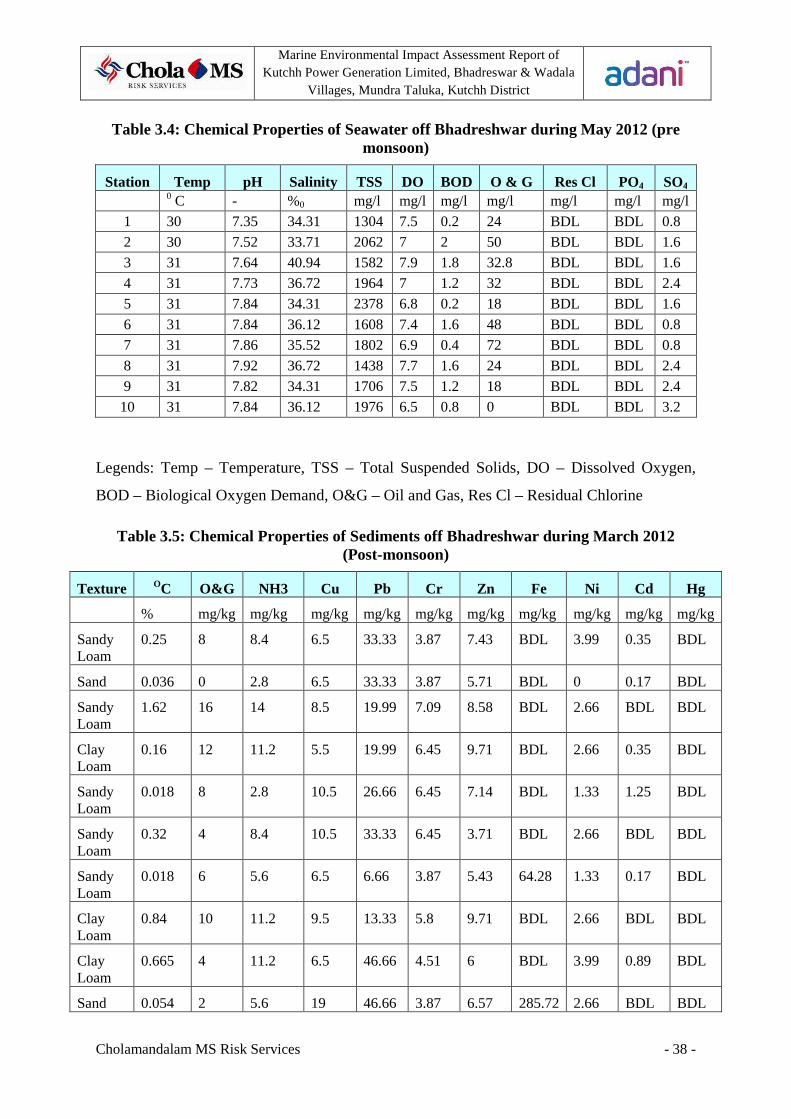
Table 3.7: Concentartions of Chlorophyll a and Phaeophytin off Bhadreshwar during March and May 2012 .......................................................................................................................... 40
Table 3.8: Abundance and species richness of phytoplankton off Bhadreshwar .................... 42
Table 3.9: Occurrence of Phytoplankton species along study area off Bhadreshwar during March 2012 .............................................................................................................................. 43
Table 3.10: Occurrence of Phytoplankton species along study area off Bhadreshwar during March 2012 .............................................................................................................................. 44
Table 3.11: Occurrence of Phytoplankton species along study area off Bhadreshwar during May 2012 ................................................................................................................................. 45
Table 3.12: Occurrence of Phytoplankton species along study area off Bhadreshwar during May 2012 ................................................................................................................................. 46
Marine Environmental Impact Assessment Report of Kutchh Power Generation Limited, Bhadreswar & Wadala
Villages, Mundra Taluka, Kutchh District
Cholamandalam MS Risk Services - 8 -
Table 3.13: Percentage composition of Phytoplankton species along study area off Bhadreshwar during March 2012 ............................................................................................. 47
Table 3.14: Percentage composition of Phytoplankton species along study area off Bhadreshwar during March 2012 ............................................................................................. 48
Table 3.15: Percentage composition of Phytoplankton species along study area off Bhadreshwar during May 2012 ................................................................................................ 49
Table 3.16: Percentage composition of Phytoplankton species along study area off Bhadreshwar during May 2012 ................................................................................................ 50
Table 3.17: Abundance and group richness of zooplankton off Bhadreshwar during March 2012.......................................................................................................................................... 52
Table 3.18: Abundance and group richness of zooplankton off Bhadreshwar during May 2012.................................................................................................................................................. 53
Table 3.19: Occurrence of Zooplankton species along study area off Bhadreshwar during March 2012 .............................................................................................................................. 54
Table 3.20: Occurrence of Zooplankton species along study area off Bhadreshwar during May 2012 ................................................................................................................................. 55
Table 3.21: Percentage composition of Zooplankton species along study area off Bhadreshwar during March 2012 ............................................................................................. 56
Table 3.22: Percentage composition of Zooplankton species along study area off Bhadreshwar during May 2012 ................................................................................................ 57
Table 3.23: Macrobenthos off Bhadreshwar during March 2012 ............................................ 59
Table 3.24: Macrobenthos off Bhadreshwar during May 2012 ............................................... 59
Table 3.25: Occurrence of macrobenthos along study area off Bhadreshwar during March 2012.......................................................................................................................................... 60
Table 3.26: Occurrence of macrobenthos along study area off Bhadreshwar during May 2012.................................................................................................................................................. 61
Table 3.27: Details of fish landing and fishermen from major fish landing centres around Bhadreshwar ............................................................................................................................ 63
Table 3.28: Species wise composition of fish landing at Bhadreshwar during 2009-2010 ..... 63
Table 3.29: Diversity Indices for Phytoplankton community off Bhadreshwar ...................... 66
Table 3.30: Diversity Indices for Zooplankton community off Bhadreshwar ......................... 66

Marine Environmental Impact Assessment Report of Kutchh Power Generation Limited, Bhadreswar & Wadala
Villages, Mundra Taluka, Kutchh District
Cholamandalam MS Risk Services - 9 -
Table 3.31: Diversity Indices for Benthos community off Bhadreshwar ................................ 67
Table 4.1: Tidal heights observed at Mundra and Kandla ....................................................... 76
Table 4.2: Model parameters used in MIKE 21 HD ................................................................ 78
Table 4.3: Seawater outfall characteristics of proposed power plant ...................................... 85
Table 5.1: Proposed Environment Monitoring Program........................................................ 108
Marine Environmental Impact Assessment Report of Kutchh Power Generation Limited, Bhadreswar & Wadala
Villages, Mundra Taluka, Kutchh District
Cholamandalam MS Risk Services - 10 -
List of Figures
Figure 1.2: Collection of Marine Samples ............................................................................... 23
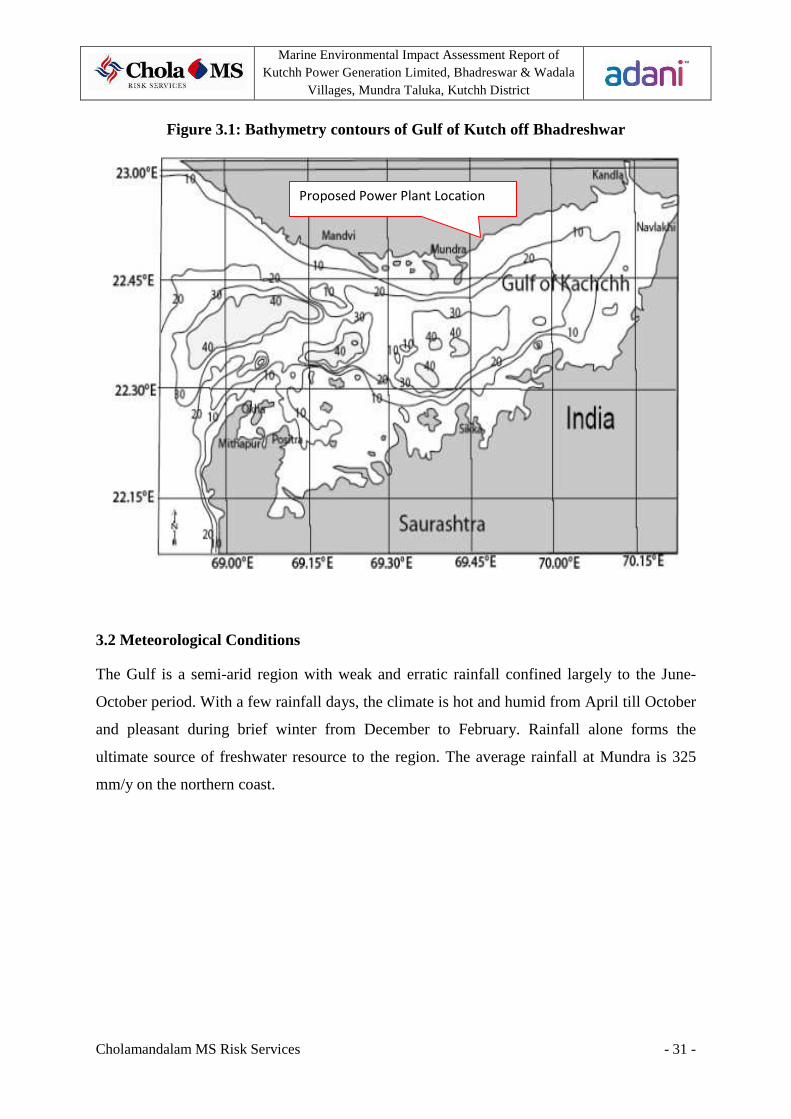
Figure 3.1: Bathymetry contours of Gulf of Kutch off Bhadreshwar ...................................... 31
Figure 3.2: Tidal variations at Mundra Port ............................................................................. 35
Figure 3.3: ABC curve of zooplankton .................................................................................... 68
Figure 3.4: ABC curve of benthos ........................................................................................... 68
Figure 3.5: Draftsman Plot of marine biological parameters ................................................... 69
Figure 4.1: Google Earth imagery showing location of study area in Gulf of Kutch .............. 71
Figure 4.2: Hydrodynamic model setup for Gulf of Kutch and local mesh ............................ 73
Figure 4.3: Terrain features of Kutch Power Generation Limited, at Bhadreshwar ................ 74
Figure 4.4: Local bathymetry mesh model .............................................................................. 75
Figure 4.5: Simulated Tides at Bhadreshwar ........................................................................... 76
Figure 4.6: Predicted tides for 1 year near Navinal point ........................................................ 77
Figure 4.7: Comparison of Predicted and Simulated Tides at Navinal and Bhadreshwar ....... 79
Figure 4.8: Simulated current flow off Bhadreshwar during Neap Tide (Ebbing) .................. 81
Figure 4.9: Simulated current flow off Bhadreshwar during Neap Tide (Ebbing) with 12.5 m/s winds from SSW ............................................................................................................... 81
Figure 4.10: Simulated current flow off Bhadreshwar during Neap Tide (Flooding) ............. 82
Figure 4.11: Simulated current flow off Bhadreshwar during Neap Tide (Flooding) with 12.5 m/s winds from SSW ............................................................................................................... 82
Figure 4.12: Simulated current flow off Bhadreshwar during Spring Tide (Ebbing) .............. 83
Figure 4.13: Simulated current flow off Bhadreshwar during Spring Tide (Ebbing) with 12.5 m/s winds from SSW ............................................................................................................... 83
Figure 4.14: Simulated current flow off Bhadreshwar during Spring Tide (Flooding) ........... 84
Figure 4.15: Simulated current flow off Bhadreshwar during Spring Tide (Flooding) with 12.5 m/s winds from SSW ....................................................................................................... 84
Figure 4.16: Map showing proposed intake and outfall of power plant .................................. 86
Marine Environmental Impact Assessment Report of Kutchh Power Generation Limited, Bhadreswar & Wadala
Villages, Mundra Taluka, Kutchh District
Cholamandalam MS Risk Services - 11 -
Figure 4.17: Excess temperature above ambient during Neap Tide - Ebbing ......................... 88
Figure 4.18: Excess temperature above ambient during Neap Tide - Flooding ...................... 88
Figure 4.19: Excess temperature above ambient during Neap Tide – Ebbing combined with winds 12.5 m/s from SSW ....................................................................................................... 89
Figure 4.20: Excess temperature above ambient during Neap Tide – Flooding combined with winds 12.5 m/s from SSW ....................................................................................................... 89
Figure 4.21: Excess temperature above ambient during Spring Tide - Ebbing ....................... 91
Figure 4.22: Excess temperature above ambient during Spring Tide – Flooding ................... 91
Figure 4.23: Excess temperature above ambient during Spring Tide – Ebbing combined with winds 12.5 m/s from SSW ....................................................................................................... 92
Figure 4.24: Excess temperature above ambient during Spring Tide – Flooding combined with winds 12.5 m/s from SSW ............................................................................................... 92
Figure 4.25: Excess salinity above ambient during Neap Tide - Ebbing ................................. 95
Figure 4.26: Excess salinity above ambient during Neap Tide - Flooding .............................. 95
Figure 4.27: Excess salinity above ambient during Neap Tide – Ebbing combined with winds 12.5 m/s from SSW .................................................................................................................. 96
Figure 4.28: Excess salinity above ambient during Neap Tide – Flooding combined with winds 12.5 m/s from SSW ....................................................................................................... 96
Figure 4.29: Excess salinity above ambient during Spring Tide – Ebbing .............................. 98
Figure 4.30: Excess salinity above ambient during Spring Tide – Flooding ........................... 98
Figure 4.31: Excess salinity above ambient during Spring Tide – Ebbing combined with winds 12.5 m/s from SSW ....................................................................................................... 99
Figure 4.32: Excess salinity above ambient during Spring Tide – Flooding combined with winds 12.5 m/s from SSW ....................................................................................................... 99

Marine Environmental Impact Assessment Report of Kutchh Power Generation Limited, Bhadreswar & Wadala
Villages, Mundra Taluka, Kutchh District
Cholamandalam MS Risk Services - 12 -
1. Introduction
1.1 Project Background
The Adani Group, an emerging conglomerate has proposed to enhance the power generation
capacity by launching a special purpose vehicle ‘’Kutch Power Generation Limited” (KPGL),
which is planning to set up 5X660 MW Coal Based Thermal Power Plant at villages
Bhadreswar & Wadala, Taluka- Mundra, District- Kutch, Gujarat.
According to the TOR (no.xvii) issued to KPGL by Ministry of Environment and Forest
(MoEF) vide letter no. J – 13012/73/2009 – IA.II (T) dated 04/11/2009, survey of marine
ecology and impact assessment at the proposed site is mandatory. It is in this connection,
KPGL entrusted Cholamandalam MS Risk Services (NABET Accreditation, Certificate No
NABET/EIA/1011/011) to assess likely impacts on the marine ecology due to the Marine
Outfall form the proposed activity.
This report address the environmental impact assessment of marine outfall from the proposed
thermal power plant and desalination facility of KPGL and marine environmental
management plan program.
1.2 Environment Laws
The project attracts The Water (Prevention and Control of Pollution) Act, 1974 including
Rules 1975 (as amended up to 1978); The Water (Prevention and Control of Pollution) Cess
Act, 1977 including Rules 1978 and 1991; The Air (Prevention and Control of Pollution) Act,
1981 Including Rules 1982, 1983 and 1987; The Environment (Protection) Act, 1986,
Notifications under The Environment (Protection) Act, 1986.
1.2.1 Wastewater Discharge Standards for Thermal Power plants
The proposed facility will generate desalination plant rejects and also cooling water. As per
The Environment (Protection) Rules, 1986, thermal power plants should meet the following
discharge standards (Table 1.1).

Marine Environmental Impact Assessment Report of Kutchh Power Generation Limited, Bhadreswar & Wadala
Villages, Mundra Taluka, Kutchh District
Cholamandalam MS Risk Services - 13 -
Table 1.1: Discharge Standards for Thermal Power Plants
Sr. No. Industry Parameter Standards
1. Thermal Power Plants
Maximum Limiting
concentrations milligrams per liter (except pH)
Condenser Cooling Water (Once through cooling systems)
pH
Temperature
Free available Chlorine
6.5-8.5
Not more than 5oC higher than the intake water temperature
0.5 mg/l
Boiler Blow down
Suspended Solids
Oil and Grease
Copper(Total)
100 mg/l
20 mg/l
1.0 mg/l
Cooling Tower Blow down
Free available Chlorine
Zinc
Chromium (Total)
Phosphate
Other Corrosion Inhibiting Material
0.5 mg/l
1.0 mg/l
0.2 mg/l
5.0 mg/l
Limit to be established by CPCB
Ash Pond Effluent
pH
Suspended Solids
Oil and Grease
6.5-8.5
100 mg/l
20 mg/l
Air Emissions
Particulate Matter Emissions
-generation capacity 210 MW or more
150 milligram per normal cubic meter
Stack Height/Limit in Meters
Power Generation Capacity :
500 MW and above
200 MW/210MW and above to less than 500 MW
Less than 200 MW/210MW
275m
220 m
H=14(Q)0.3 where Q is emission rate of SO2 in kg/hr and H is
Stack Height in meters
Marine Environmental Impact Assessment Report of Kutchh Power Generation Limited, Bhadreswar & Wadala
Villages, Mundra Taluka, Kutchh District
Cholamandalam MS Risk Services - 14 -
1.2.2 Temperature Limit for Discharge of condenser Cooling water from Thermal Power Plant
The Environment (Protection) Rules under the EPA also lays down specific standards for
quality of water effluents to be discharged into different type of water bodies (sewers, surface
water bodies like lakes and rivers, marine discharge). The proposed project will draw water
from the sea and discharge desalination plant rejects and cooling water into sea, hence; The
Water (Prevention and Control of Pollution) Act, 1974 for discharge of quality of water
effluents into marine should meet the following marine discharge standards:
i. New thermal power plants commissioned after June 1, 1999 - New Thermal
Power Plants, which will be using water from rivers/ lakes/ reservoirs shall install
cooling towers-irrespective location and capacity. Thermal power plants which
will use sea water for cooling purposes, the conditions below will apply.
ii. New Projects in coastal areas using sea water - The thermal power plants using
sea water should adopt suitable system to reduce water temperature at the final
discharge point so that the resultant rise in the temperature of receiving water does
not exceed 70C over and above the ambient temperature of the receiving water
bodies.
iii. Existing Thermal Power Plant - Rise in temperature of condenser cooling water
from inlet to the outlet of condenser shall not be more than 100C. This is not
applicable to the proposed project.
iv. Guidelines for discharge point – 1. The discharge point shall preferably be located
at the bottom of the water body at mid-stream for proper dispersion of thermal
discharge, 2. In case of discharge of cooling water into sea, proper marine outfall
shall be designed to achieve the prescribed standards, 3. No cooling water
discharge shall be permitted in estuaries or near ecologically sensitive areas such
as mangroves, coral reefs/spawning and breeding grounds of aquatic flora and
fauna.
Marine Environmental Impact Assessment Report of Kutchh Power Generation Limited, Bhadreswar & Wadala
Villages, Mundra Taluka, Kutchh District
Cholamandalam MS Risk Services - 15 -
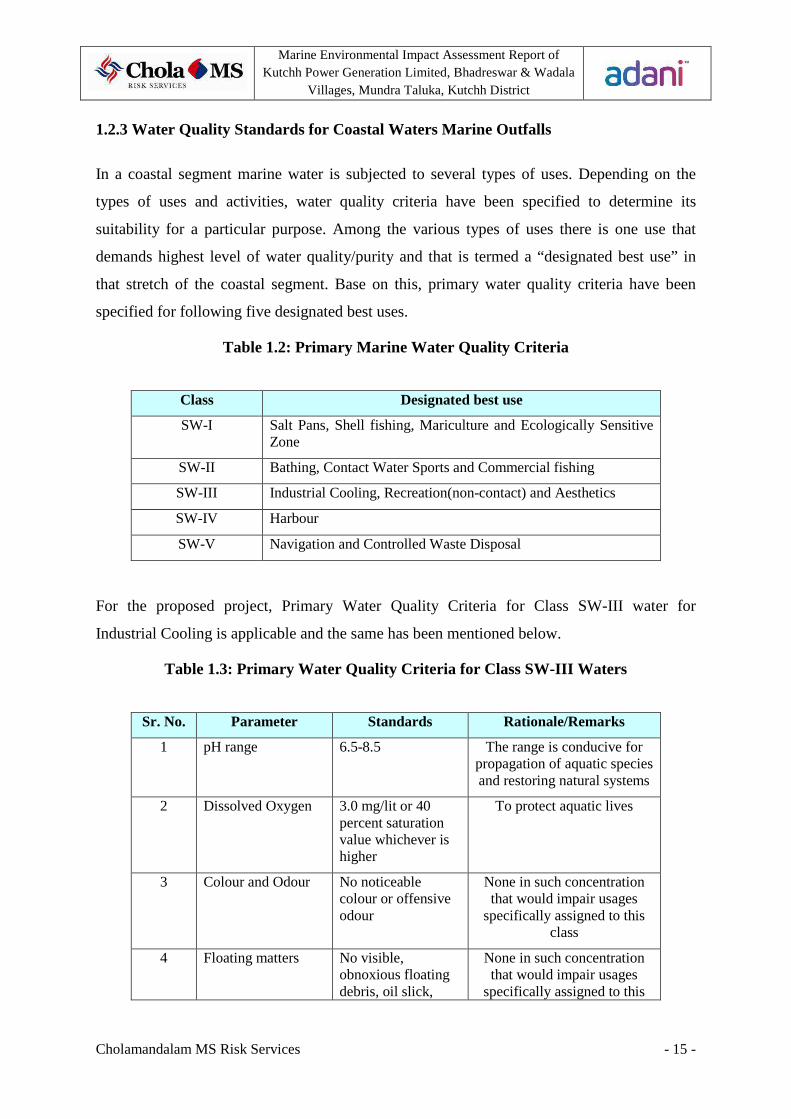
1.2.3 Water Quality Standards for Coastal Waters Marine Outfalls
In a coastal segment marine water is subjected to several types of uses. Depending on the
types of uses and activities, water quality criteria have been specified to determine its
suitability for a particular purpose. Among the various types of uses there is one use that
demands highest level of water quality/purity and that is termed a “designated best use” in
that stretch of the coastal segment. Base on this, primary water quality criteria have been
specified for following five designated best uses.
Table 1.2: Primary Marine Water Quality Criteria
Class Designated best use
SW-I Salt Pans, Shell fishing, Mariculture and Ecologically Sensitive Zone
SW-II Bathing, Contact Water Sports and Commercial fishing
SW-III Industrial Cooling, Recreation(non-contact) and Aesthetics
SW-IV Harbour
SW-V Navigation and Controlled Waste Disposal
For the proposed project, Primary Water Quality Criteria for Class SW-III water for
Industrial Cooling is applicable and the same has been mentioned below.
Table 1.3: Primary Water Quality Criteria for Class SW-III Waters
Sr. No. Parameter Standards Rationale/Remarks
1 pH range 6.5-8.5 The range is conducive for propagation of aquatic species and restoring natural systems
2 Dissolved Oxygen 3.0 mg/lit or 40 percent saturation value whichever is higher
To protect aquatic lives
3 Colour and Odour No noticeable colour or offensive odour
None in such concentration that would impair usages
specifically assigned to this class
4 Floating matters No visible, obnoxious floating debris, oil slick,
None in such concentration that would impair usages
specifically assigned to this

Marine Environmental Impact Assessment Report of Kutchh Power Generation Limited, Bhadreswar & Wadala
Villages, Mundra Taluka, Kutchh District
Cholamandalam MS Risk Services - 16 -
Sr. No. Parameter Standards Rationale/Remarks
scum class
5 Feacal Coliform 500/100 ml(MPN) Not exceeding 1000/100 ml in 20 percent of samples in the year and in 3 consecutive
samples in monsoon months.
6 Turbidity 30 NTU Reasonably clear water for Recreation Aesthetic
appreciation and Industrial Cooling Purposes
7 Dissolved Iron (as Fe)
0.5 mg/l or less It is desirable to have the collective concentration
dissolved Fe and Mn less or equal to 0.5 mg/l to avoid
scaling effect
8 Dissolved Manganese (as Mn)
0.5 mg/l or less
1.3 Project location and outfall location
The site is located near Village Bhadreswar, Mundra, Kutchh District of Gujarat State. The details of the location are given in Table 1.4.
Table 1.4: Salient Features of the Project Location
Project Site Village: Bhadreswar & Wadala Taluka: Mundra District: Kutch State: Gujarat Source of water Water will be sourced from Gulf of
Kutch. The total requirement of water will be 3,94,563 m3/hr
Nearest Railway Station
Anjar (20 kms) & Gandhidham (35 kms)
Road Connectivity 8 km from NH-8A Nearest Water Body 2.0 Km ( Mithi River) Nearest Sea Coast 0.7 Km (Gulf of Kutch) Site Contour 15 – 22m Source of Water Sea water(3.5 kms)
The intake point is located at 22° 49' 48.15"N and 69° 53' 12.50"E while; proposed outfall
point is located at 22° 50' 34.61"N and 69° 50' 20.25" E

Marine Environmental Impact Assessment Report of Kutchh Power Generation Limited, Bhadreswar & Wadala
Villages, Mundra Taluka, Kutchh District
Cholamandalam MS Risk Services - 17 -
1.4 Objectives
The objectives for conducting marine EIA were as follows.
a) To evaluate the prevailing hydrodynamics and ecological status of the coastal waters
adjacent to the project site.
b) To assess the impact of marine outfall on the local marine ecology.
c) To carry out Social Impact assessment
d) To recommend suitable marine environmental management plan and need based
fishermen community development plan, if required.
1.5 Methodology
1.5.1 Site Reconnaissance Survey
Team comprises of CMSRSL and KPGL visited the site on 28th February 2012 to determine
the technical and logistics support required for sampling period. Initially team had discussion
with the KPGL team about the project and site details and subsequently undertaken the visit
to take cognizance of the conditions for marine sampling and monitoring.
1.5.2 Marine Water quality
Marine water samples were collected at --- locations within the impact zone to evolve a
general background for the coastal sea off the project site. The samples collected at the
surface and bottom (wherever the depth exceeds 3 m) were analyzed for salinity, suspended
solids (SS), pH, Dissolved Oxygen (DO), Biochemical Oxygen Demand (BOD), phosphate,
nitrate, nitrite and Petroleum Hydrocarbons (PHc).
1.5.3 Sediment quality
Intertidal and subtidal sediments at and in the vicinity of the project site were studied for
texture, selected metals (chromium, iron, cobalt, nickel, copper, zinc, lead, cadmium and
mercury), organic carbon (Corg), phosphorus and PHc.
1.5.4 Biological characteristics

Marine Environmental Impact Assessment Report of Kutchh Power Generation Limited, Bhadreswar & Wadala
Villages, Mundra Taluka, Kutchh District
Cholamandalam MS Risk Services - 18 -
The status of flora and fauna off the project area would be established based on
phytoplankton pigments, population and generic diversity; zooplankton biomass, population
and group diversity, macrobenthic biomass, population and group diversity, fisheries and
mangroves.
1.5.5 Marine Monitoring
The primary requirements for assessing the impacts are general baseline information for the
Gulf as a whole and intensive site-specific data for the Mundra – Luni - Bhadreshwar area.
Accordingly, subtidal stations covering an area of 100 km2 off Mundra – Luni - Bhadreshwar
were considered for sampling. Intertidal area that would be used for effluent release channel
was also considered for the study and the samples at selected intertidal transects were
investigated. The sampling locations are illustrated in Figure 3. Stations 1, 2 and 3 were
selected along proposed intake channel. Stations 5, 6 and 7 were selected along proposed
outfall channel. Stations 8, 9 and 10 were selected on nearly 2 km from outfall location in
three different directions to assess marine ecology of impact zone. Station 4 was selected
between intake and outfall channels. Details of sampling period and methods are given in
Table 1.5. Samples were collected by Cholamandalam MS Risk Services and Ultra-Tech
Environmental Laboratory.
Marine Environmental Impact Assessment Report of Kutchh Power Generation Limited, Bhadreswar & Wadala
Villages, Mundra Taluka, Kutchh District
Cholamandalam MS Risk Services - 19 -
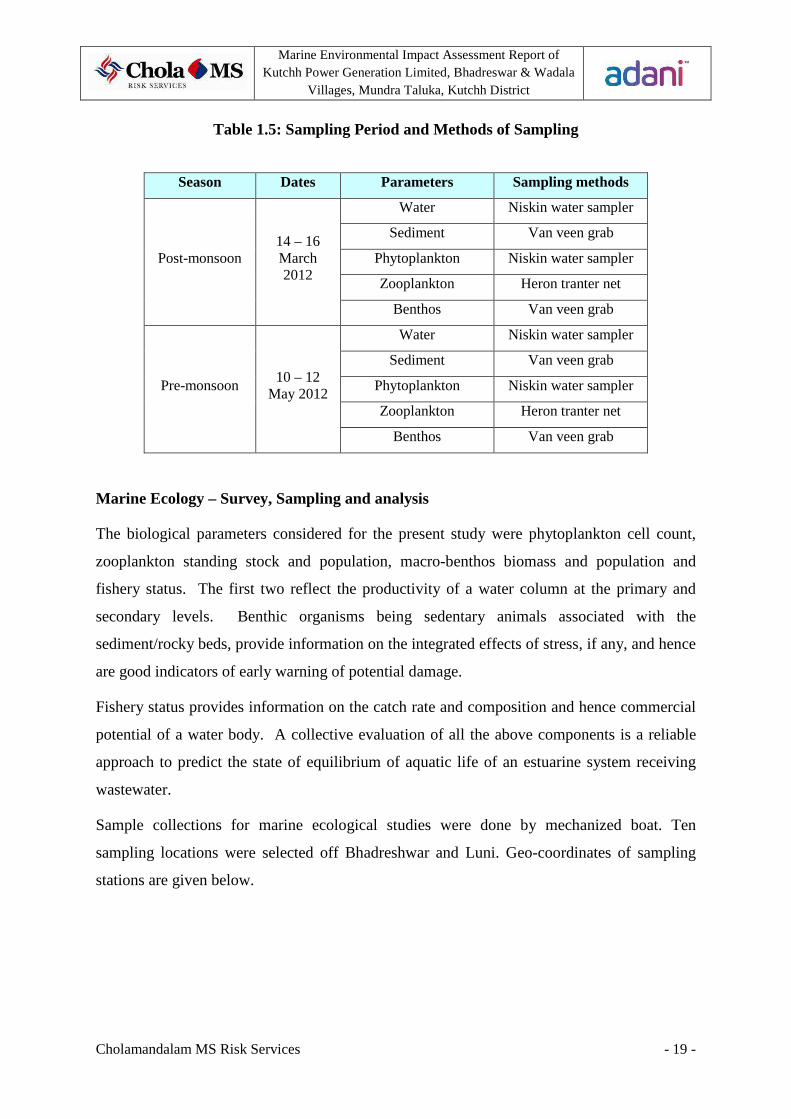
Table 1.5: Sampling Period and Methods of Sampling
Season Dates Parameters Sampling methods
Post-monsoon 14 – 16 March 2012
Water Niskin water sampler
Sediment Van veen grab
Phytoplankton Niskin water sampler
Zooplankton Heron tranter net
Benthos Van veen grab
Pre-monsoon 10 – 12
May 2012
Water Niskin water sampler
Sediment Van veen grab
Phytoplankton Niskin water sampler
Zooplankton Heron tranter net
Benthos Van veen grab
Marine Ecology – Survey, Sampling and analysis
The biological parameters considered for the present study were phytoplankton cell count,
zooplankton standing stock and population, macro-benthos biomass and population and
fishery status. The first two reflect the productivity of a water column at the primary and
secondary levels. Benthic organisms being sedentary animals associated with the
sediment/rocky beds, provide information on the integrated effects of stress, if any, and hence
are good indicators of early warning of potential damage.
Fishery status provides information on the catch rate and composition and hence commercial
potential of a water body. A collective evaluation of all the above components is a reliable
approach to predict the state of equilibrium of aquatic life of an estuarine system receiving
wastewater.
Sample collections for marine ecological studies were done by mechanized boat. Ten
sampling locations were selected off Bhadreshwar and Luni. Geo-coordinates of sampling
stations are given below.

Marine Environmental Impact Assessment Report of Kutchh Power Generation Limited, Bhadreswar & Wadala
Villages, Mundra Taluka, Kutchh District
Cholamandalam MS Risk Services - 20 -
Table 1.6: Geo-coordinates of sampling stations off Mundra - Luni – Bhadreshwar
Station Latitude Longitude
1 – Intake Point 22° 50' 32.7" N 69° 52' 53.9" E
2 22° 51' 04.3" N 69° 52' 53.2" E
3 22° 51' 37.4" N 69° 52' 29.0" E
4 22° 51' 23.1" N 69° 51' 26.2" E
5 22° 51' 27.2" N 69° 50' 33.7" E
6 22° 50' 47.3" N 69° 50' 48.6" E
7 – Outfall Point 22° 50' 18.1" N 69° 50' 59.5" E
8 22° 49' 33.3" N 69° 50' 00.7" E
9 22° 49' 27.9" N 69° 51' 17.1" E
10 22° 50' 06.8" N 69° 51' 56.5" E
Figure 1.1: Map showing sampling locations

Marine Environmental Impact Assessment Report of Kutchh Power Generation Limited, Bhadreswar & Wadala
Villages, Mundra Taluka, Kutchh District
Cholamandalam MS Risk Services - 21 -
Phytoplankton
Water samples were collected for Phytoplankton taxonomy studies using standard water
sampling devices. A measured amount of water samples were fixed by adding “Lugol’s
Iodine” and stored in cool place under dark condition. Samples were allowed to settle for one
week and concentrated to approximate volume in laboratory. 1 ml of each of these
concentrates was examined using Sedgwick - Rafter and microscope, with standard reference
material (Identifying Marine Phytoplankton – By Grethe R. Hasle and Carmelo R. Tomas,
1997).
Chlorophyl a and pheopigments
For the estimation of chlorophyll a (Chl a), one-liter water sample was filtered through GF/F
filter paper. Chlorophyll a and phaeophytin were extracted with 90% acetone and
concentrations were estimated by using spectrophotometer (663 nm).
Zooplankton
The zooplankton samples were collected as horizontal surface tow with a
modified Heron-Tranter (HT) net (having 0.25 m2 mouth area and 300 µm mesh size). All the
samples were preserved in 5% neutralized formaldehyde solution. The zooplankton biomass
was later estimated by displacement volume method and readings were converted for 100
m3. Different zooplankton taxa were sorted, identified and enumerated under stereoscopic
zoom binocular microscope. The number were calculated for the whole samples and
expressed for 100m3 of water.
Benthic communities
Sediment samples for benthic community study were collected from the intertidal as well
near shore subtidal regions. Subtidal sediments were collected with a stainless steel van Veen
grab covering an area of 0.04 m2. The materials collected were preserved in 10% seawater
formalin containing Rose- Bengal stain. In the laboratory, all the samples were again washed
through a 500-µm-mesh sieve in running water to clear adhering sediment. Later all the
organisms were sorted counted and identified (Convey et al, 2003) up to group level.
Biomass (wet weight) was taken after removing the debris and expressed as g m-2.

Marine Environmental Impact Assessment Report of Kutchh Power Generation Limited, Bhadreswar & Wadala
Villages, Mundra Taluka, Kutchh District
Cholamandalam MS Risk Services - 22 -
Statistical Analysis
Marine community structures were assessed by estimating Shannon, Simpson and Margalef
indices, and Evenness. Abundance Biomass Comparison (ABC) method was applied for the
detection of disturbances in zooplankton and benthos populations. Draftsman plot was
constructed to assess correlation between phytoplankton, zooplankton and benthos
abundances and zooplankton and benthos biomasses. The PRIMER – E 6.0 software have
been used for statistical studies.
Marine Environmental Impact Assessment Report of Kutchh Power Generation Limited, Bhadreswar & Wadala
Villages, Mundra Taluka, Kutchh District
Cholamandalam MS Risk Services - 23 -
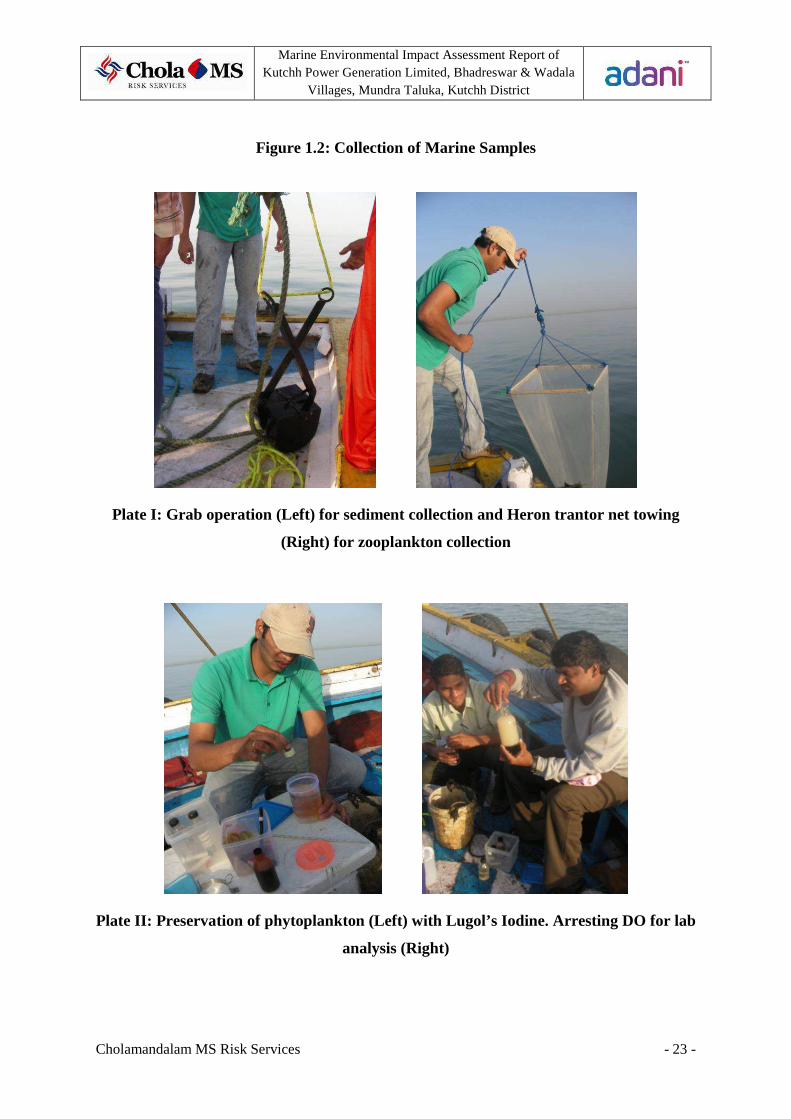
Figure 1.2: Collection of Marine Samples
Plate I: Grab operation (Left) for sediment collection and Heron trantor net towing
(Right) for zooplankton collection
Plate II: Preservation of phytoplankton (Left) with Lugol’s Iodine. Arresting DO for lab
analysis (Right)
Marine Environmental Impact Assessment Report of Kutchh Power Generation Limited, Bhadreswar & Wadala
Villages, Mundra Taluka, Kutchh District
Cholamandalam MS Risk Services - 24 -
Physical processes
Data pertaining to currents, tides and bathymetry was taken from the records being
maintained by Mundra Port and data provided by KPGL.
1.5.6 Numerical Modeling
The scope of work would include hydrodynamic studies of the marine elements that fall under the following
• Bathymetry and model preparation
• Metocean design conditions
• Hydrodynamic modelling of tides and currents
• Cooling water recirculation model for Intake and Outfall
• Sediment ingress.
HD (Hydrodynamic) numerical model along with AD (Advection - Dispersion) module of the
comprehensive 2-dimensional modeling system MIKE 21 was adopted for predicting the
dispersion phenomenon of the outfall.
1.5.7 Socio-economic survey in the study area with a specific reference to fisheries
Data presented in the earlier report was collected and data published by district census. For
primary data of the study area, the reference were made from the report “Community Needs
Assessment for CSR Activities in Mundra Taluk” conducted by VIKSAT Nehru Foundation
for Development for the purpose of developing the Need Based CSR Development plan for
the existing CSR program of Adani Foundation. In this study, the 15-20% of the households
is interviewed to represent the status of the study area. Stratified random sampling method
was used for finding the sample. 1977 samples were surveyed.
Marine Environmental Impact Assessment Report of Kutchh Power Generation Limited, Bhadreswar & Wadala
Villages, Mundra Taluka, Kutchh District
Cholamandalam MS Risk Services - 25 -
2. Project Description
2.1 Overview of the project
Kutch Power Generation Limited (KPGL), a wholly owned subsidiary of Adani Power
Limited (APL), has conceived setting up a coal based Thermal Power Project (TPP) in
Bhadreshwar of Kutch district of Gujarat. KPGL proposes to set up a five unit station of 660
MW each based on Super Critical technology, to have an overall capacity of 3300 MW.
2.2 Water Requirement
The power station has to depend on seawater to meet both consumptive and cooling water
requirements due to non-availability of sweet water either from the surface water sources or
underground sources on a sustained basis. Accordingly seawater will be drawn from GoK as
per recommendation given by numerical modelling.
The total sea water requirement for both consumptive and cooling water along with
Desalination Plant for the power plant will be 3,94.563 m3/hr.
2.3 Plant Water System
The estimated total water requirement for five units for CW system and ACW system is
391900 m3/hr. Estimated cooling water circulation requirement is about 74610 m3/hr for each
660 MW unit and auxiliary cooling water requirement is 3770 m3/hr approximately.
Estimated water requirement for plant water system and other consumptive needs is 2663
m3/hr. Accordingly, the total water requirement for five units is 394563 m3/hr.
The total water requirement is indicated in Water Balance Diagram in Annexure I.
2.3.1 Sea Water Intake System
Sea Water will be drawn from an open intake channel. The capacity of intake channel will be
based on actual water requirement of cooling water system to operate the five units of plant.
It is proposed to use open channel sea water intake system. . The length of the open channel
will be 10.5 km, which will be dredged to a depth of 6 m below the CD. The channel will be
unlined up to the HTL. The channel will be lined from the HTL to the Plant Water Intake
System.

Marine Environmental Impact Assessment Report of Kutchh Power Generation Limited, Bhadreswar & Wadala
Villages, Mundra Taluka, Kutchh District
Cholamandalam MS Risk Services - 26 -
2.3.2 Circulating and Auxiliary Cooling Water System
Condenser Cooling Water System will be once through cooling with sea water which will be
pumped by Main CW pumps. One common Condenser Cooling water pumping station will
be installed for the five units in the plant. Cooling water pump house will be provided with
either CW electro chlorination system or gas chlorination system and chemical treatment
systems. 11x50% (2 pumps running for each unit and one pump as common standby)
concrete volute Main CW pumps of suitable capacity for condenser cooling of five units is
envisaged. Each pump capacity will have 10% design margin. The piping and pumping
system will be suitable for sea water application. 2x100% capacity Auxiliary Cooling Water
(ACW) pumps for each unit is proposed to supply auxiliary cooling sea water to plate type
heat exchangers of Boiler and Turbine Generator. The auxiliary cooling water pumps will be
located within the TG building. 2x100% self cleaning strainers at ACW pump suction is
proposed. The CW system will be provided with trash racks and rakes, travelling screens and
stop log gates complete with lifting and handling facilities at the cooling water pump house.
A cooling tower of 970 m3/hr capacity has been proposed for AHP coolers, Plant air
compressors coolers, Fuel Oil coolers and H2 Generation Plant.
2.3.3 Demineralised Cooling Water (DMCW)
The DMCW system shall be closed cycle cooling water system using passivated DM water
with pH maintained between 8.5 to 9.5. The pH of DMCW system shall be maintained by
manual dosing of NaOH solution. DMCW system will be used for cooling of generator stator
and auxiliaries of steam generator and turbine generator. The DM water in turn will be cooled
by sea water in plate type heat exchangers through ACW pumps. Make up to the closed loop
would be from unit DM make up system.
2.3.4 Water Pre - Treatment System
Pretreatment plant shall be designed to remove suspended/ colloidal matter in the raw water.
Pre treatment plant shall be sized for meeting the requirement of Demineralization Plant (DM
Plant), Clarified Water and Potable water system. A suitable chemical house shall also be
provided to store chemicals such as chlorine, lime, alum, coagulant aid etc.

Marine Environmental Impact Assessment Report of Kutchh Power Generation Limited, Bhadreswar & Wadala
Villages, Mundra Taluka, Kutchh District
Cholamandalam MS Risk Services - 27 -
Sea water shall be made to pass through Pre treatment plant will be provided with a stilling
chamber cum aerator and provision of dosing alum, lime and chlorine and then clarifier for
removal of sludge and clarified water received shall be used for Coal Handling Dust
Suppression, Ash Handling Plant and Ash Dyke. The clarified water shall be made to pass
through pretreatment plant consisting of DAF, UF Dual Media filter and Micron Filter. The
recovered water will be free from suspended and colloidal matter.
2.3.5 DM Plant and Reverse Osmosis (RO) System
A DM plant of total 289 m3/hr capacity is envisaged to ensure make-up requirement of heat
cycle, make up to closed circuit auxiliary system, chemical dosing plant and other
miscellaneous applications. The clarified water after pretreatment plant will be made to pass
through RO stage 1 process. The reject from Stage 1 RO will be directed back to sea. Clean
water as received from Stage 1 RO will be directed to Stage 2 RO system. Water as reject
received from Stage 2 RO is clean water and the same shall be directed to the inlet of Stage 1
RO. Water outlet at the Stage 2 RO shall be made to pass through Mixed Bed Exchanger.
DM water received from Mixed Bed Exchanger will be stored in DM Water storage tanks.
Configuration of the DM Plant will be such that at least one standby stream is available.
2x100% DM water Transfer pumps will be provided to transfer the DM Water from the DM
plant storage tank to condensate storage tank for further distribution to heat cycle make up,
system make up to closed circuit auxiliary system, chemical dosing plant and other
miscellaneous applications. Besides, there will be 2 x 100% SG fill pumps for direct filling of
SG with Demineralised Water. These pumps will be located near DM Water Tanks. A
chlorination plant will be utilised for chlorine dosing in the Pre-treatment plant and CW
system to avoid the growth of algae and bacteria.
2.3.6 Condensate Polishing Plant (CPU)
For maintaining the feed water purity, condensate polishing plant will be provided in the feed
water cycle at the downstream of condensate extraction pumps. The function of the CPU will
be to purify the condensate from the condenser by removing solids and dissolved salts with
the intent of reducing corrosion and depositions in the steam-water cycle.

Marine Environmental Impact Assessment Report of Kutchh Power Generation Limited, Bhadreswar & Wadala
Villages, Mundra Taluka, Kutchh District
Cholamandalam MS Risk Services - 28 -
The condensate polishing plant will be, 3 x 50% capacity mixed bed trains, for each unit. The
resins to be used would be strong acid cation and strong basic anion type appropriate for the
influent condensate quality. The resins will be separated and regenerated externally by
transferring to a dedicated regeneration station. Common external regeneration facility will
be provided for five (5) units. The CPU will be provided with associated chemical feed
system for preparing, measuring and dosing the required chemicals.
2.3.7 Service Water & Potable Water System
Drinking water requirement for the plant and colony will be met from the outlet of RO Stage
1 process. There will be 2x100% drinking water pumps, which will supply drinking water to
various facilities. Plant service water requirement will be met from the outlet of RO Stage 1
process being stored in Overhead Service water tank. Service Water will be used for HVAC,
washing, AHP seal water system, Green Belt, Make up to BOP auxiliaries and make up to
Hydrogen Generation plant and other miscellaneous requirement.
2.3.8 Effluent Treatment Plant
The following are the different type of effluent to be treated before reuse. Sea water will be
made to pass through clarifiers before being used for CHP, AHP and Pretreatment Plant.
Effluent (Sludge) from aforesaid clarifiers will be fed to ash handling plant. All chemical area
drains and neutralization waste from neutralization pit of DM plant and CPU are directed to
Central Monitoring Basin (CMB). Effluent from Boiler, Turbine and other areas, which may
contain oil traces, will be sent to oil/water separator. The oil will be pumped out periodically
and trucked out for offsite disposal. Then the water will be directed to CMB. The wastewater
in transformer area may contain oil. Disposal of wastewater from transformer yard will be
directed to Oil/water separator. Then the water will be directed to common effluent treatment
plant. The filter back wash water used for back washing purpose from Dual Media filter will
be directed to CMB. All the effluents after being neutralized and being treated in Central
Monitoring Basin will be directed back to sea.

Marine Environmental Impact Assessment Report of Kutchh Power Generation Limited, Bhadreswar & Wadala
Villages, Mundra Taluka, Kutchh District
Cholamandalam MS Risk Services - 29 -
2.4. Marine outfall characteristics
Discharge Temp OC Salinity –ppt COD –mg/l Oil and grease – mg/l Cr – mg/l
Cooling tower blow-down
7⁰C above ambient
35 ppt < 50 < 10 < 0.001
Desalination plant
Near ambient 120 ppt < 250 < 10 < 0.001
Treated D.M plant effluent
Near ambient 120 ppt < 250 < 10 < 0.001
Combined outfall
5⁰C above ambient
36 ppt < 50 < 10 < 0.001
2.5. Marine outfall design details
The proposed outfall is through an open channel. (Drawing superimposed on CRZ Map is
being enclosed for writing the details as Annexure II . The alignments of intake and outfall
channel has been changed after the Public Hearing and in consultation with local villagers
and fishermen. The intake channel has been shifted towards west to maintain a distance of at
least 2.5 km from the fishing hamlet of Bhadreswar. The alignment of outfall channel has
also been shifted towards the west. The total length of the outfall channel will be 12 km. The
outfall channel will first be in the westward direction over a length of 7 km and will be
developed in the land belonging to APSEZ. This part of the channel will be lined with the
width varying from 90 m to 150 m as per the width of the land available. This will provide
turbulent flow for cooling of the discharge water. Afterwards, the channel will be in the
North-South direction, which will be a dredged channel of 0.5 m depth along the slope with
top width of 200 m. This portion will be unlined.

Marine Environmental Impact Assessment Report of Kutchh Power Generation Limited, Bhadreswar & Wadala
Villages, Mundra Taluka, Kutchh District
Cholamandalam MS Risk Services - 30 -
3. Marine Environmental Settings of Study Area
The area proposed for development of power plant by KPGL is located between two
ephemeral rivulets flowing near village Bhadreshwar on east direction and near Gundala
village on west direction. The intertidal area of this region is devoid of mangroves. The
bottom is sandy while substratums of inlets are partially admixed with sand and clay. Some
of the beaches are used by local fisher folk for beaching their shallow draft crafts and land
above high water line for drying fish. The prominent vegetation is mainly composed of
Babool (Prosopsis juliflora). subtidal stations covering an area of 100 km2 off Mundra – Luni
- Bhadreshwar were considered for sampling. Intertidal area that would be used for effluent
release channel was also considered for the study and the samples at selected intertidal
transects were investigated. Offshore marine samples were collected between 220 49’N 690
50’E and 220 51’N 690 53’E. A detailed report on the marine environment of the study area is
attached as Annexure III to this report.
3.1 Geomorphology of study area
Within the study area, though water depths of 25 m exist in the broad central portion up to the
latitude of 220 45’N (Figure 3.1), the actual intake and outfall channel region is obstructed by
the presence of several shoals. The high tidal influx covers the low lying areas of about 1500
km2 comprising a network of creeks and alluvial marshy tidal flats in the interior region. The
creek system consists of only one Mithi creek. All along the coast of Mundra taluka very few
rivers drain into the Gulf and they carry only a small quantity of freshwater, except during the
brief monsoon. They are shallow and bed is mostly composed of coarse sand and gravel. The
northern shore is predominantly sandy or muddy confronted by numerous shoals.
Marine Environmental Impact Assessment Report of Kutchh Power Generation Limited, Bhadreswar & Wadala
Villages, Mundra Taluka, Kutchh District
Cholamandalam MS Risk Services - 31 -
Figure 3.1: Bathymetry contours of Gulf of Kutch off Bhadreshwar
3.2 Meteorological Conditions
The Gulf is a semi-arid region with weak and erratic rainfall confined largely to the June-
October period. With a few rainfall days, the climate is hot and humid from April till October
and pleasant during brief winter from December to February. Rainfall alone forms the
ultimate source of freshwater resource to the region. The average rainfall at Mundra is 325
mm/y on the northern coast.
Proposed Power Plant Location
Marine Environmental Impact Assessment Report of Kutchh Power Generation Limited, Bhadreswar & Wadala
Villages, Mundra Taluka, Kutchh District
Cholamandalam MS Risk Services - 32 -
Table 3.1: Average annual climatological data of Mundra region
Month Temperature °F Average Rainfall (mm)
Average Absolute Daily Monthly
Max Min max min January 27.2 10.3 37.0 1.4 0.1 2.5 February 30.4 13.4 38.4 2.2 0.1 3.4 March 35.2 18.3 43.5 7.1 0 0.5 April 38.7 22.2 45.0 11.4 0 0 May 39.2 25.5 48.5 16.6 0.4 13.9 June 37.4 27.2 47.0 17.4 1.2 34.9 July 34.0 26.5 40.7 21.0 3.9 122 August 32.7 25.3 40.2 15.0 2.8 85.4 September 34.7 24.4 40.7 17.9 1.4 43 October 36.5 22.0 46.2 13.4 0.4 13.3 November 32.9 16.6 38.2 6.6 0.2 4.8 December 28.7 11.8 37.4 0.6 0.1 2.2 Source: IMD, Kandla Dist. Kutch - Climatological Table & Statistical Handbook 2002
Cyclonic disturbances strike North-Gujarat, particularly the Kutch and Saurashtra regions,
periodically. These disturbances generally originate over the Arabian Sea and sometimes the
Bay of Bengal. The details of number of cyclonic storms, which struck the north Gujarat
region during the last 100 years, are given in Table 3.2.
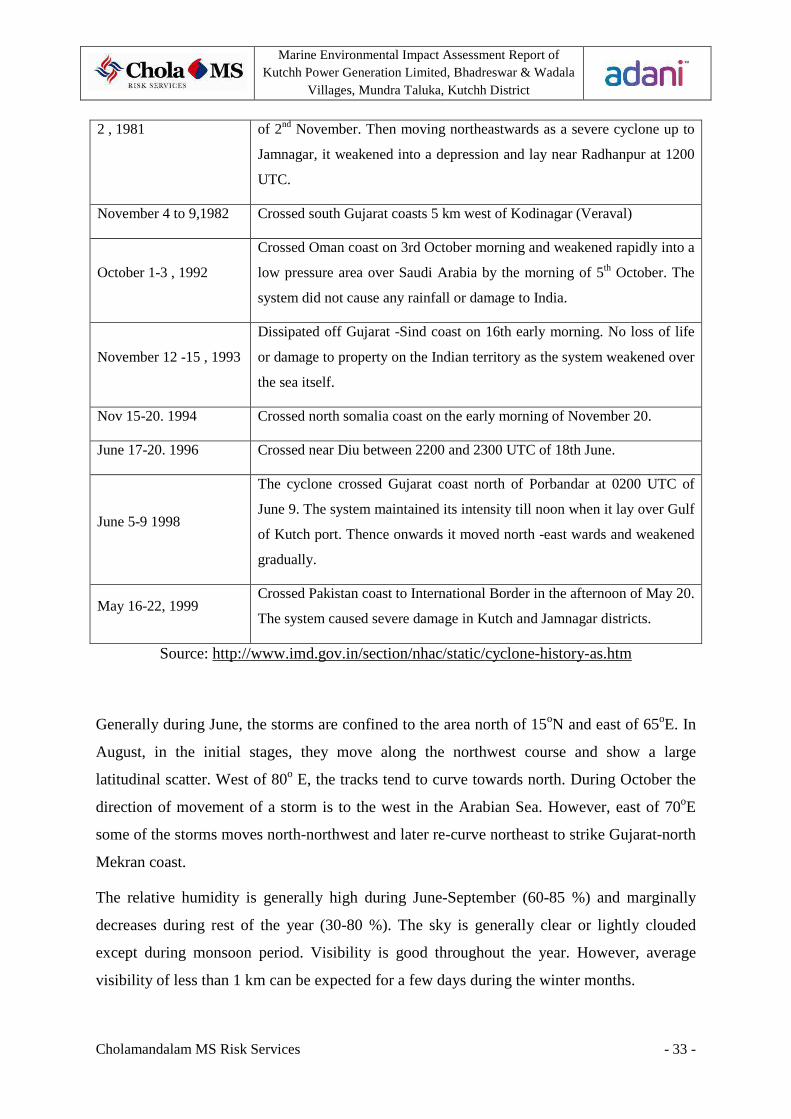
Table: 3.2: Details of cyclones occurred along GoK in past 30 years
Date Landfall/Devastation
October 19-24,1975
Crossed Saurashtra coast about 15 km to the northwest of Porbandar at
0930 UTC of October 22.the storm maintained its severe intensity inland
upto Jamnagar Rajkot area. Maximum wind speeds were 160-180(86-97
kts)
May 31-June 5, 1976
The storm crossed Saurashtra coast on the morning of June 3.Maximum
wind speed of 167KMPH9 90 kt) was reported by the Ship HAAKON
MAGNUS.
November 15-23, 1977 Crossed near Honavar.Karnataka and Kerala coast affected. Tidal waves
were reported to have damaged 620 Fishing vessels.
October 28 to November Crossed Saurastra coast close to and west of Mangrol shortly after mid-
night of November 1 and moved closed to Porbandar in the early morning
Marine Environmental Impact Assessment Report of Kutchh Power Generation Limited, Bhadreswar & Wadala
Villages, Mundra Taluka, Kutchh District
Cholamandalam MS Risk Services - 33 -
2 , 1981 of 2nd November. Then moving northeastwards as a severe cyclone up to
Jamnagar, it weakened into a depression and lay near Radhanpur at 1200
UTC.
November 4 to 9,1982 Crossed south Gujarat coasts 5 km west of Kodinagar (Veraval)
October 1-3 , 1992
Crossed Oman coast on 3rd October morning and weakened rapidly into a
low pressure area over Saudi Arabia by the morning of 5th October. The
system did not cause any rainfall or damage to India.
November 12 -15 , 1993
Dissipated off Gujarat -Sind coast on 16th early morning. No loss of life
or damage to property on the Indian territory as the system weakened over
the sea itself.
Nov 15-20. 1994 Crossed north somalia coast on the early morning of November 20.
June 17-20. 1996 Crossed near Diu between 2200 and 2300 UTC of 18th June.
June 5-9 1998
The cyclone crossed Gujarat coast north of Porbandar at 0200 UTC of
June 9. The system maintained its intensity till noon when it lay over Gulf
of Kutch port. Thence onwards it moved north -east wards and weakened
gradually.
May 16-22, 1999 Crossed Pakistan coast to International Border in the afternoon of May 20.
The system caused severe damage in Kutch and Jamnagar districts.
Source: http://www.imd.gov.in/section/nhac/static/cyclone-history-as.htm
Generally during June, the storms are confined to the area north of 15oN and east of 65oE. In
August, in the initial stages, they move along the northwest course and show a large
latitudinal scatter. West of 80o E, the tracks tend to curve towards north. During October the
direction of movement of a storm is to the west in the Arabian Sea. However, east of 70oE
some of the storms moves north-northwest and later re-curve northeast to strike Gujarat-north
Mekran coast.
The relative humidity is generally high during June-September (60-85 %) and marginally
decreases during rest of the year (30-80 %). The sky is generally clear or lightly clouded
except during monsoon period. Visibility is good throughout the year. However, average
visibility of less than 1 km can be expected for a few days during the winter months.

Marine Environmental Impact Assessment Report of Kutchh Power Generation Limited, Bhadreswar & Wadala
Villages, Mundra Taluka, Kutchh District
Cholamandalam MS Risk Services - 34 -
3.3 Physical Processes
3.3.1 Tides
Tide levels recorded at Mundra port are compared with the predicted tide at Kandla Port in
the following table. Tides in the Gulf are of mixed, predominantly semidiurnal type with a
large diurnal inequality. The tidal front enters the Gulf from the west and due to shallow
inner regions and narrowing cross-section, the tidal amplitude increases considerably. Due to
high tidal ranges in the inner regions, the vast mudflats and coastal lowlands that get
submerged during high tide, are fully exposed during low tide.
Tides Mundra Kandla
Spring High Water 6.09 7.04
Spring Low Water 5.65 6.84
Neap High Water 1.81 2.50
Neap Low Water 0.37 0.17
Source: Tide Table Mundra Port
The mean sea level at the Mundra Port (Bocha Creek) is estimated at 3.31 m (above CD)
which is comparable to that reported for Navinal Point (3.38 m) in the Admiralty Tide
Tables.

Marine Environmental Impact Assessment Report of Kutchh Power Generation Limited, Bhadreswar & Wadala
Villages, Mundra Taluka, Kutchh District
Cholamandalam MS Risk Services - 35 -
Figure 3.2: Tidal variations at Mundra Port
3.3.2 Currents
Information on currents in project area was absorbed from report ‘Marine environmental
impact assessment for discharge channel of 4000 mw ultra mega power project near Mundra’,
prepared by NIO, dated February 2009, provided by KPGL. The currents in the gulf and
associated creeks are largely tide induced and oscillations are mostly bimodal reversing in
direction with the change in the tidal phase. Influence of wind on variations in current is
minor. The current reversals are quite sharp occurring within 30 - 60 min. Currents recorded
at Mundra Port showed that the maximum current speed varied from 0.5 to 1.2 m/s. The
predominant direction of the current is 450 during flood and 2200 during ebb.
3.4 Physico-chemical properties of seawater and Sediments
Dynamic nature of GoK exhibited wide variations in physic-chemical properties of seawater.
During post-monsoon season water was clear with visibility up to 8 m. During pre-monsoon
season due to heavy turbulence visibility reduced to 1 m. However, sediment structure off
Bhadreshwar did not show any variations during both seasons.
Marine Environmental Impact Assessment Report of Kutchh Power Generation Limited, Bhadreswar & Wadala
Villages, Mundra Taluka, Kutchh District
Cholamandalam MS Risk Services - 36 -
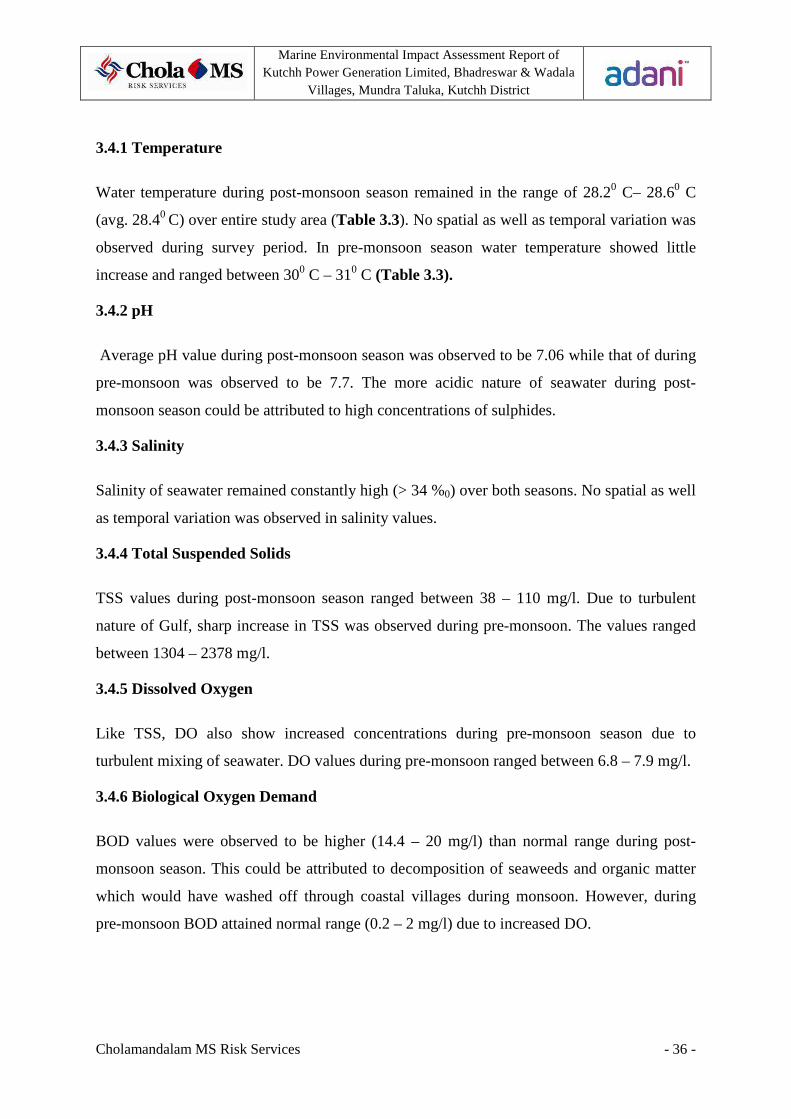
3.4.1 Temperature
Water temperature during post-monsoon season remained in the range of 28.20 C– 28.60 C
(avg. 28.40 C) over entire study area (Table 3.3). No spatial as well as temporal variation was
observed during survey period. In pre-monsoon season water temperature showed little
increase and ranged between 300 C – 310 C (Table 3.3).
3.4.2 pH
Average pH value during post-monsoon season was observed to be 7.06 while that of during
pre-monsoon was observed to be 7.7. The more acidic nature of seawater during post-
monsoon season could be attributed to high concentrations of sulphides.
3.4.3 Salinity
Salinity of seawater remained constantly high (> 34 %0) over both seasons. No spatial as well
as temporal variation was observed in salinity values.
3.4.4 Total Suspended Solids
TSS values during post-monsoon season ranged between 38 – 110 mg/l. Due to turbulent
nature of Gulf, sharp increase in TSS was observed during pre-monsoon. The values ranged
between 1304 – 2378 mg/l.
3.4.5 Dissolved Oxygen
Like TSS, DO also show increased concentrations during pre-monsoon season due to
turbulent mixing of seawater. DO values during pre-monsoon ranged between 6.8 – 7.9 mg/l.
3.4.6 Biological Oxygen Demand
BOD values were observed to be higher (14.4 – 20 mg/l) than normal range during post-
monsoon season. This could be attributed to decomposition of seaweeds and organic matter
which would have washed off through coastal villages during monsoon. However, during
pre-monsoon BOD attained normal range (0.2 – 2 mg/l) due to increased DO.
Marine Environmental Impact Assessment Report of Kutchh Power Generation Limited, Bhadreswar & Wadala
Villages, Mundra Taluka, Kutchh District
Cholamandalam MS Risk Services - 37 -
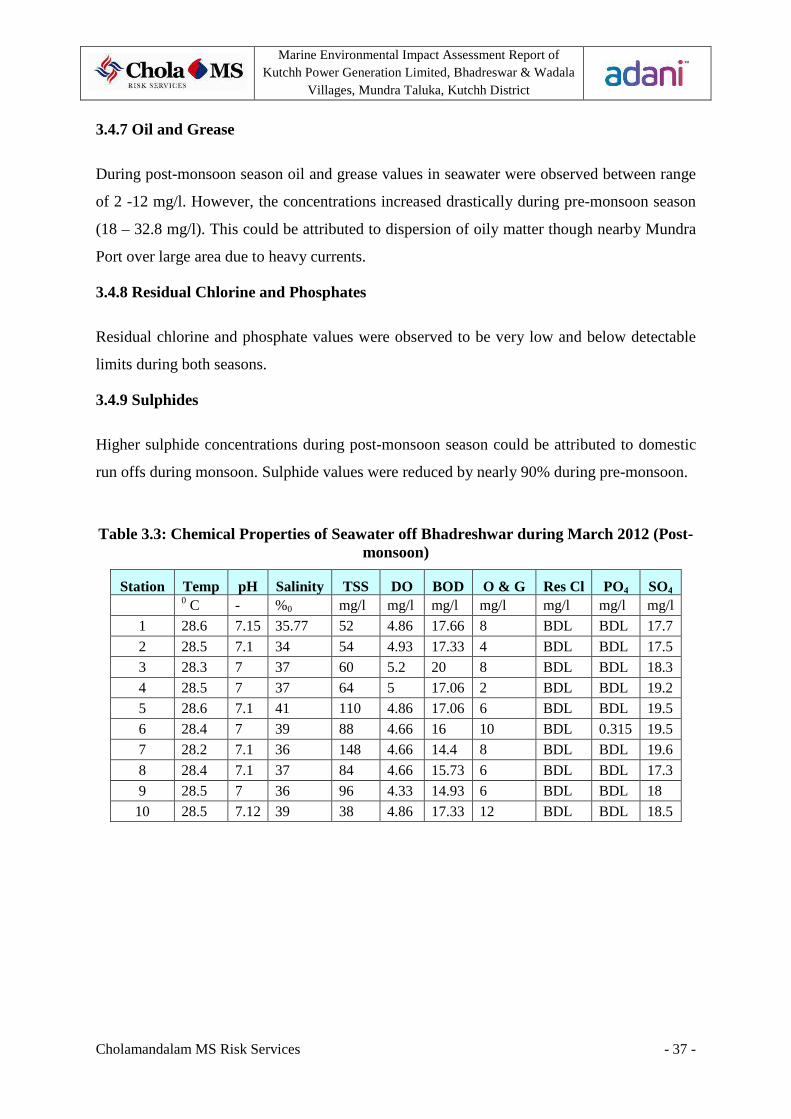
3.4.7 Oil and Grease
During post-monsoon season oil and grease values in seawater were observed between range
of 2 -12 mg/l. However, the concentrations increased drastically during pre-monsoon season
(18 – 32.8 mg/l). This could be attributed to dispersion of oily matter though nearby Mundra
Port over large area due to heavy currents.
3.4.8 Residual Chlorine and Phosphates
Residual chlorine and phosphate values were observed to be very low and below detectable
limits during both seasons.
3.4.9 Sulphides
Higher sulphide concentrations during post-monsoon season could be attributed to domestic
run offs during monsoon. Sulphide values were reduced by nearly 90% during pre-monsoon.
Table 3.3: Chemical Properties of Seawater off Bhadreshwar during March 2012 (Post-monsoon)
Station Temp pH Salinity TSS DO BOD O & G Res Cl PO4 SO4 0 C - %0 mg/l mg/l mg/l mg/l mg/l mg/l mg/l
1 28.6 7.15 35.77 52 4.86 17.66 8 BDL BDL 17.7
2 28.5 7.1 34 54 4.93 17.33 4 BDL BDL 17.5
3 28.3 7 37 60 5.2 20 8 BDL BDL 18.3
4 28.5 7 37 64 5 17.06 2 BDL BDL 19.2
5 28.6 7.1 41 110 4.86 17.06 6 BDL BDL 19.5
6 28.4 7 39 88 4.66 16 10 BDL 0.315 19.5
7 28.2 7.1 36 148 4.66 14.4 8 BDL BDL 19.6
8 28.4 7.1 37 84 4.66 15.73 6 BDL BDL 17.3
9 28.5 7 36 96 4.33 14.93 6 BDL BDL 18
10 28.5 7.12 39 38 4.86 17.33 12 BDL BDL 18.5
Marine Environmental Impact Assessment Report of Kutchh Power Generation Limited, Bhadreswar & Wadala
Villages, Mundra Taluka, Kutchh District
Cholamandalam MS Risk Services - 38 -
Table 3.4: Chemical Properties of Seawater off Bhadreshwar during May 2012 (pre monsoon)
Station Temp pH Salinity TSS DO BOD O & G Res Cl PO4 SO4 0 C - %0 mg/l mg/l mg/l mg/l mg/l mg/l mg/l
1 30 7.35 34.31 1304 7.5 0.2 24 BDL BDL 0.8
2 30 7.52 33.71 2062 7 2 50 BDL BDL 1.6
3 31 7.64 40.94 1582 7.9 1.8 32.8 BDL BDL 1.6
4 31 7.73 36.72 1964 7 1.2 32 BDL BDL 2.4
5 31 7.84 34.31 2378 6.8 0.2 18 BDL BDL 1.6
6 31 7.84 36.12 1608 7.4 1.6 48 BDL BDL 0.8
7 31 7.86 35.52 1802 6.9 0.4 72 BDL BDL 0.8
8 31 7.92 36.72 1438 7.7 1.6 24 BDL BDL 2.4
9 31 7.82 34.31 1706 7.5 1.2 18 BDL BDL 2.4
10 31 7.84 36.12 1976 6.5 0.8 0 BDL BDL 3.2
Legends: Temp – Temperature, TSS – Total Suspended Solids, DO – Dissolved Oxygen,
BOD – Biological Oxygen Demand, O&G – Oil and Gas, Res Cl – Residual Chlorine
Table 3.5: Chemical Properties of Sediments off Bhadreshwar during March 2012 (Post-monsoon)
Texture OC O&G NH3 Cu Pb Cr Zn Fe Ni Cd Hg
% mg/kg mg/kg mg/kg mg/kg mg/kg mg/kg mg/kg mg/kg mg/kg mg/kg
Sandy Loam
0.25 8 8.4 6.5 33.33 3.87 7.43 BDL 3.99 0.35 BDL
Sand 0.036 0 2.8 6.5 33.33 3.87 5.71 BDL 0 0.17 BDL
Sandy Loam
1.62 16 14 8.5 19.99 7.09 8.58 BDL 2.66 BDL BDL
Clay Loam
0.16 12 11.2 5.5 19.99 6.45 9.71 BDL 2.66 0.35 BDL
Sandy Loam
0.018 8 2.8 10.5 26.66 6.45 7.14 BDL 1.33 1.25 BDL
Sandy Loam
0.32 4 8.4 10.5 33.33 6.45 3.71 BDL 2.66 BDL BDL
Sandy Loam
0.018 6 5.6 6.5 6.66 3.87 5.43 64.28 1.33 0.17 BDL
Clay Loam
0.84 10 11.2 9.5 13.33 5.8 9.71 BDL 2.66 BDL BDL
Clay Loam
0.665 4 11.2 6.5 46.66 4.51 6 BDL 3.99 0.89 BDL
Sand 0.054 2 5.6 19 46.66 3.87 6.57 285.72 2.66 BDL BDL

Marine Environmental Impact Assessment Report of Kutchh Power Generation Limited, Bhadreswar & Wadala
Villages, Mundra Taluka, Kutchh District
Cholamandalam MS Risk Services - 39 -
Table 3.6: Chemical Properties of Sediments off Bhadreshwar during May 2012 (pre -monsoon)
Texture OC O&G NH3 Cu Pb Cr Zn Fe Ni Cd Hg
- % mg/kg mg/kg mg/kg mg/kg mg/kg mg/kg mg/kg mg/kg mg/kg mg/kg
Sand 0.45 42 5.6 17.5 53.33 3.87 6.28 277.14 3.99 BDL BDL
Sandy Loam
0.54 0 5.6 8.5 6.66 7.74 6.57 2.85 3.99 BDL BDL
Sandy Loam
0.86 2 2.8 8.5 19.99 4.51 8.28 BDL 2.66 BDL BDL
Clay Loam
1.086 4 16.8 5 33.33 3.87 4.57 4.28 1.33 0.89 BDL
Sandy Loam
0.7 148 2.8 7 13.33 5.8 6.28 BDL 3.99 BDL BDL
Clay Loam
0.36 8 5.6 6.5 19.99 6.45 7.14 BDL 2.66 BDL BDL
Clay Loam
0.96 10 2.8 8.5 19.99 5.16 6 BDL 1.33 BDL BDL
Sandy Loam
0.34 42 11.2 7 26.66 4.51 2.28 BDL 3.99 BDL BDL
Sandy Loam
0.53 26 5.6 8 13.33 3.87 1.14 BDL 2.66 BDL BDL
Sand 0.84 42 11.2 4 6.66 2.58 5.43 41.42 1.33 0.17 BDL
3.5 Flora and Fauna
3.5.1 Phytopigments
Phytoplankton biomass was estimated in terms of concentration of phytopigments. During
post-monsoon season the levels of chlorophyll a (0.36 – 0.96 mg/m3; avg. 0.53 mg/m3) and
phaeophytin (0.31 – 5.11 mg/m3; avg. 2.94 mg/m3) varied in wide range in the coastal waters
off Bhadreshwar. During pre-monsoon season phytopigment concentrations were observed to
be very low due to increased turbidity. Chlorophyll a ranged from 0.01 – 0.03 mg/m3, while
that of phaeophytin ranged from 0.03 – 0.42 mg/m3. The variations from the surface to
bottom were negligible indicating their uniform distribution throughout the water column.
This homogenous nature of the water mass perhaps provided stability for the biological
processes (Table 3.7).
Marine Environmental Impact Assessment Report of Kutchh Power Generation Limited, Bhadreswar & Wadala
Villages, Mundra Taluka, Kutchh District
Cholamandalam MS Risk Services - 40 -
The average concentration of chlorophyll a was often lower or comparable with the
concentration of phaeophytin as commonly observed for coastal waters of the Gulf. The
spatial distribution in phytoplankton pigment concentrations did not show any marked
variation during both seasons.
Table 3.7: Concentartions of Chlorophyll a and Phaeophytin off Bhadreshwar during March and May 2012
Chlorophyll a mg/m3
Phaeophytin mg/m3
March 2012 May 2012 March 2012 May 2012
Station1 0.39 0.01 3.13 0.26
Station 2 0.52 0.02 4.19 0.35
Station 3 0.61 0.02 4.92 0.41
Station4 0.63 0.02 5.11 0.42
Station5 0.36 0.01 2.98 0.25
Station6 0.48 0.02 3.87 0.32
Station7 0.51 0.02 0.41 0.03
Station8 0.39 0.01 0.31 0.03
Station9 0.47 0.02 3.79 0.31
Station10 0.96 0.03 0.78 0.06
3.5.2 Phytoplankton
3.5.2.1 Richness and abundance
Phytoplankton community off Bhadreshwar showed wide variation in abundance though
species richness remained more or less similar over entire study area. However, significant
temporal variations were observed during both seasons. Richness and abundance were
considerably low during pre-monsoon season. This could be attributed to increased turbidity
in study area due to heavy turbulent water and strong winds.
During post-monsoon season maximum number of species (32 nos.) was observed at station
9. Minimum number of species (11 nos.) was observed at station 5. Maximum cell count was
found at station 7 (418 X 103/L), followed by station 8 (317 X 103/L) and Station 5 (298.2 X
103/L). Minimum cell count was found at Station 1 (3.16 X 10³/L) (Table 3.8).

Marine Environmental Impact Assessment Report of Kutchh Power Generation Limited, Bhadreswar & Wadala
Villages, Mundra Taluka, Kutchh District
Cholamandalam MS Risk Services - 41 -
Very high abundance of phytoplankton at Stations 7, 8 and 5 during post-monsoon season are
attributed to Trichodesmium blooms. The communities at these stations were solely
dominated by Trichodesmium with % frequency occurrence > 60.
During pre-monsoon season number of species (23 nos.) was observed at station 9. Minimum
number of species (8 nos.) was observed at station 7. Subsequently maximum cell count was
found at station 9 (4.72 X 10³/L), followed by station 10 (3.86 X 10³/L) and Station 5 (3.72 X
103/L). Minimum cell count was found at Station 7 (0.81 X 10³/L).
3.5.2.1 Species composition and distribution
Overall 39 species of marine phytoplankton were observed from the study area.
Phytoplankton community was dominated by diatoms. Rhizosolenia (avg. % composition
14.04) and Navicula (avg. % composition 25.68) were most dominant genera, which
represented nine species. Other genera like Caloneis ((avg. % composition 9.15) and
Grammatophora ((avg. % composition 8.83) were commonly observed. Occurrence of
Pleurosigma (avg. % composition 4.70) and Thalassiosira (avg. % composition 4.01),
Amphora (avg. % composition 4.32), Nitzschia (avg. % composition 4.06) and Licmophora
(avg. % composition 5.80) were occasional. Other genera like Cymbella, Diploneis and
Melosira were rarely found. (Table 3.9 to 3.16)
Genera like Navicula, Rhizosolenia, Trichodesmium and Pleurosigma were present at all
sampling stations (100% frequency of occurrence). No specific trend was observed on spatial
as well as temporal distribution of phytoplankton.
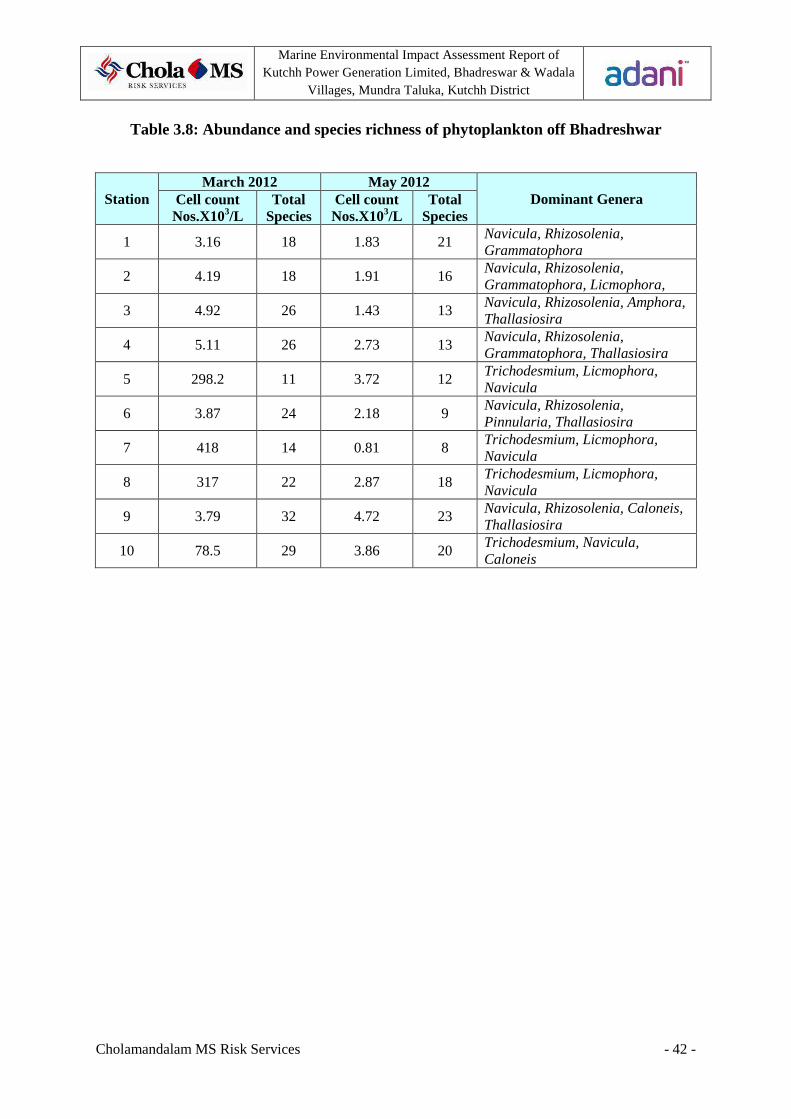
Marine Environmental Impact Assessment Report of Kutchh Power Generation Limited, Bhadreswar & Wadala
Villages, Mundra Taluka, Kutchh District
Cholamandalam MS Risk Services - 42 -
Table 3.8: Abundance and species richness of phytoplankton off Bhadreshwar
Station March 2012 May 2012
Dominant Genera Cell count Nos.X103/L
Total Species
Cell count Nos.X103/L
Total Species
1 3.16 18 1.83 21 Navicula, Rhizosolenia, Grammatophora
2 4.19 18 1.91 16 Navicula, Rhizosolenia, Grammatophora, Licmophora,
3 4.92 26 1.43 13 Navicula, Rhizosolenia, Amphora, Thallasiosira
4 5.11 26 2.73 13 Navicula, Rhizosolenia, Grammatophora, Thallasiosira
5 298.2 11 3.72 12 Trichodesmium, Licmophora, Navicula
6 3.87 24 2.18 9 Navicula, Rhizosolenia, Pinnularia, Thallasiosira
7 418 14 0.81 8 Trichodesmium, Licmophora, Navicula
8 317 22 2.87 18 Trichodesmium, Licmophora, Navicula
9 3.79 32 4.72 23 Navicula, Rhizosolenia, Caloneis, Thallasiosira
10 78.5 29 3.86 20 Trichodesmium, Navicula, Caloneis

Marine Environmental Impact Assessment Report of Kutchh Power Generation Limited, Bhadreswar & Wadala
Villages, Mundra Taluka, Kutchh District
Cholamandalam MS Risk Services - 43 -
Table 3.9: Occurrence of Phytoplankton species along study area off Bhadreshwar during March 2012
Species Station 1 Station 2 Station 3 Station 4 Station 5 Acnanthes brevipes - + + + -
Amphora bigibba - - + + -
Amphora coffeaeformis - - + + -
Amphora costata - - + - -
Amphora turgida + - + + -
Caloneis crassa - - - + +
Caloneis liber - - + + -
Caloneis westii - + + + +
Climacosphenia moniligera - - - - +
Cocconeis pellucida + - + - -
Cocconeis pseudomarginata + - - + +
Coscinodiscus asteromphalus - + + - +
Cylindrotheca closterium - - - - +
Cymbella yarensis - - - - -
Diploneis subovalis - - + - -
Grammatophora hamulifera - - - + -
Grammatophora marina + + - + +
Licmophora abbreviata + + - - -
Licmophora gracilis + + - + -
Mastogloia fimbriata + - + - -
Mastogloia ovata - - + + -
Melosira nummuloides + - - - -
Navicula bacillum + + + + -
Navicula sp + + + + -
Navicula sp - - + + -
Navicula distans + + + + -
Navicula halophila + + + + -
Navicula lyra - + + + -
Navicula sp - - + + -
Nitzschia sp + - + + -
Nitzschia seriata - + + + -
Pinnularia viridis - - - - -
Thalassiothrix sp + + + + -
Thalassiosira sp - + + + -
Rhizosolenia sp - - - - +
Pleurosigma galapagense + + - - -
Pleurosigma sp + + + + +
Rhizosolenia sp + + + + +
Trichodesmium sp + + + + +
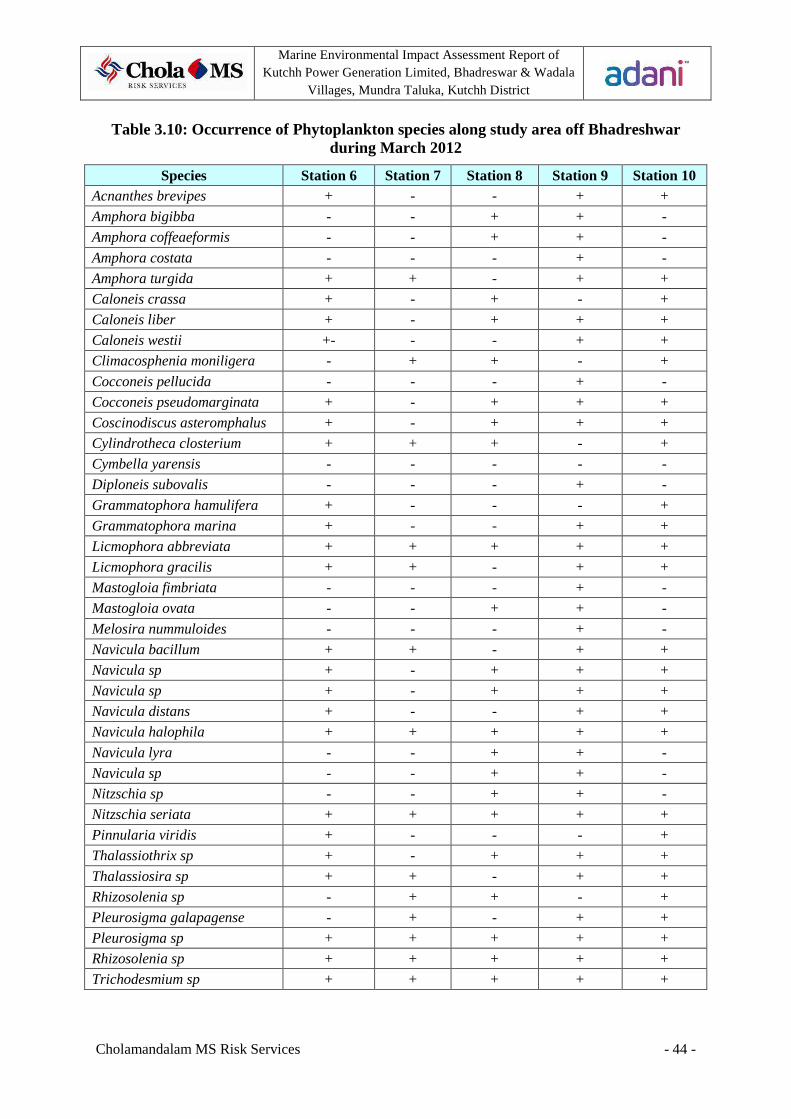
Marine Environmental Impact Assessment Report of Kutchh Power Generation Limited, Bhadreswar & Wadala
Villages, Mundra Taluka, Kutchh District
Cholamandalam MS Risk Services - 44 -
Table 3.10: Occurrence of Phytoplankton species along study area off Bhadreshwar during March 2012
Species Station 6 Station 7 Station 8 Station 9 Station 10 Acnanthes brevipes + - - + +
Amphora bigibba - - + + -
Amphora coffeaeformis - - + + -
Amphora costata - - - + -
Amphora turgida + + - + +
Caloneis crassa + - + - +
Caloneis liber + - + + +
Caloneis westii +- - - + +
Climacosphenia moniligera - + + - +
Cocconeis pellucida - - - + -
Cocconeis pseudomarginata + - + + +
Coscinodiscus asteromphalus + - + + +
Cylindrotheca closterium + + + - +
Cymbella yarensis - - - - -
Diploneis subovalis - - - + -
Grammatophora hamulifera + - - - +
Grammatophora marina + - - + +
Licmophora abbreviata + + + + +
Licmophora gracilis + + - + +
Mastogloia fimbriata - - - + -
Mastogloia ovata - - + + -
Melosira nummuloides - - - + -
Navicula bacillum + + - + +
Navicula sp + - + + +
Navicula sp + - + + +
Navicula distans + - - + +
Navicula halophila + + + + +
Navicula lyra - - + + -
Navicula sp - - + + -
Nitzschia sp - - + + -
Nitzschia seriata + + + + +
Pinnularia viridis + - - - +
Thalassiothrix sp + - + + +
Thalassiosira sp + + - + +
Rhizosolenia sp - + + - +
Pleurosigma galapagense - + - + +
Pleurosigma sp + + + + +
Rhizosolenia sp + + + + +
Trichodesmium sp + + + + +

Marine Environmental Impact Assessment Report of Kutchh Power Generation Limited, Bhadreswar & Wadala
Villages, Mundra Taluka, Kutchh District
Cholamandalam MS Risk Services - 45 -
Table 3.11: Occurrence of Phytoplankton species along study area off Bhadreshwar during May 2012
Species Station 1 Station 2 Station 3 Station 4 Station 5 Acnanthes bravipes - - - - + Caloneis liber + + - - - Caloneis westii + + + + + Climacosphenia moniligera - - + - + Cocconeis pellucida + + + - + Cylindrotheca closterium - - + - - Diatoma vugare - - + - + Grammatophora marina + - - - - Gyrosigma balticum - - - - + Licmophora gracilis + + + + + Mastogloia fimbriata + + + + - Mastogloia ovata - - - + - Melosira nummuloides + - - - - Navicula bacillum + + + + + Navicula disclusa + + - - - Navicula distans - + + + + Navicula halophila + + + + + Navicula lyra + + - + - Navicula ramossisima + + - - - Nitzschia capuluspalae + - - - - Nitzschia seriata + - - - - Nitzschia ventricosa + - - - - Pleurosigma angulatum + + + + - Pleurosigma galapagense + - - - - Plagiotropis vitrae + + - + + Pseudoeunotia doliolus + + - + + Rhizosolenia sp + + + + - Trachyneis aspera + + + + -
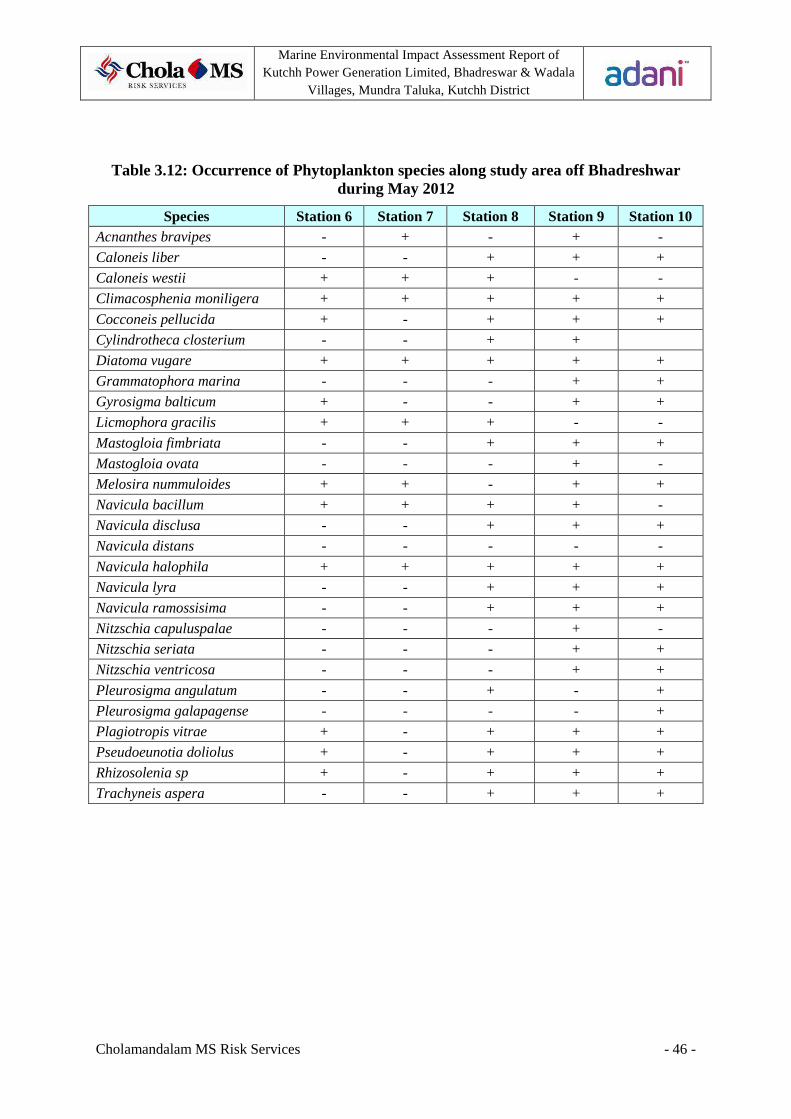
Marine Environmental Impact Assessment Report of Kutchh Power Generation Limited, Bhadreswar & Wadala
Villages, Mundra Taluka, Kutchh District
Cholamandalam MS Risk Services - 46 -
Table 3.12: Occurrence of Phytoplankton species along study area off Bhadreshwar during May 2012
Species Station 6 Station 7 Station 8 Station 9 Station 10 Acnanthes bravipes - + - + -
Caloneis liber - - + + +
Caloneis westii + + + - -
Climacosphenia moniligera + + + + +
Cocconeis pellucida + - + + +
Cylindrotheca closterium - - + +
Diatoma vugare + + + + +
Grammatophora marina - - - + +
Gyrosigma balticum + - - + +
Licmophora gracilis + + + - -
Mastogloia fimbriata - - + + +
Mastogloia ovata - - - + -
Melosira nummuloides + + - + +
Navicula bacillum + + + + -
Navicula disclusa - - + + +
Navicula distans - - - - -
Navicula halophila + + + + +
Navicula lyra - - + + +
Navicula ramossisima - - + + +
Nitzschia capuluspalae - - - + -
Nitzschia seriata - - - + +
Nitzschia ventricosa - - - + +
Pleurosigma angulatum - - + - +
Pleurosigma galapagense - - - - +
Plagiotropis vitrae + - + + +
Pseudoeunotia doliolus + - + + +
Rhizosolenia sp + - + + +
Trachyneis aspera - - + + +

Marine Environmental Impact Assessment Report of Kutchh Power Generation Limited, Bhadreswar & Wadala
Villages, Mundra Taluka, Kutchh District
Cholamandalam MS Risk Services - 47 -
Table 3.13: Percentage composition of Phytoplankton species along study area off Bhadreshwar during March 2012
Species Station 1 Station 2 Station 3 Station 4 Station 5 Acnanthes brevipes 0.00 2.04 3.16 3.61 0.00
Amphora bigibba 0.00 0.00 2.11 1.20 0.00
Amphora coffeaeformis 0.00 0.00 3.16 1.20 0.00
Amphora costata 0.00 0.00 1.05 0.00 0.00
Amphora turgida 1.33 0.00 7.37 4.82 0.00
Caloneis crassa 0.00 0.00 0.00 1.20 1.43
Caloneis liber 0.00 0.00 1.05 3.61 0.00
Caloneis westii 0.00 6.12 6.32 7.23 1.43
Climacosphenia moniligera 0.00 0.00 0.00 0.00 5.71
Cocconeis pellucida 4.87 0.00 1.05 0.00 0.00
Cocconeis pseudomarginata 0.88 0.00 0.00 1.20 1.43
Coscinodiscus asteromphalus 0.00 2.04 2.11 0.00 1.43
Cylindrotheca closterium 0.00 0.00 0.00 0.00 1.43
Cymbella yarensis 0.00 0.00 0.00 0.00 0.00
Diploneis subovalis 0.00 0.00 2.11 0.00 0.00
Grammatophora hamulifera 0.00 0.00 0.00 4.82 0.00
Grammatophora marina 10.18 6.12 0.00 3.61 1.02
Licmophora abbreviata 7.52 6.12 0.00 0.00 0.00
Licmophora gracilis 1.77 2.04 0.00 3.61 0.00
Mastogloia fimbriata 1.33 0.00 3.16 0.00 0.00
Mastogloia ovata 0.00 0.00 1.05 1.20 0.00
Melosira nummuloides 7.08 0.00 0.00 0.00 0.00
Navicula bacillum 0.88 4.08 4.21 4.82 0.00
Navicula sp 1.33 2.04 2.11 2.41 0.00
Navicula sp 0.00 0.00 4.21 3.61 0.00
Navicula distans 4.87 4.08 15.79 9.64 0.00
Navicula halophila 1.77 6.12 6.32 3.61 0.00
Navicula lyra 0.00 2.04 3.16 2.41 0.00
Navicula sp 0.00 0.00 2.11 2.41 0.00
Nitzschia sp 1.33 0.00 2.11 2.41 0.00
Nitzschia seriata 0.00 2.04 1.05 3.61 0.00
Pinnularia viridis 0.00 0.00 0.00 0.00 0.00
Thalassiothrix sp 1.33 6.12 3.16 3.61 0.00
Thalassiosira sp 0.00 4.08 5.26 9.64 0.00
Rhizosolenia sp 0.00 0.00 0.00 0.00 1.43
Pleurosigma galapagense 0.88 4.08 0.00 0.00 0.00
Pleurosigma sp 1.77 8.16 4.21 4.82 0.80
Rhizosolenia sp 47.35 28.57 11.58 6.02 1.03
Trichodesmium sp 3.54 4.08 1.05 3.61 82.86
Total 100 100 100 100 100
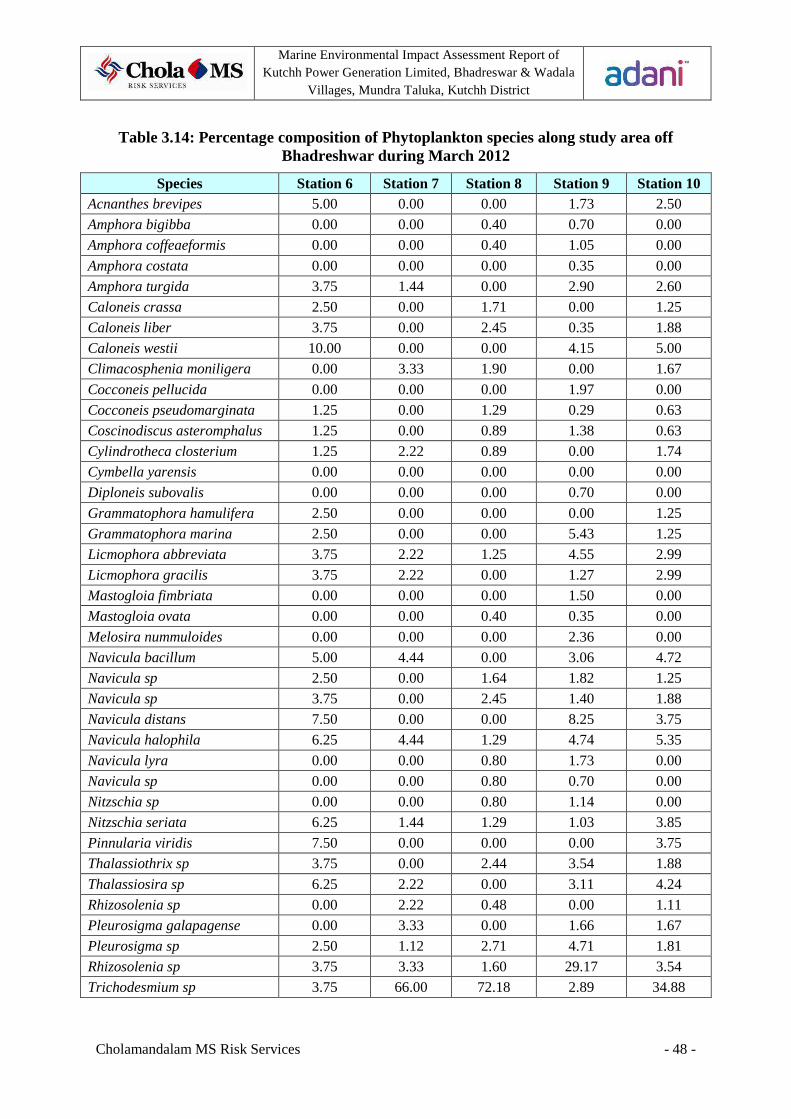
Marine Environmental Impact Assessment Report of Kutchh Power Generation Limited, Bhadreswar & Wadala
Villages, Mundra Taluka, Kutchh District
Cholamandalam MS Risk Services - 48 -
Table 3.14: Percentage composition of Phytoplankton species along study area off Bhadreshwar during March 2012
Species Station 6 Station 7 Station 8 Station 9 Station 10 Acnanthes brevipes 5.00 0.00 0.00 1.73 2.50
Amphora bigibba 0.00 0.00 0.40 0.70 0.00
Amphora coffeaeformis 0.00 0.00 0.40 1.05 0.00
Amphora costata 0.00 0.00 0.00 0.35 0.00
Amphora turgida 3.75 1.44 0.00 2.90 2.60
Caloneis crassa 2.50 0.00 1.71 0.00 1.25
Caloneis liber 3.75 0.00 2.45 0.35 1.88
Caloneis westii 10.00 0.00 0.00 4.15 5.00
Climacosphenia moniligera 0.00 3.33 1.90 0.00 1.67
Cocconeis pellucida 0.00 0.00 0.00 1.97 0.00
Cocconeis pseudomarginata 1.25 0.00 1.29 0.29 0.63
Coscinodiscus asteromphalus 1.25 0.00 0.89 1.38 0.63
Cylindrotheca closterium 1.25 2.22 0.89 0.00 1.74
Cymbella yarensis 0.00 0.00 0.00 0.00 0.00
Diploneis subovalis 0.00 0.00 0.00 0.70 0.00
Grammatophora hamulifera 2.50 0.00 0.00 0.00 1.25
Grammatophora marina 2.50 0.00 0.00 5.43 1.25
Licmophora abbreviata 3.75 2.22 1.25 4.55 2.99
Licmophora gracilis 3.75 2.22 0.00 1.27 2.99
Mastogloia fimbriata 0.00 0.00 0.00 1.50 0.00
Mastogloia ovata 0.00 0.00 0.40 0.35 0.00
Melosira nummuloides 0.00 0.00 0.00 2.36 0.00
Navicula bacillum 5.00 4.44 0.00 3.06 4.72
Navicula sp 2.50 0.00 1.64 1.82 1.25
Navicula sp 3.75 0.00 2.45 1.40 1.88
Navicula distans 7.50 0.00 0.00 8.25 3.75
Navicula halophila 6.25 4.44 1.29 4.74 5.35
Navicula lyra 0.00 0.00 0.80 1.73 0.00
Navicula sp 0.00 0.00 0.80 0.70 0.00
Nitzschia sp 0.00 0.00 0.80 1.14 0.00
Nitzschia seriata 6.25 1.44 1.29 1.03 3.85
Pinnularia viridis 7.50 0.00 0.00 0.00 3.75
Thalassiothrix sp 3.75 0.00 2.44 3.54 1.88
Thalassiosira sp 6.25 2.22 0.00 3.11 4.24
Rhizosolenia sp 0.00 2.22 0.48 0.00 1.11
Pleurosigma galapagense 0.00 3.33 0.00 1.66 1.67
Pleurosigma sp 2.50 1.12 2.71 4.71 1.81
Rhizosolenia sp 3.75 3.33 1.60 29.17 3.54
Trichodesmium sp 3.75 66.00 72.18 2.89 34.88
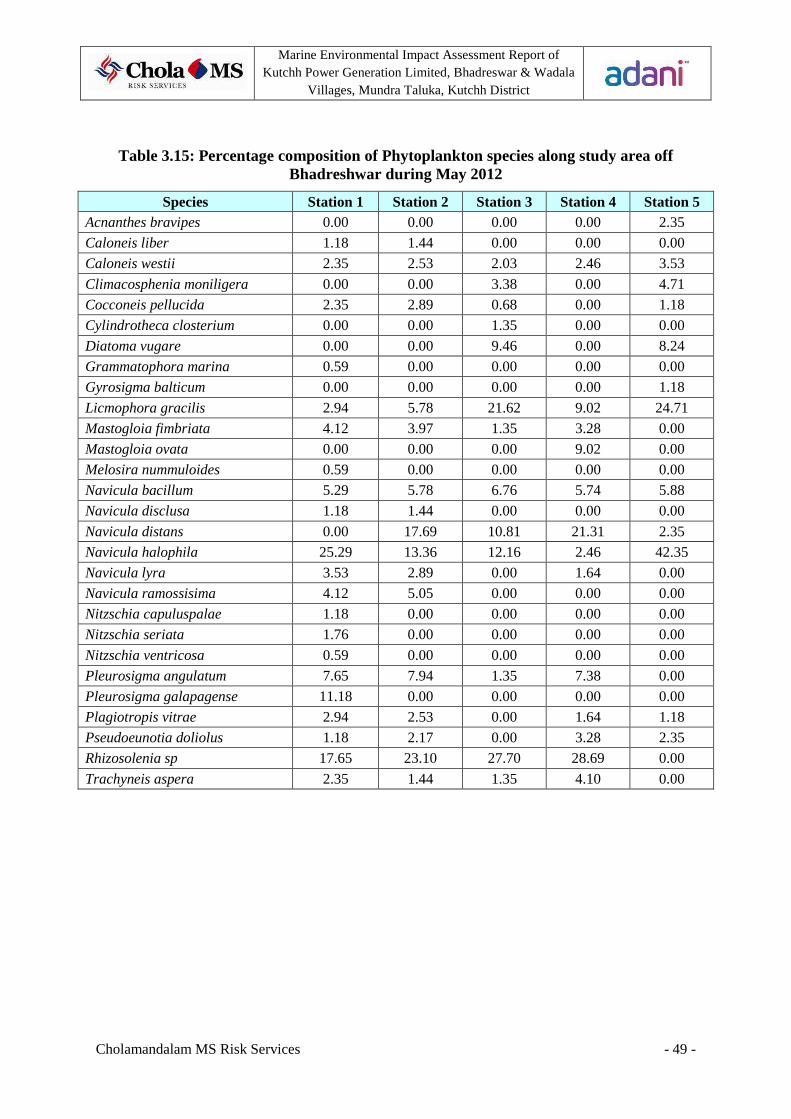
Marine Environmental Impact Assessment Report of Kutchh Power Generation Limited, Bhadreswar & Wadala
Villages, Mundra Taluka, Kutchh District
Cholamandalam MS Risk Services - 49 -
Table 3.15: Percentage composition of Phytoplankton species along study area off Bhadreshwar during May 2012
Species Station 1 Station 2 Station 3 Station 4 Station 5 Acnanthes bravipes 0.00 0.00 0.00 0.00 2.35
Caloneis liber 1.18 1.44 0.00 0.00 0.00
Caloneis westii 2.35 2.53 2.03 2.46 3.53
Climacosphenia moniligera 0.00 0.00 3.38 0.00 4.71
Cocconeis pellucida 2.35 2.89 0.68 0.00 1.18
Cylindrotheca closterium 0.00 0.00 1.35 0.00 0.00
Diatoma vugare 0.00 0.00 9.46 0.00 8.24
Grammatophora marina 0.59 0.00 0.00 0.00 0.00
Gyrosigma balticum 0.00 0.00 0.00 0.00 1.18
Licmophora gracilis 2.94 5.78 21.62 9.02 24.71
Mastogloia fimbriata 4.12 3.97 1.35 3.28 0.00
Mastogloia ovata 0.00 0.00 0.00 9.02 0.00
Melosira nummuloides 0.59 0.00 0.00 0.00 0.00
Navicula bacillum 5.29 5.78 6.76 5.74 5.88
Navicula disclusa 1.18 1.44 0.00 0.00 0.00
Navicula distans 0.00 17.69 10.81 21.31 2.35
Navicula halophila 25.29 13.36 12.16 2.46 42.35
Navicula lyra 3.53 2.89 0.00 1.64 0.00
Navicula ramossisima 4.12 5.05 0.00 0.00 0.00
Nitzschia capuluspalae 1.18 0.00 0.00 0.00 0.00
Nitzschia seriata 1.76 0.00 0.00 0.00 0.00
Nitzschia ventricosa 0.59 0.00 0.00 0.00 0.00
Pleurosigma angulatum 7.65 7.94 1.35 7.38 0.00
Pleurosigma galapagense 11.18 0.00 0.00 0.00 0.00
Plagiotropis vitrae 2.94 2.53 0.00 1.64 1.18
Pseudoeunotia doliolus 1.18 2.17 0.00 3.28 2.35
Rhizosolenia sp 17.65 23.10 27.70 28.69 0.00
Trachyneis aspera 2.35 1.44 1.35 4.10 0.00

Marine Environmental Impact Assessment Report of Kutchh Power Generation Limited, Bhadreswar & Wadala
Villages, Mundra Taluka, Kutchh District
Cholamandalam MS Risk Services - 50 -
Table 3.16: Percentage composition of Phytoplankton species along study area off Bhadreshwar during May 2012
Species Station 6 Station 7 Station 8 Station 9 Station 10 Acnanthes bravipes 0.00 2.17 0.00 0.39 0.00
Caloneis liber 0.00 0.00 0.48 0.44 0.39
Caloneis westii 2.68 4.35 2.34 0.00 0.00
Climacosphenia moniligera 5.37 8.70 1.13 2.24 2.91
Cocconeis pellucida 1.34 0.00 1.19 1.41 1.20
Cylindrotheca closterium 0.00 0.00 0.45 0.23 0.00
Diatoma vugare 8.72 13.04 3.15 4.40 5.33
Grammatophora marina 0.00 0.00 0.00 0.10 0.07
Gyrosigma balticum 1.34 0.00 0.00 0.42 0.31
Licmophora gracilis 20.13 19.57 12.14 0.00 0.00
Mastogloia fimbriata 0.00 0.00 2.87 2.12 1.95
Mastogloia ovata 0.00 0.00 0.00 1.50 0.00
Melosira nummuloides 1.34 2.17 0.00 0.32 0.51
Navicula bacillum 5.37 6.52 6.09 5.80 0.00
Navicula disclusa 0.00 0.00 0.48 0.44 0.39
Navicula distans 0.00 0.00 0.00 0.00 0.00
Navicula halophila 20.13 43.48 28.94 50.53 55.31
Navicula lyra 0.00 0.00 1.51 1.34 1.20
Navicula ramossisima 0.00 0.00 1.68 1.53 1.36
Nitzschia capuluspalae 0.00 0.00 0.00 0.20 0.00
Nitzschia seriata 0.00 0.00 0.00 0.29 0.22
Nitzschia ventricosa 0.00 0.00 0.00 0.10 0.07
Pleurosigma angulatum 0.00 0.00 5.56 0.00 3.73
Pleurosigma galapagense 0.00 0.00 0.00 0.00 1.40
Plagiotropis vitrae 1.34 0.00 1.39 1.60 1.38
Pseudoeunotia doliolus 2.68 0.00 1.81 1.94 1.68
Rhizosolenia sp 29.53 0.00 26.50 21.11 19.15
Trachyneis aspera 0.00 0.00 2.30 1.54 1.44

Marine Environmental Impact Assessment Report of Kutchh Power Generation Limited, Bhadreswar & Wadala
Villages, Mundra Taluka, Kutchh District
Cholamandalam MS Risk Services - 51 -
3.5.3 Zooplankton
3.5.3.1 Abundance and richness
Zooplankton community off Bhadreshwar exhibited very diverse population and high
abundance during post-monsoon season. Altogether 14 different faunal groups were recorded
from the study area. Maximum groups were observed at station 5 (12 groups), while
minimum groups were observed at Stations 2, 4 and 9 (9 groups). It was evident that there
was not much variation in spatial distribution (abundance as well as richness) of
zooplanktons over entire study area. Maximum zooplanktons were observed at Station 9
(141.59 X 10³/100 m3), while that of minimum were observed at Station 5 (83.88 X 10³/100
m3). High abundance of zooplanktons at Stations 7, 8 and 9 were associated with
phytoplankton bloom at respective stations (Table 3.17).
During pre-monsoon season zooplankton abundance was reduced drastically. This was
attributed to lower primary productivity, turbulent water and increased turbidity. Only 21
faunal groups were observed during this season. Maximum groups (12 nos) were recorded
from Station 10 while that of minimum (3 nos) were recorded from Station 8. Maximum
abundance was observed at Station 10 (32.5 X 10³/100 m3) followed by Station 6 (31.2 X
103/100 m3). Minimum abundance was observed at Station 8 (8.1 X 10³/100 m3) (Table
3.18).
3.5.3.2 Composition
During post-monsoon season zooplankton community was mainly dominated by Copepods
(avg. % composition 21.8) Chaetognaths (avg. % composition 16.31) and Decapods (avg. %
composition 15.23). Fish larvae (avg. % composition 8.06), Ostracods (avg. % composition
5.07), Amphipods (avg. % composition 5.22) and Mysids (avg. % composition 6.75) were
commonly found. Occurrence of Stomatopods, Gastropods and Isopods were occasional
(Table 3.19 and 3.21).
Hydromedusae were present at all stations along with Copepods, Decapods and
Chaetognaths. Size of zooplankton community varied from several microns to centimeters.

Marine Environmental Impact Assessment Report of Kutchh Power Generation Limited, Bhadreswar & Wadala
Villages, Mundra Taluka, Kutchh District
Cholamandalam MS Risk Services - 52 -
During pre-monsoon season very entirely dominated by copepods and chaetognaths. Other
groups were rarely observed. There was major shift in groups dominating zooplankton
community. Hydromedusae were totally absent in entire study region (Table 3.20 and 3.22).
Table 3.17: Abundance and group richness of zooplankton off Bhadreshwar during March 2012
Station Total Count
Nos.X 103/100 m3
Biomass
ml/100 m3
Total Groups Dominant groups
1 113.39 4.8 10 Copepods, Decapods, Chaetognaths, Siphonophores, Isopods
2 103.47 3.9 9 Copepods, Decapods, Chaetognaths, Siphonophores, Amphipods
3 106.07 3.7 10 Copepods, Decapods, Chaetognaths, Gastropods, Mysids, Isopods
4 99.808 3.3 9 Copepods, Chaetognaths, Mysids
5 83.887 2.4 12 Copepods, Chaetognaths, Fish larvae
6 101.49 6.2 11 Copepods, Decapods, Chaetognaths, Siphonophores
7 135.35 6.6 10 Copepods, Decapods, Chaetognaths, Siphonophores
8 125.98 3.5 10 Copepods, Chaetognaths, Stomatopods
9 141.59 5.9 9 Copepods, Chaetognaths, Stomatopods
10 111.26 4.7 11 Copepods, Decapods, Chaetognaths

Marine Environmental Impact Assessment Report of Kutchh Power Generation Limited, Bhadreswar & Wadala
Villages, Mundra Taluka, Kutchh District
Cholamandalam MS Risk Services - 53 -
Table 3.18: Abundance and group richness of zooplankton off Bhadreshwar during May 2012
Station Total Count
Nos.X 103/100 m3
Biomass
ml/100 m3
Total Groups Dominant Group
station 1 21.5 0.7 6 Copepods, Chaetognaths
station 2 29.4 1.0 5 Copepods, Chaetognaths
station 3 11.3 0.4 6 Copepods, Chaetognaths
station 4 10.4 0.4 7 Copepods, Chaetognaths
station 5 18.5 0.6 6 Copepods, Chaetognaths
station 6 31.2 1.1 7 Copepods, Chaetognaths
station 7 14.6 0.5 5 Copepods, Chaetognaths
station 8 8.1 0.3 3 Copepods, Chaetognaths
station 9 16.2 0.6 6 Copepods, Chaetognaths
station 10 32.5 1.1 12 Copepods, Chaetognaths
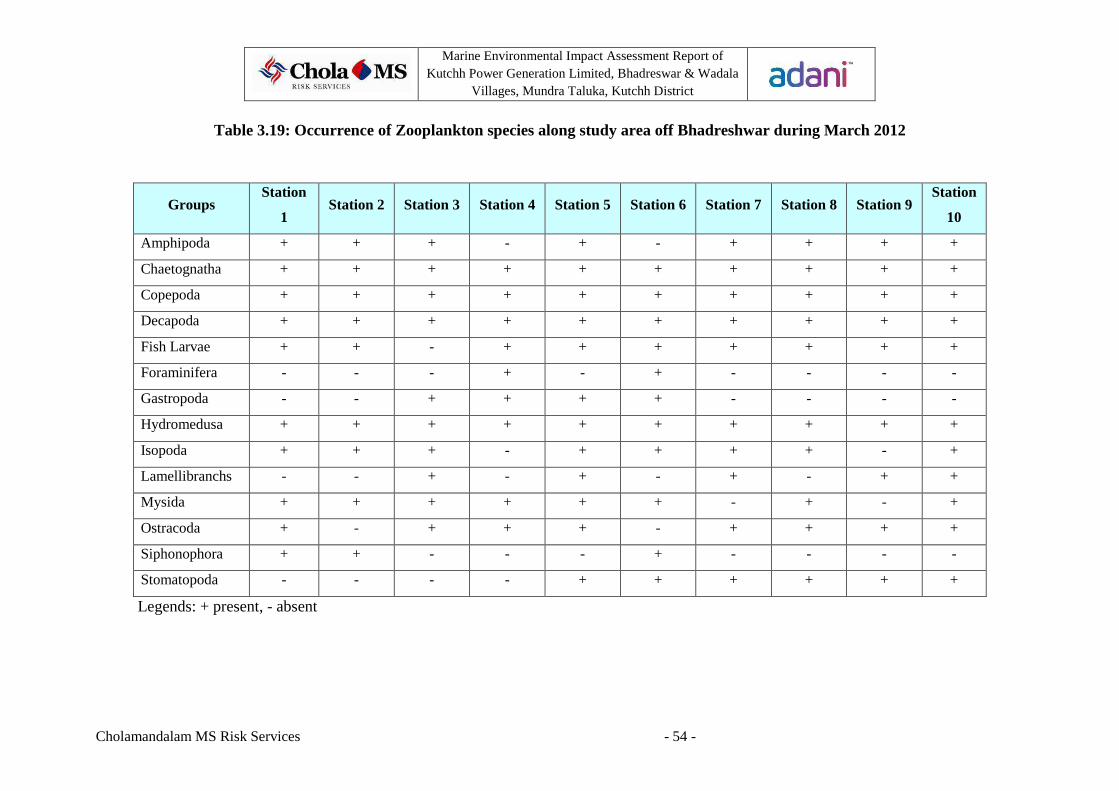
Marine Environmental Impact Assessment Report of Kutchh Power Generation Limited, Bhadreswar & Wadala
Villages, Mundra Taluka, Kutchh District
Cholamandalam MS Risk Services - 54 -
Table 3.19: Occurrence of Zooplankton species along study area off Bhadreshwar during March 2012
Groups Station
1 Station 2 Station 3 Station 4 Station 5 Station 6 Station 7 Station 8 Station 9
Station
10
Amphipoda + + + - + - + + + +
Chaetognatha + + + + + + + + + +
Copepoda + + + + + + + + + +
Decapoda + + + + + + + + + +
Fish Larvae + + - + + + + + + +
Foraminifera - - - + - + - - - -
Gastropoda - - + + + + - - - -
Hydromedusa + + + + + + + + + +
Isopoda + + + - + + + + - +
Lamellibranchs - - + - + - + - + +
Mysida + + + + + + - + - +
Ostracoda + - + + + - + + + +
Siphonophora + + - - - + - - - -
Stomatopoda - - - - + + + + + +
Legends: + present, - absent

Marine Environmental Impact Assessment Report of Kutchh Power Generation Limited, Bhadreswar & Wadala
Villages, Mundra Taluka, Kutchh District
Cholamandalam MS Risk Services - 55 -
Table 3.20: Occurrence of Zooplankton species along study area off Bhadreshwar during May 2012
Faunal Groups station 1
station 2
station 3
station 4
station 5
station 6
station 7
station 8
station 9
station 10
Acetes sp + - - - - - + - - +
Amphipods - - - - - - - - - +
Appendicularians - - + - - + - + - -
Chaetognaths + + + + + + + + + +
Cladocerans - - - - - + - - + +
Copepods + + + + + + + + + +
Cumaceans - - - - + - - - - -
Decapod larvae - - - - + - - - - -
Fish eggs + - + - - - - - - +
Fish larvae - - - - - - - - - -
Gastropods + - - - - - - - - +
Isopods + - - - - - + - - +
Lamellibranchs - - + - - + - - - -
Lucifer sp - + - - + - - - + -
Marine insects - - - - + - - - - +
Medusae - + - + - - - - + +
Mysids - - - + - - + - - +
Ostracods - - - + - + - - - -
Polychaetes - - - + - - - - - -
Siphonophores - + - + - - - - + +
Stomatopods - - + - - + - - - -
Legends: + present, - absent

Marine Environmental Impact Assessment Report of Kutchh Power Generation Limited, Bhadreswar & Wadala
Villages, Mundra Taluka, Kutchh District
Cholamandalam MS Risk Services - 56 -
Table 3.21: Percentage composition of Zooplankton species along study area off Bhadreshwar during March 2012
Groups Station 1 Station 2 Station 3 Station 4 Station 5 Station 6 Station 7 Station 8 Station 9 Station
10 Amphipoda 5.08 5.71 8.16 0.00 6.38 0.00 5.56 8.33 6.25 6.71
Chaetognatha 20.34 18.00 24.49 11.54 12.77 17.65 11.11 13.89 18.75 14.58
Copepoda 20.34 25.71 26.53 36.54 17.02 20.53 22.22 16.67 14.58 17.82
Decapoda 16.95 25.71 11.37 7.69 23.40 8.82 16.67 8.33 18.75 14.58
Fish Larvae 5.08 10.00 0.00 7.69 6.38 11.76 4.10 11.11 14.58 9.93
Foraminifera 0.00 0.00 0.00 5.77 0.00 5.88 0.00 0.00 0.00 0.00
Gastropoda 0.00 0.00 6.12 11.54 5.34 2.94 0.00 0.00 0.00 0.00
Hydromedusa 1.34 1.48 0.89 0.86 1.04 0.98 1.45 2.78 4.17 2.80
Isopoda 6.78 2.86 6.12 0.00 8.51 5.88 5.56 5.56 0.00 3.71
Lamellibranchs 0.00 0.00 4.08 0.00 2.13 0.00 2.78 0.00 4.17 2.32
Mysida 6.78 2.86 8.16 15.38 8.51 14.71 0.00 8.33 0.00 2.78
Ostracoda 5.08 0.00 4.08 2.99 4.26 0.00 11.11 8.33 6.25 8.56
Siphonophora 12.23 7.67 0.00 0.00 0.00 8.82 19.44 0.00 0.00 6.48
Stomatopoda 0.00 0.00 0.00 0.00 4.26 2.03 0.00 16.67 12.50 9.72
Total 100.00 100.00 100.00 100.00 100.00 100.00 100.00 100.00 100.00 100.00

Marine Environmental Impact Assessment Report of Kutchh Power Generation Limited, Bhadreswar & Wadala
Villages, Mundra Taluka, Kutchh District
Cholamandalam MS Risk Services - 57 -
Table 3.22: Percentage composition of Zooplankton species along study area off Bhadreshwar during May 2012
Faunal Groups station 1
station 2
station 3
station 4 station 5 station
6 station
7 station
8 station
9 station
10 Acetes sp 2.42 0.00 0.00 0.00 0.00 0.00 10.91 0.00 0.00 3.64
Amphipods 0.00 0.00 0.00 0.00 0.00 0.00 0.00 0.00 0.00 1.37
Appendicularians 0.00 0.00 1.51 0.00 0.00 2.01 0.00 0.76 0.00 0.00
Chaetognaths 21.10 20.08 19.07 22.68 23.93 20.19 19.17 27.88 24.87 20.18
Cladocerans 0.00 0.00 0.00 0.00 0.00 0.46 0.00 0.00 0.46 0.46
Copepods 70.98 75.80 75.56 67.41 67.20 73.10 55.73 71.35 71.13 65.00
Cumaceans 0.00 0.00 0.00 0.00 2.42 0.00 0.00 0.00 0.00 0.00
Decapod larvae 0.00 0.00 0.00 0.00 3.92 0.00 0.00 0.00 0.00 0.00
Fish eggs 0.92 0.00 0.46 0.00 0.00 0.00 0.00 0.00 0.00 0.46
Fish larvae 0.00 0.00 0.00 0.00 0.00 0.00 0.00 0.00 0.00 0.00
Gastropods 3.64 0.00 0.00 0.00 0.00 0.00 0.00 0.00 0.00 0.92
Isopods 0.94 0.00 0.00 0.00 0.00 0.00 12.26 0.00 0.00 1.89
Lamellibranchs 0.00 0.00 1.37 0.00 0.00 1.37 0.00 0.00 0.00 0.00
Lucifer sp 0.00 1.02 0.00 0.00 1.84 0.00 0.00 0.00 1.38 0.00
Marine insects 0.00 0.00 0.00 0.00 0.68 0.00 0.00 0.00 0.00 3.42
Medusae 0.00 1.21 0.00 2.42 0.00 0.00 0.00 0.00 1.21 1.21
Mysids 0.00 0.00 0.00 2.19 0.00 0.00 1.93 0.00 0.00 0.50
Ostracods 0.00 0.00 0.00 1.96 0.00 1.96 0.00 0.00 0.00 0.00
Polychaetes 0.00 0.00 0.00 0.50 0.00 0.00 0.00 0.00 0.00 0.00
Siphonophores 0.00 1.89 0.00 2.83 0.00 0.00 0.00 0.00 0.94 0.94
Stomatopods 0.00 0.00 2.03 0.00 0.00 0.91 0.00 0.00 0.00 0.00

Marine Environmental Impact Assessment Report of Kutchh Power Generation Limited, Bhadreswar & Wadala
Villages, Mundra Taluka, Kutchh District
Cholamandalam MS Risk Services - 58 -
3.5.4 Benthos
Depending upon their size, benthic animals are divided into three categories, microfauna,
meiofauna and macrofauna. Benthic community responses to environmental perturbations are
useful in assessing the impact of anthropogenic perturbations on environmental quality.
Macrobenthic organisms which are considered for the present study are animal species with
body size larger than 0.5 mm. The macrofauna was constituted mainly by amphipods,
polychaetes, gastropods and cumaceans. The total number of faunal groups varied from 3
(Station 7) to 10 (Station 4). Overall about 13 groups of intertidal macrobenthos were
recorded off Bhadreshwar during the present investigation.
The benthic community indicates wide variations in the faunal standing stock in the region
and no clear trend in the distribution is discernible, suggesting high patchiness in the
distribution of subtidal macrobenthos, The faunal distribution revealed low diversity (avg. 7
groups) with a low variability (3 – 10 groups).
Maximum number of benthic fauna was found at Station 2 (988/m2) while that of minimum
was at Station 8 (65/m2) (Table 3.23).
No specific trends were observed in distribution of benthic fauna over spatial and temporal
variations. However, during pre-monsoon season benthos biomass was observed to be
reduced due to decreased productivity (Table 3.24). Maximum organisms were observed at
Station 7 (544/m2), however, the community was dominated by Gastropods. Minimum count
was recorded from Station 5 and Station 9 (5/m2).

Marine Environmental Impact Assessment Report of Kutchh Power Generation Limited, Bhadreswar & Wadala
Villages, Mundra Taluka, Kutchh District
Cholamandalam MS Risk Services - 59 -
Table 3.23: Macrobenthos off Bhadreshwar during March 2012
Station Total Count
Nos./m2
Biomass
gm/m2 Total
Groups Dominant groups
1 479 1.48 6 Gastropods, Amphipods, Isopods
2 988 5.74 9 Gastropods, Mysids, Polychaetes
3 616 1.25 8 Gastropods, Isopods, Ostracods
4 672 3.26 10 Gastropods, Isopods, Amphipods
5 489 1.37 8 Gastropods, Mysids, Anomurans
6 26 1.07 7 Gastropods, Amphipods, Isopods
7 326 0.92 3 Gastropods, Isopods
8 65 0.24 6 Gastropods
9 130 0.37 7 Gastropods
10 211 0.41 9 Gastropods, Isopods, Amphipods
Table 3.24: Macrobenthos off Bhadreshwar during May 2012
Station Total Count
Nos./m2
Biomass
gm/m2 Total
Groups Dominant groups
1 115 1.5 6 Gastropods, Cumaceans, Isopods
2 271 7.5 9 Gastropods, Polychaetes
3 483 1.5 5 Gastropods, Isopods
4 48 1.3 4 Gastropods, Isopods
5 5 0.0 2 Gastropods
6 19 0.7 5 Gastropods
7 544 1.6 2 Gastropods, Isopods
8 15 0.2 5 Gastropods
9 5 0.0 3 Gastropods
10 149 0.3 5 Gastropods, Isopods

Marine Environmental Impact Assessment Report of Kutchh Power Generation Limited, Bhadreswar & Wadala
Villages, Mundra Taluka, Kutchh District
Cholamandalam MS Risk Services - 60 -
Table 3.25: Occurrence of macrobenthos along study area off Bhadreshwar during March 2012
Group Station 1 Station 2 Station 3
Station 4
Station 5 Station 6 Station 7 Station
8 Station 9 Station 10
Amphipods 41 13 25 14 0 7 0 1 0 19
Anomurans 0 13 0 5 21 0 0 0 0 8
Brachyurans 0 1 0 0 1 0 0 0 0 0
Cumaceans 28 0 13 5 2 1 0 1 0 10
Gastropods 415 776 296 499 420 15 275 59 110 79
Isopods 15 67 242 108 7 6 45 3 13 88
Mysids 0 84 17 21 22 2 0 1 1 0
Ostracods 15 5 40 8 11 1 0 1 2 16
Pelecypods 0 0 0 0 5 1 6 0 1 0
Penaeids 0 27 0 12 0 0 0 0 0 8
Polychaetes 6 15 0 10 0 0 0 0 2 0
Pycnogonids 0 0 4 4 0 0 0 0 0 2
Tanaids 0 0 4 0 0 0 0 0 1 1
Total 479 988 616 672 489 26 326 65 130 211

Marine Environmental Impact Assessment Report of Kutchh Power Generation Limited, Bhadreswar & Wadala
Villages, Mundra Taluka, Kutchh District
Cholamandalam MS Risk Services - 61 -
Table 3.26: Occurrence of macrobenthos along study area off Bhadreshwar during May 2012
Faunal Groups Station 1 Station 2 Station 3 Station 4 Station 5 Station 6 Station 7 Station 8 Station 9 Station 10
Amphipods 4 18 4 6 0 4 0 1 0 14
Anomurans 0 18 0 0 0 0 0 0 0 0
Cumaceans 27 0 16 0 0 1 0 1 0 7
Gastropods 48 118 365 25 4 9 468 7 3 58
Isopods 15 88 86 14 1 4 77 4 0 64
Ostracods 15 7 12 3 0 1 0 1 1 0
Penaeids 0 4 0 0 0 0 0 0 0 6
Polychaetes 6 20 0 0 0 0 0 0 1 0
Total 115 271 483 48 5 19 544 15 5 149

Marine Environmental Impact Assessment Report of Kutchh Power Generation Limited, Bhadreswar & Wadala
Villages, Mundra Taluka, Kutchh District
Cholamandalam MS Risk Services - 62 -
3.6 Fishery
The prevailing fishery status of the region off Bhadreshwar is evaluated on the basis of data
from the Department of Fisheries, Government of Gujarat and observations made on fish
landing centres. Along the northern coast of the outfall location, fishing by trawlers is
common particularly off Bhadreshwar, Luni, Mundra and Tunda. Depending on the
topography of the coast and type of fishing, necessary modifications are made to economise
fishing operations by local operators. Small, plank built canoes and traditional crafts like the
sail boat locally known as "Machuwa" are also deployed for fishing. The gears commonly
used by these traditional crafts are drift nets, gill nets and large bag nets.
Observations made at Luni and Bhadreshwar fish landing centres exhibited of 22 groups of
fishes, prawns and other crustaceans which includes crabs, cephalopods and Squilla.
Harpadon nehereus, Johnius glaucus, Coilia dussumieri, Arius caelatus, Otolithes sp,
Pampus argenteus, Scoliodon laticaudus, Thryssa sp, Otolithus sp, Exhippolysmata
ensirostris, Neptunus pelagicus and Metapenaeus sp. The other common species were Sillago
sihama, Valamugil seheli, Polynemus tetradactylus, Scomberomorus guttatus, Thryssa
hamiltoni, Lepturacanthus savala, Parapenaeopsis stylifera, Thryssa vitrirostris and
Charybdis cruciata.
Navinal, Jarpara, Mundra, Shekhadia, Luni, Bhadreshwar and Dhrab are the seven major fish
landing centres in the Mundra region. However, their contribution to the district landing was
meagre. The composition of fish landings at these centres revealed the incidence of 22
different groups; the common groups being Bombay duck, Coilia sp, mullet, cat fish, ribbon
fish, white pomfret, small sciaenids, shrimps and prawns. Total catch at Bhadreshwar and
Luni was observed to be constatnt over a period of five years. However, there is sharp
decrease in catch rate at Shekhadia, Navinal and Zarpara. This could be attributed to heavy
maritime traffic at Mundra Port. Data pertaining to fish landings and fishermen from Navinal,
Zarpara, Dhrab, Mundra, Chenkhedia, Luni and Bhadreshwar are given in Table 3.27.

Marine Environmental Impact Assessment Report of Kutchh Power Generation Limited, Bhadreswar & Wadala
Villages, Mundra Taluka, Kutchh District
Cholamandalam MS Risk Services - 63 -
Table 3.27: Details of fish landing and fishermen from major fish landing centres around Bhadreshwar
Source: Fisheries Department Bhuj, Kutch
Table 3.28: Species wise composition of fish landing at Bhadreshwar during 2009-2010
Name of fish Mundra Zarpara Navinal Bhadreshwar White pomfret 8.3 0.7 14.4 49.5
Black pomfret 0 0 0 0
Bombay duck 344.1 30.7 379.1 707.9
Jew fish 0 0 17 7.5
Hilsa 0 7.1 3 1.3
Other clupeids 59.9 46.8 35.2 156.8
Coilia 235.8 3.8 197.1 288.6
Shark 0.2 12.6 34.6 22.8
Mullet 28.9 19.3 31.9 46.9
Cat fish 22.8 23.9 46.8 70
Eel 0 0 5.3 0
Seer fish 4.3 4.7 12.5 3.1
Indian salmon 5.6 10.9 17.4 0.7
Leather jacket 0 12.6 12 0
Ribbon fish 28.8 7.6 22.8 112.9
Silver bar 15 3.2 12.8 50.3
Small sciaenids 60.3 23.8 71.6 159.2
Shrimps 73.1 58 60.8 180.5
Prawns (medium) 22.6 6.3 13 38
Location of Fisheries
Total no. of Fishermans
Active Fisherman
No. of Boat with
machine
No. of Fisheries (Lakh)
(2006-07)
No. of Fisheries (Lakh) (2007-
08)
No. of Fisheries (Lakh) (2008-
09)
No. of Fisheries (Lakh) (2009-
10)
No. of Fisheries (Lakh) (2010-
11)
Bhadreshwar 1095 531 120 2262696 3259451 1835793 2580720 2054989
Luni 1279 932 115 1843535 2273979 1520767 1062850 1019962
Shekhadia 478 322 41 315063 170604 137256 27852 65506
Navinal 115 90 14 641823 259126 594755 - -
Zarpara 585 443 35 1044300 444305 451234 - 101464
Dhrabh 101 16 - 998910 1808595 1377559 1396203 -
Mundra 326 160 81 1330296 618824 1912840 1013956 989131
Total 3979 2494 406
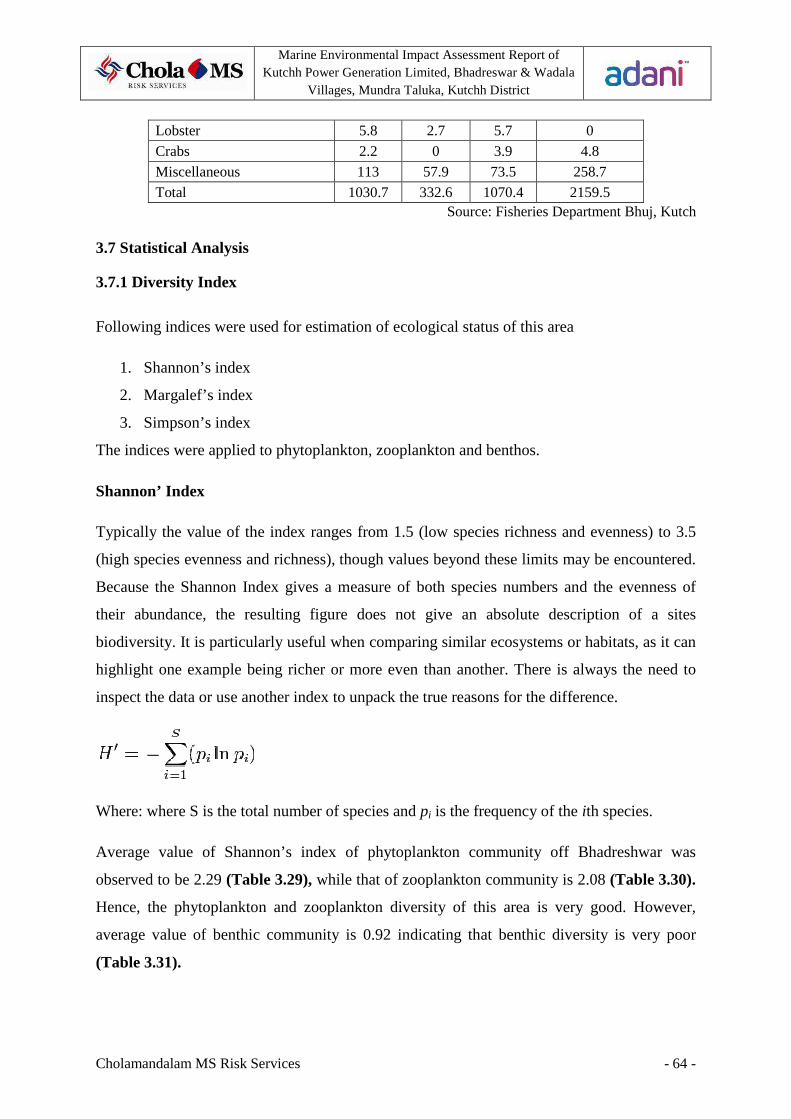
Marine Environmental Impact Assessment Report of Kutchh Power Generation Limited, Bhadreswar & Wadala
Villages, Mundra Taluka, Kutchh District
Cholamandalam MS Risk Services - 64 -
Lobster 5.8 2.7 5.7 0
Crabs 2.2 0 3.9 4.8
Miscellaneous 113 57.9 73.5 258.7
Total 1030.7 332.6 1070.4 2159.5 Source: Fisheries Department Bhuj, Kutch
3.7 Statistical Analysis
3.7.1 Diversity Index
Following indices were used for estimation of ecological status of this area
1. Shannon’s index
2. Margalef’s index
3. Simpson’s index
The indices were applied to phytoplankton, zooplankton and benthos.
Shannon’ Index
Typically the value of the index ranges from 1.5 (low species richness and evenness) to 3.5
(high species evenness and richness), though values beyond these limits may be encountered.
Because the Shannon Index gives a measure of both species numbers and the evenness of
their abundance, the resulting figure does not give an absolute description of a sites
biodiversity. It is particularly useful when comparing similar ecosystems or habitats, as it can
highlight one example being richer or more even than another. There is always the need to
inspect the data or use another index to unpack the true reasons for the difference.
Where: where S is the total number of species and pi is the frequency of the ith species.
Average value of Shannon’s index of phytoplankton community off Bhadreshwar was
observed to be 2.29 (Table 3.29), while that of zooplankton community is 2.08 (Table 3.30).
Hence, the phytoplankton and zooplankton diversity of this area is very good. However,
average value of benthic community is 0.92 indicating that benthic diversity is very poor
(Table 3.31).

Marine Environmental Impact Assessment Report of Kutchh Power Generation Limited, Bhadreswar & Wadala
Villages, Mundra Taluka, Kutchh District
Cholamandalam MS Risk Services - 65 -
Margalef’s Index
It is calculated from the total number of species presentand the abundance or total number of
individuals.
Margalef Index (D) = S – 1/ log e N
Where: S – total number of species
N – total number of individuals
The higher the index the greater is the diversity. Average value of Margalef’s index for
phytoplankton was observed to be 4.52, while that of zooplankton was 2.0. Benthos exhibited
very low diversity index of 1.15.
Simpson’s Index
Simpson's Index measures the probability that two individuals randomly selected from a
sample will belong to the same species (or some category other than species).
Simpson's Index λ = ∑ n(n-1)/N(N-1)
Where: n – total individuals of each species
N – total individuals of all species
With this index, 0 represents infinite diversity and 1, no diversity. That is, the bigger the
value of D, the lower the diversity. This is neither intuitive nor logical, so to get over this
problem, D is often subtracted from 1 to give:
Simpson's Index of Diversity 1 - λ
The value of this index also ranges between 0 and 1, but now, the greater the value, the
greater the sample diversity. This makes more sense. In this case, the index represents the
probability that two individuals randomly selected from a sample will belong to different
species.
Simpson index values of phytoplankton and zooplankton are very close to 1 (0.76 and 0.86,
respectively) indicating high diversity. Whereas for benthos this value was close to 0 (0.45)
indicating poor diversity (Table 3.31).
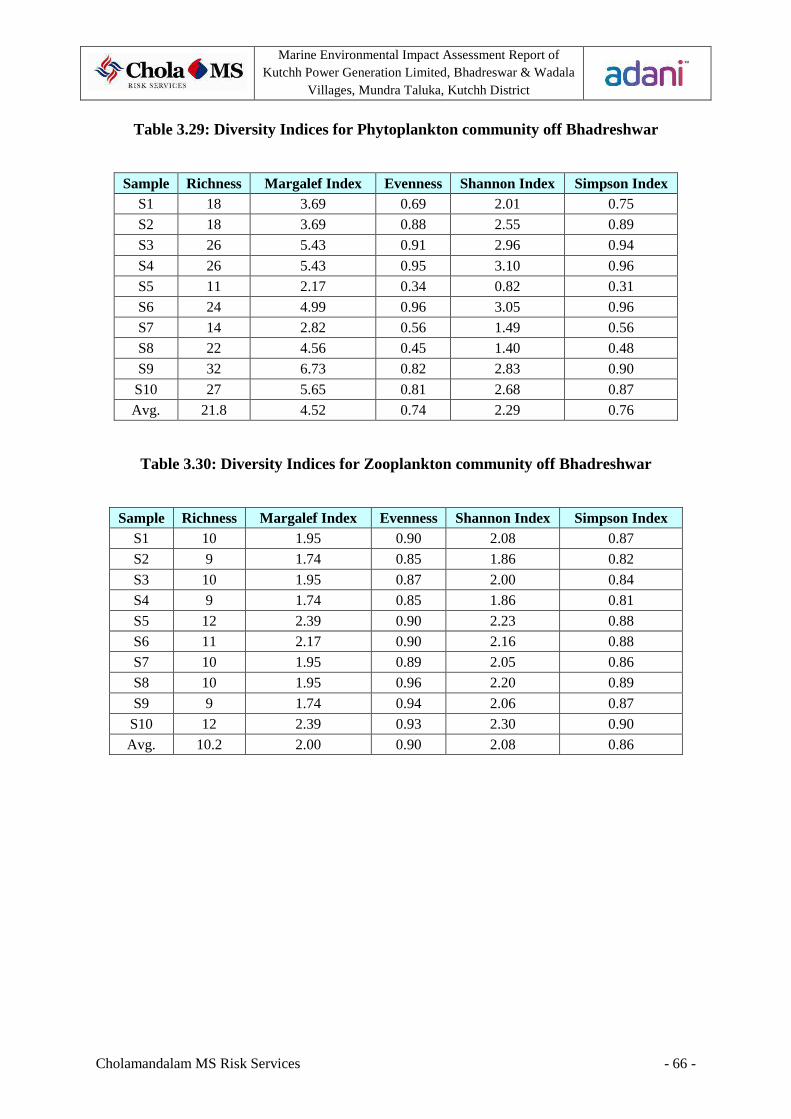
Marine Environmental Impact Assessment Report of Kutchh Power Generation Limited, Bhadreswar & Wadala
Villages, Mundra Taluka, Kutchh District
Cholamandalam MS Risk Services - 66 -
Table 3.29: Diversity Indices for Phytoplankton community off Bhadreshwar
Sample Richness Margalef Index Evenness Shannon Index Simpson Index S1 18 3.69 0.69 2.01 0.75
S2 18 3.69 0.88 2.55 0.89
S3 26 5.43 0.91 2.96 0.94
S4 26 5.43 0.95 3.10 0.96
S5 11 2.17 0.34 0.82 0.31
S6 24 4.99 0.96 3.05 0.96
S7 14 2.82 0.56 1.49 0.56
S8 22 4.56 0.45 1.40 0.48
S9 32 6.73 0.82 2.83 0.90
S10 27 5.65 0.81 2.68 0.87
Avg. 21.8 4.52 0.74 2.29 0.76
Table 3.30: Diversity Indices for Zooplankton community off Bhadreshwar
Sample Richness Margalef Index Evenness Shannon Index Simpson Index S1 10 1.95 0.90 2.08 0.87
S2 9 1.74 0.85 1.86 0.82
S3 10 1.95 0.87 2.00 0.84
S4 9 1.74 0.85 1.86 0.81
S5 12 2.39 0.90 2.23 0.88
S6 11 2.17 0.90 2.16 0.88
S7 10 1.95 0.89 2.05 0.86
S8 10 1.95 0.96 2.20 0.89
S9 9 1.74 0.94 2.06 0.87
S10 12 2.39 0.93 2.30 0.90
Avg. 10.2 2.00 0.90 2.08 0.86

Marine Environmental Impact Assessment Report of Kutchh Power Generation Limited, Bhadreswar & Wadala
Villages, Mundra Taluka, Kutchh District
Cholamandalam MS Risk Services - 67 -
Table 3.31: Diversity Indices for Benthos community off Bhadreshwar
Sample Richness Margalef Index Evenness Shannon Index Simpson Index
S1 6 0.80 0.44 0.79 0.35
S2 9 1.16 0.41 0.89 0.39
S3 8 1.08 0.61 1.26 0.64
S4 10 1.38 0.43 0.99 0.44
S5 8 1.13 0.30 0.63 0.26
S6 7 1.72 0.76 1.49 0.73
S7 3 0.35 0.45 0.49 0.27
S8 6 1.19 0.28 0.49 0.20
S9 7 1.23 0.31 0.61 0.28
S10 9 1.47 0.71 1.56 0.73
Avg. 7.3 1.15 0.47 0.92 0.43
3.7.2 Abundance – Biomass Comparison
The abundance/biomass comparison (ABC) method was proposed by Warwick in 1986. He
suggested on theoretical considerations that the distribution of the numbers of individuals
among species should differ from the distribution of biomass among species when influenced
by pollution-induced disturbance. This difference can be shown easily by K-dominance plots.
The curves rank species in order of importance on the x-axis and show the percentage of each
species on the total numbers or biomass on a cumulative scale (called percentage dominance)
on the y-axis. When the community is approaching equilibrium, the biomass becomes
increasingly dominated by one or a few large species, each represented by few individuals.
The numerical dominants are smaller species. Hence, when plotted as K-dominance curves,
'numerical diversity' is greater than 'biomass diversity', so that the line for abundance lies well
below the line for biomass, since one species forms a much larger proportion of the total
biomass than it does of the total numbers. Under stress (natural physical and biological or
pollution-induced disturbance), large competitive dominants get eliminated and biomass and
abundance curves lies close together and crossing one or several times. Under severe
disturbance, faunal communities become increasingly dominated by one or a few very small
species and few larger species are present. Hence 'numerical diversity' is lower than 'biomass
diversity' where, line for biomass lies well below the line for abundance.
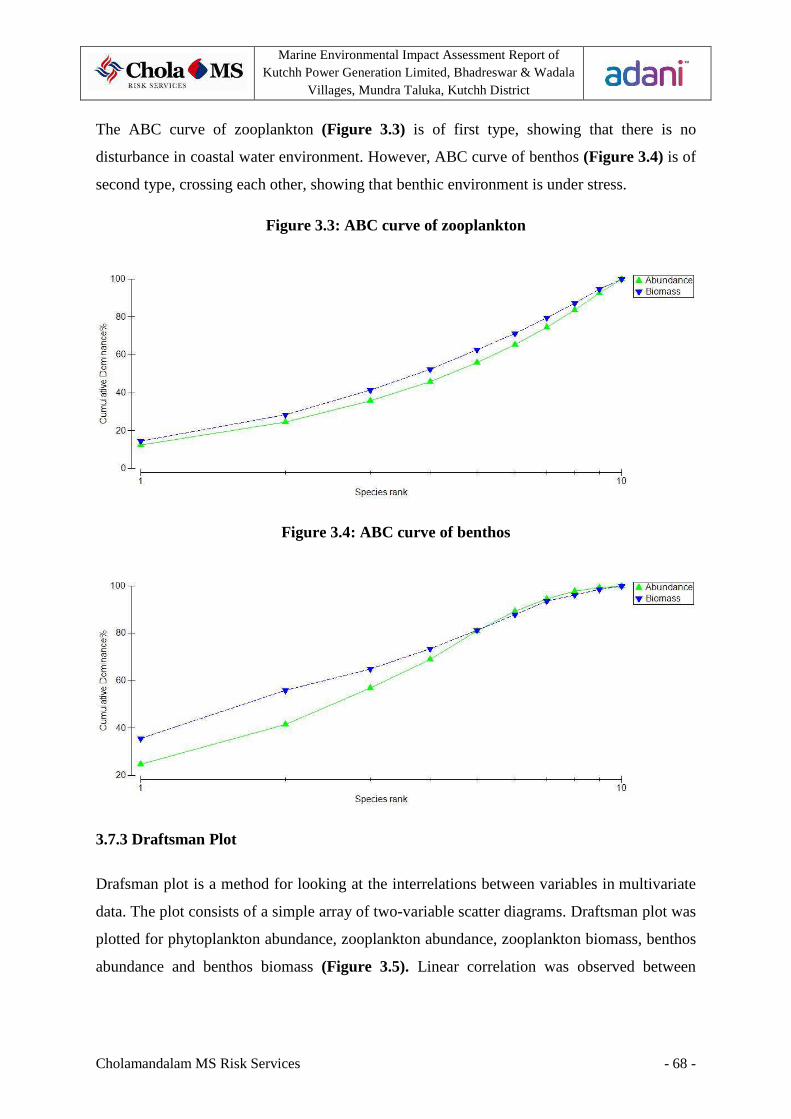
Marine Environmental Impact Assessment Report of Kutchh Power Generation Limited, Bhadreswar & Wadala
Villages, Mundra Taluka, Kutchh District
Cholamandalam MS Risk Services - 68 -
The ABC curve of zooplankton (Figure 3.3) is of first type, showing that there is no
disturbance in coastal water environment. However, ABC curve of benthos (Figure 3.4) is of
second type, crossing each other, showing that benthic environment is under stress.
Figure 3.3: ABC curve of zooplankton
Figure 3.4: ABC curve of benthos
3.7.3 Draftsman Plot
Drafsman plot is a method for looking at the interrelations between variables in multivariate
data. The plot consists of a simple array of two-variable scatter diagrams. Draftsman plot was
plotted for phytoplankton abundance, zooplankton abundance, zooplankton biomass, benthos
abundance and benthos biomass (Figure 3.5). Linear correlation was observed between

Marine Environmental Impact Assessment Report of Kutchh Power Generation Limited, Bhadreswar & Wadala
Villages, Mundra Taluka, Kutchh District
Cholamandalam MS Risk Services - 69 -
zooplankton abundance and zooplankton biomass, as well as between benthos abundance and
benthos biomass.
Figure 3.5: Draftsman Plot of marine biological parameters
3.8 Coastal Eco-systems within the impact zone (mangroves, coastal biological components)
No mangroves, seagrasses, seaweed beds, sand dunes or corals were observed within study
area. Open mudflats are present in the upper intertidal region however, very less biological
activity was observed on mudflats. No Boleopthalmus species (mud skipper) was recorded on
these mudflats.
3.9 Socio-economics with respect to fisheries
According to the primary survey, around 6% of the households reported practicing fishing as
a main occupation. This is limited to the villages like Bhadreshwar, Luni, Mundra, Nani
Bhujpur, Sekhadia and Zarapara villages. Most of the fishing is done as an enterprise and not
as wage labour in the region. Only 9% are laborers. Around 49% have own boats, and nearly
80% have their own nets. Those do not have boats are practicing Pagadia (foot) fishing on
the shores. On an average, fishing households earns from 20,000/- to 40,000/- per season
depending on whether households owns a boat or not. This income is reduced to half during
the off-season. Detailed socio-economic report is added as Annexure IV.
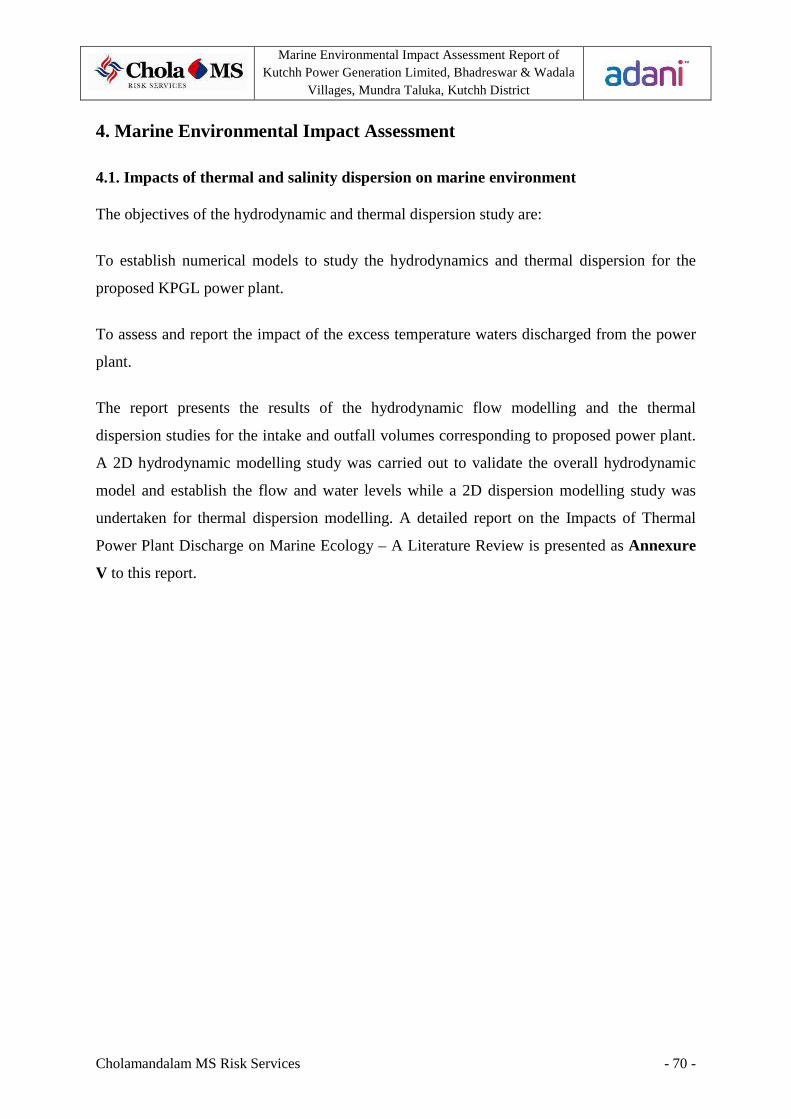
Marine Environmental Impact Assessment Report of Kutchh Power Generation Limited, Bhadreswar & Wadala
Villages, Mundra Taluka, Kutchh District
Cholamandalam MS Risk Services - 70 -
4. Marine Environmental Impact Assessment
4.1. Impacts of thermal and salinity dispersion on marine environment
The objectives of the hydrodynamic and thermal dispersion study are:
To establish numerical models to study the hydrodynamics and thermal dispersion for the
proposed KPGL power plant.
To assess and report the impact of the excess temperature waters discharged from the power
plant.
The report presents the results of the hydrodynamic flow modelling and the thermal
dispersion studies for the intake and outfall volumes corresponding to proposed power plant.
A 2D hydrodynamic modelling study was carried out to validate the overall hydrodynamic
model and establish the flow and water levels while a 2D dispersion modelling study was
undertaken for thermal dispersion modelling. A detailed report on the Impacts of Thermal
Power Plant Discharge on Marine Ecology – A Literature Review is presented as Annexure
V to this report.
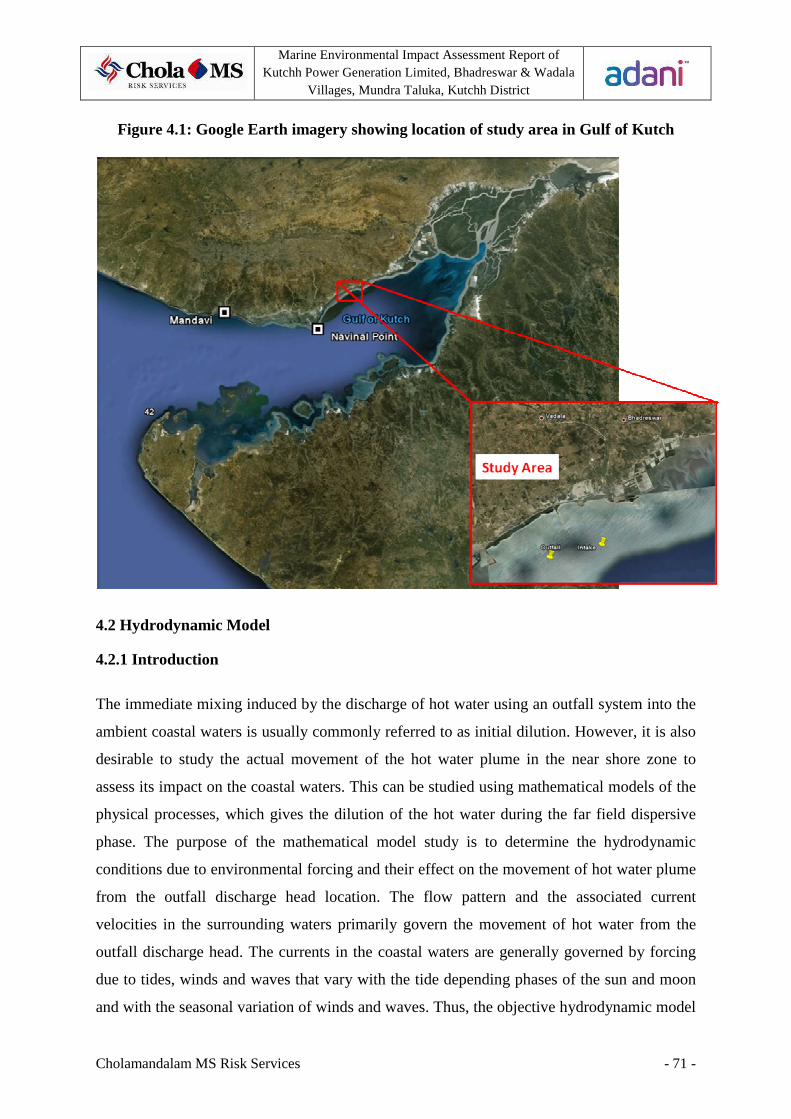
Marine Environmental Impact Assessment Report of Kutchh Power Generation Limited, Bhadreswar & Wadala
Villages, Mundra Taluka, Kutchh District
Cholamandalam MS Risk Services - 71 -
Figure 4.1: Google Earth imagery showing location of study area in Gulf of Kutch
4.2 Hydrodynamic Model
4.2.1 Introduction
The immediate mixing induced by the discharge of hot water using an outfall system into the
ambient coastal waters is usually commonly referred to as initial dilution. However, it is also
desirable to study the actual movement of the hot water plume in the near shore zone to
assess its impact on the coastal waters. This can be studied using mathematical models of the
physical processes, which gives the dilution of the hot water during the far field dispersive
phase. The purpose of the mathematical model study is to determine the hydrodynamic
conditions due to environmental forcing and their effect on the movement of hot water plume
from the outfall discharge head location. The flow pattern and the associated current
velocities in the surrounding waters primarily govern the movement of hot water from the
outfall discharge head. The currents in the coastal waters are generally governed by forcing
due to tides, winds and waves that vary with the tide depending phases of the sun and moon
and with the seasonal variation of winds and waves. Thus, the objective hydrodynamic model
Marine Environmental Impact Assessment Report of Kutchh Power Generation Limited, Bhadreswar & Wadala
Villages, Mundra Taluka, Kutchh District
Cholamandalam MS Risk Services - 72 -
study would be to determine the movement of the hot water discharge from the outfall
discharge head location due to the prevailing tide and wind conditions.
4.2.2 Model Setup
The numerical flow model applied in the present study is the MIKE 21 HD (Hydrodynamic)
module of the comprehensive 2-dimensional MIKE 21 modelling suite from DHI Water &
Environment. The HD module is the basic module of the system and is used in the simulation
of hydrodynamics and related phenomena in lakes, estuaries, bays, coastal areas and seas
where flow stratification can be neglected, which is the case in the shallow coastal areas of
the project area. The water levels and flows are resolved on a rectangular grid covering the
area of interest.
Currents in the area are mainly driven by the astronomical tides in the Gulf of Kutch, but also
meteorological effects such as varying barometric pressure and local winds generated by
passing weather systems play a role in the generation of currents, especially during extreme
events which can generate extreme currents.
The applied MIKE 21 HD model requires the following main input for flow simulations:
• Bathymetry of the area
• Bed resistance (Manning number)
• Hydrographic boundary conditions (water levels or fluxes)
• Wind and/or barometric pressure in the area.
The MIKE 21 HD model computes the water depth (water level) and fluxes for each time
step and at each grid point of the model.

Marine Environmental Impact Assessment Report of Kutchh Power Generation Limited, Bhadreswar & Wadala
Villages, Mundra Taluka, Kutchh District
Cholamandalam MS Risk Services - 73 -
Figure 4.2: Hydrodynamic model setup for Gulf of Kutch and local mesh
4.2.3 Bathymetry
The Bathymetry data used for the modelling were derived from C-Map, and GEBCO data for
the overall model and included the Survey Data for the local model. The models vertical
datum is transformed from Chart Datum (CD) to Mean Sea Level of Navinal Point (i.e 3.38m
above CD), which is nearest port in Admiralty tide tables. While the horizontal datum is
WGS-84 UTM 42.
A fine resolution local nested model with grid spacing of 90m, 30m covering the coastline off
Bhadreshwar of Kutch District, has been setup to simulate the currents, flushing and thermal
dispersion studies. Figure 4.4, shows the 90m model with 30m nested bathymetry used for
the simulations with calibration point off Mundra port.

Marine Environmental Impact Assessment Report of Kutchh Power Generation Limited, Bhadreswar & Wadala
Villages, Mundra Taluka, Kutchh District
Cholamandalam MS Risk Services - 74 -
4.2.4 Local bathymetry
A local model bathymetry is generated for the existing situation with 30m grid spacing for
proposed power plant region for the HD and AD simulations to study the currents, flushing
and thermal dispersion over the region.
Figure 4.3: Local Bathymetry of Kutch Power Generation Limited, at Bhadreshwar

Marine Environmental Impact Assessment Report of Kutchh Power Generation Limited, Bhadreswar & Wadala
Villages, Mundra Taluka, Kutchh District
Cholamandalam MS Risk Services - 75 -
Figure 4.4: Local bathymetry mesh model
4.2.5 Physical processes
The various physical processes that play a major role in the effluent release and its dilution
and removal from the area of release are tide, currents and circulation.
The coastal environment off Wadala - Bhadreswar forms an integral part of Gulf. Hence, the
knowledge of the general ecology of the Gulf is necessary to understand the site- specific
environmental conditions with that of the parent body.
The circulation in the Gulf is mainly controlled by the tidal flows and bathymetry though
wind effect also prevail some extent. The maximum surface currents are moderate (0.7-1.2
m/s) but increases considerably (2.0-2.5m/s) in the central portion of the Gulf. The spring
currents are 60 to 65% stronger than the neap currents. The bottom currents are also periodic
with a velocity normally 70% of the surface currents.
With high tidal range, negligible land run-off and irregularities in topography, the waters are
vertically homogeneous in terms of salinity and temperature.

Marine Environmental Impact Assessment Report of Kutchh Power Generation Limited, Bhadreswar & Wadala
Villages, Mundra Taluka, Kutchh District
Cholamandalam MS Risk Services - 76 -
Central portion of the gulf extending from the mouth to upstream of Sikka is rocky with
sediment confined only to the margins. The near shore sediment, which consists of light gray
silt and clay and fine sand with patches of coarse sand in between, are poorly sorted with
highly variable skewness. The major source of this sediment is considered to be the shore
material and the load transported by the Indus river.
4.2.6 Tides
Tide levels recorded at Mundra port are compared with the predicted tide at Kandla Port in
the following Table.
Table 4.1: Tidal heights observed at Mundra and Kandla
Tides Mundra Kandla
Spring High Water 6.09 7.04
Spring Low Water 5.65 6.84
Neap High Water 1.81 2.50
Neap Low Water 0.37 0.17
The mean sea level at the Mundra Port (Bocha Creek) is estimated at 3.31 m (above CD)
which is comparable to that reported for Navinal Point (3.38 m) in the Admiralty Tide
Tables.
Figure 4.5: Simulated Tides at Bhadreshwar

Marine Environmental Impact Assessment Report of Kutchh Power Generation Limited, Bhadreswar & Wadala
Villages, Mundra Taluka, Kutchh District
Cholamandalam MS Risk Services - 77 -
Figure 4.6: Predicted tides for 1 year near Navinal point
4.2.7 Currents
The currents in the Gulf and associated creeks are largely tide induced and oscillations are
mostly bimodal reversing in direction with the change in the tidal phase. Influence of wind on
variations in current is minor. The current reversals are quite sharp occurring within 30 - 60
min. Currents recorded at Mundra Port showed that the maximum current speed varied from
0.5 to 1.2 m/s. The predominant direction of the current is 450 during flood and 2200 during
ebb.
4.2.8 Input parameters
The main input parameter for the overall NHD model is the tidal elevations at the boundary,
which is predicted using the DHI Global tide model. The boundary is along the Gulf of Kutch
between South coast of Mundra and North coast of Sikka and the tidal elevations predicted
during the period 2nd January – 1st February 2012 were used as the boundary condition in the
overall NHD model.

Marine Environmental Impact Assessment Report of Kutchh Power Generation Limited, Bhadreswar & Wadala
Villages, Mundra Taluka, Kutchh District
Cholamandalam MS Risk Services - 78 -
4.2.9 Boundary Conditions
Simulations were carried out for a period of 30 days covering the spring and neap tides.
Transfer boundaries were created from the output tidal parameters of the overall 270m model,
which form the input boundary conditions to be applied in the fine resolution local nested
model.
Two boundaries were defined while building the bathymetry of the Local model domain.
These two open boundary conditions defined by water levels and fluxes are along the open
boundaries (East and South) of the model domain. The water levels and fluxes used in the
model were extracted from Calibrated overall Gulf of Kutch model.
Model Setup and Other Parameters
The following parameters are used in the model setup which is based on various trial runs to
fine tune the model for better calibration.
Table 4.2: Model parameters used in MIKE 21 HD
Mode Parameters Values
Time step Interval 10s
Drying, Flooding and Wetting 0.005m, 0.05m and 0.1m
Eddy Viscosity Smagorinsky Formulation (Velocity Based 0.50)
Bed Resistance 32
Figure 4.7 shows the modelled and predicted tidal elevation at the Navinal point and Mandvi
port which is nearly 50km west to the proposed site. From this comparison it is found that the
model calibration is satisfactory since only minor differences, of about 0.1 to -0.1m, are
observed.

Marine Environmental Impact Assessment Report of Kutchh Power Generation Limited, Bhadreswar & Wadala
Villages, Mundra Taluka, Kutchh District
Cholamandalam MS Risk Services - 79 -
Figure 4.7: Comparison of Predicted and Simulated Tides at Navinal and Bhadreshwar
Navinal
Bhadreshwar

Marine Environmental Impact Assessment Report of Kutchh Power Generation Limited, Bhadreswar & Wadala
Villages, Mundra Taluka, Kutchh District
Cholamandalam MS Risk Services - 80 -
4.2.10 Flow velocities
Current patterns along the study area during the spring flood and spring ebb phases in the
absence of wind and tide combined with wind are presented in Figure 4.8 to 4.15. The results
show that the effect of tide is very negligible in this region, and wind is the dominating
parameter controlling the hydrodynamics of the region. The current speeds due to the tides
alone are in the range of 0.1 - 0.4 m/s during neap tide; whereas the current speeds due to
combined wind and tides are in the range of 0.1 - 0.9 m/s near the study region during neap
tide. During spring tide current speed is higher than 0.9 m/s in both the cases.
Figure 4.8 shows the current flow pattern during neap ebb tide with tides alone, while Figure
4.9 shows the current flow pattern during neap ebb tide combined with tides and winds with
12.5 m/s from SSW.
Figure 4.10 shows the current flow pattern during neap flood tide with tides alone, while
Figure 4.11 shows the current flow pattern during neap flood tide combined with tides and
winds with 12.5 m/s from SSW.
Figure 4.12 shows the current flow pattern during spring ebb tide with tides alone, while
Figure 4.13 shows the current flow pattern during spring ebb tide combined with tides and
winds with 12.5 m/s from SSW.
Figure 4.14 shows the current flow pattern during spring flood tide with tides alone, while
Figure 4.15 shows the current flow pattern during spring flood tide combined with tides and
winds with 12.5 m/s from SSW.
Modelling results indicate that wind currents in the region are negligible. The currents are
mainly tide driven.
Simulated maximum current speeds in the vicinity of study area are approximately 0.9 m/s
near the outfall location with winds combined with tides for proposed power plant region off
Bhadreshwar.
The current speeds extracted at various locations near the power plant region shows a similar
flow pattern with a slight reduction of current speeds in the region south of outfall location in
comparison with that of region north of outfall location. This information will be useful for
the thermal dispersion study explained in the following chapter.

Marine Environmental Impact Assessment Report of Kutchh Power Generation Limited, Bhadreswar & Wadala
Villages, Mundra Taluka, Kutchh District
Cholamandalam MS Risk Services - 81 -
Figure 4.8: Simulated current flow off Bhadreshwar during Neap Tide (Ebbing)
Figure 4.9: Simulated current flow off Bhadreshwar during Neap Tide (Ebbing) with 12.5 m/s winds from SSW

Marine Environmental Impact Assessment Report of Kutchh Power Generation Limited, Bhadreswar & Wadala
Villages, Mundra Taluka, Kutchh District
Cholamandalam MS Risk Services - 82 -
Figure 4.10: Simulated current flow off Bhadreshwar during Neap Tide (Flooding)
Figure 4.11: Simulated current flow off Bhadreshwar during Neap Tide (Flooding) with 12.5 m/s winds from SSW
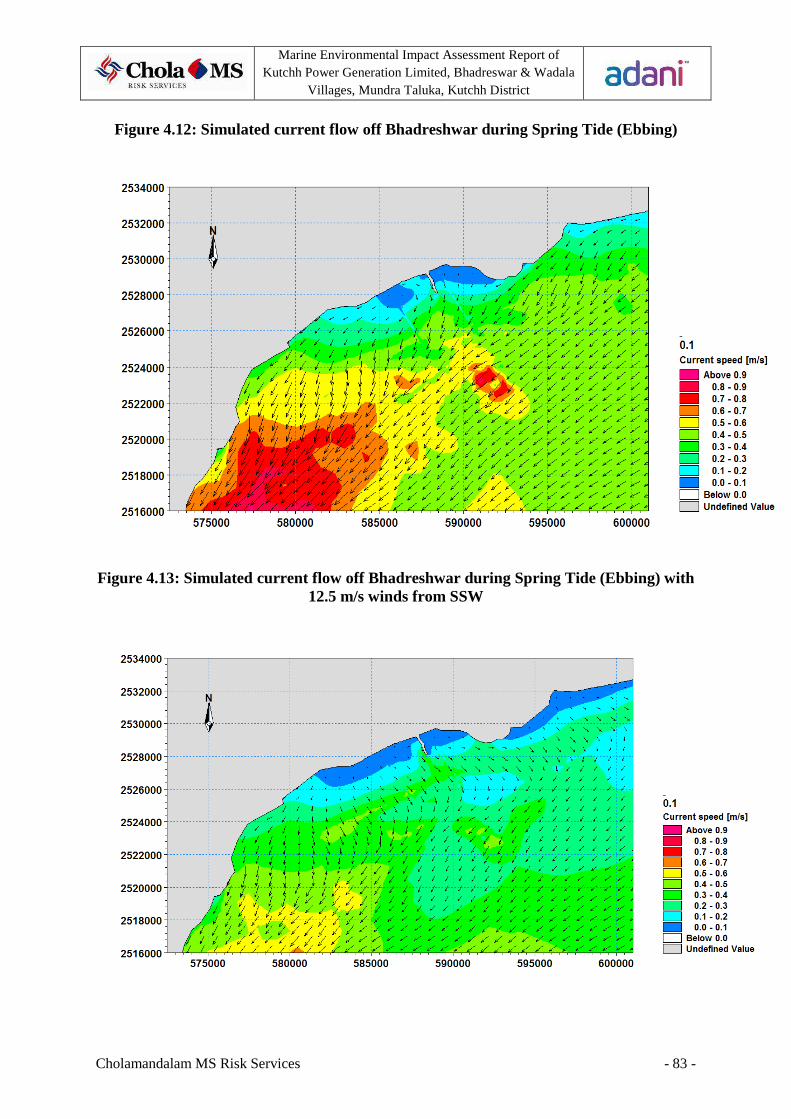
Marine Environmental Impact Assessment Report of Kutchh Power Generation Limited, Bhadreswar & Wadala
Villages, Mundra Taluka, Kutchh District
Cholamandalam MS Risk Services - 83 -
Figure 4.12: Simulated current flow off Bhadreshwar during Spring Tide (Ebbing)
Figure 4.13: Simulated current flow off Bhadreshwar during Spring Tide (Ebbing) with 12.5 m/s winds from SSW
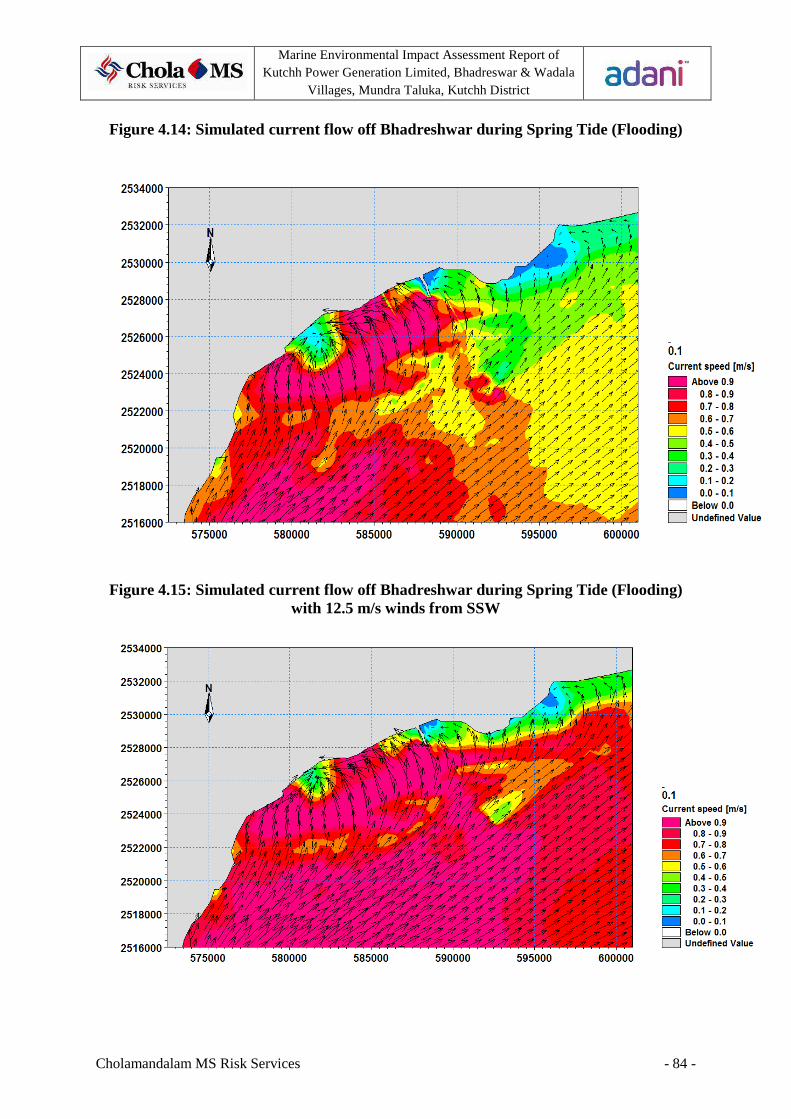
Marine Environmental Impact Assessment Report of Kutchh Power Generation Limited, Bhadreswar & Wadala
Villages, Mundra Taluka, Kutchh District
Cholamandalam MS Risk Services - 84 -
Figure 4.14: Simulated current flow off Bhadreshwar during Spring Tide (Flooding)
Figure 4.15: Simulated current flow off Bhadreshwar during Spring Tide (Flooding) with 12.5 m/s winds from SSW

Marine Environmental Impact Assessment Report of Kutchh Power Generation Limited, Bhadreswar & Wadala
Villages, Mundra Taluka, Kutchh District
Cholamandalam MS Risk Services - 85 -
4.3 Thermal Dispersion Modelling
The power plant will return the intake water to the Gulf through discharge channel and outfall
structure with chemical composition unchanged, with a temperature increase of 50C with
reference to the ambient condition. The effluent parameter considered for the present study is
temperature at the outfall channel is shown in Table 4.3.
The thermal dispersion was simulated using the Advection-Dispersion module of MIKE 21.
This module simulates the spreading of dissolved substances subject to advection and
dispersion processes and simulates the spreading of hot water discharge into the coastal areas
especially from the power plant.
In the present study, the MIKE 21 AD is used to simulate the effect of hot water discharged
from the proposed power plant off Bhadreshwar on the ambient water temperature of the Gulf
of Kutch.
Input parameters
Table 4.3 shows the seawater intake and outfall data from the power plant, which is used for
the thermal dispersion studies along the proposed site. The computation runs have been made
for the proposed intake and outfall to predict the changes in the water qualities and
temperature considering ambient sea water temperature of 300 C for a period of 15 days. The
runs considering peak flood, peak ebb, peak flood combined with 12.5 m/s winds from SSW
direction and peak ebb combined with 12.5 m/s winds from SSW direction have been made
for spring and neap tide condition and results are presented graphically and discussed in the
following sections.
Table 4.3: Seawater outfall characteristics of proposed power plant
Station Month Temperature (°C) Salinity Volume (m3/h)
Intake Outfall Intake Outfall Intake Outfall
Bhadreshwar Power Plant
May 30 35 35.00 35.15 3,94,563 3,93,002
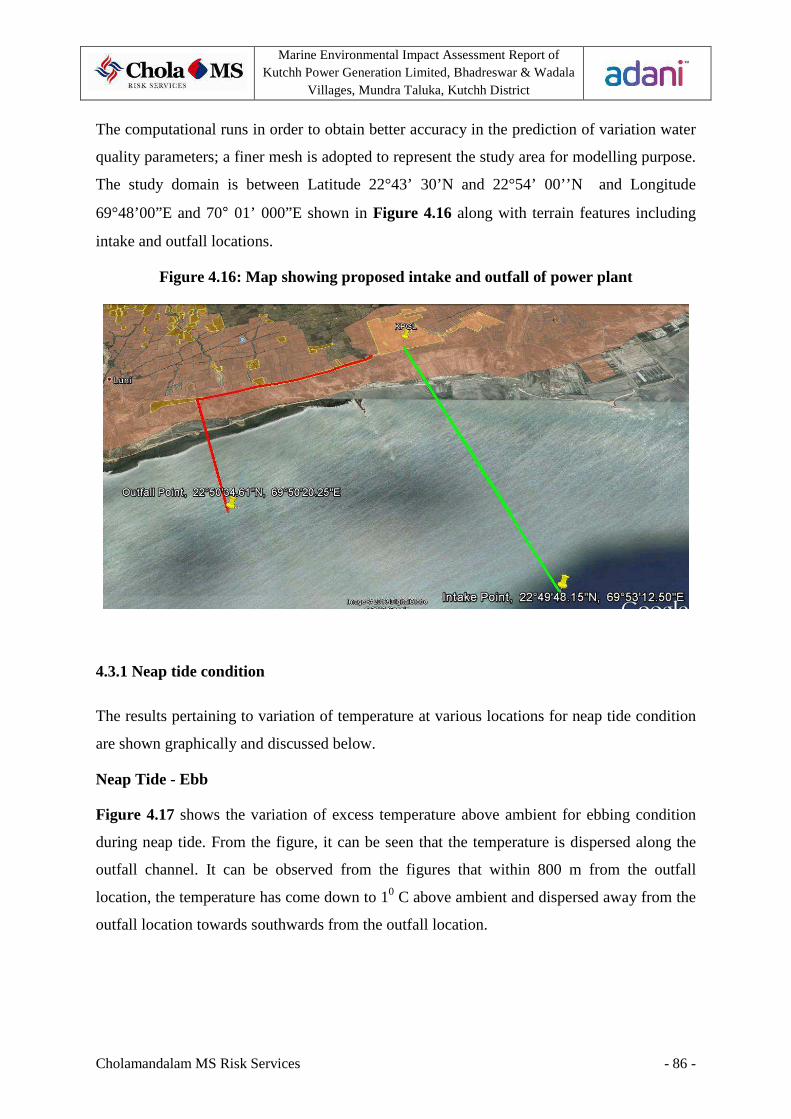
Marine Environmental Impact Assessment Report of Kutchh Power Generation Limited, Bhadreswar & Wadala
Villages, Mundra Taluka, Kutchh District
Cholamandalam MS Risk Services - 86 -
The computational runs in order to obtain better accuracy in the prediction of variation water
quality parameters; a finer mesh is adopted to represent the study area for modelling purpose.
The study domain is between Latitude 22°43’ 30’N and 22°54’ 00’’N and Longitude
69°48’00”E and 70° 01’ 000”E shown in Figure 4.16 along with terrain features including
intake and outfall locations.
Figure 4.16: Map showing proposed intake and outfall of power plant
4.3.1 Neap tide condition
The results pertaining to variation of temperature at various locations for neap tide condition
are shown graphically and discussed below.
Neap Tide - Ebb
Figure 4.17 shows the variation of excess temperature above ambient for ebbing condition
during neap tide. From the figure, it can be seen that the temperature is dispersed along the
outfall channel. It can be observed from the figures that within 800 m from the outfall
location, the temperature has come down to 10 C above ambient and dispersed away from the
outfall location towards southwards from the outfall location.

Marine Environmental Impact Assessment Report of Kutchh Power Generation Limited, Bhadreswar & Wadala
Villages, Mundra Taluka, Kutchh District
Cholamandalam MS Risk Services - 87 -
Neap Tide - Flood
Figure 4.18 shows the variation of temperature for peak flood tide condition during neap
tide. From the above figure it can be observed that the convection and dispersion of
temperature is along the channel and disperses more near landward side of outfall due to
increase in the resultant velocity of flow. It can be observed from the figure that within 1500
m the temperature has around 10 C above ambient and dispersed and convicted in northeast
direction. An increase of 0.40 C above ambient is expected at intake point.
Neap Tide – Ebb combined with winds with 12.5 m/s from SSW
Figure 4.19 shows the variation of excess temperature above ambient for ebbing condition
during neap tide combined with wind with 12.5 m/s from SSW. From the figure, it can be
seen that the temperature is dispersed along the outfall channel. It can be observed that within
2500 m from the outfall location, the temperature has come down to 10 C above ambient and
dispersed away from the outfall location towards southwards from the outfall location.
Neap Tide – Flood combined with winds with 12.5 m/s from SSW
Figure 4.20 shows the variation of excess temperature above ambient for flooding condition
during neap tide combined with wind with 12.5 m/s from SSW. From the figure, it can be
seen that the temperature is dispersed along the outfall channel. It can be observed that within
2000 m from the outfall location in landward direction, the temperature has come down to 10
C above ambient and dispersed away from the outfall location towards southwards from the
outfall location. Similarly a horizontal plume with 10 C above ambient is expected to increase
ambient temperature at intake.

Marine Environmental Impact Assessment Report of Kutchh Power Generation Limited, Bhadreswar & Wadala
Villages, Mundra Taluka, Kutchh District
Cholamandalam MS Risk Services - 88 -
Figure 4.17: Excess temperature above ambient during Neap Tide - Ebbing
Figure 4.18: Excess temperature above ambient during Neap Tide - Flooding

Marine Environmental Impact Assessment Report of Kutchh Power Generation Limited, Bhadreswar & Wadala
Villages, Mundra Taluka, Kutchh District
Cholamandalam MS Risk Services - 89 -
Figure 4.19: Excess temperature above ambient during Neap Tide – Ebbing combined with winds 12.5 m/s from SSW
Figure 4.20: Excess temperature above ambient during Neap Tide – Flooding combined with winds 12.5 m/s from SSW

Marine Environmental Impact Assessment Report of Kutchh Power Generation Limited, Bhadreswar & Wadala
Villages, Mundra Taluka, Kutchh District
Cholamandalam MS Risk Services - 90 -
4.3.2 Spring tide condition
The results pertaining to variation of temperature at various locations for spring tide
condition are shown graphically and discussed below.
Spring Tide - Ebb
Figure 4.21 shows the variation of excess temperature above ambient for ebbing condition
during spring tide. From the figure, it can be seen that the temperature is dispersed on
northeast direction of outfall point. It can be observed from the figures that within 2000 m
from the outfall location, the temperature has come down to 10 C above ambient and
dispersed away from the outfall location towards intake point. This may increase the ambient
temperature at intake point.
Spring Tide – Flood
Figure 4.22 shows the variation of excess temperature above ambient for flooding condition
during spring tide. From the figure, it can be seen that the temperature is dispersed on east to
northeast direction on landward side. It can be observed from the figures that within 5000 m
from the outfall location, the temperature has come down to 10 C above ambient and
dispersed away from the outfall location towards intake point. This may increase the ambient
temperature at intake point.
Spring Tide – Ebb combined with winds with 12.5 m/s from SSW
Figure 4.23 shows the variation of excess temperature above ambient for ebbing condition
during spring tide combined with winds with 12.5 m/s from SSW. From the figure, it can be
seen that the temperature is dispersed on southwest direction along outfall point. It can be
observed from the figures that within 1600 m from the outfall location, the temperature has
come down to 10 C above ambient.
Spring Tide – Flood combined with winds with 12.5 m/s from SSW
Figure 4.24 shows the variation of excess temperature above ambient for flooding condition
during spring tide combined with winds with 12.5 m/s from SSW. From the figure, it can be
seen that the temperature is dispersed on landward side of outfall point. It can be observed
from the figures that within 600 m from the outfall location, the temperature has come down

Marine Environmental Impact Assessment Report of Kutchh Power Generation Limited, Bhadreswar & Wadala
Villages, Mundra Taluka, Kutchh District
Cholamandalam MS Risk Services - 91 -
to 10 C above ambient.
Figure 4.21: Excess temperature above ambient during Spring Tide - Ebbing
Figure 4.22: Excess temperature above ambient during Spring Tide – Flooding

Marine Environmental Impact Assessment Report of Kutchh Power Generation Limited, Bhadreswar & Wadala
Villages, Mundra Taluka, Kutchh District
Cholamandalam MS Risk Services - 92 -
Figure 4.23: Excess temperature above ambient during Spring Tide – Ebbing combined with winds 12.5 m/s from SSW
Figure 4.24: Excess temperature above ambient during Spring Tide – Flooding combined with winds 12.5 m/s from SSW
Marine Environmental Impact Assessment Report of Kutchh Power Generation Limited, Bhadreswar & Wadala
Villages, Mundra Taluka, Kutchh District
Cholamandalam MS Risk Services - 93 -
4.4 Salinity Dispersion Modelling
The power plant will return the intake water to the Gulf through discharge channel and outfall
structure with chemical composition unchanged, with a salinity increase of 0.15 ppt with
reference to the ambient condition. The effluent parameter considered for the present study is
salinity at the outfall channel.
The salinity dispersion was simulated using the Advection-Dispersion module of MIKE 21.
This module simulates the spreading of dissolved substances subject to advection and
dispersion processes and simulates the spreading of saline water discharge into the coastal
areas especially from the power plant.
In the present study, the MIKE 21 AD is used to simulate the effect of saline water
discharged from the proposed power plant off Bhadreshwar on the ambient seawater salinity
of the Gulf of Kutch.
The computation runs have been made for the proposed intake and outfall to predict the
changes in the water qualities and temperature considering ambient sea water temperature of
300 C for a period of 15 days. The runs considering peak flood, peak ebb, peak flood
combined with 12.5 m/s winds from SSW direction and peak ebb combined with 12.5 m/s
winds from SSW direction have been made for spring and neap tide condition and results are
presented graphically and discussed in the following sections.
4.4.1 Neap tide condition
The results pertaining to variation of salinity at various locations for neap tide condition are
shown graphically and discussed below.
Neap Tide - Ebb
Figure 4.25 shows the variation of excess salinity above ambient for ebbing condition during
neap tide. From the figure, it can be seen that the salinity is dispersed along the outfall
channel. It can be observed from the figures that within 1000 m from the outfall location, the
salinity has come down to 0.01 ppt above ambient and dispersed away from the outfall
location towards southwards from the outfall location. The tidal flats in upper intertidal zone
show aggregation of high salinity water resulting in increase of salinity by 0.08 – 0.09 ppt.

Marine Environmental Impact Assessment Report of Kutchh Power Generation Limited, Bhadreswar & Wadala
Villages, Mundra Taluka, Kutchh District
Cholamandalam MS Risk Services - 94 -
Neap Tide - Flood
Figure 4.26 shows the variation of salinity for peak flood tide condition during neap tide.
From the figure it can be observed that the convection and dispersion of salinity is along the
channel and disperses more near landward side of outfall due to increase in the resultant
velocity of flow. It can be observed from the figure that within 2200 m the salinity has
reduced around 0.05 ppt above ambient and dispersed and convicted in northeast direction.
Neap Tide – Ebb combined with winds with 12.5 m/s from SSW
Figure 4.27 shows the variation of excess salinity above ambient for ebbing condition during
neap tide combined with wind with 12.5 m/s from SSW. From the figure, it can be seen that
the salinity is dispersed along the outfall channel with some aggregation of high saline water
in mid intertidal zone. It can be observed that within 2000 m from the outfall location, the
salinity has come down to 0.05 ppt above ambient and dispersed away from the outfall
location towards landward side.
Neap Tide – Flood combined with winds with 12.5 m/s from SSW
Figure 4.28 shows the variation of excess salinity above ambient for flooding condition
during neap tide combined with wind with 12.5 m/s from SSW. From the figure, it can be
seen that the salinity is dispersed along the outfall channel. It can be observed that within
1800 m from the outfall location the salinity has come down to 0.05 ppt above ambient and
dispersed away from the outfall location towards southwards from the outfall location.
Similarly a horizontal plume with 0.02 – 0.03 ppt above ambient is expected to increase
ambient salinity at intake.

Marine Environmental Impact Assessment Report of Kutchh Power Generation Limited, Bhadreswar & Wadala
Villages, Mundra Taluka, Kutchh District
Cholamandalam MS Risk Services - 95 -
Figure 4.25: Excess salinity above ambient during Neap Tide - Ebbing
Figure 4.26: Excess salinity above ambient during Neap Tide - Flooding
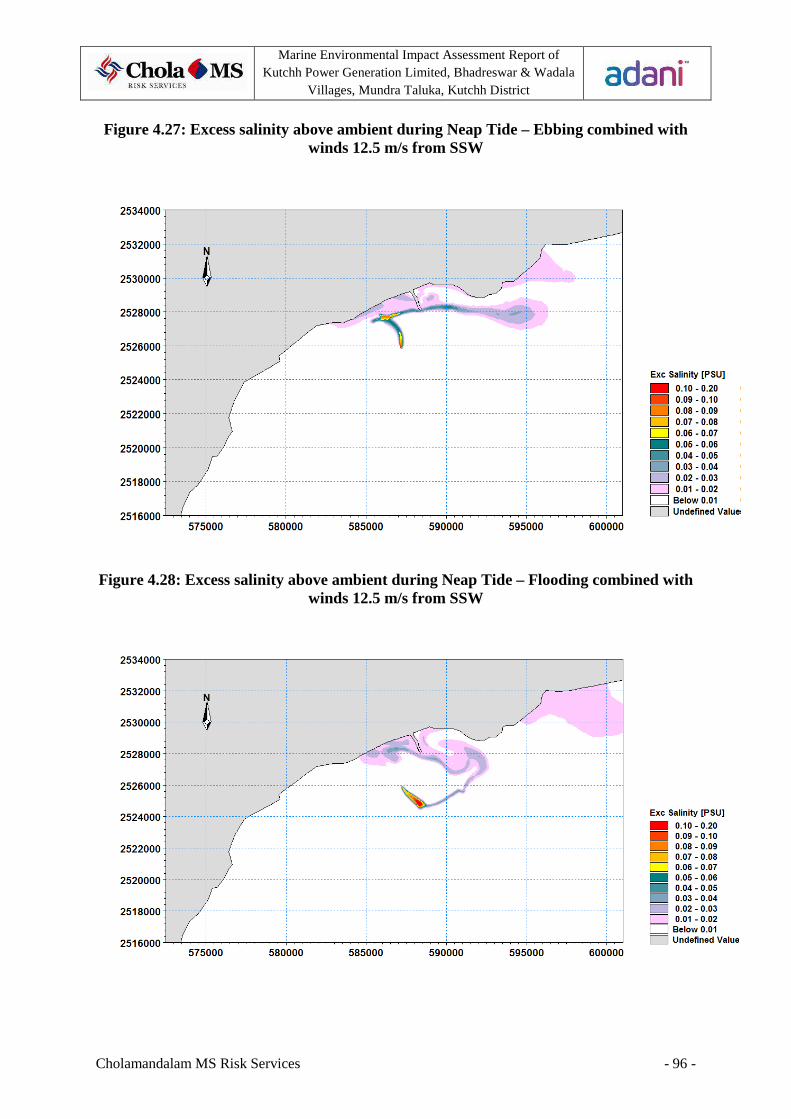
Marine Environmental Impact Assessment Report of Kutchh Power Generation Limited, Bhadreswar & Wadala
Villages, Mundra Taluka, Kutchh District
Cholamandalam MS Risk Services - 96 -
Figure 4.27: Excess salinity above ambient during Neap Tide – Ebbing combined with winds 12.5 m/s from SSW
Figure 4.28: Excess salinity above ambient during Neap Tide – Flooding combined with winds 12.5 m/s from SSW
Marine Environmental Impact Assessment Report of Kutchh Power Generation Limited, Bhadreswar & Wadala
Villages, Mundra Taluka, Kutchh District
Cholamandalam MS Risk Services - 97 -
4.4.2 Spring tide condition
The results pertaining to variation of salinity at various locations for spring tide condition are
shown graphically and discussed below.
Spring Tide - Ebb
Figure 4.29 shows the variation of excess salinity above ambient for ebbing condition during
spring tide. From the figure, it can be seen that the salinity is dispersed along the outfall
channel. It can be observed from the figures that within 200 m from the outfall location, the
salinity has come down to 0.01 ppt above ambient and dispersed away from the outfall
location towards southwards from the outfall location.
Spring Tide - Flood
Figure 4.30 shows the variation of salinity for peak flood tide condition during spring tide.
From the figure it can be observed that the convection and dispersion of salinity is along the
channel and disperses more near landward side of outfall due to increase in the resultant
velocity of flow. It can be observed from the figure that near outfall point itself the salinity
has reduced to 0.05 ppt above ambient and dispersed and convicted in east direction. Little
aggregation of high saline water in upper intertidal zone will increase the salinity by 0.06 –
0.08 ppt above ambient.
Spring Tide – Ebb combined with winds with 12.5 m/s from SSW
Figure 4.31 shows the variation of excess salinity above ambient for ebbing condition during
spring tide combined with wind with 12.5 m/s from SSW. From the figure, it can be seen that
the salinity is dispersed along the outfall channel. It can be observed that within 1800 m from
the outfall location, the salinity has come down to 0.05 ppt above ambient and dispersed
away from the outfall location towards south to southwest direction.
Spring Tide – Flood combined with winds with 12.5 m/s from SSW
Figure 4.32 shows the variation of excess salinity above ambient for flooding condition
during spring tide combined with wind with 12.5 m/s from SSW. From the figure, it can be
seen that the high salinity water is very well mixed with ambient and at the outfall location
the salinity has come down to 0.05 ppt above ambient and dispersed away from the outfall
location towards landward side from the outfall location.

Marine Environmental Impact Assessment Report of Kutchh Power Generation Limited, Bhadreswar & Wadala
Villages, Mundra Taluka, Kutchh District
Cholamandalam MS Risk Services - 98 -
Figure 4.29: Excess salinity above ambient during Spring Tide – Ebbing
Figure 4.30: Excess salinity above ambient during Spring Tide – Flooding

Marine Environmental Impact Assessment Report of Kutchh Power Generation Limited, Bhadreswar & Wadala
Villages, Mundra Taluka, Kutchh District
Cholamandalam MS Risk Services - 99 -
Figure 4.31: Excess salinity above ambient during Spring Tide – Ebbing combined with
winds 12.5 m/s from SSW
Figure 4.32: Excess salinity above ambient during Spring Tide – Flooding combined with winds 12.5 m/s from SSW

Marine Environmental Impact Assessment Report of Kutchh Power Generation Limited, Bhadreswar & Wadala
Villages, Mundra Taluka, Kutchh District
Cholamandalam MS Risk Services - 100 -
4.5 Impacts of dredging on marine ecology
Important water quality issue to be addressed is related to dredging. The quantity of capital
dredging involved is 2.81 MCM. This will result in removal of native benthic species within
the dredged area. This would result in a medium-short-term-reversible impact but its
environmental significance would be low.
Common benthic groups like polychaetes, gastropods and isopods etc are present in this
location. These communities have widespread distribution not only in the proposed channel
but also over entire Gulf of Kutch. While during capital dredging these will be smothered, it
is highly likely that these communities shall move into the rejuvenated channel and flourish.
This typical behavior of benthic organisms has been observed over many coastal power
plants as well as ports. The channel and basin is devoid of threatened, endangered or endemic
species. The location is not a spawning or breeding ground for fisheries was not observed in
and around the project area. Sensitive marine habitats like sea grasses or mangroves are not
present in this location. The area is not a significant fishing ground or feeding ground for
fisheries. The fisheries in this area are confined to artisanal fishing with trawlers already
having moved to offshore areas from the coast off Kandla.
At the dredging site, the initial disturbances to benthic organisms result in smothering/death.
Communities are expected to regenerate over a period after completion of capital dredging.
The sediment analysis indicates low to average values for toxic heavy metals and shall not
result in high water column concentrations due to the disturbance. The toxic metal
concentrations are well within background concentrations and can be safely utilized as a
landfill.
4.5.1 Impacts during Construction of coal conveyer
During construction, activities like drilling, concreting, piling and installation of support
structures, erection of conveyer belt etc will be performed. Temporarily, marine environment
may get disturbed during the construction phase.

Marine Environmental Impact Assessment Report of Kutchh Power Generation Limited, Bhadreswar & Wadala
Villages, Mundra Taluka, Kutchh District
Cholamandalam MS Risk Services - 101 -
4.5.2 Impacts during operation of coal conveyer
Conveyor will feed crushed coal to bunker through motorised travelling tripper for storage
purpose. Metal detector, coal supply unit, electronic belt conveyor shall be provided at
strategic locations. Dust suppression system shall be provided at the discharge end of all
conveyors excepting crusher house at bunker bay while dust extraction system shall be
provided at vibrating screen and bunker bay. Manual/ Electric hoist at various buildings shall
be provided for maintenance purpose. All belt conveyors shall be provided with fire
resistance and its speed shall be limited to 3m/sec. Two streams of belt conveyors have been
envisaged for the coal handling system out of which one will be working and other standby.
However, provision shall be made to run both the streams of conveyors in case of emergency.
Hence, impacts of coal handling on marine ecology during operational phase are expected to
be minimum.
4.6 Miscellaneous Impacts
Aesthetics of the area would deteriorate due to the presence of construction machinery and
materials, make-shift huts for labour force, cabins etc. Left over solid waste generated during
construction would be a source of nuisance if not cleared from the site. The extent of impact
on the beach ecology would also depend on the duration of the construction phase. If the
construction is prolonged due to time - overruns or improper planning, the adverse influence
would increase accordingly.
The saltpans near Luni – Bhadreshwar in association with vast mudflats around provide
congenial environment for migratory as well as resident birds particularly during November-
March. Increase in noise level during construction can disturb these bird populations. Several
species of birds use salt pan areas for feeding as well as roosting during high tide when the
mudflats are submerged under seawater. The adverse impact however, would not be serious
since additional intertidal areas, mudflats and slat works exist in the region.
Marine reptiles and mammals common to the area would not be affected due to construction
activities since they tend to migrate temporarily from such sites. Moreover major activity is
in shallow areas, where marine reptiles and mammals were not sighted during field visits.
Marine Environmental Impact Assessment Report of Kutchh Power Generation Limited, Bhadreswar & Wadala
Villages, Mundra Taluka, Kutchh District
Cholamandalam MS Risk Services - 102 -
There are not much commercial fish trawling operations off Luni - Bhadreshwar. However,
drifts and other local nets are commonly used by local fishermen community. Also some
local beaches are used by migrated fishermen temporarily for landing and sun drying. Since
proposed site and intake – outfall channels are nearly 3 km away from fishing hamlet, their
fishing operations would not be hampered much during the construction activities.
The area off Luni - Bhadreshwar does not sustain corals though fringing corals occur in
patches along the southern shore of the Gulf segment off Vadinar. These corals are atleast 25-
30 km away from Mundra. The nature of circulation in the Gulf with predominant transport
along east-west would not permit the effect of localised perturbations along the northern
shore to reach these corals.

Marine Environmental Impact Assessment Report of Kutchh Power Generation Limited, Bhadreswar & Wadala
Villages, Mundra Taluka, Kutchh District
Cholamandalam MS Risk Services - 103 -
5. Environment Management Plan
In the proposed project, sea water will be used in open cycle for circulating water system and
sweet water needs will be met by treatment of sea water in Desalination plant & RO process.
Electrostatic precipitators of high efficiency and stack height as per CPCB norms etc. will
limit the emission levels. As such, no undue problem is envisaged from installation of the
power plant at said location from environmental aspect.
Environmental Management Plant (EMP) is proposed to be established for the plant to detail
out the environmental quality measures to be undertaken during the construction and
operational phases. EMP will also discuss the post project monitoring measures to be adopted
by the plant authorities in order to maintain the waste water qualities within the acceptable
limits specified by the Gujarat State Pollution Control Board (GPCB) and the Ministry of
Environmental & Forests (MoEF).
5.1 Water Pollution
Sea Water from nearby coast shall be used for condenser cooling. It is proposed to utilise the
power plant waste water for plant reuse to achieve minimum discharge concept.
During the operation of the power plant, spent cooling water will be discharged back into the
sea. The impacts of these activities were investigated using a two dimensional hydrodynamic
model. The results indicated that the construction of the channels and the discharge of spent
cooling water will not have significant impacts on the marine environment. However,
marginal increase in ambient temperature over intake point is expected with proposed intake
and outfall point. Following measures are suggested to mitigate the impacts that may arise
due to rise in intake temperature.
1. The flow in the study area was dominated by the tides with minor influence from winds
and other atmospheric parameters. The model was well calibrated with the
Admiralty predicted tides at two stations in the bay.
2. The simulations were carried out for various tidal phases in the study region and results
shows that the tidal currents were lower during the neap than that of spring.
3. Thermal & Salinity dispersion study reveals that the region is well flushed with the tidal
currents and the dispersion is good during all the tidal phases; however the temperature at the

Marine Environmental Impact Assessment Report of Kutchh Power Generation Limited, Bhadreswar & Wadala
Villages, Mundra Taluka, Kutchh District
Cholamandalam MS Risk Services - 104 -
intake could increase by 1 – 20 C than the ambient as the discharge from the outfall is
influencing the waters at Intake.
4. The results also shows that plume is spreading over the shallow tidal flat near the coast,
this may not be concern for the thermal or salinity parameters, but could make any issue if
any toxic or untreated effluent is dispersed during the due operation of plant.
5. The outfall discharge could be placed further offshore, where it coincides with -1m CD of
the bathymetry. This may allow the plume to disperse well and reduce its influence on the
intake and tidal flat. Figure 5.1 shows the recommended location for outfall.
6. The 30m wide channels for intake and outfall channels should be either submerged by
introducing pipelines or mitigation measurements should be taken to avoid accumulation of
sediment into the channel.
7. Sediment Ingress will be high near the intake due to its location on the tidal flat, which in
long run may affect the operation of the plant. The quantitative results can only be
determined by the sediment transport modelling and ingress analysis.
Figure 5.1: Recommended outfall location to minimize temperature rise at intake point
Streams of waste water emanating from the power station sources during operational phase
will be treated individually based on the waste water quality. Treated waste waters will be
collected in a Central Monitoring Basin (CMB) for final monitoring. The treated waste water

Marine Environmental Impact Assessment Report of Kutchh Power Generation Limited, Bhadreswar & Wadala
Villages, Mundra Taluka, Kutchh District
Cholamandalam MS Risk Services - 105 -
will be recycled for plant use and for green belt development. Therefore, there will be no
impact on the ground water resources.
The major waste water generated from the plant like DM Plant discharge will be treated in a
waste water treatment plant and recycled. No discharge of liquid waste to the other public
boundaries is foreseen for the proposed power station.
The coal pile area run off water during monsoon season will be led to a pond.
Coal particles will settle down in the pond and clear water will be allowed to overflow to the
central monitoring basin for treatment.
In the power plant, some specific locations in TG / SG area require washing, to maintain
good plant house keeping and prevent build up of dirt and waste material, which generates
waste water. This waste water along with process drain will be led to an oil water separator
for separation of oil. The clear water will be led to the central monitoring basin. The dirty oil
will be recovered separately in a drum.
The rain (storm) water removed from the building roofs, non process area and grade level
surfaces will be directed through the open ditches and culverts to the storm drainage piping.
The storm water from the storm water drainage piping shall be discharged outside the plant
boundary. All ditches will be concrete lined and located along the roads. All drainage ditches
will be located to provide the shortest practical drainage path while providing efficient
drainage for the yard. Grade level will be contoured such that storm water run off is directed
on the ground by sheet flow, to well defined drainage paths leading to the ditches.
5.2 Dredging
Considerable volume of dredged spoil would be generated during capital dredging. It is
proposed to utilise the material generated during capital dredging for land filling.
Dredged spoil resulting from maintenance dredging should be disposed off at the identified
approved site in deep sea. The comprehensive study of designate disposal sites should be
carried out before dredge disposal to ascertain the actual site conditions. Primary
productivity, bathymetry and status of benthic fauna at this point should be monitored
periodically after dredge disposal.
No dredged spoil disposal should be carried out in non saline areas.

Marine Environmental Impact Assessment Report of Kutchh Power Generation Limited, Bhadreswar & Wadala
Villages, Mundra Taluka, Kutchh District
Cholamandalam MS Risk Services - 106 -
5.3 Storage of hazardous materials
Hazardous material will to be stored at site during construction include petrol, diesel, welding
gas, weld inspection material, radiographic material, paints, cleaning chemicals, DM plant
chemicals etc. These materials will be stored in accordance with prescribed safety norms in
ventilated enclosures. Safety instructions and signage will prominently be displayed at
appropriate points/locations.
5.4. Post Project Environmental Management Plan
The common waste water treatment plant, which receives discharges from neutralization pit
of DM Plant, clarified waste water from Oil Water Separator, etc will be designed to enable
maximum re-use/recycling. The treated waste water will be utilised for plant consumptive
requirements and for green belt development. Reject water from Desalination plant shall be
directly discharged into sea through outflow channel.
Around the coal stock yard, drainage channels shall be constructed to take all the effluent
from the coal stock yard which shall be ultimately led to a coal pile run off pit. Coal particles
shall settle down in this sump. The overflow from the sump shall be lead to the plant drains.
The coal pile run off pit shall be suitable for storing about 10 hrs rainwater falling in the
stockpile area based on the climatologically data. This shall be RCC construction. Pumps
shall be provided in this coal pipe run off pit to discharge the water at final disposal point
5.5 Environment Monitoring Program
To undertake effective implementation of Environment Management Plan, following
Environmental Monitoring Program is recommended. This will help in obtaining an early
warning of unacceptable environmental conditions so that control measures can be taken
immediately. It also helps to determine in a timely fashion, changes in the local
environmental quality. The environmental monitoring programme includes ambient air
quality monitoring, meteorological data collection, water quality monitoring, soil testing and
sea water monitoring.
It is necessary to monitor the marine environment periodically and identify the perturbations
if any to take appropriate follow-up action. To understand seasonal variations it is necessary
to conduct periodic investigations, ideally monthly, but at least seasonally at carefully

Marine Environmental Impact Assessment Report of Kutchh Power Generation Limited, Bhadreswar & Wadala
Villages, Mundra Taluka, Kutchh District
Cholamandalam MS Risk Services - 107 -
selected monitoring locations. These should include subtidal as well as intertidal segments. In
the present case, the stations 1, 2, 8, 9 and 10 should be adequate to represent the subtidal
environment while intertidal transects in the vicinity of the plant utilities along with transect
sufficiently away from this area should be selected for evaluation of the intertidal ecology.
Till a proper baseline is established, the data presented in this report can be considered for
comparing the results of future monitoring. The monitoring however should be confined to
the month in which the data are collected. Selected stations including the effluent disposal
location should be sampled diurnally during the monitoring program.
The results of each monitoring should be carefully evaluated to identify changes if any,
beyond the natural variability identified through the baseline studies. Gross deviation from
the baseline may require a thorough review of the effluent disposal scheme to identify the
causative factors leading to these deviations and accordingly, corrective measures to reverse
the trend would be necessary.
Detail of Environmental Monitoring Program is mentioned in the Table 5.1 below.

Marine Environmental Impact Assessment Report of Kutchh Power Generation Limited, Bhadreswar & Wadala
Villages, Mundra Taluka, Kutchh District
Cholamandalam MS Risk Services - 108 -
Table 5.1: Proposed Environment Monitoring Program
Sl.No. Component Parameters to be Monitored Locations Monitoring Frequency
1 Physical Processes
Currents, Tides, Bathymetry Intake and outfall channel
Once in year
2 Marine water Quality
Physical Properties:
pH, Salinity, Temperature, Turbidity, Total Suspended Solids
Chemical Parameters:
Dissolved Oxygen, Nutrients, BOD, COD, Residual Chlorine
Heavy Metals:
Cu, Pb, Ni, Cd, Cr, Hg
Bacteriological Parameters:
Coliform Count
Marine Biology:
Phytoplankton, Zooplankton
5 locations (Surface and bottom) near outfall, 5 locations near intake
Monthly Sampling
3 Marine Sediment Quality
Physical & Chemical Properties:
pH, Organic Carbon, Nutrients, PHc and Phenols
Heavy Metals:
Cu, Pb, Ni, Cd, Cr, Hg
Bacteriological Parameters:
Coliform Count
Marine Biology:
Macro and Meio benthic fauna
5 locations (Surface and bottom) near outfall, 5 locations near intake
Monthly Sampling
4 Fish Population Monitoring
Diversity and Abundance Near Outfall and Distant Zones
Monthly observations
5.6 Environmental Management Cell
The major environmental considerations involved in the construction and operation of the
thermal power station and related accessories like conveyer belt, intake outfall channel,
transmission network, etc. are taken up by a full-fledged multi disciplinary Environmental
Management Cell (EMC) with key functions of environmental, safety and occupational
Marine Environmental Impact Assessment Report of Kutchh Power Generation Limited, Bhadreswar & Wadala
Villages, Mundra Taluka, Kutchh District
Cholamandalam MS Risk Services - 109 -
health for management of the entire plant and surrounding environment. EMC is already in
place at existing power plant at Vandh with team of environmental engineers, chemists,
horticulturists, safety specialists and well-trained staff for operation and maintenance of
pollution control equipment. Staff training programmes in the areas of environment, ambient
air, water quality monitoring, solid waste management, noise abatement, safety and health
aspects are being conducted regularly at existing power plant. Same practice should be
followed at proposed power plant.
Marine Environmental Impact Assessment Report of Kutchh Power Generation Limited, Bhadreswar & Wadala
Villages, Mundra Taluka, Kutchh District
Cholamandalam MS Risk Services - 110 -
6. References
1. Alagarswami, K. and S.Z. Qasim, 1973. Pearl culture-Its potential; and implications in
India, Indian J. Fish. 20 (2): 533-550.
2. Anand, P.E.V. and N.G.K. Pillai, 1995. Studies on some aspects of biology and ecology
of coral reef fishes of Lakshadweep with observations on other coral reef ecosystems of
India, Mariculture research under the postgraduate programme in mariculture, Part – 6,
Rangarajan, K. eds. Cochin, India, 61: 99-111.
3. Anantani, Y.S. and B.S. Vaidya, 1983. Growth characteristics and pigment levels in a
halotolerant cyanophyte, Phykos, 22 (1-2): 101-104.
4. Anon,1997. A brief on the contribution of ZSI to the research and knowledge of coral
reefs in India, Regional workshop on the conservation and sustainable management of
coral reefs. Chennai, India, M.S, Swaminathan Res. Fond., C27-C28.
5. Apte, D., 1999. Maculotriton serrialis (Deshayes in Laborde & Linnet 1834) from Okha,
Gulf of Kutch: A new record, J. Bombay Nat. Hist. Soc., 96 (2): 346.
6. Apte, D.,1998. Record of Homalocantha secunda (Lamarck 1822) from Okha in Gulf of
Kutch, J. Bombay Nat. Hist. Soc., 95 (3): 526-527.
7. Asha, P S and Rajagopalan, M and Diwakar, K (2011) Influence of salinity on hatching
rate, larval and early juvenile rearing of sea cucumber Holothuria scabra
Jaeger. Journal of the Marine Biological Association of India, 53 (2). pp. 218-224.
8. Bahuguna, A. and S Nayak, 1998. Coral Reefs of the Indian coast,
SAC/RSA/RSAG/DOD-COS/SN/16/97 Space Applications Centre (ISRO), Ahmedabad,
February, 1998, Sponsored by Department of Ocean Development, Govt, of India. 54pp.
9. Bahuguna, A., A. Ghosh, S. Nayak, A. Patel and J.P. Aggarwal (1992). Ecological status
of the coral reefs of the Gulf of Kachchh and Lakshadweep, In: Proc.Nat. Symp. Rem.
Sens. For sustainable Development, Lucknow, 57- 61.
10. Bas, C.C., Spivak, E.D., 2000. Effect of salinity on embryos of two southwestern
Atlantic estuarine grapsid crab species cultured in vitro. J. Crustac. Biol. 20 (4), 647 –
656
11. Bhan, S., 1989. Influence of some environmental parameters on the condition factors of
two species of penaeid prawns off Gulf of Kutch. 10th annual session of the Academy of
Environmental Biology, India, and International Symposium on Environmental Impact

Marine Environmental Impact Assessment Report of Kutchh Power Generation Limited, Bhadreswar & Wadala
Villages, Mundra Taluka, Kutchh District
Cholamandalam MS Risk Services - 111 -
on Biosystems, December 13-17, 1989. The Academy of Environmental Biology, India,
130.
12. Bhanderi, P.P., 1974. An estimate of the iodine yielding seaweed Asparagopsis
taxiformis (Delile) Collins and Harvey from some subtidal reefs of Saurashtra coast, J.
Mar. Biol. Assoc. India, 16 (1): 288-289.
13. Bhaskar, S., 1981. Preliminary report on the status and distribution of sea turtles in
Indian waters, Indian For. 107 (11): 707-711.
14. Brahmbhatt, G.K., D.N. Chanda, N.D. Chhaya and M.Bhaskaran, 1979. A successful
experiment on exploitation of Sargassum (Alginophyte) sp. around Sikka in the Gulf of
Kutch, International Symposium on Marine algae of the Indian Ocean Region, CSMCRI.
Bhavnagar, India,42.
15. Chandy, M., 1969. Thalamita poissonii (Audouin & Savigny) de Man, (Crustacea:
Brachyura). A new record to Indian coasts, J. Bombay Nat. Hist. Soc. 66 (3): 635-637.
16. Chandy, M., 1973. New records of brachyuran decapods from the Gulf of Kutch, J
Bombay Nat. Hist. Soc. 70 (2): 401-402.
17. Chauhan, V. D., 1985. Floristic study of Sargassum of Gujarat coast. All India
Symposium on Biology of Algae, University of Poona, Poona, India, 8-10.
18. Chauhan, V.D. and V. Krishnamurthy, 1968. An estimate of algin-bearing seaweeds in
the Gulf of Kutch, Curr. Sci., 37 (22): 648.
19. Chavan, S.A., 1985. Status of mangrove ecosystem in Gulf of Kachchh. Proceedings of
symposium on endangered marine animals and marine parks, 475-482.
20. Chavan, S.A., 1986. Endangered marine ecosystem of Gulf of Kachchh. Proceedings of
seminar on Gujarat endangered environment and ecosystems. Gujarat Ecological
Education and Research Foundation, 71-76.
21. Chhaya, N.D., A.U. Buch and K.R. Narayanan, 1979. Observations on the fisheries of
mullet and scope for its culture in Gulf of Kutch, Indian J. Fish. 26 (1-2): 47-51.
22. Chhaya, N.D., M.I. Patel, C.R. Trivedi and S.A. Kadri, 1990. Simulated salt pan system-
a test case for Artemia and their cysts production, Seafood export., 21 (6): 41-42.
Commissionerate of Fisheries, 2000. Gujarat Fisheries Statistics, 1999/2000.
23. Cook, H.L., Murphy, M.A., 1969. The culture of larval penaeid shrimp. Trans. Am. Fish.
Soc. 98, 751 – 754.
Marine Environmental Impact Assessment Report of Kutchh Power Generation Limited, Bhadreswar & Wadala
Villages, Mundra Taluka, Kutchh District
Cholamandalam MS Risk Services - 112 -
24. Costlow Jr., J.D., Bookhout, C.G., Monroe, R., 1960. The effect of salinity and
temperature on larval development of Sesarma cinereum (Bosc.) reared in the laboratory.
Biol. Bull. 118, 183 – 202.
25. Daniel, A. and B.P. Halder, 1974. Holothuroidea of the Indian ocean with remarks on
their distribution, J. Mar. Biol. Assoc. India, 16 (2): 412-436.
26. Desai, K., D. Nimavat and J.A. Pandya, 1977. Studies on the pearl oyster, Pinctada ficata
(Gould) of the Gulf of Kutch, Curr. Sci., 46 (21): 748-749.
27. Desai, K.M., B. Patel and H. Dave, 1980. Laboratory rearing of eggs and larvaeof edible
oysters of the Gulf of Kutch, Proceedings of the Symposium on Coastal Aquaculture,
held at Cochin from January 12 to 18, 1980, Part 2 Molluscan Culture, Marine Biological
Assoc. of India, Cochin, India, 6: 704.
28. Desai, P. N., 1997. Coastal Marine Environment of Gujarat-a benchmark survey, Vol.1.
Gulf of Kachchh. (and the references therein), Gujarat Ecology Commisiion, Vadodara.
29. Desai, P.S., Narain, A., Nayak, S.R., Manikiam, B., Adiga, S. and Nath, A.N., 1991.
Curr. Sci., 61: 204-208.
30. Deshmukh, V.M., 1995. A note on the prawn fishery in the Gulf of Kutch during 1962-
63, Indian J. Fish., 22 (1-2), 265-269.
31. Deshmukhe, G., K. Ramamoorthy and R. Sen Gupta, 2000. On the Coral reefs of the
Gulf of Kachchh, Curr. Sci., 79 (2): 160-162.
32. Devraj, M., 1997. A brief on the contribution of the Central Marine Fisheries Research
Institute to research and knowledge of coral reefs of India, Regional workshop on the
conservation and sustainable management of coral reefs, Chennai, India, M.S.
Swaminathan Res. Found., C21-C25.
33. Dharmakumarsinhji, R.S., 1984. Some notes on the Indian heron, J. Bombay Nat. Hist.
Soc., 81 (1): 188-189.
34. Dhawan, R.M., 1970. Plankton and hydrological factors at Kandla in the Gulf of Kutch
during 1960-1963, Indian J. Fish., 17: 122-131.
35. Easwaran, C.R., 1967. On an abnormal ray from the Gulf of Kutch, J. Mar. Biol. Assoc.
India, 9 (1): 198-200.
36. Easwaran, C.R., K.R. Narayanan and M.S. Michael, 1969. Pearl fisheries of the Gulf of
Kutch, J. Bombay Nat. Hist. Soc. 66 (2): 338-344.
37. Frazier, J.G. and T. Mundkur, 1990. Dugong dugong Muller in the Gulf of Kutch,
Gujarat, J. Bombay. Nat. Hist. Soc., 87 (3): 368-379.

Marine Environmental Impact Assessment Report of Kutchh Power Generation Limited, Bhadreswar & Wadala
Villages, Mundra Taluka, Kutchh District
Cholamandalam MS Risk Services - 113 -
38. Gajbhiye, S.N., L. Krishnakumari, K. Govindan, S.A.H. Abidi and V.R.Nair, 1988.
Studies on selected biological parameters off Mithapur (Gujarat). Journal of Indian
Fisheries Association., 18.
39. George, M.K., 1980. Biology and fishery of wam Muraenesox talabonoides (Bleeker),
Indian J. Fish. 27 (1-2): 82-94.
40. George, P.C., M.J. George, Rao and P. Vedavyassa, 1963. Metapenaeus kutchensis sp.
Nov., A penaeid prawn from the Gulf of Kutch, J. Mar. Biol. Assoc. India, 5 (2): 284-
288.
41. George. M.J., Rao and P. Vedavyasa, 1966. A new species of Metapenaeus (decapoda,
penaeidae), J. Mar. Biol. Assoc. India, 8 (1): 146-151.
42. Gideon P.W., P.K.B. Menon, S.R.V. Rao and K.V. Jose, 1957. On the marine fauna of
Gulf of Kutch a preliminary survey, J. Bombay Nat. Hist. Soc. 54 (3): 690-706.
43. Gireesh, R and Gopinathan, C P (2008) Effects of copper on development and survival
rate of Paphia malabarica Chemnitz larvae under low saline condition. Environ Monit
Assess .
44. Gopalakrishnan, K., 1976. Larval rearing of red shrimp Penaeus marginatus(Crustacea).
Aquaculture 9, 145 – 154.
45. Gopalakrishnan, P., 1969a. Some marine algae from the Gulf of Kutch, Phykos., 8 (1-2):
61-67.
46. Gopalakrishnan, P., 1969b. On the holothuroidea (Echinodermata) of the Gulf of Kutch,
J. Bombay Nat. Hist. Soc. 66 (2): 399-400.
47. Gopalakrishnan, P., 1972. Studies on the marine planktonic diatoms off Port Okha in the
Gulf of Kutch, Phykos., 11 (1-2): 37-49.
48. Hoon, Vineeta, 1997. Coral reefs of India: review of their extent, condition, research and
management status. In. Proc. Regional workshop, conservation and sustainable
management of coral reefs. 1-27.
49. Hoq, M.E., 1977. Coral reefs of India: Review of their extent, condition, research and
management status, Regional workshop on the conservation and sustainable management
of coral reefs, Chennai, India, M.S. Swaminathan Res. Found., B1-B25.
50. Jagtap T. G., D.S. Komarpant and R. Rodrigues. Status of seagrass ecosystem: An
ecologically sensitive wetland habitat from India.
Marine Environmental Impact Assessment Report of Kutchh Power Generation Limited, Bhadreswar & Wadala
Villages, Mundra Taluka, Kutchh District
Cholamandalam MS Risk Services - 114 -
51. Jagtap T. G., P. S. Murthy and D.S. Komarpant. Mangrove ecosystem of India: Major
biotic constituents, conservation and management, Hydrobiology of lentic ecosystems.
(Ed, B.B. Hosetii) in press.
52. Jagtap, T.G. and A.G. Untawale, 1996. Occurrence of Hydroclathrus tenuis Tseng and
Baoren, (Phaeophyta) from Gulf of Kutch, northwest coast of India, Indian. J. Mar. Sci.,
25 (3): 277-279.
53. Jani, M.M. and M.I. Patel, 1995. On first record of sea whale, Balaenoptera borealis
(Less) from Gulf of Kutch, Fish. Chimes, 15 (3): 52-53.
54. Kasinathan R., K. Govindan and B.N. Desai, 1973-1974. Distribution of benthic fauna in
the Gulf of Kutch, J. Indian, Fish. Assoc. 3&4 (1-2): 68-79.
55. Khacher, L., 1998. Dugong dugong in the Gulf of Kachchh, J. Bombay Nat. Hist. Soc.,
95 (3): 499.
56. Kies, L., 1997. Distribution, biomass and production of planktonic and benthic algae in
the Elbe Estuary. Limnologica 27, 55–64.
57. Kulkarni, D.H., 1957. Utilisation of mangrove forest in Saurashtra and Kachchh. Proc.
Mangrove Symposium, Calcutta.
58. Kumulu, M., Eroldogan, O.T., Aktas, M., 2000. Effects of temperature and salinity on
larval growth survival and development of Penaeus semisulcatus. Aquaculture 188, 167
– 173
59. Kumulu, M., Jones, D.A., 1993. Optimum rearing conditions for rearing Penaeus indicus
larvae. Spec. Publ.-Eur. Aquac. Soc. 19. 142 pp.
60. Kundu, H.L., 1965(a). On the marine fauna of the Gulf of Kutch, J. Bombay Nat. Hist.
Soc. 62 (1): 84-103.
61. Kuzmenko, L.V., 1973. Primary production of the northern Arabian sea, Oceanology, 13
(2): 251-256.
62. M Kailasam. Effect of thermal effluent discharge on benthic fauna off Tuticorin bay,
south east coast of India. Indian Journal of Marine Sciences Vol. 33(2), June 2004, pp.
194-201
63. Madhupratap, M. and P. Haridas, 1992. New species of Pseudodiaptomus (Copepoda:
Calanoida) from the salt pans of the Gulf of Kutch, India and a comment on its
speciation, J. Plankton Res. 144, 555-562.
64. Mahyavanshi, I.N., 1975. Further studies on the marine planktonic diatoms in the coastal
waters of Saurashtra, Phykos., 14 (1-2): 99-111.

Marine Environmental Impact Assessment Report of Kutchh Power Generation Limited, Bhadreswar & Wadala
Villages, Mundra Taluka, Kutchh District
Cholamandalam MS Risk Services - 115 -
65. Menon, P.K.B., A.K.D. Gupta and D.D. Gupta, 1961. On the marine fauna of the Gulf of
Kutch, J. Bombay Nat. Hist. Soc. 58 (2): 475-494.
66. Mohan, R.S.L., 1963. On the occurrence of Dugong dugong (Muller) in the Gulf of
Kutch, J. Mar. Biol. Assoc. India., 5 (1): 152.
67. Mundkur, T., L.M. Raol and S.N. Varu, 1988. Distribution of the slenderbilled Gull
(Larus genei Breme) in the Gulf of Kachchh, Gujarat, J. Bombay Nat. Hist. Soc. 85 (2):
420-422.
68. Narayanan, K.R., 1971. On two doridacean nudibranchs (Molluscs: Gastropoda), from
the Gulf of Kutch, New to the Indian coast, J. Bombay Nat. Hist. Soc. 68 (1): 280-281.
69. Naskar, K. and R Mandal, 1999. Ecology and biodiversity of Indian mangroves, Part – 1,
Global status, Daya publishing house, Delhi, 1-186.
70. P. Chakraborty, T. Acharyya, P. V. Raghunadh Babu and D. Bandyopadhyay. Impact of
salinity and pH on phytoplankton communities in a tropical freshwater system: An
investigation with pigment analysis by HPLC. J. Environ. Monit., 2011, 13, 614-620.
71. Parado-Estepa, F.D., 1998. Survival of Penaeus monodon postlarvae and juveniles at
different salinity and temperature levels. Isr. J. Aquac.-Bamidgeh 50 (4), 174 – 183
72. Po-Teen Lim and Takehiko Ogata. Salinity effect on growth and toxin production of four
tropical Alexandrium species (Dinophyceae). Toxicon 45 (2005) 699–710
73. Preston, N., 1985. The effects of temperature and salinity on survival and growth of
larval Penaeus plebejus, Metapenaeus macleyi and M. bennettae. In: Rothlisberg, P.C.,
Hill, B.J., Staples, D.J. (Eds.), Second Australian National Prawn Seminar. NPS2,
Cleveland, Australia, pp. 31 – 40.
74. S. Zacharia and V.S. Kakati. Optimal salinity and temperature for early developmental
stages of Penaeus merguiensis De man. Aquaculture 232 (2004) 373 – 382.
75. Taylor, F.J.R., Pollingher, U., 1987. Ecology of dinoflagellates, In: Taylor, F.J.R. (Ed.),
The Biology of Dinoflagellates. Blackwell, London, pp. 399–529.
76. Thakar, V.J., 1982. Large scale prawn harvest in the little Rann of Kutch during
monsoon, Seafood Export J. 14 (2): 15-17.
77. Untawale, A.G. and T.G. Jagtap, 1999. Socioeconomic significance of mangroves for
coastal people of India: A changing scenario, Proceedings of symposium on significance
of Mangrove Ecosystems for Coastal People, Hat Yai, Songkla Province, Thailand, 19-
21 August 1996. Kunstadter, P. ed. Int. Soc. For Mangrove Ecosystems. Okinawa, Japan.
91-101.
Marine Environmental Impact Assessment Report of Kutchh Power Generation Limited, Bhadreswar & Wadala
Villages, Mundra Taluka, Kutchh District
Cholamandalam MS Risk Services - 116 -
78. Untawale, A.G. and V. Ambiye, 1988. Flora of Bet Shankhudar in the Gulf of Kachchh.
In: Proceedings of the first Indian Conference on marine archaeology of Indian Ocean
Countries (Ed. S.R. Rao), NIO, Goa, 139-141.
79. Wafar, M.V.M., 1999. Status report India, Coral reef degradation in the Indian Ocean:
Status reports and prject presentations, 1999, Linden, O. (ed.) Stockholm Univ. Sweden
CORDIO / SAREC Marine Science Program, 1999: 25-26.
Annexure I
Water Balance Diagram
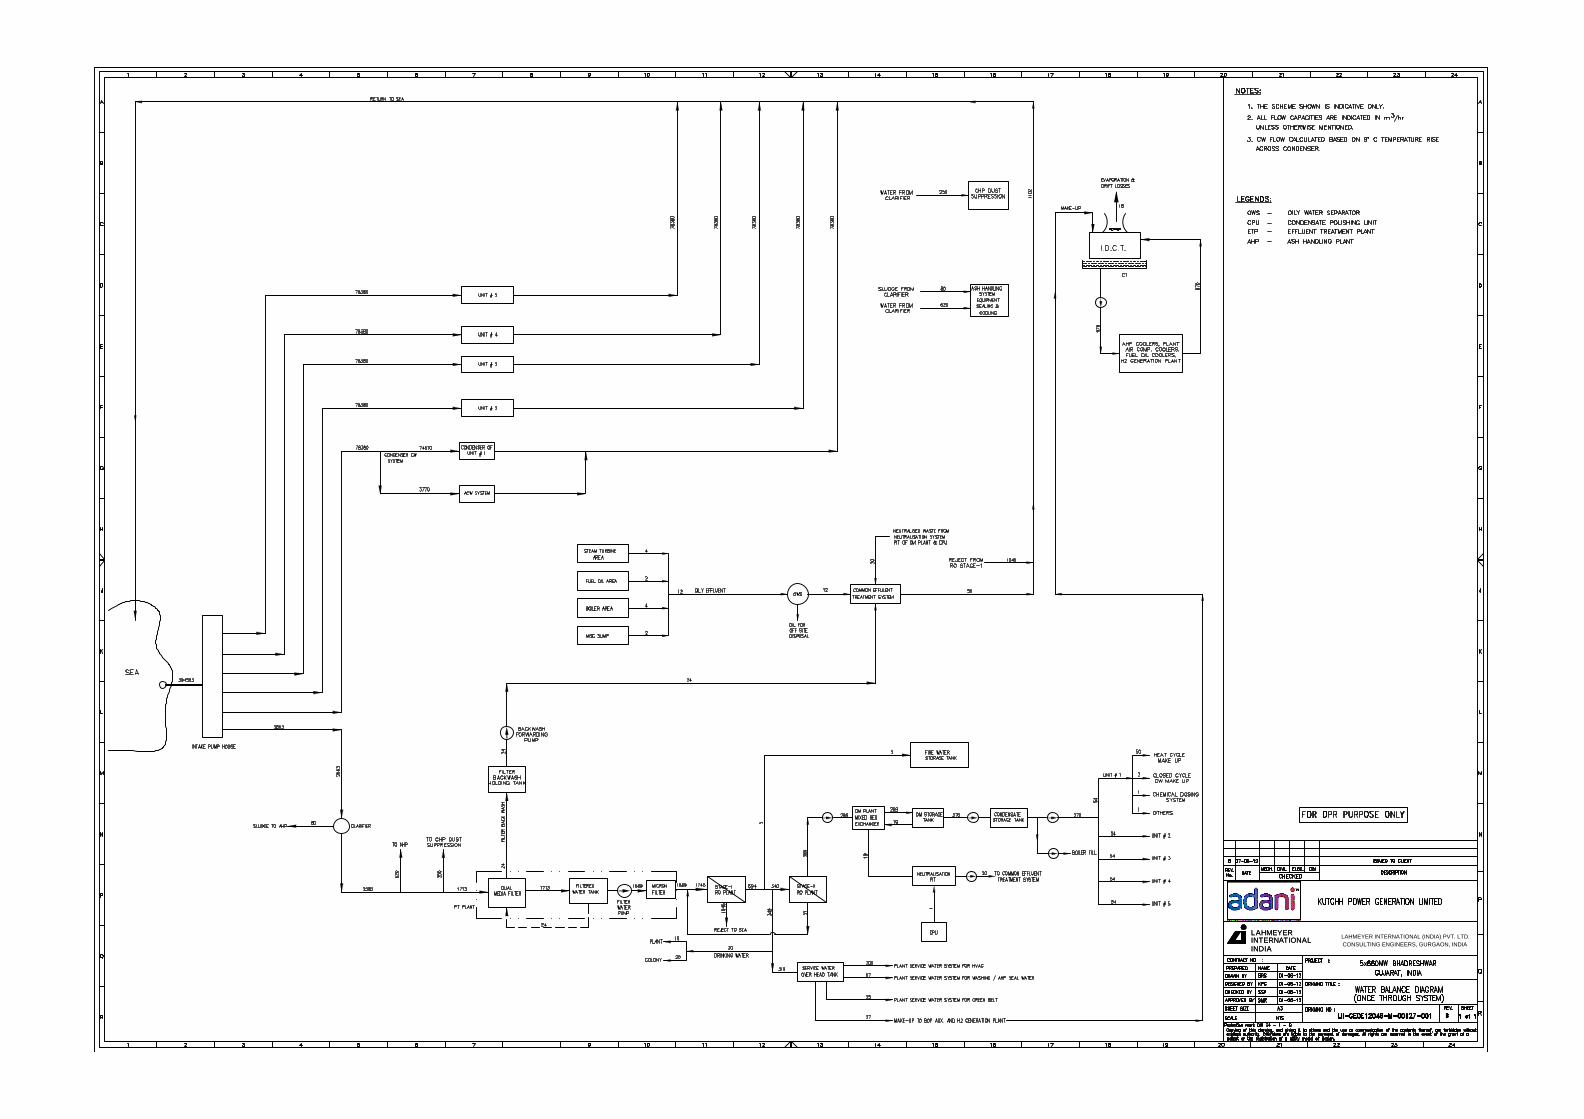
LAHMEYER INTERNATIONAL (INDIA) PVT. LTD.CONSULTING ENGINEERS, GURGAON, INDIA
ETN
YA
ELNIATHEMR N
ROI AL
NI DIA
ETN
YA
ELNIATHEMR N
ROI AL
NI DIA

Annexure II
KPGL Plant, Intake & Outfall, Superimposed on CRZ Map
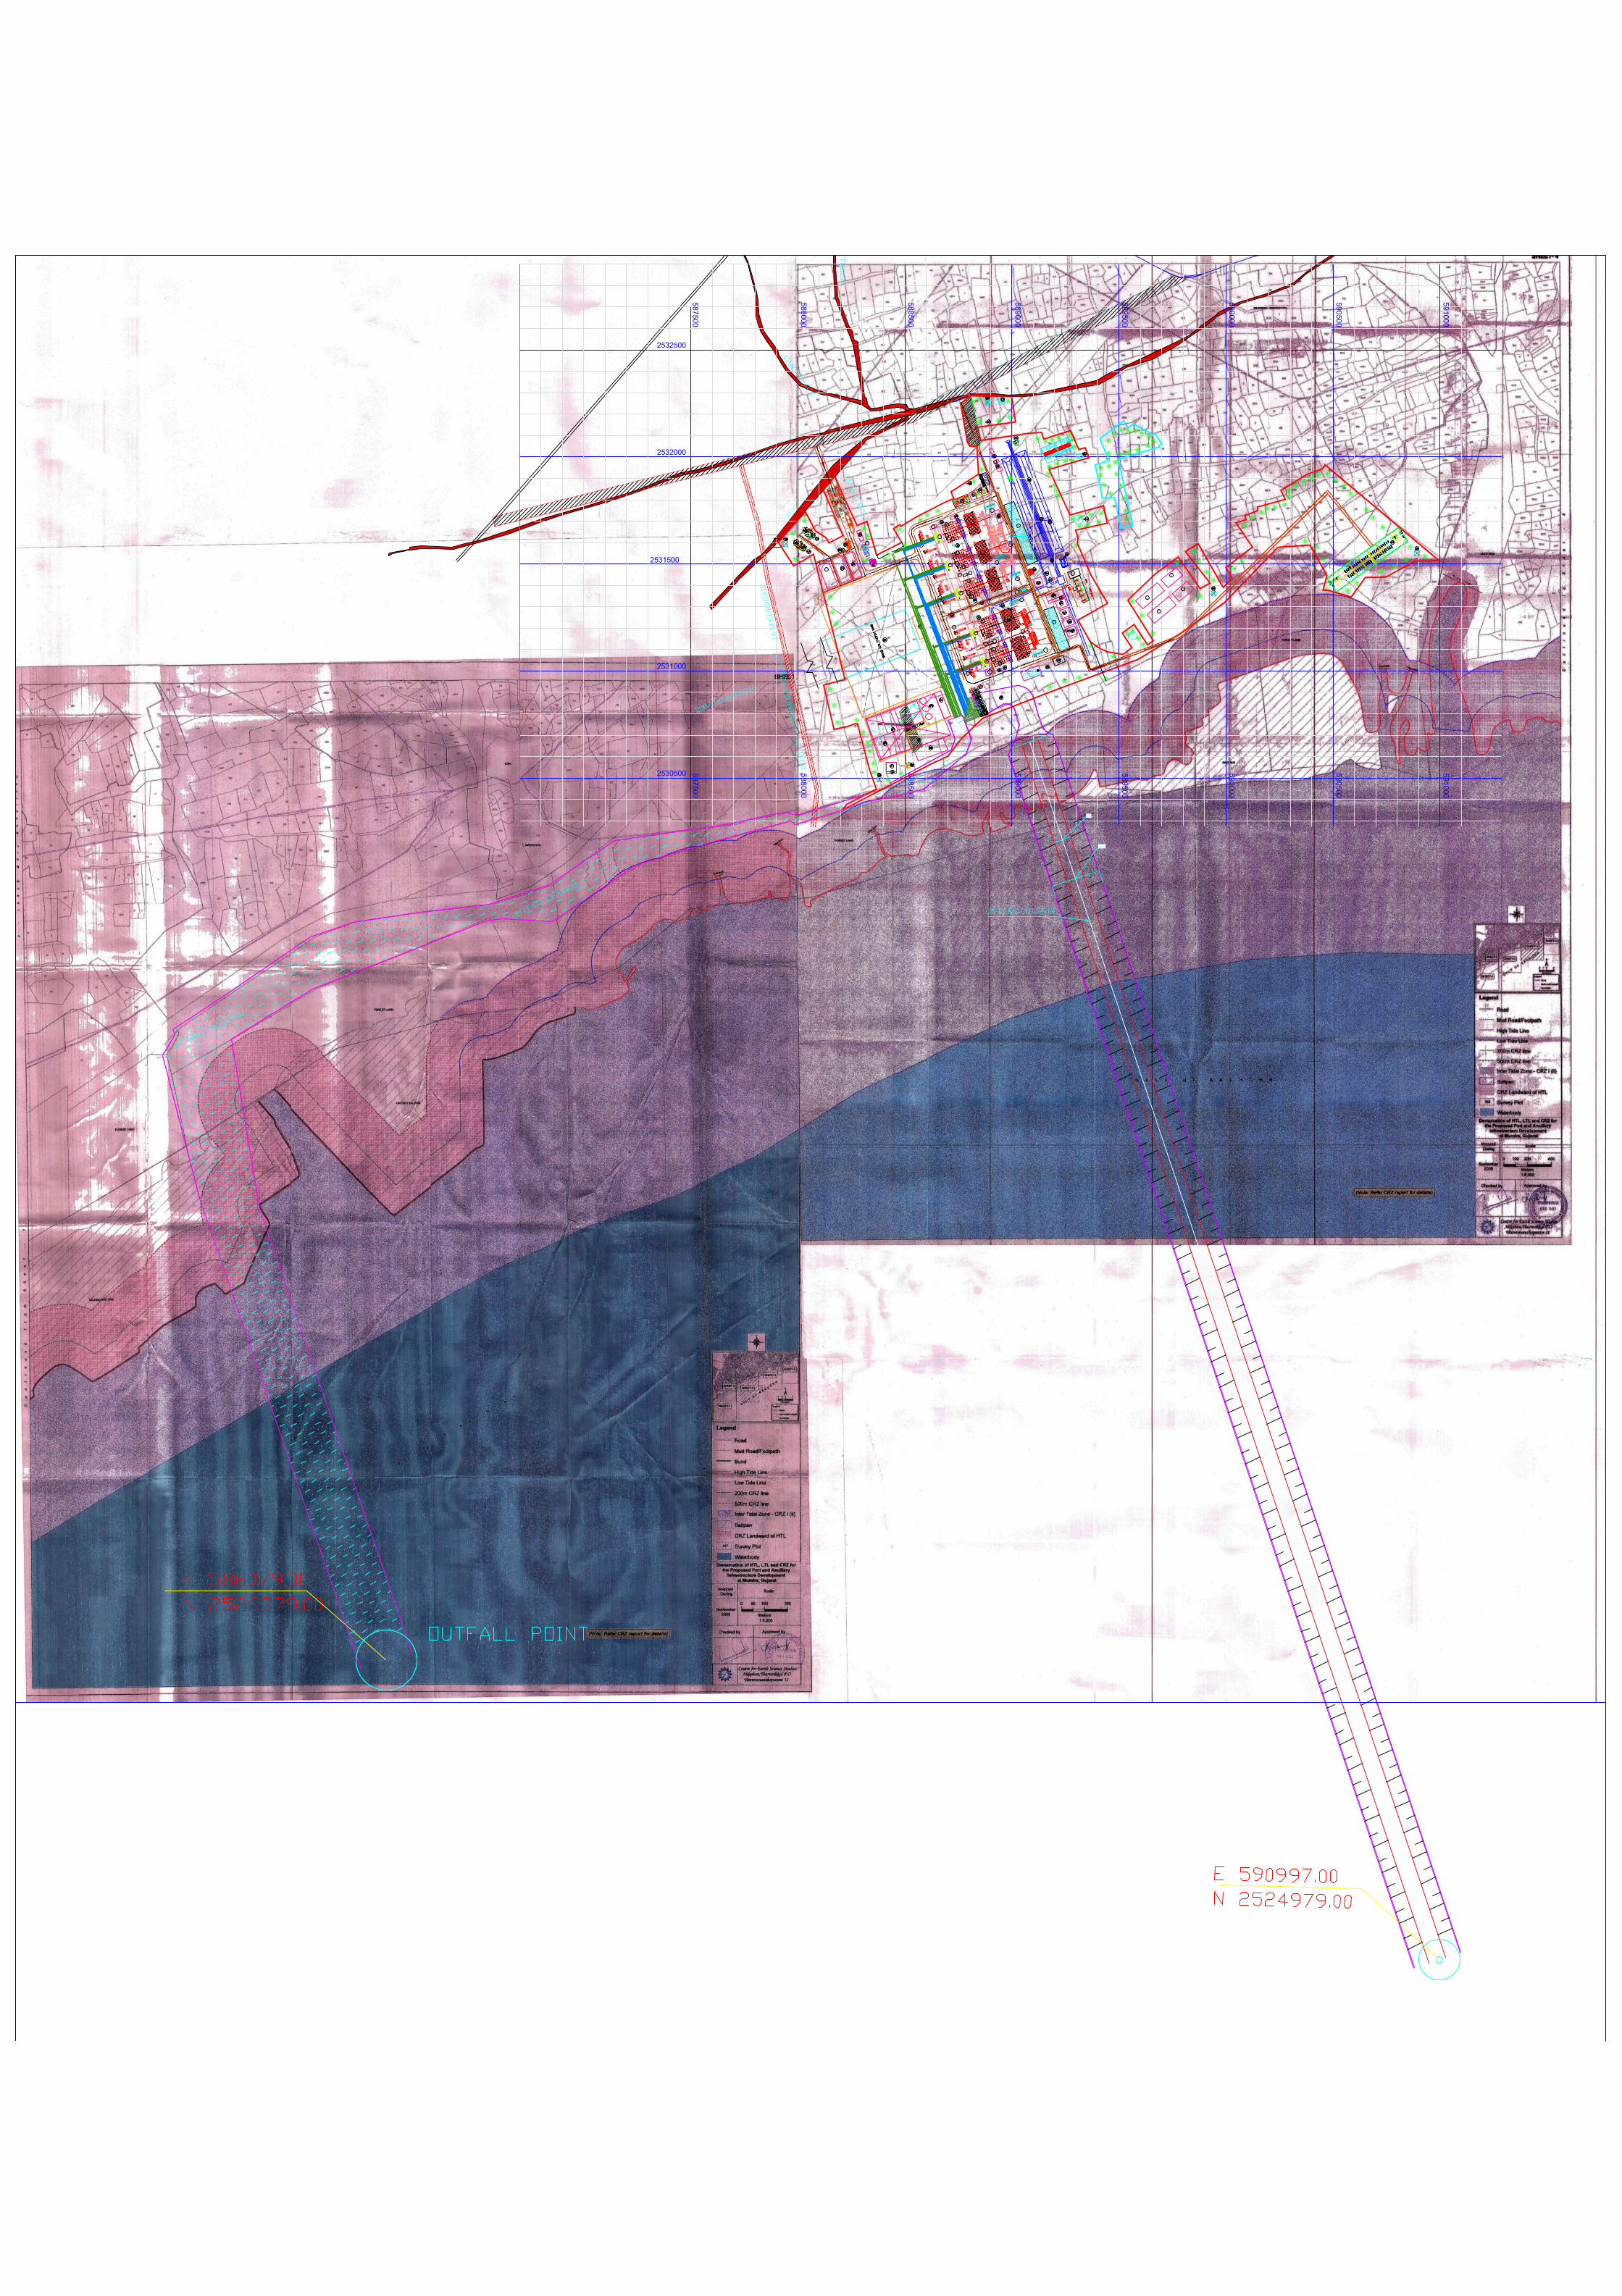
M
A
T
E
R
I
A
L
G
A
T
E
2
2
.
0
M
W
I
D
E
R
O
A
D
2
2
.
0
M
W
I
D
E
R
O
A
D
3
.
7
5
M
W
I
D
E
R
O
A
D
3
.
7
5
M
W
I
D
E
R
O
A
D

Annexure III
Marine Environment of Gulf of Kutch

Marine Environmental Impact Assessment Report of Kutchh Power Generation Limited, Bhadreswar & Wadala
Villages, Mundra Taluka, Kutchh District
Cholamandalam MS Risk Services - 1 -
Annexure III
1. Marine Environment of Gulf of Kutch – Overview
Gulf of Kutch occupying an area of 7300 km2 is biologically one of the most productive and
diversified habitats along the west coast of India. The southern shore of Gulf has numerous
Islands and inlets which harbour vast areas of mangroves and coral reefs with living corals. The
northern shore with numerous shoals and creeks also sustains large stretches of mangroves. A
variety of marine wealth existing in the Gulf includes algae, mangroves, corals, sponges,
molluscs, prawns, fishes, reptiles, birds and mammals.
Figure 1: Satellite Imagery showing Proposed Project location in Gulf of Kutch
Industrial and other developments along the Gulf have accelerated in recent years and many
industries make use of the Gulf either directly or indirectly. Hence, it was necessary that the
existing and proposed developments were planned in an eco-friendly manner to maintain the
high productivity and biodiversity of this region.
Project Site
Source – Google Earth 2011
Marine Environmental Impact Assessment Report of Kutchh Power Generation Limited, Bhadreswar & Wadala
Villages, Mundra Taluka, Kutchh District
Cholamandalam MS Risk Services - 2 -
This state of art report on the biota of the Gulf has been prepared based on secondary data
scattered over a wide array of technical reports and scientific publications. There are fairly large
numbers of research publications on the biological aspects, particularly relevant to mangroves,
corals, benthos and fishery of the Gulf region.
The studies on algae cover mainly on their diversity, exploitation and chemical contents in
certain species. Status and ecological aspects of mangroves in the Gulf of Kutch have been well
documented. However, limited information exists on phytoplankton and zooplankton population
as regards their distribution, both qualitative and quantitative. Enormous amount of knowledge
available on benthos including pearl oysters, oysters, macrobenthos etc as well as species
diversity of gastropods and pelecypods, echiuroids, crabs, holothuroids, sponges and sipunculids.
Fishery reports include details on chief schooling fishes, demersal fishery, fishery of major
species found in the Gulf and fishery potential of the interior Gulf. The papers on prawn fishery
include catch composition abundance and diversity of common shrimps and seasonal prawn
fishery of Little Rann of Kutch. Literature is also available on the molluscan fishery of the Gulf
which covers the pearl fishery potential, exploitation of chank fishery and oyster and cephalopod
resources.
Studies have been attempted evaluating Artemia and fish/ prawn resources of the saltpans of
Gulf. Abundance and diversity of corals, their ecology and resource potential, research and
management are some of the areas covered under coral reefs, however, meager information exist
on reptiles and mammals. Avifauna of the Gulf is very rich and very well documented.
Anthropogenic pressures and deterioration of ecologically sensitive habitats and their need for
protection, conservation and rehabilitation, are some of the major attentions received during
recent studies in the Gulf of Kutch.
1.1 Types of ecosystems
Saltpans are unique tide water impounded enclosed system adjacent to creek environment in
Gulf. The distinct feature of the brine ecosystem is its biotic simplicity and stability. Species
diversity is directly linked with salinity, the higher the salinity, the lower the species diversity.
About 21 salt work units have been reported to be operation in GoK.

Marine Environmental Impact Assessment Report of Kutchh Power Generation Limited, Bhadreswar & Wadala
Villages, Mundra Taluka, Kutchh District
Cholamandalam MS Risk Services - 3 -
The intertidal habitat of the Gulf covers a wide range of ecosystems like sandy beaches, mud
flats, rocky shore, seagrass beds, salt marshes and mangroves. The intertidal expanse of the Gulf
increases towards upstream. The increase was from 0.5 to 2 km from Jakhau to Kandla and from
around 1 km at Okha to over 10 km at Navlakhi. Entire Gulf though subjected to extreme climate
sustains a rich and highly diversified intertidal flora and fauna.
The area under mangrove cover along the Gujarat coast is the second largest in India, next only
to the Sundarbans. Over 96% of the total 991 km2 of mangrove cover in the state occurs in GoK.
Due to high salinity,and constant grazing and illegal felling and cutting, the mangroves in
general, exhibit stunted (1 -2 m) growth, however, at untouched patches mangroves gain a
height up to 5 m.
The Gulf contributes to the maximum species diversity and biomass of marine macroalgae for
the west coast of India. The southern coast of Gulf supports luxuriant growth of marine algae
while the northern shore has very poor algal biodiversity due to high turbidity. Ridges of loose
sand drifted by wind often support sand dune vegetation and 5 species predominated the
community.
Coral reefs are shallow water tropical marine ecosystem known for its high biological
productivity. The coral formations in the Gulf are found exclusively along the coast of Jamnagar
district. The Gulf is the only area in Gujarat where corals exist with high diversity and density
and reefs are classified as fringing, platform, patch and coral pinnacles. The most northerly reefs
are coral patches predominantly observed at Munde, Pirotan and Narara Island reefs, and solitary
corals occur as far as Jakhau in the east and Dwarka in the Saurashtra coast.
1.2 Marine National Park and Marine Sanctuary
The southern Gulf between Okha to Navlakhi of Jamnagar district was declared as Marine
Natural Park (MNP) to protect and conserve the fragile ecosystem, particularly the coral reefs
and mangrove habitats. As per the State Government notification (No. AKH-138-(2)-82-WLP-
1081-126827-V2) dated 20th July 1982, an area of 457.92 km2 of MNP includes 148.92 km2 of
42 islands of various size harbouring coral and mangrove regions and 309 km2 intertidal zones
along the coast.

Marine Environmental Impact Assessment Report of Kutchh Power Generation Limited, Bhadreswar & Wadala
Villages, Mundra Taluka, Kutchh District
Cholamandalam MS Risk Services - 4 -
Figure 2: Map showing boundaries of marine national park
1.3 Flora and fauna of GoK
Mangroves and Algae
Off Okha, Avicennia marina was the only species of mangrove found either as dense areas or in
degraded patches with three associated halophytes (Nair, 2002). Okha segment harbours rich
algal flora of 59 species. Sikka-Salaya region has extensive growth of mangroves. Avicennia
stands near Salaya were recorded to be scrubby in nature. Though A. marina was observed as
dominant species in the Gulf, in some areas, four more associated species do occur. Intertidal
areas around Vadinar harbour dense mangroves mainly constituted by A. marina. Narara Island
sustains six species of mangroves and 4 associated species. A total of 62 species of algae and
four species of seagrasses have been recorded from this region. At Kalubhar island, the
mangrove area was represented by six species, dominant being A. marina. There were three
associated halophytes observed in Gulf. The intertidal segment supports 47 species of marine
algae and three species of seagrasses. Marine algal flora from Sikka reported to be comprised of

Marine Environmental Impact Assessment Report of Kutchh Power Generation Limited, Bhadreswar & Wadala
Villages, Mundra Taluka, Kutchh District
Cholamandalam MS Risk Services - 5 -
42 spp. Mangroves comprised mainly of A. marina along with two species of halophytes. At
Bedi mangroves observed either as continuous fringing dense stretches or in large patches and
flora was represented by five 5 spp with predominance of A. marina. The obligate halophytes in
the region constitute four spp. Extensive growths of seaweeds on the reef of Pirotan Island
recorded to be comprised of 44 species of marine algae. Beach vegetation at Pirotan sustained
four 4 spp of sand dune flora. Mangroves of Navlakhi region were of the fringing type and
Salicornia brachiata found to be predominant associate. Two associated species were observed at
Navlakhi.
In general, the northern shore of the Gulf supports very poor algal diversity. The intertidal region
of Luni has stray mangroves mainly of A. marina along with occasional presence of the
halophyte Sueda maritime while Enteromorpha sp. commonly represent algal flora. The
mangroves around Mundra Port were some of the best formations along the northern shore of the
Gulf and were represented by two species with predominance of A. marina and three obligate
halophytes. Extensive mudflats at Jakhau harbour dense mangroves dominated by A. marina and
six associated species. Monotypic patches of A. marina were observrd towards the interior part
of Kharo creek. Kori creek has vast mangrove coverage along east and north shores with
predominant formations of A. marina forest mixed with seven associated forms.
Chauhan and Krwashnamurthy (1968) estimated biomass of alginic acid potential marine algae.
Observations on marine algae from the submerged Dona reef in the during 1968 and 1969
(Gopalakrashnan, 1969) revealed the presence of 55 species of algae belonging to 42 genera. A
successful experiment in exploitation of Sargassum (Alginophyte) sp. around Sikka was taken up
(Brahmbhat et al., 1979). Floristic study of Sargasum of Gujarat coast indicates that among the
different species Sargassum tenerrimum contributes 70-80% of Sargassum flora (Chauhan,
1985). The alginic acid contents of Turbinaria indica in the Gulf was taken up by Solanki et al.
(1986). He observed that S. cinereum and S. cinctum were commonly associated with S.
tenerrimum in the Gulf. Other species found along the coast of Okha and adjacent regions were
S. swartzii. Hydroclathrus tenuis marine brown alga had been reported from Kalubhar during
1994 (Jagtap and Untawale, 1996). Jagtap et al. (2003) had reviewed the status of seagrass
ecosystem in the GoK.
Marine Environmental Impact Assessment Report of Kutchh Power Generation Limited, Bhadreswar & Wadala
Villages, Mundra Taluka, Kutchh District
Cholamandalam MS Risk Services - 6 -
Utilization of mangrove forests in Sourashtra and Kutch has been described by Kulkarni (1957).
A status of the mangroves along the west coast of India was reviewed by Untawale (1980).
Rajagopalan (1983) have made a comparative study on the ecological aspects of mangrove
biotopes in four different regions of India which included the Gulf. Present status of mangrove,
coral and island ecosystems along the Indian coast was evaluated in detail based on their
structure, production, utilization and management (Untawale, 1983). Untawale and Ambiye
(1988) studied the flora of Bet Shankhodar in the Gulf of Kutch. The distribution of mangroves
along the Gulf of Kutch was evaluated in detail (Untawale and Wafar, 1988). A review on
mangroves of India was made by Ray (1991), while Untawale and Wafar (1991) evaluated the
status of mangroves along the west coast of India. Successional stages of mangroves in the Gulf
were worked out by Singh (1996). Socioeconomic significance of mangroves for coastal people
of India has been described by Untawale and Jagtap (1999). A detail on the large scale mangrove
afforestation programme being implemented with the help of forest department was reported by
Muley (1997). Naskar and Mandal (1999) had reviewed the ecology and biodiversity of
mangroves in Gulf. Growth patterns of mangroves in the Gulf were given in detail by Singh
(2000). Major biotic constituents, conservation and management of Indian mangroves were
evaluated by Jagtap et al. (2002).
Phytoplankton
In south coast of Gulf, Chlorophyll a shows marginally higher concentration at Okha and Bedi
(av. 1.5 mg/m3), followed by Salaya (1.4 mg/m3), Sikka (1.3 mg/m3), Navlakhi (1.2 mg/m3) and
Vadinar (0.8 mg/m3). Phaeophytin values were lower than chlorophyll a at all segments
suggesting a delicate balance between the growth and mortality of algae (Nair, 2002). Cell count
was observed to be maximum off Okha (av. 654.2 x 10³/L) with moderate values at Bedi (av.
118 x 103/L) and Sikka (71.7 x 10³/L). Total number of genera represented in the samples was
fairly high at all segments with comparable values (av. 9-11) except at Navlakhi (av. 17).
Generic diversity of phytoplankton at Okha, Vadinar, Sikka, Bedi and Navlakhi were recorded to
be 40, 43, 38, 32 and 17, respectively, indicating a rich assemblage at all locations except
Navlakhi. Temporal variation in phytoplankton pigments at different segments along the
southern Gulf indicates that peak chlorophyll a concentration was observed either in the morning
Marine Environmental Impact Assessment Report of Kutchh Power Generation Limited, Bhadreswar & Wadala
Villages, Mundra Taluka, Kutchh District
Cholamandalam MS Risk Services - 7 -
or evening hours at Okha, Vadinar and Bedi while at other segments the pattern reported was
irregular. Chlorophyll a concentrations remain maximum during ebb at Okha, Salaya, Sikka
and Bedi while flood period sustained peak in chlorophyll a concentrations at Salaya, Vadinar
and Bedi.
In north coast of Gulf, Phaeophytin on a few occasions show higher values at bottom as
compared to chlorophyll a. Chlorophyll a in the water column was maximum at Kori creek (2.3
mg/m3 followed by Kharo creek (2.1 mg/m3), Mundra (2.0 mg/m3) suggesting moderately high
primary production potential. The levels of chlorophyll a at Kandla, Luni and Jakhau were
moderate (1.0-1.4 mg/m3). Phaeophytin values were mostly lower than chlorophyll a indicating a
healthy condition.
Phytoplankton population was high at Luni (202.7 x 10³/L), Mundra (112 x 103/L) and Jakhau
(171 x 103/L). Moderate cell counts were observed at Kandla and Kori creek with very low value
at Kharo creek. Maximum genera were found at Jakhau (av. 18) and Luni (av. 13). Moderate
diversity was observed at other segments with very low value (av. 4) at Kharo creek. Total
number of genera recorded at Kandla, Luni, Mundra, Jakhau, Kharo creek and Kori creek were
found to be 27, 27, 22, 18, 18 and 28, respectively. Temporal variation in phytoplankton
pigments does not indicate any regular pattern. In general, ebb period sustains higher
concentration of pigments at Mundra and Kori creek. At Kandla and Jakhau the flood period
have higher pigments while at Luni tidal difference was not imminent.
Plankton of the Kandla port area was studied by Ramamurthy and Dhawan (1963) while Dhawan
(1970) did detailed studies on the seasonal variations of phytoplankton in relation to the
hydrological factors at Kandla. Seasonal sequence and abundance of 57 species of diatoms were
studied off port Okha (Gopalakrishnan, 1972). In the northern Arabian Sea highest primary
production has been reported from the Gulf and Indus river discharge area (Kuzmenko, 1973).
Studies on the marine planktonic diatoms indicated the presence of 63 spp of diatoms in the Gulf
(Mahyavanshi, 1975). The biological characteristics off Mithapur indicate fairly high
productivity in term of phytoplankton pigments and macrobenthos, but the area sustained low
standing stock of zooplankton (Gajbhiye et al., 1988).
Marine Environmental Impact Assessment Report of Kutchh Power Generation Limited, Bhadreswar & Wadala
Villages, Mundra Taluka, Kutchh District
Cholamandalam MS Risk Services - 8 -
Zooplankton
Zooplankton standing stock was low off Okha (av. 3.4 ml/100m3) and Vadinar (av. 4.9
ml/100m3). Fairly high values were observed off Bedi (8.7 ml/100 m3) and Sikka (11.2
ml/100m3) with high biomass at Salaya (28.8 ml/100m3) and Navlakhi (22.1 ml/100 m3).
Population density of zooplankton shows a different trend with the highest density off Okha
(209.3 x 10³/100 m3) and fairly high values off Salaya and Bedi (Nair, 2002). Moderate values
were observed at other segments. Faunal representation was almost consistent at all segments
(av. 10-12 103/100 m3). Zooplankton faunal groups represented at Okha, Salaya, Vadinar, Sikka,
Bedi and Navlakhi were 23, 16, 21, 23, 20 and 18, respectively. Temporal variation of
zooplankton standing stock shows that the pattern of variation was comparable between biomass
and population. Zooplankton biomass was maximum during the early hours as observed at Okha,
Salaya, Vadinar and Bedi while irregular pattern was reported at other segments. Tidal variation
shows maximum biomass during ebb period except at Sikka and Navlakhi.
Biomass of zooplankton was fairly high at the segments between Kandla and Jakhau with
moderate value at Kori creek and very low value at Kharo creek. Maximum standing stock was
seen at Kandla (26.2 ml/100m3). However, population density was highest at Kharo creek (181.2
x 103/100m3). Population density at other segments was moderately high except at Jakhau where
the population was relatively low. Group diversity was comparable between segments except for
the relatively low vale at Kharo creek. Total number of groups recorded was more at Kandla,
Mundra and Kori creek (20-21), relatively low at Luni and Jakhau (16-18) and the lowest at
Kharo creek (14). Total number of faunal groups found at Kandla, Luni, Mundra, Jakhau, Kharo
creek and Kori creek were 20, 13, 20, 18, 14 and 21, respectively. Temporal variations in
zooplankton biomass and population show comparable pattern of distribution. Peak in
zooplankton standing stock was highest during morning or in the evening at Kandla, Mundra,
Jakhau and Kori creek. Flood period shows peak in zooplankton standing stock at all segments
except at Mundra.
Decapod larvae of Callianassa tyrrhena were reported as a new record from the Gulf (Patil and
Mahyavanshi, 1974). Studies on zooplankton from the north and northeastern Arabian Sea
indicate maximum biomass. Outside Gulf waters (Paulinose and Aravindakshan, 1976; Govindan

Marine Environmental Impact Assessment Report of Kutchh Power Generation Limited, Bhadreswar & Wadala
Villages, Mundra Taluka, Kutchh District
Cholamandalam MS Risk Services - 9 -
et al. (1977) reported to have zooplankton-standing stock of about 4.5 times more as compared
to the same in the waters of interior Gulf. Madhupratap and Haridas (1992 and 1994) described
two new species namely Pseudodiaptomus pankajus and Acartia sarojus from the salt pans of
the Gulf. Zooplankton characteristics of the Gulf of Kutch with special reference to larvae of
decapods and fishes were studied by Paulinose et al. (1998).
Benthos
Intertidal macrobenthos
Intertidal macrobenthic biomass was very high at Vadinar (148 g/m2) and Sikka (151 g/m2)
compared to Bedi (64.5 g/m2) and Okha (11.7 g/m2). Trend in population density followed the
same pattern like that of biomass. Group diversity in the collection was maximum at Okha (av.
18 Nos) with comparable values for other segment (av. 9-10 Nos). Faunal representation was
maximum at Vadinar (41 Nos) followed by Okha (32 Nos), Sikka (31Nos) and Bedi (26 Nos).
Kharo creek has very rich intertidal benthic biomass (av. 509.1 g/m2) and population (av.
59173/m2). Kori creek also sustains high intertidal biomass (av. 42.2 g/m2) with moderate
population (av. 1073/m2). Moderate to high standing stock was observed at Luni and Mundra.
Kandla and Jakhau support low intertidal standing stock(SNC). Number of groups represented
was relatively more at Mundra (av. 16 Nos) and Luni (av. 13 Nos), moderate at Kandla (av. 9
Nos) and low at Jakahu to Kori creek (av. 4 -6 Nos). Total number of groups recorded from
different segments shows maximum number at Mundra (28 Nos) followed by Kandla (23 Nos).
Subtidal macrobenthos
The subtidal macrobenthos at all segments were low as compared to the intertidal standing stock
except off Okha. Subtidal benthic biomass was maximum off Bedi (av. 44.5 g/m2) with moderate
values off Vadinar and Sikka. Biomass, population density and group diversity of subtidal
benthos were low off Salaya and Navlakhi. Group diversity at other segments was fairly high
(av. 9 -11 Nos). Compwered to group diversity of intertidal werea, subtidal community shows
relatively low number of groups except at Okha (av. 41 Nos). At other locations, the number
varied between 24 and 28 Nos.

Marine Environmental Impact Assessment Report of Kutchh Power Generation Limited, Bhadreswar & Wadala
Villages, Mundra Taluka, Kutchh District
Cholamandalam MS Risk Services - 10 -
Subtidal benthic biomass and population were in general lower at different segments as
compared to the values of intertidal data. High subtdial biomass (40 g/m2) and standing stock
(av. 14098/m2) were observed at Kharo creek. Low to moderate values of biomass were recorded
at other segments with very low value at Kandla (1.3 g/m2). Subtidal population was relatively
high at Luni, Jakhau and Mundra with lowest values at Kandla and moderate population at Kori
creek. Group diversity was moderately high at Luni and Mundra (av. 10-11 Nos) while the
number was low at other segments (av. 3-5 Nos). Numbers of subtidal macrobenthic groups
recorded were 24 Nos at Kandla and Mundra, 18 Nos at Luni, 17 Nos at Jakhau, 13 Nos at Kori
creek and 6 Nos at Kharo creek.
Growth rate of the pearl oyster Pinctada pinctada of the Gulf with details in pearl formation was
worked out by Gokhale et al. (1954). Seventy-two species of gastropods belonging to 51 genera
were reported from Gulf (Menon et al., 1961). Kundu (1965) described 91 species of pelecypods
collected from the Gulf. Relation between age and linear measurements of Pinctada vulgaris of
the Gulf was studied by Narayanan and Michael (1968). A species of the genus Berthellina
(Opisthobranchia) of the Gulf was described by Narayanan (1970) while two doridacean
nudibranch species from the Gulf were reported as new to the Indian coast (Narayanan, 1971).
Distribution of benthic fauna of Gulf, off Dwaraka and Okha was investigated by Kasinathan et
al. (1973-74). Breeding of the pearl oyster Pinctada fucata of the Gulf was studied in detail by
Narayanan (1974) while influence of temperature on growth ring formation of the same species
was taken up by Pandya (1976). The potentiality of pearl formation in P. fucata of the Gulf was
taken up by Desai et al. (1977). Report of a new record of the lamellibranch Ctenoides
ferescabra was given by Patel (1983). Morphological differences between two oysters of the
Gulf – Crassostrea cucullata and C. crista-galli) was taken up by Katel and Jetani (1991) to
avoid ambiguity in identification of the two species. New records of a molluscan Homalocantha
secunda (Apte, 1998) and Maculotriton serrialwas (Apte, 1999) were made from Okha.
Foraminiferal study from Kharo creek revealed the presence of 47 spp in the surface sediment
samples collected within 4 to 13.5 m water depth (Nigam and Chaturvedi, 2000).

Marine Environmental Impact Assessment Report of Kutchh Power Generation Limited, Bhadreswar & Wadala
Villages, Mundra Taluka, Kutchh District
Cholamandalam MS Risk Services - 11 -
Corals
The southern coast of Gulf is known for its coral reefs with associated fauna. The diversity of
coral species in the Gulf is the lowest of all Indian reefs (Nair, 2002). A recent monograph
(1996) lists 40 spp and 23 genera of stony corals, 3 spp of soft corals and 4 spp of sea fans from
the Gulf. Most of these corals were hermatypes while only a few were ahermatypes.
The islands adjoining Okha coast harbour 34 species of corals. Salaya has a moderate live coral
population with variety and they are under environmental stress due to heavy sedimentation.
Sturdy corals like species of Goniopora, Porites, Favia and Goniastrea are common in the area.
At Vadinar 29 spp of corals were recorded from Narara Bet and 35 spp from Kalubhar. At
Narara Bet major species observed were Porites, Goniopora and Favia. The live coral colonies
area was relatively more at Kalubhar as compared to Narara Bet. The corals at Kalubhar were
represented mainly by the genera Favia, Favites, Porites, Goniastrea, Goniopora, Turbinaria
etc. Off Sikka, live corals were represented by 24 spp of scleractinians and sturdy corals like
Goniastrea and Porites dominated the area.
Records indicate the presence of 22 species of corals at Bedi. The predominant species found in
the area were Goniopora, Goniastrea, Porites and Favia. Navlakhi region does not have coral
reefs as intertidal area is muddy. The northern Gulf was reported to be totally devoid of the
corals.
New species of a rare bonellid Ikedella mwasakienswas were observed during the course of a
coral survey in the neighbourhood of the Gulf (Patel, 1976). The echiurans – Achaetobonellia
maculata, and Acanthobonellia vulgaris were abundant at 5 to 7 m depths at Pirotan Island
(Singhal, 1980). Distribution of five spp of Sipuncula and six spp of Echiura was carried out by
Singhal (1988). Study of Demospongiae of the Gulf shows the presence of 25 spp of sponges in
the Gulf (Thomas et al., 1996).
Generic diversity of the scleractinians around Positra point has been studied along the different
intertidal locations of reef building corals (Patel, 1978). Status report on corals of India provides
the details on the ecology and resources of these organisms from the Gulf (Wafar, 1986, 1999).
The Scleractinian corals of the Gulf were represented by 37 spp belonging to 24 genera out of

Marine Environmental Impact Assessment Report of Kutchh Power Generation Limited, Bhadreswar & Wadala
Villages, Mundra Taluka, Kutchh District
Cholamandalam MS Risk Services - 12 -
this 33 spp were hermatypes and the remaining 4 spp were ahermatypes (Pillai and Patel, 1988).
Ecological status of the coral reefs of the Gulf of Kutch and Lakshadweep was studied by
Bahuguna et al. 1992). Studies on the biology and ecology of coral reef fishes of Lakshadweep
also include observations on other coral reef ecosystems including the Gulf (Anand and Pillai,
1995). Contributions of Zoological Survey of India on the general pattern of coral reefs in the
Indian seas indicates coral reefs located closer to the shores of Gulf have been extensively
damaged/ destroyed due to industrial growth (Anon, 1997). Contribution of Central Marine
Fisheries Research Institute to the knowledge of coral reefs of India stress the need for regular
monitoring and specific guidelines for the effective management of the National Marine Parks
including that of the Gulf. (Devaraj, 1997). Hoon (1997) and Haq (1997) made a review on the
extent, condition, and research and management status of the coral reefs of India. This paper has
brought out the serious problems of stress from anthropogenic pressure on the coral reefs. A
state-of- the-art report on the coral reefs of India was compiled by the Environmental
Information System Centre (1998). Disease and stress-included mortality of coral in Indian reefs
were assessed by Ravichandran et al. (1999). A detailed account on the coral reefs of the Gulf of
Kutch was given by Deshmukhe et al. (2000).
Fishery
A description on the new species Metapenaeus kutchenwas from the Gulf was given by George
et al. (1963b). Prawn fishery of the Gulf of Kutch with emphasis on the catch composition was
studied by Ramamurthy (1963). In Gulf of Kutch, fishery starts just after the cessation of
monsoon in the land-locked lagoon of the Little Rann. Ramamurthy (1964) studied Metapenaeus
stebbingi from the commercial catch from the inshore waters of the Gulf and reported the species
as a new record. Another new species of Metapenaeus was reported from the Gulf (George et al.,
1966). Metapenaeus kutchenwas was the major constituent in prawn landing at Cherowari,
Sukhper and Lakhpat area of the Little Rann of Kutch and M. brevicornwas predominated during
winter (months) at Takara (Tuna) and Bhadreswar areas (Sarvaiya, 1978). The Little Rann of
Kutch supports a lucrative seasonal prawn fishery principally contributed by juveniles of
Metapenaeus kutchensis during the monsoon months (Rao, 1983). Large scale prawn harvest in
the Little Rann of Kutch during monsoon was described by Thakar (1982). Systematic study on

Marine Environmental Impact Assessment Report of Kutchh Power Generation Limited, Bhadreswar & Wadala
Villages, Mundra Taluka, Kutchh District
Cholamandalam MS Risk Services - 13 -
the three species of Metapenaeus (M. alcocki, M. krwashnatrii and M. kutchenswas) was taken
up by Miquel (1983). A survey was made on the fishing gear, Gunja net and methods used in the
prawn fishery of the coastal waters of the Gulf (Pillai and Gopalakrwashnan, 1984). The trawl
fishery of commercially important prawns at the mouth of the Gulf was studied with special
reference to biology of some prawns (Joseph and Soni, 1990).
Reptiles
The reptiles in the Gulf mainly represented by marine turtles Chelonia mydas and Lepidochelys
olivacea. A preliminary report on the status and distribution of sea turtles in Indian waters was
given by (Bhaskar, 1981) They breed and spawn on the sandy beaches along the coast as well as
on the island particularly along the southern Gulf between Okha and Okha Mandi and Vadinar-
Sikka coast and on the islands within the MNP.
Avifauna
The Gulf area, which has many saltpans, islands and intertidal coastal system with mangroves,
offer favourable conditions for feeding, breeding and shelter to a variety of birds. Grey herons,
Pond herons, Painted storks, large and small Egrets, etc. were commonly be found along creeks,
intertidal and mangrove regions. A total of 94 water birds have been reported (Grimmett) from
the Gulf. A recent study by Grimmett and Inskipp reveals high avifaunal diversity at Mundra
region and 140 species have been documented.
Information on the Indian reef heron and their breeding season were reported from Gujarat coast
and Gulf (Dharmakumarsinhji, 1984). The rise in global mean sea level was reported to affect
the flamingo breeding grounds (Kumar, 1986). The impact of the food availability, habitat
destruction and cultural variations of human settlements on the nesting distribution of the reef
heron Egretta gularwas were reported (Naik and Parasharya, 1987). Occurrence and distribution
of the slender billed Gull Larus genei from various localities in the GoK was studied by
Mundkur et al. (1988). Hitherto unreported nest site of lesser flamingo Phoeniconaias minor in
the Little Raan of Kutch (RoK) was represented by Mundkur et al. (1989). Report on the Great
Flamingo that started breeding in the Great Raan of Kutch (GRoK) after a gap of about thirteen
years after it was reported in 1991 ( Negi ,1993).

Marine Environmental Impact Assessment Report of Kutchh Power Generation Limited, Bhadreswar & Wadala
Villages, Mundra Taluka, Kutchh District
Cholamandalam MS Risk Services - 14 -
Mammals
Mammals are represented by dolphin, whale and Dugong especially along the Jamnagar coast.
Mohan (1963) reviewed and reported the presence of Dugong dugon along the Gulf where it was
popularly known as “Babloo’. Later, Frazier and Mundkur (1990) reviewed the records of
Dugong dugon from the Gulf and concluded that there is evidently a resident, breeding
population which needs to be protected which was later confirmed by Khacher (1998). First
record of sea whale, Balaenoptera borealwas from Salaya was made by Jani and Patel in 1995.
Annexure IV
Socio Economic Report

Socioeconomic Assessment
And
CSR Development Report
For
5 X 660 MW Coal Based Super Critical Thermal
Power Project
For
Kutch Power Generation Limited
Bhadreswar Village, Mundra Taluk
Kutch District, Gujarat
25th
August, 2012
Prepared by
Accredited EIA Consultant Organization
Certificate No: NABET/EIA/1011/011
Cholamandalam MS Risk Services Limited PARRY House, 4
th Floor,
No: 2, N.S.C Bose Road, Chennai - 600 001
Abbreviations
AIDS Acquired Immune Deficiency Syndrome
APCI Annual Per Capita Income
BCG Bacilli Chalmette Guerin – Vaccine
BPL Below Poverty Line
CMSRSL Cholamandalam MS Risk Services Limited
CSR Corporate Social Responsibility
DICE District Information System for Education
DPT Diphtheria, Pertussis & Tetanus – Vaccine
EIA Environment Impact Assessment
FGD Focused Group Discussion
GOI Government of India
HIV Human Immunodeficiency Virus
IDSP Integrated Disease Surveillance Project
IIPS International Institute of Population Sciences
MoEF Ministry of Environment and Forest
NIC National Informatics Centre
PHC Primary Health Centre
PHC-Sub Primary Health Sub Centre
RF Reserved Forest
U.I.P Universal Immunization Programme
UNAIDS United Nations Programme on HIV and AIDS
WBG World Bank Group
WHO World Health Organization
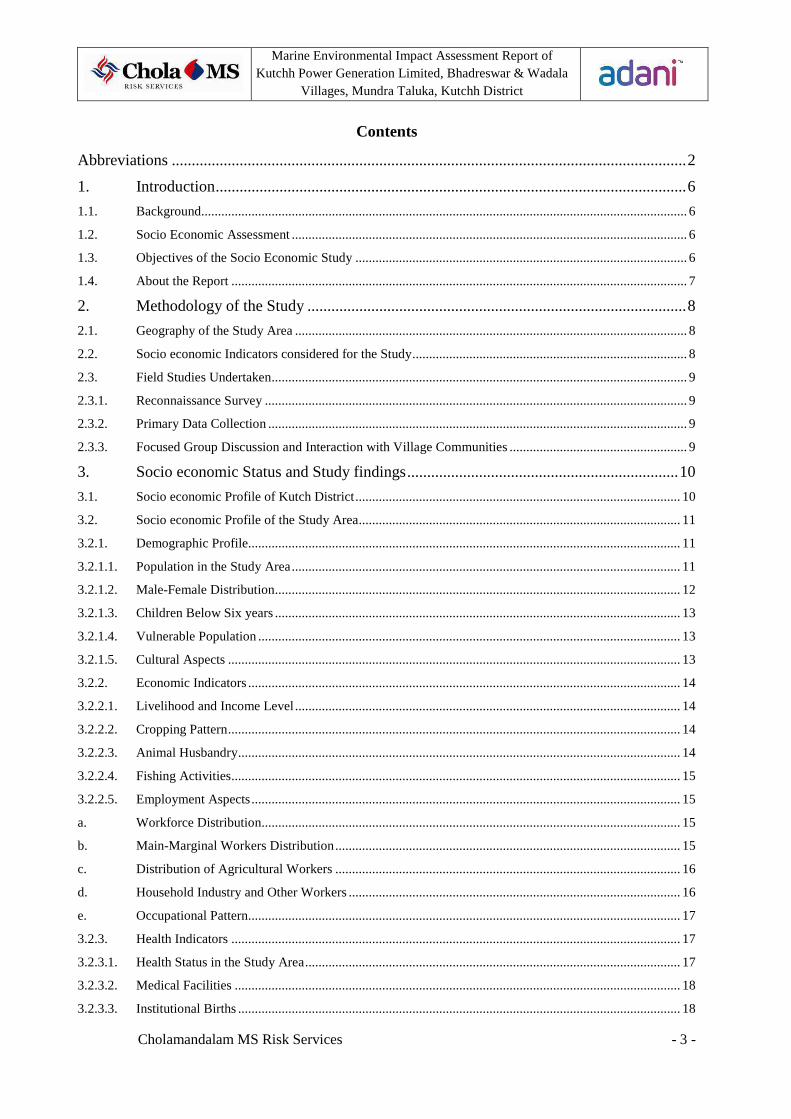
Marine Environmental Impact Assessment Report of Kutchh Power Generation Limited, Bhadreswar & Wadala
Villages, Mundra Taluka, Kutchh District
Cholamandalam MS Risk Services - 3 -
Contents Abbreviations ................................................................................................................................. 2
1. Introduction ...................................................................................................................... 6
1.1. Background................................................................................................................................................. 6
1.2. Socio Economic Assessment ...................................................................................................................... 6
1.3. Objectives of the Socio Economic Study ................................................................................................... 6
1.4. About the Report ........................................................................................................................................ 7
2. Methodology of the Study ............................................................................................... 8
2.1. Geography of the Study Area ..................................................................................................................... 8
2.2. Socio economic Indicators considered for the Study .................................................................................. 8
2.3. Field Studies Undertaken ............................................................................................................................ 9
2.3.1. Reconnaissance Survey .............................................................................................................................. 9
2.3.2. Primary Data Collection ............................................................................................................................. 9
2.3.3. Focused Group Discussion and Interaction with Village Communities ..................................................... 9
3. Socio economic Status and Study findings .................................................................... 10
3.1. Socio economic Profile of Kutch District ................................................................................................. 10
3.2. Socio economic Profile of the Study Area ................................................................................................ 11
3.2.1. Demographic Profile................................................................................................................................. 11
3.2.1.1. Population in the Study Area .................................................................................................................... 11
3.2.1.2. Male-Female Distribution ......................................................................................................................... 12
3.2.1.3. Children Below Six years ......................................................................................................................... 13
3.2.1.4. Vulnerable Population .............................................................................................................................. 13
3.2.1.5. Cultural Aspects ....................................................................................................................................... 13
3.2.2. Economic Indicators ................................................................................................................................. 14
3.2.2.1. Livelihood and Income Level ................................................................................................................... 14
3.2.2.2. Cropping Pattern ....................................................................................................................................... 14
3.2.2.3. Animal Husbandry .................................................................................................................................... 14
3.2.2.4. Fishing Activities ...................................................................................................................................... 15
3.2.2.5. Employment Aspects ................................................................................................................................ 15
a. Workforce Distribution............................................................................................................................. 15
b. Main-Marginal Workers Distribution ....................................................................................................... 15
c. Distribution of Agricultural Workers ....................................................................................................... 16
d. Household Industry and Other Workers ................................................................................................... 16
e. Occupational Pattern................................................................................................................................. 17
3.2.3. Health Indicators ...................................................................................................................................... 17
3.2.3.1. Health Status in the Study Area ................................................................................................................ 17
3.2.3.2. Medical Facilities ..................................................................................................................................... 18
3.2.3.3. Institutional Births .................................................................................................................................... 18
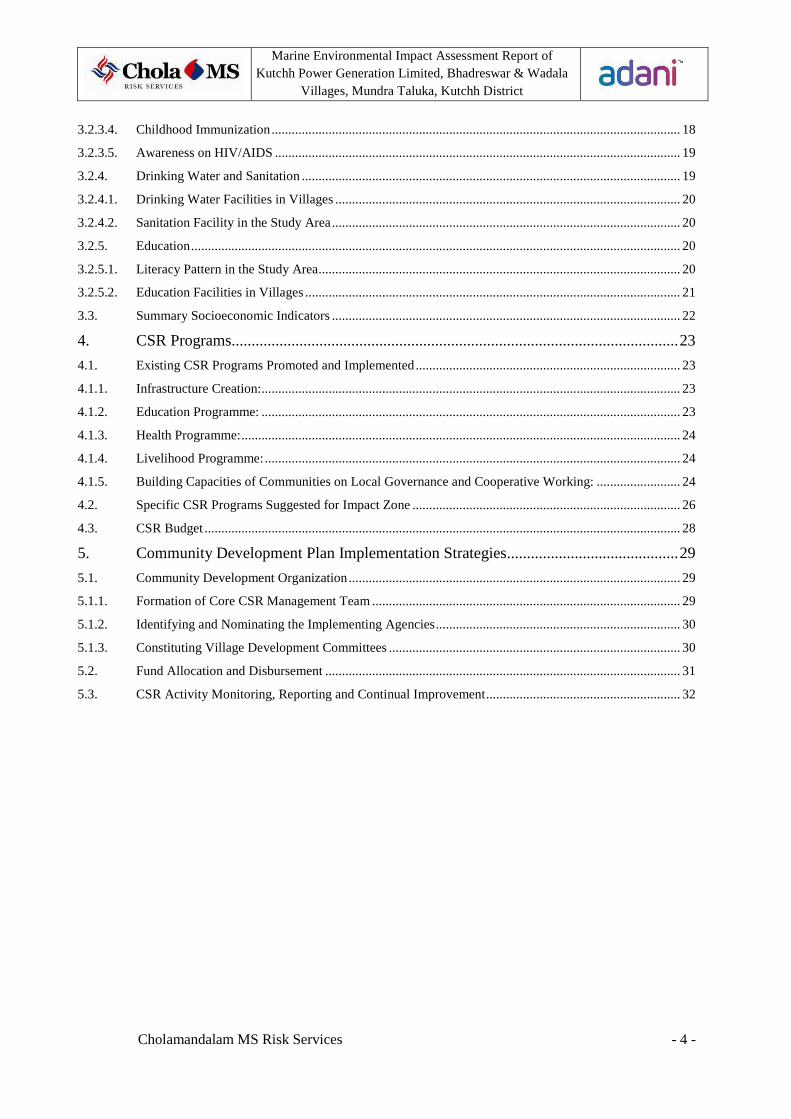
Marine Environmental Impact Assessment Report of Kutchh Power Generation Limited, Bhadreswar & Wadala
Villages, Mundra Taluka, Kutchh District
Cholamandalam MS Risk Services - 4 -
3.2.3.4. Childhood Immunization .......................................................................................................................... 18
3.2.3.5. Awareness on HIV/AIDS ......................................................................................................................... 19
3.2.4. Drinking Water and Sanitation ................................................................................................................. 19
3.2.4.1. Drinking Water Facilities in Villages ....................................................................................................... 20
3.2.4.2. Sanitation Facility in the Study Area ........................................................................................................ 20
3.2.5. Education .................................................................................................................................................. 20
3.2.5.1. Literacy Pattern in the Study Area ............................................................................................................ 20
3.2.5.2. Education Facilities in Villages ................................................................................................................ 21
3.3. Summary Socioeconomic Indicators ........................................................................................................ 22
4. CSR Programs................................................................................................................ 23
4.1. Existing CSR Programs Promoted and Implemented ............................................................................... 23
4.1.1. Infrastructure Creation: ............................................................................................................................. 23
4.1.2. Education Programme: ............................................................................................................................. 23
4.1.3. Health Programme: ................................................................................................................................... 24
4.1.4. Livelihood Programme: ............................................................................................................................ 24
4.1.5. Building Capacities of Communities on Local Governance and Cooperative Working: ......................... 24
4.2. Specific CSR Programs Suggested for Impact Zone ................................................................................ 26
4.3. CSR Budget .............................................................................................................................................. 28
5. Community Development Plan Implementation Strategies........................................... 29
5.1. Community Development Organization ................................................................................................... 29
5.1.1. Formation of Core CSR Management Team ............................................................................................ 29
5.1.2. Identifying and Nominating the Implementing Agencies ......................................................................... 30
5.1.3. Constituting Village Development Committees ....................................................................................... 30
5.2. Fund Allocation and Disbursement .......................................................................................................... 31
5.3. CSR Activity Monitoring, Reporting and Continual Improvement .......................................................... 32
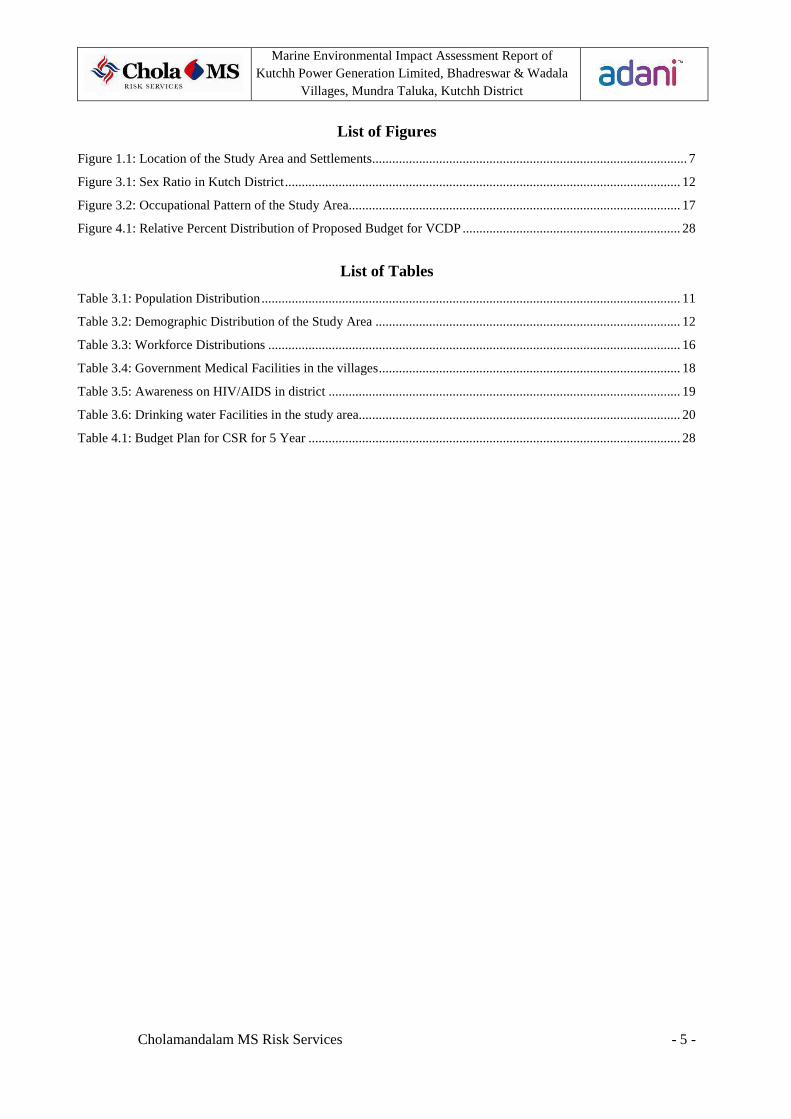
Marine Environmental Impact Assessment Report of Kutchh Power Generation Limited, Bhadreswar & Wadala
Villages, Mundra Taluka, Kutchh District
Cholamandalam MS Risk Services - 5 -
List of Figures
Figure 1.1: Location of the Study Area and Settlements.............................................................................................. 7
Figure 3.1: Sex Ratio in Kutch District ...................................................................................................................... 12
Figure 3.2: Occupational Pattern of the Study Area................................................................................................... 17
Figure 4.1: Relative Percent Distribution of Proposed Budget for VCDP ................................................................. 28
List of Tables
Table 3.1: Population Distribution ............................................................................................................................. 11
Table 3.2: Demographic Distribution of the Study Area ........................................................................................... 12
Table 3.3: Workforce Distributions ........................................................................................................................... 16
Table 3.4: Government Medical Facilities in the villages .......................................................................................... 18
Table 3.5: Awareness on HIV/AIDS in district ......................................................................................................... 19
Table 3.6: Drinking water Facilities in the study area................................................................................................ 20
Table 4.1: Budget Plan for CSR for 5 Year ............................................................................................................... 28

Marine Environmental Impact Assessment Report of Kutchh Power Generation Limited, Bhadreswar & Wadala
Villages, Mundra Taluka, Kutchh District
Cholamandalam MS Risk Services - 6 -
1. Introduction
1.1. Background
The Adani Group, an emerging conglomerate has decided to enhance the power generation
capacity, and has floated a special purpose vehicle - Kutch Power Generation Limited (KPGL)
to set up 5X660 MW Coal based Thermal Power Plant at Bhadreswar village, Mundra Taluk,
Kutch District, Gujarat.
Kutch Power Generation Ltd. has appointed Cholamandalam MS Risk Services Ltd (CMSRSL)
to prepare the Marine Environment Impact Assessment Report for the 5x660 MW coal-based
Thermal Power Plant at Bhadreswar, Mundra Taluk, Kutch District, Gujarat to facilitate
Environment Clearance for the same from Ministry of Environment and Forest (MoEF), Govt.
of India. As a part of Environment Impact Assessment, socioeconomic study is mandatory to
assess existing social and economic status of the study area for deeper understanding in planning
CSR activities.
1.2. Socio Economic Assessment
A Socio Economic Assessment (SEA) examines existing socio economic conditions of the study
area. The study includes assessing indicators such as Demographic, Social, Economic, Health
and Cultural aspects. The study illustrates the existing socio economic status of the study area
which helps to plan for need based CSR program. The project may be showing positive or
negative impacts, or even both. Positive impact may be creating new employment opportunities,
good transportation, increased land value etc. The negative impacts may be like losing their
livelihood, land, homestead, threat of outbreaks, threat of losing the public and aesthetic places
etc.
1.3. Objectives of the Socio Economic Study
As stated in the earlier subjections, the primary objective of this Socio Economic Assessment is
highlighted hereunder:
• To assess the socio-economic conditions and the local context of the people living in and
around the project area
• To develop a development program for the benefit of the community and mitigate the
likely impacts of the projects, if any

Marine Environmental Impact Assessment Report of Kutchh Power Generation Limited, Bhadreswar & Wadala
Villages, Mundra Taluka, Kutchh District
Cholamandalam MS Risk Services - 7 -
1.4. About the Report
The aim of this report is to develop a need based CSR program by engaging the community
involved and the stake holders of the concern, and mitigate the adverse impacts, if any. A
detailed study with various indicators was carried out to analyze the existing socio economic
status of the study area, which in turn helps to develop the Need Based CSR development plan.
First Chapter of this report deals with the introduction, background and the objectives of the
study. Second Chapter depicts various methodologies involved. Third Chapter presents
consolidated findings of the Reconnaissance Survey, secondary data analysis findings and the
outcome of the Focused Group Discussions. Chapter Four presents exiting CSR Programs
implemented by Adani foundation and suggested CSR Programs for the impact zone. Chapter
Five presents Community Development Plan and Implementation Strategies.
Figure 1.1: Location of the Study Area and Settlements

Marine Environmental Impact Assessment Report of Kutchh Power Generation Limited, Bhadreswar & Wadala
Villages, Mundra Taluka, Kutchh District
Cholamandalam MS Risk Services - 8 -
2. Methodology of the Study
This section presents the details such as geographical area considered for the study, socio
economic indicators, secondary data used, field study undertaken, which are depicted below:
2.1. Geography of the Study Area
The proposed project site is located at Bhadreswar village, Mundra Taluk, Kutch District,
Gujarat. Although the proposed project does not displace any human settlement, for the purpose
of the establishing the background socio economic conditions of the study area, the Panchayat
villages falling within the buffer zone of 10 km radius from the project site have been
considered for mapping socio economic aspects. The study area consists of 20 Panchayat
villages. Also, detailed village level socio economic indicators and data relating to amenities
have been considered during primary survey1 conducted in Mundra Taluk for developing a
detailed CSR plan. The Panchayat villages adjacent (Bhadreswar, Vadala, Luni, Pavdiara,
Kukadsar) to the project site are considered to be an impact zone as they are more vulnerable to
impact if any.
2.2. Socio economic Indicators considered for the Study
For the purpose of this study, both primary and secondary data relating various socio economic
indicators were collected. Primary survey was carried out in the villages of Mundra Taluk for
developing a detailed socio economic profile. The following indicators have been considered for
primary survey: family details, education status, household amenities, source of income, annual
income per house, age of marriage, employment, transport facilities, drinking water supply and
sanitation facilities, health aspects, cultural aspects, adverse impacts faced from the existing
plants and felt needs were discussed.
The secondary data includes the population and amenities data published by ‘Directorate of
Census Operations’, ‘BPL Census 2002’ published by Ministry of Rural Development, ‘District
Information System for Education (DISE)’ and ‘District Level Household Survey’ published by
International Institute of Population Sciences (IIPS) were used. The following parameters have
been extracted from the Census 2001: demography, literacy, health status, work-group
1 Community Needs Assessment for the CSR Activities in Mundra Taluka for Adani Foundation by VIKSAT,
Nehru Foundation for Development.

Marine Environmental Impact Assessment Report of Kutchh Power Generation Limited, Bhadreswar & Wadala
Villages, Mundra Taluka, Kutchh District
Cholamandalam MS Risk Services - 9 -
population, availability of amenities such as drinking water, transport, government health
centres and hospitals, and government schools and colleges. The following secondary data has
been collected from IIPS and presented in this report: immunization levels, institutional births
and awareness on HIV, use of contraceptives, family planning programs, and so on. Livestock
population has been collected from 18th Livestock Census Data of Department of Animal
Husbandry, Dairy and Fisheries, Ministry of Agriculture.
2.3. Field Studies Undertaken
The following activities were undertaken as a part of the field studies:
2.3.1. Reconnaissance Survey
Reconnaissance Survey was undertaken during February 2012. During this survey, primary data
in relation to geographical features, settlements, roads and amenities in the respective villages
were observed.
2.3.2. Primary Data Collection
For primary data of the study area, the reference were made from the report “Community Needs
Assessment for CSR Activities in Mundra Taluk” conducted by VIKSAT Nehru Foundation for
Development for the purpose of developing the Need Based CSR Development plan for the
existing CSR program of Adani Foundation. In this study, the 15-20% of the households is
interviewed to represent the status of the study area. Stratified random sampling method was
used for finding the sample. 1977 samples were surveyed.
2.3.3. Focused Group Discussion and Interaction with Village Communities
In addition to the quantitative data collected from the above two formats, qualitative data was
collected through Focused Group Discussions (FGD) with various stakeholders groups.

Marine Environmental Impact Assessment Report of Kutchh Power Generation Limited, Bhadreswar & Wadala
Villages, Mundra Taluka, Kutchh District
Cholamandalam MS Risk Services - 10 -
3. Socio economic Status and Study findings
3.1. Socio economic Profile of Kutch District
Kutch, a district in Gujarat state in western India, is traditionally known for handicrafts. Covering an area
of 45,652 km², it is the largest district in India. Kutch literally means something which intermittently
becomes wet and dry. A large part of this district is known as Rann of Kutch which is shallow
wetland which submerges in water during the rainy season and becomes dry during other seasons. Kutch
is virtually an island, as it is surrounded by the Arabian Sea in the west, the Gulf of Kutch in south and
southeast and Rann of Kutch in north and northeast.
Based on Census 2001, the district has a population of 1,583,225, of which 30% is urbanized. The
average population density of the district is about 33 inhabitants per square kilometer as against the state
population density of around 258. The population growth rate was about 20.90% (1991-2001). The
average household size is 5 persons. The district has a sex ratio of 942 females for 1000 males. The
children sex ratio was found to be about 921. Vulnerable population such as SC and ST were found to be
about 11.74% and 8.22% respectively. The district has a literacy rate of about 59.99% which is less than
the state's average (69.97%).
Kutch has emerged as a hub for chemicals, minerals, textiles, engineering, oil and gas, and port based
industries. Kutch is an ideal gateway to Asian, African and American markets as Mundra Port offers
shortest land route from any port to the vast hinterland of western and northern India. Industries in the
district such as minerals, port-based, engineering and auto, steel pipes, cement, salt, textiles, tourism and
infrastructure projects are the drivers of economy.
The district constitutes 60% of the total salt production of the state. Kutch is mineral rich region with
very large reserve of Lignite, Bauxite and Gypsum apart from other minerals. Kutch is also known for
handicrafts. Out of 136 industrial co-operative societies, 71 belong to handicrafts. Welspun, Adani Group
and Sanghi Group are the key industry players in the district.
Apart from salt, handicrafts and industrial contribution to the economy, agriculture also plays an
important role. Among the total geographical area of 19.57 lakh hectares 23% of the land is used for
cultivation. Among the land used for cultivation, only 40% of the land is irrigated. Major crops produced
in Kutch district are oil seed, bajra, jowar, cotton, pulses, date palms and brinjal.
With regard to amenities, Government health facilities such as 3 government hospitals, 10 community
health centers, 37 primary health centers and education facilities such as 12 Industrial Training institutes,
1512 primary school, 19 secondary school and 14 colleges are present.

Marine Environmental Impact Assessment Report of Kutchh Power Generation Limited, Bhadreswar & Wadala
Villages, Mundra Taluka, Kutchh District
Cholamandalam MS Risk Services - 11 -
Worker participation was about 38.25%, of which, about 18.57% were cultivators and nearly 23.58%
were agricultural labors. 4.98% of population is involved in household works and 52.85% of the working
population was involved in other employment activities.
3.2. Socio economic Profile of the Study Area
3.2.1. Demographic Profile
Under this component the following aspects have been studied:
a) Population in the Study Area, b) Male-Female Distribution, c) Children below 6 Years d)
Vulnerable Population, e) Cultural Aspects
3.2.1.1. Population in the Study Area
The study area is located in the southern part of the Mundra Taluk in Kutch district. Kutch is
inhabited by various groups and communities, who have settled after centuries of migration
from neighboring regions. The Kutchi language is predominantly spoken and other languages
like Gujarati, Sindhi and Hindi are spoken to a lesser extent. Cumulative population in the study
area is 22,690 from 4,681 households, which is about 11.94% of the district’s population. The
population growth rate was about 20.90% (1991-2001) (Table 3.1). Population density is 33
inhabitants per square kilometer as compared to district’s 258. Village-wise demographic
breakup is given in Table 3.2.
Table 3.1: Population Distribution in the Study Area
S. No Particulars Value
1 Number of Villages 20
2 Number of Urban Settlements -
3 Households 4,681
4 Population 22,690
5 Growth Rate 11.94%
6 Population Density/Sq.km 33
7 Crude Birth Rate (Dist) 27 Source: Census 2001.

Marine Environmental Impact Assessment Report of Kutchh Power Generation Limited, Bhadreswar & Wadala
Villages, Mundra Taluka, Kutchh District
Cholamandalam MS Risk Services - 12 -
Table 3.2: Demographic Distribution of the Study Area S.N
o Panchayat
Villages Househol
d Populatio
n Childre
n <6 Males Females
Sex Ratio SC ST
1 Baroi 590 2,741 484 1,396 1,345 963 420 95
2 Bhadresar 663 3,516 553 1,776 1,740 980 299 163
3 Bharudiya 1 1 0 1 0 0 0 0
4 Chhasra 257 1,176 174 611 565 925 76 373
5 Goersama 137 727 112 388 339 874 137 148
6 Gundala 408 1,730 295 882 848 961 519 91
7 Hatdi 139 625 126 340 285 838 0 114
8 Kukadsar 137 721 96 364 357 981 0 0
9 Kundrodi 198 868 131 428 440 1,028 225 77
10 Kuvay 25 109 21 47 62 1,319 0 109
11 Luni 480 2,666 501 1,362 1,304 957 311 85
12 Mokha 118 515 69 267 248 929 52 42
13 Pavdiara 30 200 27 107 93 869 0 0
14 Raga 28 130 27 60 70 1,167 0 0
15 Ratadiya 250 1,250 169 637 613 962 254 28
16 Sadau 310 1,345 244 683 662 969 361 164
17 Shekhadiya 121 715 168 362 353 975 48 0
18 Vadala 405 1,751 282 861 890 1,034 313 212
19 Viraniya 141 749 161 386 363 940 250 4
20 Vovar 243 1,155 206 580 575 991 31 0
Total 4,681 22,690 3846 11,538 11,152 967 3,29
6 1,70
5
3.2.1.2. Male-Female Distribution
The sex ratio was found at 966 females per thousand males, with that of district’s ratio of 942,
as per 2001 Census. The sex ratio was found to be decreasing gradually in the district over past
two decades showing the imbalance in the sex ratio. Based on the primary survey, the sex ratio
was found to be 893 which is less than the census report. A lower sex ratio indicates higher
gender discrimination in the society. With the total population of 22,690 in the study area,
11,538 were males and 11,152 were females were found.
Figure 3.1: Sex Ratio in Kutch District
942
907
964
1991 2001 2011
Sex
Ratio

Marine Environmental Impact Assessment Report of Kutchh Power Generation Limited, Bhadreswar & Wadala
Villages, Mundra Taluka, Kutchh District
Cholamandalam MS Risk Services - 13 -
Source: Census 2001.
3.2.1.3. Children Below Six years
The number of children available and their status are important for the study as they are
vulnerable to various social and health snags. India ranks top with highest rate of child labor in
the world (Wiki) which makes them a strong consideration in this social assessment. The
education and health status of the children are discussed in the subsequent headings. In the study
area, the children population was found to be 16.95% of the total population, and in the district
the percentage was around 16.07%. The sex ratio of the children was about 925, which is more
than the district rate of 921. When the same is compared with primary data the ratio was 938,
which shows that the society is changing for the better.
3.2.1.4. Vulnerable Population
Vulnerable population generally indicates population of Scheduled Caste (SC) and Scheduled
Tribes (ST). The SC population is around 14.53% of the total population, and in the district the
percentage is about 11.74%. The ST population is less when compared with SC population,
which is around 7.51% while the district rate is about 8.22%. Largest Scheduled Castes found in
the district were Meghval, Mahyavansi and Bhambi while largest STs were Koli, Vaghri and
Bhil. Varaniya village is found to have the highest SC population of 33.38%. Kuvay village is
having highest ST population of 100%.
3.2.1.5. Cultural Aspects
The people in the study area have a strong association with the nature. Majority of the people
are engaged in agriculture (33%), casual labor involved in agriculture (31%), fishing activity
(7%). Due to the influence of modern civilization, youth are attracted to urban culture. Majority
of the people discourage and oppose inter-caste marriage. The study area is dominated by the
Hindus (73.3%) while people belonging to other religions like Muslims (25.2%), Christians
(0.1%) and Jains (1.3%) are also present. Nuclear and Joint family system was equally
observed. The average age of marriage for girls was reported to be in the range of 18 - 21 and
boys enter into the wedlock at the age of 21 – 24.

Marine Environmental Impact Assessment Report of Kutchh Power Generation Limited, Bhadreswar & Wadala
Villages, Mundra Taluka, Kutchh District
Cholamandalam MS Risk Services - 14 -
3.2.2. Economic Indicators
Under this component, following aspects are studied:
a. Annual Per capita Income and Livelihood, b. Cropping Pattern, c. Land Use pattern, d.
Animal Husbandry, e. Major Industries in the Region, f. Employment Aspects
3.2.2.1. Livelihood and Income Level
Livelihood patterns are an important indicator of the economic wellbeing of a household.
Families which are more dependent on rain fed farming or wage labor tend to be more
vulnerable to insecurity and fall into extreme poverty levels. This is particularly applicable in
disaster prone areas like the district of Kutch which has witnessed a series of droughts and
cyclones in the last decade. The Annual Per Capita Income (APCI) in the study area was
reported to be in the range of 24000 to 1,20,000 as against the district APCI level of 49,251.
While the primary survey depicts the range of annual income of the people involved in wage
employment are earning 50-500/day (47% earn 50-100 and 53% of them are earning 101-
500) and 61% of the self employed people are earning less than 5000/month.
3.2.2.2. Cropping Pattern
Unlike other parts of Kutch where only 25% of the people are under agricultural activities, in the
study area 31% are engaged. The higher rate in this area is due to the improved irrigation
facilities as 61% of the farmers source from wells, bore wells and canals. Cotton, Green Gram,
Jeera, Barley, Sesame, Sorghum and Vegetables are the major crops grown. In some places,
where adequate irrigation facilities are available, sugarcane is also grown where adequate
irrigation facilities are available. Among eight types of crops grown in the study area, 30% of
the farmers having large land holding grow six types of crops in a year.
3.2.2.3. Animal Husbandry
Animal Husbandry plays an important role in rural employment. According to “National Sample
Survey 61st Round” 2004-05, 5.5% of the workforce in the country are engaged in this sector. In
the study area, most of the people engaging in agriculture also maintain livestock as they are
used for agricultural activity, and can be grown by feeding the by-products of agriculture.
Among the villagers, 4% of them reported Animal Husbandry as their main occupation. 31% of
the households are growing cattle at their homestead. The average cattle holding were 2-3 cows.
Lack of fodder availability and underdevelopment of dairy sector as a commercial activity may
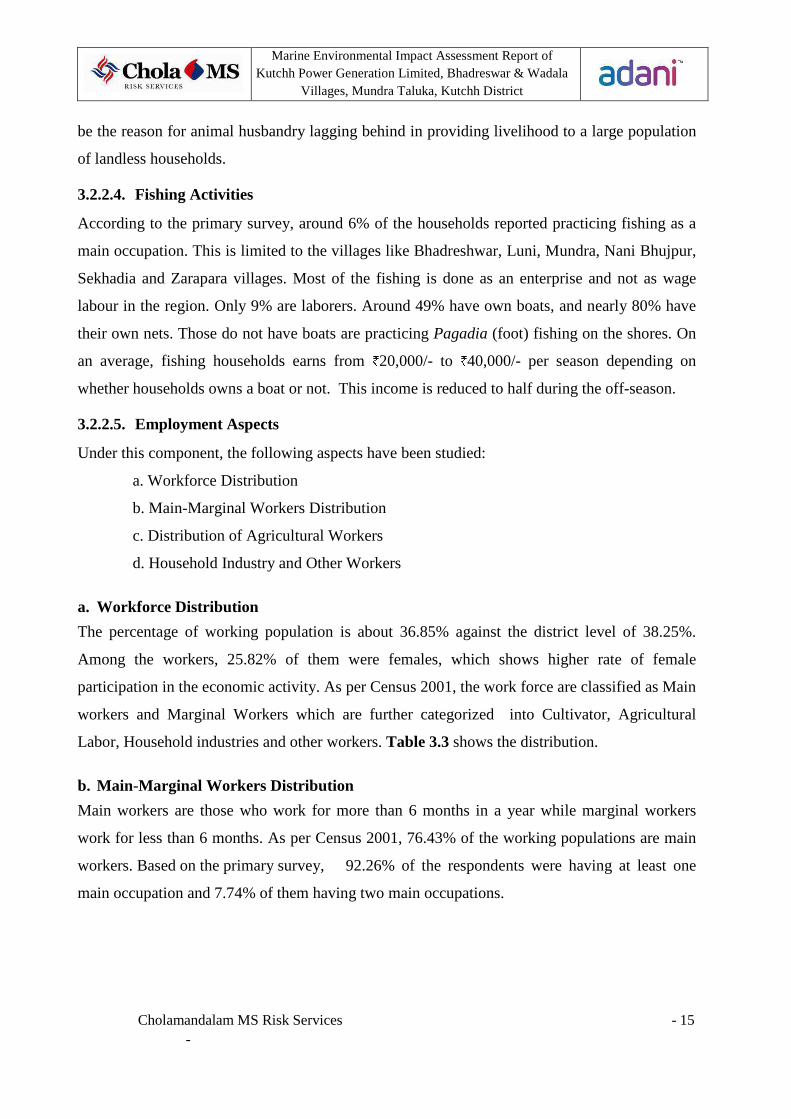
Marine Environmental Impact Assessment Report of Kutchh Power Generation Limited, Bhadreswar & Wadala
Villages, Mundra Taluka, Kutchh District
Cholamandalam MS Risk Services - 15 -
be the reason for animal husbandry lagging behind in providing livelihood to a large population
of landless households.
3.2.2.4. Fishing Activities
According to the primary survey, around 6% of the households reported practicing fishing as a
main occupation. This is limited to the villages like Bhadreshwar, Luni, Mundra, Nani Bhujpur,
Sekhadia and Zarapara villages. Most of the fishing is done as an enterprise and not as wage
labour in the region. Only 9% are laborers. Around 49% have own boats, and nearly 80% have
their own nets. Those do not have boats are practicing Pagadia (foot) fishing on the shores. On
an average, fishing households earns from 20,000/- to 40,000/- per season depending on
whether households owns a boat or not. This income is reduced to half during the off-season.
3.2.2.5. Employment Aspects
Under this component, the following aspects have been studied:
a. Workforce Distribution
b. Main-Marginal Workers Distribution
c. Distribution of Agricultural Workers
d. Household Industry and Other Workers
a. Workforce Distribution
The percentage of working population is about 36.85% against the district level of 38.25%.
Among the workers, 25.82% of them were females, which shows higher rate of female
participation in the economic activity. As per Census 2001, the work force are classified as Main
workers and Marginal Workers which are further categorized into Cultivator, Agricultural
Labor, Household industries and other workers. Table 3.3 shows the distribution.
b. Main-Marginal Workers Distribution
Main workers are those who work for more than 6 months in a year while marginal workers
work for less than 6 months. As per Census 2001, 76.43% of the working populations are main
workers. Based on the primary survey, 92.26% of the respondents were having at least one
main occupation and 7.74% of them having two main occupations.
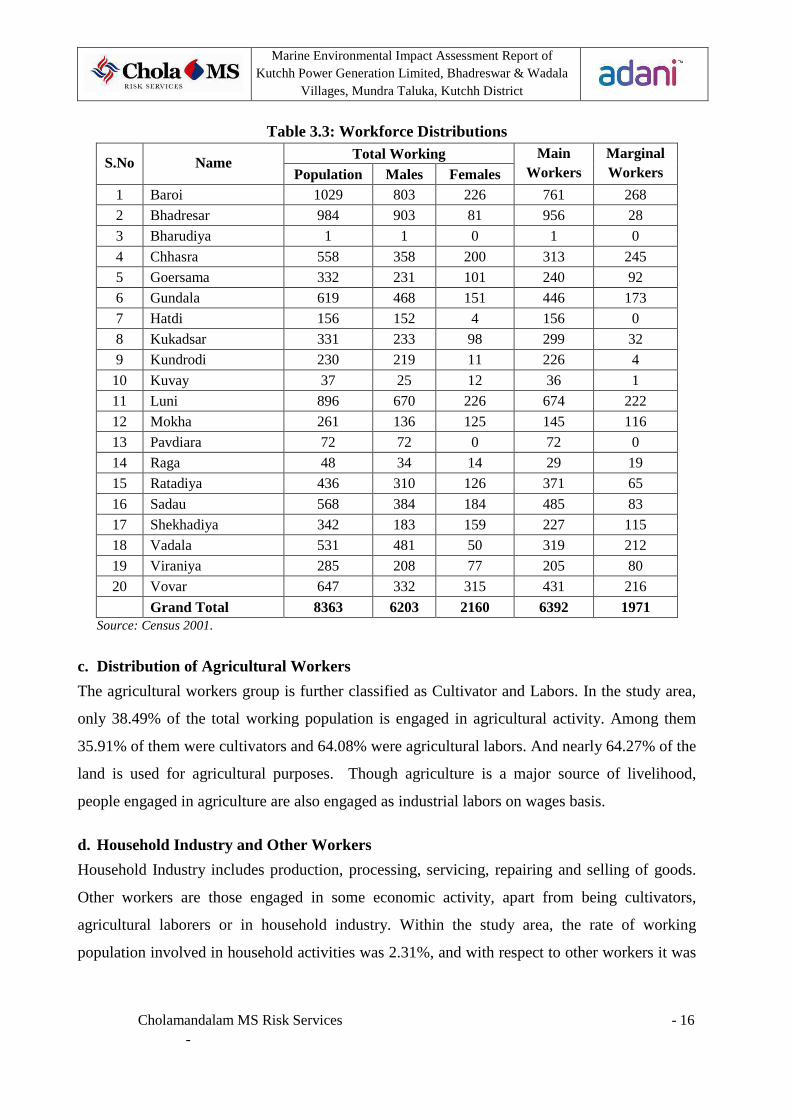
Marine Environmental Impact Assessment Report of Kutchh Power Generation Limited, Bhadreswar & Wadala
Villages, Mundra Taluka, Kutchh District
Cholamandalam MS Risk Services - 16 -
Table 3.3: Workforce Distributions
S.No Name Total Working Main
Workers Marginal Workers Population Males Females
1 Baroi 1029 803 226 761 268
2 Bhadresar 984 903 81 956 28
3 Bharudiya 1 1 0 1 0
4 Chhasra 558 358 200 313 245
5 Goersama 332 231 101 240 92
6 Gundala 619 468 151 446 173
7 Hatdi 156 152 4 156 0
8 Kukadsar 331 233 98 299 32
9 Kundrodi 230 219 11 226 4
10 Kuvay 37 25 12 36 1
11 Luni 896 670 226 674 222
12 Mokha 261 136 125 145 116
13 Pavdiara 72 72 0 72 0
14 Raga 48 34 14 29 19
15 Ratadiya 436 310 126 371 65
16 Sadau 568 384 184 485 83
17 Shekhadiya 342 183 159 227 115
18 Vadala 531 481 50 319 212
19 Viraniya 285 208 77 205 80
20 Vovar 647 332 315 431 216
Grand Total 8363 6203 2160 6392 1971 Source: Census 2001.
c. Distribution of Agricultural Workers
The agricultural workers group is further classified as Cultivator and Labors. In the study area,
only 38.49% of the total working population is engaged in agricultural activity. Among them
35.91% of them were cultivators and 64.08% were agricultural labors. And nearly 64.27% of the
land is used for agricultural purposes. Though agriculture is a major source of livelihood,
people engaged in agriculture are also engaged as industrial labors on wages basis.
d. Household Industry and Other Workers
Household Industry includes production, processing, servicing, repairing and selling of goods.
Other workers are those engaged in some economic activity, apart from being cultivators,
agricultural laborers or in household industry. Within the study area, the rate of working
population involved in household activities was 2.31%, and with respect to other workers it was

Marine Environmental Impact Assessment Report of Kutchh Power Generation Limited, Bhadreswar & Wadala
Villages, Mundra Taluka, Kutchh District
Cholamandalam MS Risk Services - 17 -
59.18%. Based on the primary survey, it was observed that most of the people engaged in
household industries run small shops within the villages.
e. Occupational Pattern
In the surveyed villages it was found that agriculture and casual labour are the main occupations
for most of the people, with around 30% of the people being involved in each occupation.
Around 6.5% are involved in fisheries, while 11% are employed in private and government
sectors.
Figure 3.2: Occupational Pattern of the Study Area
30%
4%
31%
11%
4%
5%
3%
6%
6%
Own Farming
Animal
HusbandryFisheries
Casual Labour
Masonaray Work
Own Business
Small Shop/Cabin
Skilled Labour
Job(Private/Govt)
3.2.3. Health Indicators
Health Facilities in rural areas are essential for the study, under which following aspects are
studied:
a) Medical Facilities in Rural Areas
b) Institutional Births
c) Childhood Vaccination
d) Awareness on HIV/AIDS
3.2.3.1. Health Status in the Study Area
The health status is being assessed both by reviewing the data of the Taluk in the District
Integrated Disease Surveillance Project (IDSP) Report 2009 and by using the primary data. The
survey shows that 52% of the families report sickness often or very often. Among the diseases

Marine Environmental Impact Assessment Report of Kutchh Power Generation Limited, Bhadreswar & Wadala
Villages, Mundra Taluka, Kutchh District
Cholamandalam MS Risk Services - 18 -
faced, 63.3% of them were reported as fever, 22.7% of them for diarrhea and vomiting. As for
facing chronic illness, 30.6% of the people were stated having Nephrolithiasis (Kidney stone).
3.2.3.2. Medical Facilities
Medical facilities are classified into: Community Health Workers, Family Welfare Centre,
Primary Health Sub Centre, Primary Health Centre, Health Centre, Child Welfare Centre,
Maternity Homes, Maternity and Child Welfare Centre, Dispensaries and Hospitals.
The status of public health infrastructure in the whole of Mundra Taluk is very poor. Based on
the primary survey, it was observed that 39.8% people prefer to go to private hospitals during
ailments. The utilization of government health facilities is very less. The below Table 3.4 show
the medical facilities in the study villages.
Table 3.4: Government Medical Facilities in the Villages S.No Medical Facility Numbers
1 Allopathic Hospital 3 2 Allopathic Dispensary 4 3 Maternity and Child Welfare Centre 1 4 Maternity Homes 0 5 Child welfare Centre 0 6 Health Centre 1 7 Primary Health Centre 0 8 Primary Health Sub Centre 1 9 Family Welfare Centre 0 10 Community Health Workers 19
Source: Census 2001.
3.2.3.3. Institutional Births
Institutional births means births made under the supervision of a registered medical practitioner
in a Government Hospital/a Medical Institution recognized by the Government, or births made
at home assisted by professionals. Government of India has taken various initiatives to promote
institutional births like Cash Incentive Programme (Janani Suraksha Yojana Program) in order
to reduce infant/maternal mortality rate. In the study area, the institutional birth rate is nearly
82.9% which is more than the district and state level of 57.2% and 56.4% respectively. Among
the institutionalized births, 58.4% of them preferred to avail private medical facilities.
3.2.3.4. Childhood Immunization
Childhood Immunization is necessary to protect children from contagious diseases and also
reduce Infant Mortality Rate. Government has taken initiatives such as Universal Immunization
Programme (U.I.P.), National Rural Health Mission (NRHM) to promote childhood

Marine Environmental Impact Assessment Report of Kutchh Power Generation Limited, Bhadreswar & Wadala
Villages, Mundra Taluka, Kutchh District
Cholamandalam MS Risk Services - 19 -
immunization. During the primary survey, it was reported that immunization has become more
regular than before, as there is more awareness within the community. The survey had found
that the region has only 70% immunization coverage. Almost 8% of the children have not got
any vaccination and 22% were partially immunized. When the same was compared with district
and state rate, it was found to be 49.2% and 54.8% respectively.
3.2.3.5. Awareness on HIV/AIDS
According to a recent study in the British Medical Journal, India has an HIV/AIDS population
of approximately 1.6 million people. The estimated number of Human Immunodeficiency Virus
(HIV) infections in India has declined drastically in recent years - from 5.5 million in 2005 to
less than 2.5 million in 2007. These new figures are supported by the World Health
Organization and UNAID Report.
United Nations 2011 AIDS Report, in India depicts that there has been a 50% decline in the
number of new HIV infections in the last 10 years. With respect to the study area, only 40.9% of
the women have heard about HIV/AIDS, of which, less than 50% of the women are having clear
understanding on the means of spreading. Table 3.5 shows the percentage of women aware
about HIV/AIDS in the district.
Table 3.5: Awareness on HIV/AIDS in the District
S.No Awareness Level Married Women
Unmarried Women
1 Heard About HIV/AIDS 40.9% 52.4%
2 Condom use can reduce the chances of getting HIV 50.02% 46.8%
3 Women undergone HIV test 5% 0.0%
4 Women Heard about RTI & STI 22.9% 20.2% Source: DLHS-3, 2007-08
3.2.4. Drinking Water and Sanitation
Drinking water and sanitation are considered to be an important factor as unclean drinking water
practice and open defecating are found to be the reason for major health complications
prevailing in the rural areas. In this component, following aspects are studied:
a. Main Source of Drinking Water
b. Toilet Facility

Marine Environmental Impact Assessment Report of Kutchh Power Generation Limited, Bhadreswar & Wadala
Villages, Mundra Taluka, Kutchh District
Cholamandalam MS Risk Services - 20 -
3.2.4.1. Drinking Water Facilities in Villages
The sources of drinking water facility available are Tap, Well and Tank. However, the main
source is tap water. During summer, the main source switches to tap and Public Distribution
System. During the primary survey, it was observed that except two, all the villages had either
household water connection or had a hand pump nearby their houses. Thus there is no major
concern for water scarcity except during summer season, where one or two villages resort to
tanker water supply.
Table 3.6: Drinking water Facilities in the Study Area
S.No Drinking Water Facility Number of Villages
1 Tap Water 17 2 Well 7 3 Tank 4 4 Tube Well 1 5 Hand Pump 0 6 River 0 7 Canal 0
Source: Census 2001
3.2.4.2. Sanitation Facility in the Study Area
According to DLHS-3, in the district, only 44.1% population has access to toilet facilities. When
the same is compared with rural facilities, only 33.4% of the people have access. With respect to
the study area, less than 41% population is availing safe sanitation facilities. Around 34% of the
households having toilet facilities also have access to water connection with the toilets, which is
necessary to ensure the usage of toilet facilities.
3.2.5. Education
Under this segment, data pertaining to literacy pattern and education facilities have been
collected from 2001 Census. The same has been compared with the district level data:
3.2.5.1. Literacy Pattern in the Study Area
Literacy rate in the study area is very less; only 48.10% of the total population are literates,
which is less than the national literacy rate of 64.8%, Gujarat’s 58.86% and of district’s at about
50.18%. In the Kutch district 62.2% of the children (aged 7plus) are literate, 93% of the girl
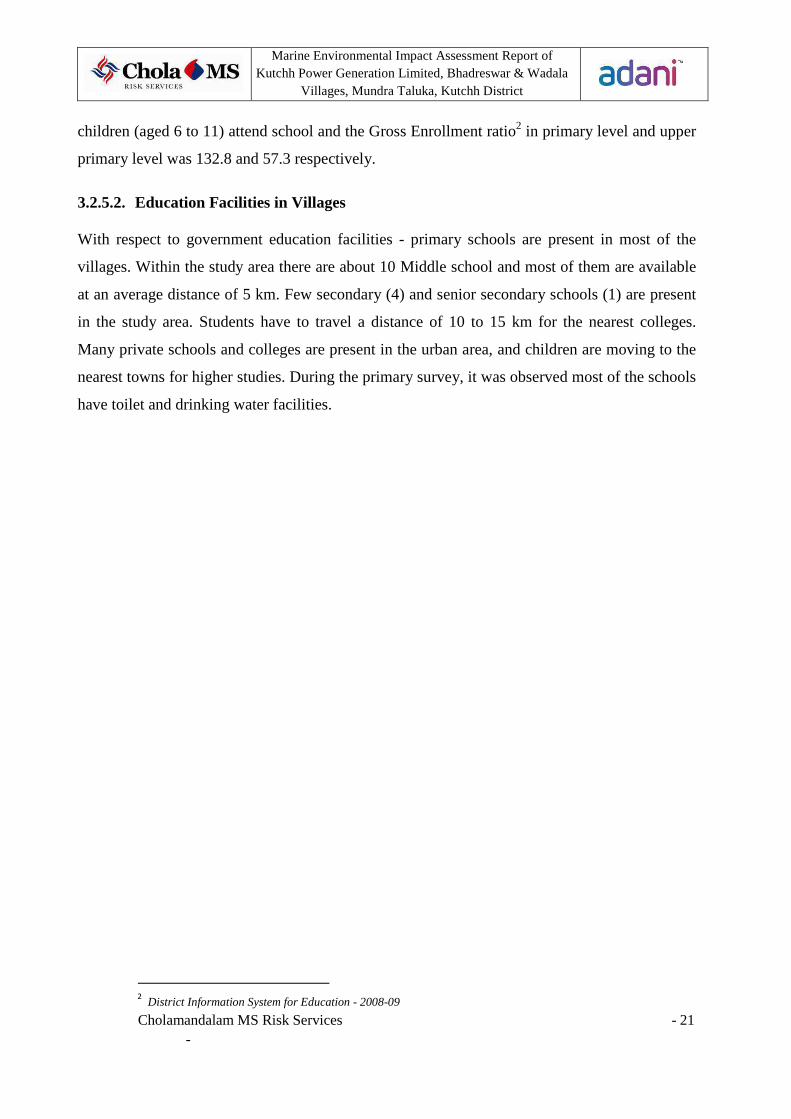
Marine Environmental Impact Assessment Report of Kutchh Power Generation Limited, Bhadreswar & Wadala
Villages, Mundra Taluka, Kutchh District
Cholamandalam MS Risk Services - 21 -
children (aged 6 to 11) attend school and the Gross Enrollment ratio2 in primary level and upper
primary level was 132.8 and 57.3 respectively.
3.2.5.2. Education Facilities in Villages
With respect to government education facilities - primary schools are present in most of the
villages. Within the study area there are about 10 Middle school and most of them are available
at an average distance of 5 km. Few secondary (4) and senior secondary schools (1) are present
in the study area. Students have to travel a distance of 10 to 15 km for the nearest colleges.
Many private schools and colleges are present in the urban area, and children are moving to the
nearest towns for higher studies. During the primary survey, it was observed most of the schools
have toilet and drinking water facilities.
2 District Information System for Education - 2008-09

Marine Environmental Impact Assessment Report of Kutchh Power Generation Limited, Bhadreswar & Wadala
Villages, Mundra Taluka, Kutchh District
Cholamandalam MS Risk Services - 22 -
3.3. Summary Socioeconomic Indicators
S.No Indicators Study Area Gujarat
1 Study Area 20 Panchayat Villages 18066
2 Households 4681 9691362
3 Population 22690 50671017
4 Urban Rural Ratio 0:1 37:63
5 Sex Ratio 967 920
6 Children Population Below 6 years 16.95% 14.86%
7 Children Sex Ratio 926 883
8 Percent Vulnerable Population SC 14.52% SC 7.09%
ST 7.51% ST 14.76% 9 Dominant Religion Hindus Hindus 10 Age at Marriage F : 18-21, M : 21-24 F : 17-21, M : 20-23 11 Average Annual Per capita Income 60,000 - 1,20,000 49,251 12 Percent Working Population 36.85% 41.95%
13 Percentage of population involved in Agriculture
38.49% 51.58%
14 Percent Cultivators 35.91% 52.93% 15 Percent Agricultural Labors 64.08% 47.07 16 Percent involved in Other Work 59.18% 46.39%
17 Percent involved in Household Industries
2.31% 2.02%
18 Major source of Drinking Water Tap and Well Water Tap, Hand Pump &
Well Water
19 Percent availed safe Sanitation Facilities
41% 43.5%
20 Number of Primary Health Centre Nil 542
21 Number of Primary Health Sub Centre
1 714
22 Percentage of Institutionalized Births
82.9% 56.4%
23 Percent of Childhood Immunization 70% 54.8% 24 Literacy Rate 48.10% 69.97% 25 Availability of Primary Schools Available in all villages - 26 Availability of Middle Schools 10 Schools - 27 Availability of Secondary Schools 4 Schools -
28 Availability of Senior Secondary Schools
2 Schools -
29 Availability of Private Schools Available in the nearest
towns
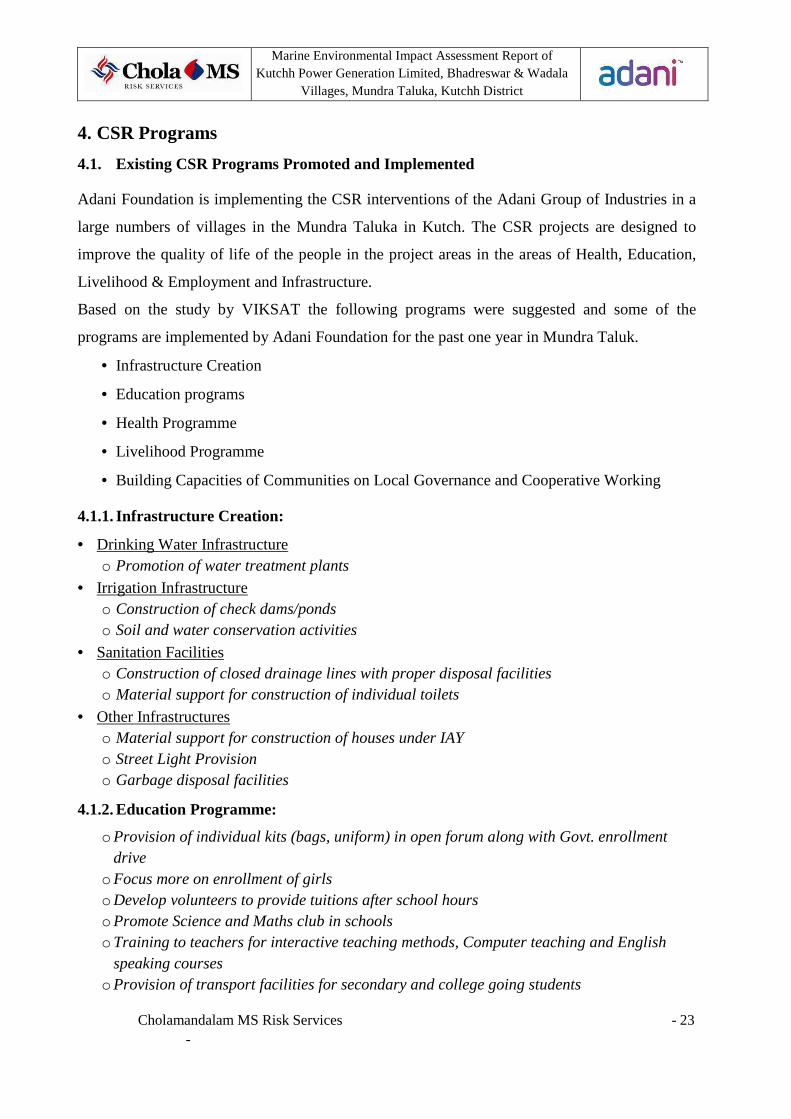
Marine Environmental Impact Assessment Report of Kutchh Power Generation Limited, Bhadreswar & Wadala
Villages, Mundra Taluka, Kutchh District
Cholamandalam MS Risk Services - 23 -
4. CSR Programs
4.1. Existing CSR Programs Promoted and Implemented
Adani Foundation is implementing the CSR interventions of the Adani Group of Industries in a
large numbers of villages in the Mundra Taluka in Kutch. The CSR projects are designed to
improve the quality of life of the people in the project areas in the areas of Health, Education,
Livelihood & Employment and Infrastructure.
Based on the study by VIKSAT the following programs were suggested and some of the
programs are implemented by Adani Foundation for the past one year in Mundra Taluk.
• Infrastructure Creation
• Education programs
• Health Programme
• Livelihood Programme
• Building Capacities of Communities on Local Governance and Cooperative Working
4.1.1. Infrastructure Creation:
• Drinking Water Infrastructure o Promotion of water treatment plants
• Irrigation Infrastructure o Construction of check dams/ponds o Soil and water conservation activities
• Sanitation Facilities o Construction of closed drainage lines with proper disposal facilities o Material support for construction of individual toilets
• Other Infrastructures o Material support for construction of houses under IAY o Street Light Provision o Garbage disposal facilities
4.1.2. Education Programme:
o Provision of individual kits (bags, uniform) in open forum along with Govt. enrollment drive
o Focus more on enrollment of girls o Develop volunteers to provide tuitions after school hours o Promote Science and Maths club in schools o Training to teachers for interactive teaching methods, Computer teaching and English
speaking courses o Provision of transport facilities for secondary and college going students

Marine Environmental Impact Assessment Report of Kutchh Power Generation Limited, Bhadreswar & Wadala
Villages, Mundra Taluka, Kutchh District
Cholamandalam MS Risk Services - 24 -
o Computer and English training courses for secondary school students o Career/Job counseling camps need to be conducted o Setting up of a mobile science lab o Provision of a scholarship scheme for bright students/students from marginalized groups o Promoting a good secondary school with school bus facility to a cover a number of
villages o Setting up alternative school for drop-outs o Learning levels assessment study o Provision of computers in schools
4.1.3. Health Programme:
o Increase the number of mobile units and link them with referral facility o Group medical insurance can be introduced o Focus more on awareness for infant care o Specific awareness programme on kidney stone o Develop a specific programme for health care facilities for elderly persons
4.1.4. Livelihood Programme:
o Focus on 2-3 crops for agriculture and horticulture, and implement a value chain approach to the same
o Focus more on drip/sprinkler irrigation and supply of improved seed varieties o The fodder supply needs to be based on calculation of number of cattle in the village,
available local fodder, etc o Fodder plots need to be developed to encourage fodder purchase locally. This would also
give additional income. o More focused approach on fishing at an activity, not focusing on amount of catch but on
getting more money through market linkages o Alternative job options for fishing community also need to be explored o Conduct a job/ business potential survey in the region and develop youth training
curriculum on those lines o Along with vocational training, business development courses for youth need to be
conducted. They should be supported to access bank loan/govt. schemes for setting up their own enterprise and/or also provided with job counseling services
o Support for product development and marketing to local artisans
4.1.5. Building Capacities of Communities on Local Governance and Cooperative
Working:
o Training of Panchayat members o Special focus should be laid on building capacities of user groups like Water samitis,
irrigation samitis, promoting infrastructure maintenance o Liasioning with Government Departments for construction of houses under JAY o VEC, PTA and MTA members should be trained

Marine Environmental Impact Assessment Report of Kutchh Power Generation Limited, Bhadreswar & Wadala
Villages, Mundra Taluka, Kutchh District
Cholamandalam MS Risk Services - 25 -
o Women SHGs, Youth Clubs, Health Committees and Farmer’s Societies need to be promoted. Training to be provided to strengthen them.
o The women’s groups and Youth clubs would also be involved in village cleaning programme and preventive health awareness programmes

Marine Environmental Impact Assessment Report of Kutchh Power Generation Limited, Bhadreswar & Wadala
Villages, Mundra Taluka, Kutchh District
Cholamandalam MS Risk Services - 26 -
4.2. Specific CSR Programs Suggested for Impact Zone
The following are the list of welfare programs suggested based on the findings for the impact
zone, the villages adjacent to the project site. The suggested programs can be a part of the
existing CSR program. The objective of this is to give importance to the stake holders, people,
employees who are directly influenced by the project and to improve their health and livelihood.
These programs can be effectively implemented in coordination with NGO’s working in the
particular area. The programs are grouped under the following headings, i.e. Economic,
Education, Agriculture, Health, Environment, Fisheries and Infrastructure.
Table 4.1: Village Specific Development Plan (Legend: RE: Recommended, OP: Optional)
Sector / Village Bhadreswar Vadala Luni Pavdiara Kukadsar
Eco
nom
ic Women Empowerment Programs RE RE RE RE RE
Skill development Programs RE RE RE OP OP
Animal Husbandry OP OP OP OP OP
Income Generation Programs RE RE RE OP OP
Edu
cati
on
Safe Drinking Water facilities in Schools
RE RE RE RE RE
Safe Sanitation facilities in Schools RE RE RE RE RE
Encouraging Sports OP OP OP OP OP
Scholarship Programs RE RE RE RE RE
Agr
icul
ture
Integrated Farming OP OP OP OP OP
Technological Guidance RE RE RE RE RE
Irrigation OP OP OP OP OP
Hea
lth
Mobile Clinics RE RE RE RE RE
Veterinary Clinics RE RE RE RE RE
Awareness Programs RE RE RE RE RE
Health Camps RE RE RE RE RE
Maternal Health RE RE RE RE RE
Env
iron
men
t Community Plantation RE RE RE RE RE
Green Belt Plantation RE RE RE RE RE
Solar Energy Panels OP OP OP OP OP
Rain water Harvesting RE RE RE RE RE
Fis
heri
es Insurance Schemes RE OP RE OP OP
Disaster Management RE OP RE OP OP
Boat mechanic Shops RE OP RE OP OP
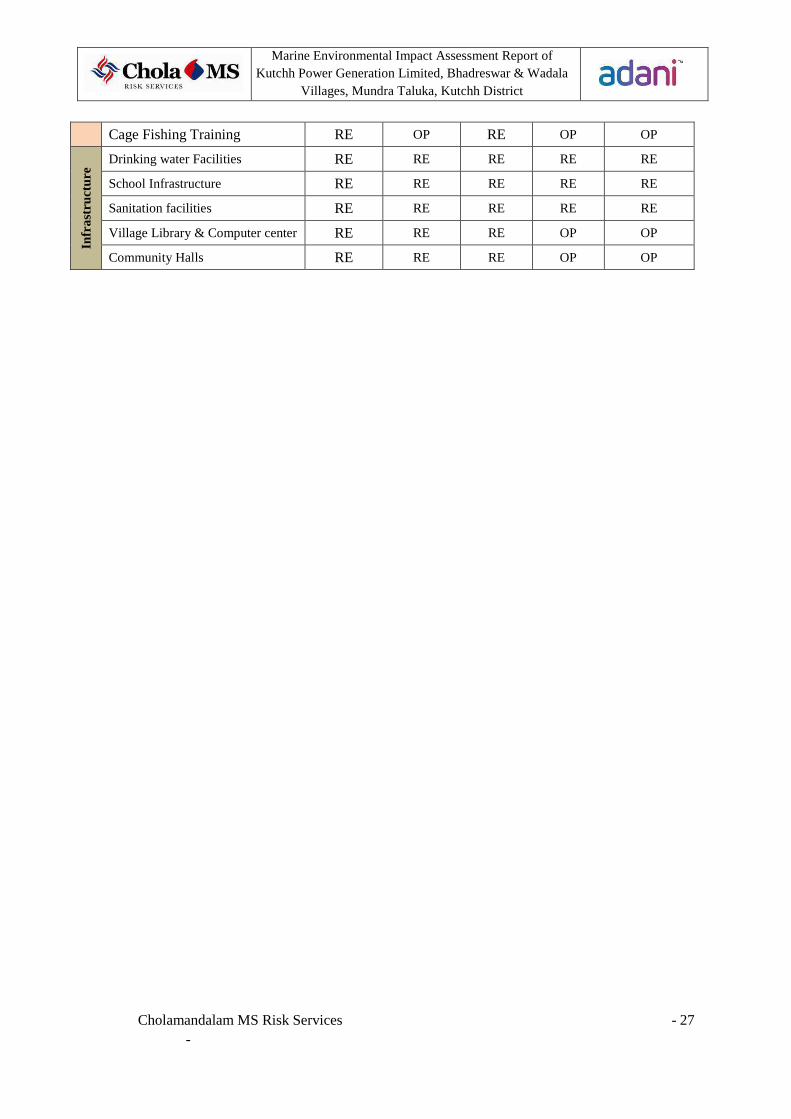
Marine Environmental Impact Assessment Report of Kutchh Power Generation Limited, Bhadreswar & Wadala
Villages, Mundra Taluka, Kutchh District
Cholamandalam MS Risk Services - 27 -
Cage Fishing Training RE OP RE OP OP
Infr
astr
uctu
re Drinking water Facilities RE RE RE RE RE
School Infrastructure RE RE RE RE RE
Sanitation facilities RE RE RE RE RE
Village Library & Computer center RE RE RE OP OP
Community Halls RE RE RE OP OP

Marine Environmental Impact Assessment Report of Kutchh Power Generation Limited, Bhadreswar & Wadala
Villages, Mundra Taluka, Kutchh District
Cholamandalam MS Risk Services - 28 -
4.3. CSR Budget
Based on the detailed review on the need based assessment and tentative Village CSR
Development Plan suggested in the previous subsections, a budget plan has been suggested for
the impact zone. The below mentioned budget can be allocated especially for the project impact
zone. The same has been presented in Table 4.1:
Table 4.1: Budget Plan for CSR for 5 Year
Sector Proposed Budget ( in Lakhs)
Year 1 Year 2 Year 3 Year 4 Year 5 Total
Economic 10 15 20 20 15 80
Education 15 20 30 30 25 120
Agriculture 15 15 20 20 20 90
Health 15 25 35 40 40 155
Environment 25 30 45 50 50 200
Fisheries 10 30 35 35 30 140
Infrastructure 10 20 40 20 20 110
Total 100 155 225 215 200 895
Figure 4.1: Relative Percent Distribution of Proposed Budget for Impact Zone
23%
16%
12%
17%
13%
9%
10%
Economic
Education
Agriculture
Health
Environment
Fisheries
Infrastructure

Marine Environmental Impact Assessment Report of Kutchh Power Generation Limited, Bhadreswar & Wadala
Villages, Mundra Taluka, Kutchh District
Cholamandalam MS Risk Services - 29 -
5. Community Development Plan Implementation Strategies
5.1. Community Development Organization
This section of the report presents the strategy to be followed in implementing various pre-
defined Village Community Development Plans. For this, a universally accepted principles
recommended by World Bank Group (WBG)3 has been referred. Once the key community
development areas have been identified, the critical aspects to be addressed are–
• When to invest in communities
• How to invest
• Constitution of the implementing team
• How to monitor the effectiveness of the program
5.1.1. Formation of Core CSR Management Team
The first step in the community investment programs is to form a central CSR management team
within Adani Foundation, which shall be supported by a group of social scientists headed by a
functional head to implement and monitor the overall program. The primary responsibilities of
the central CSR management team is to define the specific yearly investment programs,
identifying various vehicles and appointing stake-holders to successfully implement the
individual schemes, allocating and disbursing funds to the respective stake-holders and
implementation agencies at appropriate time, periodical interactions with communities and
understand the effectiveness of the overall program and finally undertake audits through
external agencies to assess the adequacy of the implementation strategies to meet the specified
objectives. A clearly defined community investment plan policy shall be developed by Adani
Foundation every year to define the objectives, targets and roles and responsibilities of the
individual stake-holders. The policy should be developed based on the following key
performance objectives:
• Set out a 3-5 year plan for the company’s community investments
• Identify target stakeholder groups and specify eligibility criteria for each of the identified
scheme
3 Strategic Community Investment, A Good Practice Handbook for Companies Doing Business in
Emerging Markets, International Finance Corporation

Marine Environmental Impact Assessment Report of Kutchh Power Generation Limited, Bhadreswar & Wadala
Villages, Mundra Taluka, Kutchh District
Cholamandalam MS Risk Services - 30 -
• Establish an iterative process of engagement with local stakeholders and partners on
community investment
• Draw on the company’s core competencies and resources to support communities
• Promote cross-functional coordination and accountability for supporting community
investment objectives
• Identify the implementation model and decision-making/governance structures
• Define roles and responsibilities, budget, scope, and timeline
• Describe how project results will be monitored and communicated
5.1.2. Identifying and Nominating the Implementing Agencies
Assessing who is who and which organizations could be potential partners for community
development programs is an important part of understanding the local context. Partnerships are a
cornerstone of strategic community development program. Ideally, they should be pursued in
the early planning stages as a part of a company’s sustainability and exit strategies. It is a good
practice to explore working through existing reputed Non-Governmental Organizations (NGO)
or programs before creating new ones. These agencies can be selected based on the following
criteria:
• Ability to reach the local people and areas
• Thematic areas of expertise - health, capacity building, sanitation
• Delivery capacity, including staffing, existing relationships, contacts, and networks with
local areas and communities
• Core values (which should be compatible with the company’s objectives and principles)
• Reputation and track record.
5.1.3. Constituting Village Development Committees
The key beneficiaries of the community development program are the needy local villagers.
Therefore, the local communities shall be completely involved in various designated programs.
It has been recommended to form local village bodies such as youth association groups,
fishermen association group, women group, village develop group and so on. Each of these
groups will be defined with the basic constitution of the committee, specific roles and
Marine Environmental Impact Assessment Report of Kutchh Power Generation Limited, Bhadreswar & Wadala
Villages, Mundra Taluka, Kutchh District
Cholamandalam MS Risk Services - 31 -
responsibilities. Each group should comprise of at least three members from various sections of
the village.
The roles and responsibilities of these groups is to undertake awareness programs among the
villagers about the respective schemes, providing local support while implementing the schemes
in association with the nominated implementing agency or NGO, providing feedback to Adani
Foundation on the overall progress of the scheme, grievances, if any, and suggestions and
recommendations for the effective implementation of the schemes. Monthly progress review
meetings with respective stakeholders of the individual schemes are essential to ensure smooth
implementation of the designated schemes.
5.2. Fund Allocation and Disbursement
Based on the well-planned community development programme, adequate annual budget shall
be allocated for community development plan. The same shall be credited in a dedicated account
to ensure continuous flow of funds throughout the year without any interruption. Required funds
for the respective programs can be allocated on a monthly basis to the nominated implementing
agencies based on the monthly work progress reviews with respective stake holders. An external
CSR consultant can be nominated for project cost estimations, verification of the schemes
proposed and also to monitor the overall programs.
An implementation or delivery model is the organizational structure through which a company
carries out its community investment program or supports others in doing so. In practice, many
companies use “hybrid” approaches—a combination of different mechanisms to deliver their
programs. The following schemes can be adopted for effective community development
investment:
In-house Implementation - Company creates an internal department or unit to work directly
with communities, to design and implement community development schemes. Schemes for
developing infrastructure such as roads, sanitation facilities, construction of buildings, hospitals,
can be taken up under this mode.
Company Foundation - Company establishes an independent foundation as a separate legal
entity to carry out its community development programs. Foundations can have grant-making

Marine Environmental Impact Assessment Report of Kutchh Power Generation Limited, Bhadreswar & Wadala
Villages, Mundra Taluka, Kutchh District
Cholamandalam MS Risk Services - 32 -
authority (financing of community development programs implemented by others) or serve as
an implementing function (implementing their own projects and programs).
Third-party Implementation - Company engages a third party, such as NGO or a group of
NGOs to work with local communities in designing and implementing schemes, or it supports
an existing initiative being implemented by others.
Multi- Stakeholder Partnership - Company establishes or joins a voluntary or collaborative
alliance, network, or partnership. This implies cooperation between two or more partners in a
manner that shares risks, responsibilities, resources, and competencies, and involves a joint
commitment to common tasks and goals. Schemes such as social forestry programs, restoration
of lakes and canals and disaster management infrastructure facilities, can be taken up under this
scheme.
Hybrid Models - Company utilizes a combination of two or more implementation models to
deliver various components in the community development program.
5.3. CSR Activity Monitoring, Reporting and Continual Improvement
The CSR management team of the Adani Foundation should develop monthly, quarterly, half
yearly and annual status reports for adopting necessary corrective actions for continuous
improvement.
A suitable system to monitor the whole process with regard to the performance at the field levels
shall be established. This system can be developed within the CSR department who will be
assigned to do a periodic evaluation. This process should be intimated to the nominated
Implementing Agencies in their work order. The monitoring and evaluation shall be taken at
different levels - CSR department, with Implementing Agencies, within community, etc. The
various field functionaries would be familiarized with the basics of this reporting system as well
as their role and responsibility. The Monitoring and Evaluation team’s responsibilities are as
follows:
• Periodic Progress Reports
• Necessity and the periodicity of such reports
• Output to be generated
• Evaluation

Marine Environmental Impact Assessment Report of Kutchh Power Generation Limited, Bhadreswar & Wadala
Villages, Mundra Taluka, Kutchh District
Cholamandalam MS Risk Services - 33 -
• Improvement/Development of Implementation process
• Analyzing deviations to the said objectives
• Focusing on Qualitative aspects in progress of project
• Identifying changes/milestones in development
Annual benchmark surveys can be carried out with selected villages to assess the overall
outcome and benefits of the CSR programs implemented in the respective areas, as per the pre-
defined CSR objectives. The findings of the study can be compared with the ratings prior to the
entry of development activities. The following parameters can be considered for evaluating the
overall outcome and performance of the community development programs implemented in a
specific period:
1. Increase income level of the BPL families
2. Increase in literacy level
3. Reduction in infant mortality and ailments of humans and cattle
4. Increase in fish production
5. Reduced population migration
6. Increased sanitation and drinking water facilities
Other indicative parameters that shall be included in the evaluation of the overall performance of
the CSR program are listed hereunder:
• Number of protests, demonstrations, complaint letters, and compensation requests
• Number of community participants in consultation meetings
• Closures of activities due to a disturbance by the community/local stakeholders
• Quantity of work applications received from the community/local stakeholders
• Incidents (related to communities or other stakeholders) affecting company property or
personnel
• Number of problems or grievances identified by local stakeholders
• Quantity—and the time period of delays in implementing the schemes
• Community sentiment surrounding current community development initiatives (i.e., Do they
fulfill needs and expectations?)
• Effectiveness of public consultation activities (i.e., Do local people feel their participation
has a value?)
Marine Environmental Impact Assessment Report of Kutchh Power Generation Limited, Bhadreswar & Wadala
Villages, Mundra Taluka, Kutchh District
Cholamandalam MS Risk Services - 34 -
• Degree of trust felt by the community towards the company (and vice versa)
• Positions taken by the local government regarding decisions that affect the company
• Community members say they are better off as the result of the company’s presence
• Number of positive and negative press articles about the company
If measuring value of the community development is important, communicating that value is
equally important. For benefits derived from community development to be optimized,
stakeholders at the local, regional, and international levels need to know about these investments
and the value they create. The annual reports of the CSR shall be communicated to all the
concerned stake holders such as company employees and community, investor community, local
Communities and other Stakeholders (government, NGOs, media). The annual reports should
address the community development program implemented, impact on the business, the
outcome and benefits of schemes to local villagers and community. Various communication
models can be adopted such as television, road, booklets and magazines, press meets and
conferences, seminars and company website.
Annexure V
Impacts of Thermal Power Plant Discharge on Marine Ecology

Marine Environmental Impact Assessment Report of Kutchh Power Generation Limited, Bhadreswar & Wadala
Villages, Mundra Taluka, Kutchh District
Cholamandalam MS Risk Services - 1 -
Annexure V
Impacts of Thermal Power Plant Discharge on Marine Ecology – A Literature Review
Impacts of increased temperature on phytoplankton
The anthropogenic driven temperature rise will disrupt the marine environment in many ways.
Most particular changes would be associated with physical changes expected in coastal regime,
such as modifications in circulation and stratification patterns, which will indirectly have drastic
impacts on biogeochemical cycles of essential elements and biota distribution (Behrenfeld M. J.
et al. 2006). These alterations will ultimately lead to shifts in food web structure and productivity
(Lewandowska et al, 2011). However, owing to the sensitivity of biological processes to
temperature, direct thermal effects on aquatic life forms are also anticipated. From a broad
perspective, three main responses for organisms facing warming are anticipated:
(i) Species may disperse to more hospitable habitats.
(ii) Phenotypic and physiological plasticity may allow species to tolerate the new conditions.
(iii)Species may adapt to the new conditions through genetic change via the process of
evolution (Hofmann G. E., Todgham A. E. 2010).
In particular, drifting life forms whose spatial distribution is primarily determined by the motion
of the water column, such as those integrating the plankton community; rely on the two last
mechanisms to cope with the increased temperature, considering the environmental selection
forcing. Among this diverse group of organisms, phytoplankton (which are central to
biogeochemical and ecological services and play key roles in both regulation of atmospheric
CO2 through photosynthesis and in the maintenance of upper trophic levels) have already been
observed to respond to warming. Thus, marine phytoplankton biomass and productivity have
been shown to decrease in response to warmer sea surface temperatures. The predicted reduction
in nutrient supply to the euphotic layer as a result of increased thermal stratification has been
also indicated as a potential mechanism altering phytoplankton community composition
(Cermeno P. et al, 2011). A direct effect of warmer temperature on phytoplankton populations
has been also described, as a significant increase in the proportion of small-sized species under

Marine Environmental Impact Assessment Report of Kutchh Power Generation Limited, Bhadreswar & Wadala
Villages, Mundra Taluka, Kutchh District
Cholamandalam MS Risk Services - 2 -
higher thermal conditions has been evidenced in both freshwater and marine ecosystem
(Daufresne M., Lengfellnera K., Sommer U. 2009).
In fact, a gradual shift towards smaller primary producers in a warmer ocean has been foreseen,
as temperature has been regarded as the main environmental parameter controlling size
distribution in phytoplankton assemblages (Moran X. A. 2010).
Impacts of increased temperature on zooplankton
Studies of the impact the discharge of power plant post-cooling waters has on zooplankton
taxonomic diversity, spatial distribution, abundance, biomass, and production have been
conducted for many years (Tunowski, 2009). Studies have also been performed in estuaries and
coast with altered thermal and hydrological regimes to identify and describe changes in
secondary production.
Experiments conducted by Goss and Bunting (2003) revealed that zooplankton can tolerate
temperature increase up to 10º C from the ambient without altering swimming capability.
All metabolic rates of zooplankton are dependent on temperature. The upper limits of thermal
tolerance for species of copepods from coastal region were found to be near the normal
temperature of the habitat. To assess the sub-lethal effects of thermal discharges on zooplankton
populations, Gaudy (1977) compared the respiratory metabolism of the copepod Acartia dausi at
the intake and discharge (∆T 6º C) and adjacent receiving waters affected by the heated effluents.
Seasonal variations in respiration rates were observed, but organisms collected from the heated
effluents had reduced metabolic rates; copepods exposed to a simulated thermal stress showed
similar reductions in metabolic rates. Gaudy suggested that the reductions in respiration rates of
Acartia clausi might offer some physiological advantage in compensating the effects of thermal
shock but further identification of these metabolic responses was needed.
Labelle and Bradley (1982) compared the critical thermal maxima and upper lethal temperatures
of copepods and decapods. Copepods were found to have a wider thermal range than decapods
and therefore have a relatively better capacity to withstand thermal stress. Gonzales suggested
that the thermal adaptation of copepods is manifested in the shifting of lethal limits, reproduction
and metabolic activities in response to the acclimation temperature, allowing these species to

Marine Environmental Impact Assessment Report of Kutchh Power Generation Limited, Bhadreswar & Wadala
Villages, Mundra Taluka, Kutchh District
Cholamandalam MS Risk Services - 3 -
tolerate a wide range of thermal stresses. One could conclude from these findings that
acclimation temperature is an important factor in thermal tolerance and that thermal stress from
power-plant operations is less severe for eurythermal species than stenothermal ones.
Impacts of increased temperature on benthos
Impacts of thermal plume would combine with those derived from other anthropogenic
pressures, such as the impacts derived from excess temperature inputs, which is a major driver of
the proliferation of hypoxia in the coastal ocean (Cloern 2001; Kemp et al. 1990). Dissolved
oxygen is the property that has changed more drastically in a shorter period of time in the marine
environment (Diaz & Rosenberg 1995; Diaz 2001). Oxygen deficiencies have increased in
frequency, duration, and severity in the world´s coastal areas during the last decades (Diaz &
Rosenberg 2008). As a consequence hypoxia is emerging as a major threat to marine coastal
biodiversity. Increasing temperature diminishes oxygen solubility (Carpenter 1966; Garcia &
Gordon 1992) and increases the respiration rates of organisms (Jones 1977; Enquist et al. 2003)
as temperature plays a fundamental role in regulating metabolic processes (Iriberri et al. 1985;
White et al. 1991).
Impacts of increased temperature on fishery
Fishes are readily affected by the temperature of the surrounding water which influences the
body temperature, growth rate, food consumption, feed conversion and other body functions
(Houlihan et al., 1993; Britz et al., 1997; Azevedo et al., 1998). Therefore, water temperature is a
driving force in the fish life because its effects are more than any other single factor. Growth and
liveability in fish are optimum within a defined temperature range (Gadowaski and Caddell,
1991). Each fish species has an ideal temperature range within which it grows quickly. However,
fish move into more favourable areas to regulate their body temperatures. In warmer
environments fish have a longer growing season and faster growth rate but tend to have a shorter
life span than in cool water.
High water temperatures increase the metabolic rates, resulting in increased food demand.
Although, fish can generally function in a wide range of temperatures, but they do have an

Marine Environmental Impact Assessment Report of Kutchh Power Generation Limited, Bhadreswar & Wadala
Villages, Mundra Taluka, Kutchh District
Cholamandalam MS Risk Services - 4 -
optimum range, as well as lower and upper lethal temperatures, for various activities (Beschta et
al., 1987).
Due to increased metabolic rates commercial fishes may grow bigger but at the same time fish
catch period would be limited due to lower life span. Similarly fish eggs and larvae are
extremely sensitive to higher temperatures (Lopez et al 2004). Hatching rate of fish eggs
decreases to 50% above 35º C.
Impact of increased salinity on phytoplankton
In vitro studies have been carried out to understand the effects of salinity shock and variation in
pH on phytoplankton communities in a tropical ecosystem of the Godavari Delta (a major
peninsular river in India). The distributions and variations in phytoplankton communities were
assessed by several quantitative determinations techniques. Subtle changes in salinity of the
seawater by few salinity units (ppt) completely altered community structure of the ecosystem and
allowed dominance of few planktonic algae. The cyanobacteria were found to tolerate higher
osmotic stress. The higher salinity tolerance range of the cyanobacteria was attributed to the
enhanced synthesis of zeaxanthin as protective xanthophylls against the osmotic stress. However,
the effects of changing pH were not as dramatic as salinity where the green algae and
the cyanobacteria from the same ecosystem showed a considerable acclimation towards the
fluctuating pH. These findings are environmentally relevant to understand the likely impact of
salinity ingress and pH variation on phytoplankton communities in a tropical ecosystem
(Chakraborty et al, 2011).
Pseudonitzschia spp have been observed at salinities ranging from 20 to 43.5 ppt in coastal
waters but occur more frequently and abundantly in higher salinity waters. Four tropical
Alexandrium species in the study by Lim and Ogata (2005) showed various pattern of growth
responses in the salinity ranges tested. A. minutum exhibited exceptionally strong tolerance
towards salinity changes hence it was a euryhaline species while Alexandrium tamiyanvanchii
was more stenohaline. As is often the case, species that tolerated low salinity can also tolerate
very high salinity (Taylor and Pollingher, 1987). Most of the phytoplankton species cannot grow

Marine Environmental Impact Assessment Report of Kutchh Power Generation Limited, Bhadreswar & Wadala
Villages, Mundra Taluka, Kutchh District
Cholamandalam MS Risk Services - 5 -
in salinity fluctuations of 2 ppt due to osmotic acclimation. A salinity fluctuation of nearly 5 ppt
is a lethal barrier for most coastal planktonic algae (Kies, 1997).
With reference to previous studies, significant change in species composition of phytoplankton is
expected in Gulf of Kutch due to proposed thermal discharge. However, no negative impact is
envisaged on abundance.
Impact of increased salinity on Zooplankton
On the basis of their ability to withstand salinity changes, zooplanktons are generally classified
as stenohaline or curyhaline, and it is usually assumed that plankton forms of the open sea which
normally survive in relatively constant high salinities are stenohaline. Evidence for this is based
mainly on distribution studies in relation to salinity determinations. Although earlier research of
salinity tolerances of marine organisms these have dealt mostly with macro organisms living in
the relatively low salinity waters near the coastline, several experiments have been conducted on
zooplankton using increased salinities. In all of these experiments, survival periods of
zooplanktons were considerably shorter than those compared with ambient salinities.
Amphipods, were observed to lived less than half the time than that of ambient saline waters
when the salinity was increased by only 5% (experimental salinity 38.71 ppt). 20% increase in
salinity (43 ppt) showed mortality of all animals in 3 hrs. Among all faunal groups of
zooplankton, Copepoda showed salinity tolerance much greater than they would be expected to
encounter in their normal environment of the open ocean. However, salinity tolerances as studied
in previous experiments do not support definite conclusions as to whether or not salinity is a
limiting factor in the growth and distribution of the zooplankton. Zooplankton community of
Gulf of Kutch is also dominated by copepods which can be attributed to higher salinity values
due to existing outfall.
Impact of increased salinity on benthic fauna
Previous studies have shown that benthic fauna can withstand wide range of salinity (Sivadas et
al, 2011). Fauna observed in oligohaline (salinity below 5 ppt) zones of creek can also be
observed in euhaline zones (salinity above 5 ppt) near coast.
Marine Environmental Impact Assessment Report of Kutchh Power Generation Limited, Bhadreswar & Wadala
Villages, Mundra Taluka, Kutchh District
Cholamandalam MS Risk Services - 6 -
Impact of increased salinity on commercial fishery
Studies about the salinity and temperature optima for penaeid larvae have been carried out on
several species (Preston, 1985; Kumulu and Jones, 1993; Parado-Estepa et al., 1993; Kumulu et
al., 2000). The optimal environmental conditions for growth are species specific and differ
between life-history stage and season (Costlow et al., 1960; Bas and Spivak, 2000). During the
nauplius stage, the rate of development is mainly influenced by abiotic factors, as the larvae do
not feed at this stage. On reaching the protozoeal stage feeding commences and the rate of
development is influenced by the abundance of suitable food in addition to salinity and
temperature. Salinity tolerances become broader as larval development proceeds. Protozoeal
stages had the lowest tolerance to changes in salinity, while mysis stages were the least affected
in Penaeus marginatus (Gopalakrishnan, 1976) and Metapenaeus bennettae (Preston, 1985).
Conventionally, larval cultures of penaeid shrimp are been done in high saline seawater (Chen,
1990; Parado-Estepa, 1998; Kumulu et al., 2000) though temperatures up to 32º C and salinities
ranging from 27 to 34 ppt have been found suitable for development of penaeid larvae
(Hudinaga, 1942; Cook and Murphy, 1969). However, studies carried out by Zacharia and
Kakati (2004) showed that more that 50% eggs can hatch and more than 60% larvae can survive
at 40 ppt Salinity. Commercially exploitable calms and molluscs show tendency to grow better in
high salinity regions (Gireesh and Gopinathan, 2008). Although all research carried out earlier
emphasise on general statements. Similarly, the experiments indicated that salinity tolerances in
certain faunal groups from the open ocean and particularly from the high salinity area may be
somewhat higher than expected in natural conditions. Continued investigation of this problem,
with concentration on species specific experiments should yield more conclusive results. Rather,
a more complete analysis of the effect of salinity changes on all phases of the life history of each
group must be made before any definite conclusions are drawn.