marine corrosion performance of copper alloy uns c69100 · marine corrosion performance of copper...
TRANSCRIPT

Marine Corrosion Performance of Copper Alloy UNS C69100
Mengyan Nie University of Southampton
National Centre for Advanced Tribology at Southampton (nCATS)
Southampton, SO17 1BJ United Kingdom
John Zbihlyj
Tungum Limited Alexandra Way
Tewkesbury, GL20 8TD United Kingdom
Julian A. Wharton University of Southampton
National Centre for Advanced Tribology at Southampton (nCATS)
Southampton, SO17 1BJ United Kingdom
ABSTRACT Tungum alloy (UNS C69100) is an aluminum-nickel-silicon brass and is reported to have a good corrosion performance in marine environments (fully wetted, splash zone and atmospheric conditions). In order to gain an in-depth understanding of the marine corrosion performance of this alloy, electrochemical test methods including open-circuit potential, electrochemical impedance spectroscopy, potentiodynamic polarization, and zero-resistance ammetry were used for corrosion investigation of UNS C69100 in a 3.5 wt.% sodium chloride aqueous testing solution, in combination with optical microscopy and scanning electron microscopy. The corrosion properties of UNS C69100 obtained by electrochemical methods were also compared with six alternative alloys: UNS S31603, UNS S31254, UNS S32750, UNS N04400, UNS N08904 and UNS C36000. Galvanic coupling behavior of wrought UNS C69100 bar and seamless tubing against these six alloys in a 3.5% NaCl solution for 30 days immersion are also reported in this paper. Key words: UNS C69100 alloy, marine corrosion, galvanic corrosion, electrochemical impedance spectroscopy, zero-resistance ammetry.
INTRODUCTION Tungum alloy(1) (UNS C69100) is an aluminum-nickel-silicon brass (chemical composition: 81-84% Cu, 0.70-1.20 Al, 0.8-1.40 Ni, 0.80-1.30 Si, with the remainder Zn) and is reported to have good corrosion
(1) Trade name

performance in marine environments (fully wetted, splash zone and atmospheric conditions) from many years’ service experience. UNS C69100 tubing was reported to have best localized corrosion resistance among six metallic materials (316L, Alloy 825, 317LMN, 254 SMO, Alloy 625 and UNS C69100), judged by crevice corrosion and pit depths when exposed to a cyclic salt fog environment (ASTM D 5894 – alternating 1 h wet and 1 h dry conditions, with temperatures varying between 35 C and 45 C).1 In the same report, eight alloys (316L, 317 LMN, Duplex, 254 SMO, Alloy 825, Alloy 625, Alloy 400 and UNS C69100) underwent field trials on two offshore platforms for one year. Again C69100 performed well, although there was evidence of shallow pits but with a relatively high pit density, the UNS C69100 outperformed 316L (30 µm vs. 90 µm seen on 316L). Overall, C69100 was recommended as a good alternative to 316L for small bore tubing in marine applications.1 To date, there appears to be scant data available about the corrosion behavior and galvanic performance of UNS C69100 alloy in marine environments. La Que2 has ranked the open-circuit potentials of many metals and the effects of coupling common alloys in seawater. This ranking on its own is often not necessarily sufficient to enable a satisfactory materials selection free from galvanic corrosion since it neither considers cathodic efficiency nor the underlying corrosion mechanisms of the couple components.3 The marine corrosion behavior of the least noble or anodic component is thus important. For instance, unlike stainless steels, copper alloys in seawater do not have a truly passive layer but rely on a tenacious protective oxide film, which limits the rate of metal dissolution, although copper-based alloys generally suffer general corrosion which is increased when coupled to a more noble metal / more corrosion resistant alloy. Wallen and Andersen4 reported that most copper alloys when coupled to equal areas of stainless steel have increased corrosion rates by a factor of seven in natural seawater. However, since the free corrosion (single metal / uncoupled) is generally very low, the increase can often be acceptable, especially for thick walled components. In order to gain a more comprehensive understanding of the UNS C69100 corrosion performance in marine environments, a series of short term electrochemical tests including open-circuit potential (OCP), electrochemical impedance spectroscopy (EIS), potentiodynamic polarization, and zero-resistance ammetry (ZRA) were used to investigate the single metal and galvanic coupling behavior of wrought UNS C69100 bar and seamless tubing against six alternative alloys (UNS S31603, UNS S31254, UNS S32750, UNS N04400, UNS N08904 and UNS C36000) in a 3.5% sodium chloride (NaCl) solution for 30 days immersion, in combination with optical microscopy (OM) and scanning electron microscopy (SEM).
EXPERIMENTAL PROCEDURE Electrochemical Test Procedures Three different electrochemical techniques, OCP, EIS and potentiodynamic polarization were used to characterize the corrosion behavior of the wrought UNS C69100 bar and seamless tubing (designated hereafter as disc and tube samples, respectively) in a 3.5% (wt.%) static NaCl aqueous solution (pH 7.4, and 7 ppm dissolved oxygen concentration). The as-received UNS C69100 alloy disc samples with a diameter of 15 mm and a thickness of ca. 5 mm were sequentially wet ground with P120 (125 µm), P1200 (15 µm) and P4000 (5 µm) silicon carbide abrasive papers, and then degreased with distilled water and acetone followed by air drying. The degreased discs were placed into a polytetrafluoroethylene (PTFE) sample holder with a 12 mm in diameter window exposed to the solution (exposed electrode surface area: 1.13 cm2). The as-received UNS C69100 alloy straight and coiled tubes with the dimension of 9.52 mm (3/8 in) OD 1.63 mm (16 SWG) thickness, were also degreased with distilled water and acetone, and then housed in a PTFE sample holder with an average tube length of 10.55 mm (surface area: 3.15 cm2) exposed to the solution. Electrochemical measurements were performed using a Gamry Ref600(2) potentiostat within a Faraday cage at ambient room temperature. A
(2) Trade name

silver / silver chloride (Ag/AgCl, 3.5 M KCl) reference electrode and graphite rod counter electrode were used for all electrochemical measurements. After immersion into the 3.5% NaCl test solution, the disc and tube samples were held for 1 h to allow a pseudo steady-state open-circuit potential to be achieved before starting the electrochemical measurements. EIS was performed at OCP over a frequency range from 100 kHz to 0.01 Hz using a sinusoidal AC voltage amplitude of ±10 mV. Subsequently, potentiodynamic polarization was carried out in the range of –0.2 to +0.5 V with respect to the OCP at a scan rate of 0.167 mV s–1. All electrochemical measurements were repeated at least three times. In order to compare the UNS C69100 corrosion performance with other common alloys frequently used in marine applications, electrochemical tests were also performed in 3.5% NaCl aqueous solution on the polished discs samples of other alternative stainless steels, nickel-copper and copper-based alloys: namely, four high alloy stainless steels (UNS S31603, UNS S31254, UNS S32750, UNS N08904), a nickel-copper alloy (UNS N04400) and a brass (UNS C36000). The chemical compositions for all alloys have been summarized in Table 1.
Table 1 Chemical Composition of Alloys (wt.%)
Alloy (UNS)
C Si Mn Cr Mo Ni P S N Pb Al Fe Zn Co Cu
C69100 - 0.80-1.30
-0.10
- - 0.80-1.40
- - - - 0.70-1.20
-0.25
ca.14 - 81.00-84.00
S31603 0.023 0.61 1.65 17.00 2.01 10.05 0.045 0.024 0.070 - - bal - - 0.49
S31254 0.019 0.59 0.88 19.58 6.09 18.00 0.025 0.001 0.212 - - bal - - 0.69
S32750 0.018 0.18 0.50 25.55 3.75 6.90 0.019 0.0003 0.280 - - bal - <0.05 0.23
N08904 0.012 0.65 1.15 19.44 4.04 24.21 0.018 0.0009 0.047 - - bal - - 1.31
N04400 0.12 0.14 0.84 - - 66.30 - 0.001 - - - 0.69 - 0.030 31.70
C36000 - - - - - - - - - 2.8 - 0.27 34.34 - 62.1
Galvanic Coupling Tests using Zero-Resistance Ammetry: Galvanic coupling tests were performed for UNS C69100 against six alternative alloys (UNS S31603, UNS S31254, UNS S32750, UNS N04400, UNS N08904 and UNS C36000 – 15 mm diameter discs) in a 3.5% NaCl test solution within a Faraday cage. Prior to galvanic coupling, both the C69100 alloy and alternative alloy samples were sequentially wet ground with P120 (125 µm), P1200 (15 µm) and P4000 (5 µm) silicon carbide abrasive papers, and then degreased with distilled water and acetone followed by air drying. The disc samples were placed into a PTFE sample holder with a 12 mm in diameter window exposed to the testing solution. The galvanic couple area ratio was 1:1 (C69100 : alternative alloy). All galvanic coupling tests used a Ag/AgCl (3.5 M KCl) reference electrode. During galvanic testing, the couple potential, Ecouple, and galvanic current density, igalvanic, were simultaneously monitored using an ACM Instruments Galvogill(3) zero resistance ammeter (ZRA). All galvanic coupling tests were performed in either duplicates or triplicates.
(3) Trade name

RESULTS AND DISCUSSION Electrochemical Behavior of the UNS C69100 Alloy
Open-circuit Potentials of UNS C69100 Alloy Disc and Tube Samples Figure 1 shows all C69100 test samples obtained a corrosion potential between –0.200 and –0.220 V vs. Ag/AgCl within 1 h, which is consistent with the data often reported in the open literature for copper-based alloys.5,6 As shown in Figure 1, the OCPs for both the UNS C69100 discs and coiled tube samples shift in the electronegative direction within 1 h after immersion (most likely to be associated with the disruption of any initial air-formed oxide film and/or surface defects). It is noticeable that the as-received disc and the coiled tube samples achieve a pseudo steady-state OCP more quickly than the polished disc sample, which may be due to the formation of a more established oxide layer in the air after fabrication. In contrast, the OCP for the straight tube sample exhibited a different trend within the initial 1 h immersion, shifting rapidly in the electropositive direction within 15 mins after immersion, before oscillating slightly between –0.204 V and –0.210 V vs. Ag/AgCl.
Immersion time (s)
0 1000 2000 3000 4000
OC
P v
s A
g/A
gC
l (V
)
-0.23
-0.22
-0.21
-0.20
Polished discAs-received discStraight tubeCoiled tube
Figure 1: OCP vs. immersion time for UNS C69100 disc and tube samples in 3.5% NaCl solution.
UNS C69100 Potentiodynamic Polarization Behavior
As shown in Figure 2, both disc and tube C69100 alloy samples exhibit a similar active-passive corrosion behavior in the 3.5% NaCl test solution. All anodic polarization branches demonstrate that, in the active region between the corrosion potential (Ecorr approx. –0.180 V for tube and –0.230 V for disc) and the pseudo-passivation potential (Epp approx. +0.105 V for tube and +0.170 V for disc), the
predominant process is the dissolution of copper to form 2CuCl complex, which further hydrolyses to
form a protective cuprous oxide Cu2O layer on the surface.7-10 Due to the porous microstructure and the electrical conductivity of the Cu2O passive layer, the current density is maintained at a relatively high and steady level in the passive region, where the corrosion rates are about four orders of magnitude higher than the corrosion rate at Ecorr.

Current density (A cm-2)
10-10 10-9 10-8 10-7 10-6 10-5 10-4 10-3 10-2
Po
ten
tia
l vs
Ag
/Ag
Cl (
V)
-0.4
-0.2
0.0
0.2
0.4
Polished disc As-received discStraight tubeCoiled tube
Figure 2: Potentiodynamic polarization curves for UNS C69100 alloy disc and tube samples obtained in 3.5% NaCl solution at a scan rate of 0.167 mV s–1.
However, it is worth noting that corrosion potentials obtained from polarization curves for both straight and coiled tube samples were similar at around –0.180 V (see Table 2), but were slightly more noble by 40 mV than the disc samples. The pseudo-passivation potentials (Epp) obtained were around +0.105 V for both straight and coiled tube samples, which are about 60 mV less than those obtained for both disc samples in 3.5% NaCl testing solution. In spite of mechanical deformation induced by manufacturing the coiled C69100 tubing, the overall corrosion performance (e.g., Ecorr, Epp and the corrosion rates) evaluated from the polarization curves for the C69100 alloy tube samples are only slightly altered in comparison with the disc samples. Ultimately, it can be concluded that two sample forms have a similar free corrosion performances.
UNS C69100 Electrochemical Impedance Spectroscopy Although potentiodynamic polarizations are used widely for an evaluation of corrosion potential and corrosion rate, the Tafel extrapolation may be complicated by more than one anodic and cathodic process. The reactions which occur at the corrosion potential should be the only reactions which occur during determination of the polarization curves. That is, changes in electrode potential should not induce additional electrochemical reactions in either the anodic or cathodic direction.11 Electrochemical impedance spectroscopy is a non-destructive and sensitive technique widely used for the characterization of the electrochemical interface between electrodes and electrolytes, and has emerged as the most powerful of electrochemical techniques for defining reaction mechanisms and for investigating corrosion processes. Therefore, EIS technique was also used to further investigate the corrosion performance of UNS C69100 alloy disc and tube samples. Figure 3 shows representative Nyquist and Bode plots obtained at OCP in the 3.5% NaCl solution for UNS C69100 alloy disc and tube samples. In order to obtain information on the corrosion behavior of these samples, different equivalent circuits (ECs) were used to analyze the EIS spectra but only Mixed Kinetic and Diffusion Control (MKD) model provided a best fit for all experimental EIS data. As shown in Figure 3c, the MKD model consists of a solution resistance (Ru), a constant phase element (Ø), a charge transfer resistance (or polarization resistance, Rp), and a Warburg impedance, respectively. A constant phase element (CPE, Ø) was used instead of a pure capacitance in order to address the non-ideal behavior of the capacitive element due to different physical phenomena, such as surface heterogeneities, which may result from

surface roughness, impurities, dislocations and grain boundaries.12-14 The CPE impedance is defined as
ZCPE = [Y (j)]–1 (1) where Y is the admittance with dimensions of –1 cm–2 s, j is the imaginary number, is the angular frequency and is an empirical exponent of the CPE, with a value of –1 1, associated with the non-uniform distribution of current as a result of surface roughness and defects. The CPE can represent a circuit parameter with limiting behavior as an ideal capacitor for = 1, a resistor for = 0 and an inductor for = –1. Warburg impedance is often used to address the diffusion or mass transport caused impedance, and is expressed as
1 ⁄ (2) where σ is the Warburg coefficient with dimensions of cm2 s–1/2, j is the imaginary number, is the angular frequency. The corresponding polarization resistance Rp and Warburg impedance Wd values obtained from the simulation with the MKD model are also summarized in Table 2. Alternatively, there is no significant difference in the polarization resistance values between the as-received and polished disc samples, as well as between the straight and coiled tube samples. This indicates that the corrosion rates for both as-received and polished C69100 disc samples are similar in the 3.5% NaCl testing solution. It is also true that both straight and coiled tube samples have similar corrosion rates in the 3.5% NaCl solution. Conversely, the tube samples exhibited a higher polarization resistance than the disc samples, thus better corrosion performance in the 3.5% NaCl solution. All results from the OCP measurements, EIS and potentiodynamic polarization were summarized in Table 2.
Table 2 Corrosion Performance of UNS C69100 Alloy Disc and Tube Samples in 3.5% NaCl Solution
Alloy UNS C69100 OCPa
(mV) Ecorr
b
(mV) icorr
b (µA cm–2)
Corrosion rateb (µm y–1)
Eppb
(mV) Rp
c (kΩ cm2)
Wdc
(kΩ cm2 s–1/2)
Polished disc –221±4 –238±6 0.562±0.149 6.85±1.82 +166±3 2.19±0.20 0.302±0.067
As-received disc –216±2 –228±1 0.650±0.032 7.93±0.39 +174±1 2.16±0.18 0.402±0.055
Straight tube –208±4 –177±3 0.377±0.071 4.60±0.86 +108±10 3.10±0.64 0.498±0.189
Coiled tube –206±2 –181±3 0.549±0.026 6.70±0.31 +102±7 3.32±0.25 0.391±0.073
a Estimated from OCP measurements after 1 h immersion. b Evaluated from polarization curves using Tafel extrapolation. c Estimated from EIS simulation using MKD model.
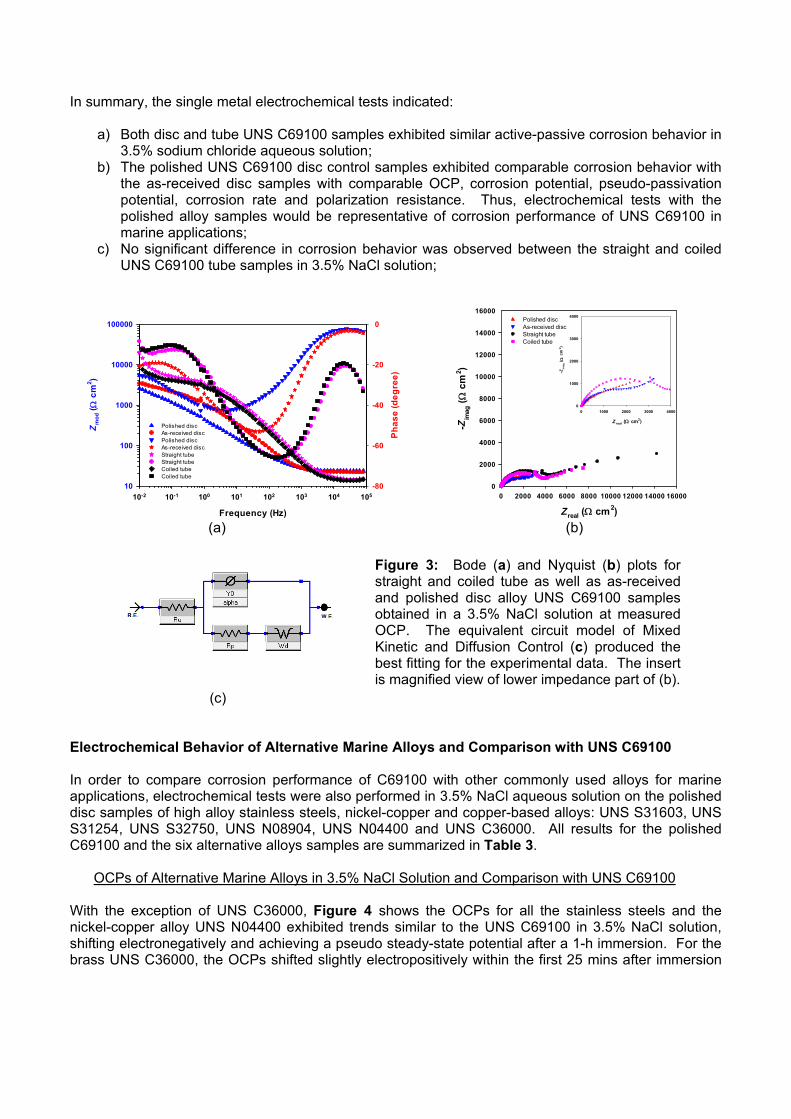
In summary, the single metal electrochemical tests indicated:
a) Both disc and tube UNS C69100 samples exhibited similar active-passive corrosion behavior in 3.5% sodium chloride aqueous solution;
b) The polished UNS C69100 disc control samples exhibited comparable corrosion behavior with the as-received disc samples with comparable OCP, corrosion potential, pseudo-passivation potential, corrosion rate and polarization resistance. Thus, electrochemical tests with the polished alloy samples would be representative of corrosion performance of UNS C69100 in marine applications;
c) No significant difference in corrosion behavior was observed between the straight and coiled UNS C69100 tube samples in 3.5% NaCl solution;
Frequency (Hz)
10-2 10-1 100 101 102 103 104 105
Zm
od (
cm
2)
10
100
1000
10000
100000
Ph
as
e (
de
gre
e)
-80
-60
-40
-20
0
Polished discAs-received discPolished discAs-received discStraight tubeStraight tubeCoiled tubeCoiled tube
Zreal ( cm2)
0 2000 4000 6000 8000 10000 12000 14000 16000
-Zim
ag (
cm
2 )
0
2000
4000
6000
8000
10000
12000
14000
16000Polished discAs-received discStraight tubeCoiled tube
Zreal ( cm2)
0 1000 2000 3000 4000
-Zim
ag (c
m2)
0
1000
2000
3000
4000
(a) (b)
(c)
Electrochemical Behavior of Alternative Marine Alloys and Comparison with UNS C69100 In order to compare corrosion performance of C69100 with other commonly used alloys for marine applications, electrochemical tests were also performed in 3.5% NaCl aqueous solution on the polished disc samples of high alloy stainless steels, nickel-copper and copper-based alloys: UNS S31603, UNS S31254, UNS S32750, UNS N08904, UNS N04400 and UNS C36000. All results for the polished C69100 and the six alternative alloys samples are summarized in Table 3.
OCPs of Alternative Marine Alloys in 3.5% NaCl Solution and Comparison with UNS C69100 With the exception of UNS C36000, Figure 4 shows the OCPs for all the stainless steels and the nickel-copper alloy UNS N04400 exhibited trends similar to the UNS C69100 in 3.5% NaCl solution, shifting electronegatively and achieving a pseudo steady-state potential after a 1-h immersion. For the brass UNS C36000, the OCPs shifted slightly electropositively within the first 25 mins after immersion
Figure 3: Bode (a) and Nyquist (b) plots for straight and coiled tube as well as as-received and polished disc alloy UNS C69100 samples obtained in a 3.5% NaCl solution at measured OCP. The equivalent circuit model of Mixed Kinetic and Diffusion Control (c) produced the best fitting for the experimental data. The insert is magnified view of lower impedance part of (b).

and then drifted slightly to a stable value within 1 h immersion in 3.5% NaCl solution. The OCPs for all four stainless steels were approximately 40 to 60 mV electronegative than for UNS C69100, while the OCPs for UNS N04400 and UNS C36000 were nearly identical to UNS C69100 after 1 h immersion in 3.5% NaCl solution (see Table 3).
Table 3 Corrosion Performance of UNS C69100 and the Six Alternative Alloys in 3.5% NaCl Solution
Alloys (UNS)
OCPa
(mV) Ecorr
b
(mV) icorr
b (µA cm–2)
Corrosion rateb (µm y–1)
Rpc
(kΩ cm2)
C69100 –221± 4 –238± 6 0.562±0.149 6.85±1.82 2.19±0.20
S31603 –262±13 –268± 3 0.660±0.171 7.54±1.96 24.45±6.05
S31254 –259±10 –273±12 0.672±0.088 7.67±1.00 22.15±4.23
S32750 –282±12 –291±11 0.588±0.079 6.71±0.90 29.51±7.30
N08904 –251± 5 –257± 2 0.689±0.137 7.87±1.56 20.38±2.36
N04400 –215±10 –214± 2 2.807±0.274 37.37±3.65 5.62±0.70
C36000 –220± 2 –220± 7 1.855±0.784 22.87±9.67 4.56±0.57
a Estimated from OCP measurements after 1 h immersion. b Evaluated from polarization curves using Tafel extrapolation. c Estimated from EIS simulation using MKD model for C69100 and two-layer-in-series model for the
alternative alloys.
Immersion time (s)
0 500 1000 1500 2000 2500 3000 3500 4000
OC
P v
s A
g/A
gC
l (V
)
-0.30
-0.28
-0.26
-0.24
-0.22
-0.20
-0.18
-0.16
-0.14C69100S31603S31254S32750N08904N04400C36000
Figure 4: OCPs vs. immersion time for UNS C69100 and six alternative alloys in 3.5% NaCl solution (polished disc samples).

Potentiodynamic Polarization Behavior of the Alternative Alloys and C69100 Comparison Figure 5 shows the potentiodynamic polarization data for the S31603, S31254, S32750, N08904, N04400, C36000 and C69100 (all samples were polished discs) obtained in 3.5% NaCl solution. Differences in corrosion potential behavior are clearly demonstrated for all seven alloys. Alloy UNS C69100 exhibited very similar corrosion behavior to UNS C36000 (brass) in a 3.5% NaCl solution, but very different to the stainless steels (S31603, S31254, S32750 and N08904). The corrosion potential, Ecorr, and corrosion current density, icorr, for all alloys were evaluated using Tafel extrapolation from the polarization curves and thus the corrosion rates were determined and listed in Table 3. According to the corrosion potentials obtained from Figure 5, C69100 alloy is similar to UNS N04400 and UNS C36000, but slightly more noble to the four stainless steels (S31603, S31254, S32750 and N08904). The Tafel extrapolation method for the determination of corrosion rates is strictly only valid provided at least one of the branches of the polarization curves is under activation control (it is preferable that both branches obey Tafel behavior). Moreover, the anodic and cathodic reactions which occur at the corrosion potential are also the only reactions which occur during determination of the polarization curves. That is, changes in electrode potential should not induce additional electrochemical reactions in either the anodic or cathodic direction.11
Current density (A cm-2)
10-10 10-9 10-8 10-7 10-6 10-5 10-4 10-3 10-2 10-1
Po
ten
tia
l vs
Ag
/Ag
Cl (
V)
-0.5
0.0
0.5
1.0
1.5
C69100S31603S31254S32507N08904N04400C36000
Figure 5: Potentiodynamic polarization curves of UNS C69100, UNS S31603, UNS S31254, UNS S32750, UNS N08904, UNS N04400 and UNS C36000 obtained in a 3.5% NaCl solution, at a scan rate of 0.167 mV s–1 (polished disc samples).
EIS of UNS C69100 and Alternative Alloys in 3.5% NaCl Solution
Figure 6 shows representative Nyquist and Bode plots obtained at OCP in the 3.5% NaCl solution for C69100 and six alternative alloy samples. Different equivalent circuits were used to analyze the EIS spectra in order to obtain information on the corrosion behavior of these samples. The MDK model in Figure 3c provided a best fit for the EIS experimental data of the alloy UNS C69100, while a model of two-layer-in-series in Figure 6e provided a best fit for the EIS experimental data of all other alternative alloys. The equivalent circuit model of two-layer-in-series consists of a solution resistance (Rs), two constant phase elements (Øou, Øin) and two charge transfer resistances (Rin, Rou), respectively. One time constant can be attributed to the charge transfer resistance (Rin) and double layer capacitance (Cin) in parallel across the inner protective film, and the second is attributed to the charge transfer

resistance (Rou) and double layer capacitance (Cou) in parallel in the outer layer or surface defects. In this instance, the polarization resistance (Rp) is the sum of both charge transfer resistances Rp = Rin + Rou. The corresponding values obtained from a simulation with the two-layer-in-series model are also summarized in Table 3.
Zreal ( cm2)
0 5000 10000 15000 20000 25000
- Zim
ag (
cm
2 )
0
5000
10000
15000
20000
25000C69100S31603S31254S32750N08904N04400C36000
Frequency (Hz)
10-2 10-1 100 101 102 103 104 105
Zm
od (
cm
2)
10
100
1000
10000
Impedanece, C69100Impedance, S31603Impedance, S31254Impedance, S32750Impedance, N08904Impedance, N04400Impedance, C36000
(a) (b)
Frequency (Hz)
10-2 10-1 100 101 102 103 104 105
Ph
as
e a
ng
le (
de
gre
e)
-80
-60
-40
-20
0
Phase, C69100Phase, S31603Phase, S31254Phase, S32750Phase, N08904Phase, N04400Phase, C36000
Zreal ( cm2)
0 5000 10000 15000 20000 25000
- Zim
ag (
cm
2)
0
5000
10000
15000
20000
25000C69100Fit for C69100C36000Fit for C36000S31254Fit for S31254
(c) (d)
(e)
Figure 6: Nyquist (a), Bode impedance magnitude (b) and phase angle (c) vs frequency plots for UNS C69100 and the six alternative alloys obtained in a 3.5% NaCl solution measured at their OCPs. (d) Solid lines represent the best fit results for UNS C69100, C36000 and S31254 with a two-layer-in-series equivalent circuit model (e).
As shown in Table 3, UNS C69100 alloy has the lowest polarization resistance values compared to the six alternative alloys. With regard to UNS C69100 alloy, the brass alloy UNS C36000 and the nickel-copper alloy UNS N04400 exhibited higher polarization resistances by a factor of two, while the four stainless steels have polarization resistances that are typically an order of magnitude greater (10).

Galvanic Series Ranking of Seven Alloys from Electrochemical Tests From both the OCP and potentiodynamic polarization data, the UNS C69100 has both an OCP and Ecorr similar to the UNS N04400 and UNS C36000 alloys in 3.5% NaCl aqueous solution. However, C69100 is slight more noble than the four stainless steels (UNS S31603, UNS S31254, UNS S32750 and UNS N08904). Accordingly, the galvanic series for these seven alloys in a 3.5% NaCl solution can be loosely ranked from noble to active as single-phased UNS N04400 (Alloy 400), duplex-phased brass UNS C36000, UNS C69100, austenitic stainless steels UNS N08904 (904L), UNS S31254 (SMO 254), UNS S31603 (SS 316L) and super-duplex stainless steel UNS S32750 (2507). Nonetheless, as previously discussed this does not consider the underlying corrosion mechanisms and kinetics, i.e., either the rapid formation of a passive film or the slower generation of a protective oxide layer. It is evident that the polarization resistance ranking (which is inversely proportional to the corrosion rate), assessed by EIS, for all seven alloys is different from those in the corrosion rate evaluated from the potentiodynamic polarization. As discussed previously, the accuracy of the icorr estimated from polarization curves may be compromised due to ill-defined anodic or cathodic Tafel regions (over at least one decade of current). Whereas electrochemical impedance spectroscopy as a non-destructive and sensitive technique can more accurately characterize the electrochemical behavior at a corroding interface. Overall, the C69100 corrosion performance determined in this study compares favorably with that found in the open literature data for copper alloys in seawater. For instance, the general corrosion rates in seawater for copper, brass and Alloy 400, are often reported to range between 15–100 µm y–1, 10–30 µm y–1 and <25 µm y–1, respectively.7,15 Galvanic Performance of UNS C69100 : Stainless Steel Couples Galvanic corrosion results from the potential difference between two dissimilar metals in electrical contact in a corrosive environment. For a galvanic couple between dissimilar metals, the more active metal will become the anodic component of the couple and will undergo accelerated corrosion, while the corrosion rate of the more noble metal will decrease. As a result of coupling, the potential of the noble metal becomes more electronegative and the potential of the active metal more electropositive. The ZRA method is usually used to measure the current flow between the two dissimilar metals immersed side by side in the solution, and to determine the change in the galvanic current density, igalvanic, as a function of time. In most cases, the galvanic current density measured is proportional to the enhanced corrosion rate of the metal with the more electronegative corrosion potential, i.e., the anodic component of the galvanic couple, in the uncoupled condition.5,16,17 Galvanic corrosion tests with a 1:1 area ratio have been performed for C69100 against the four stainless steels (S31603, S31254, S32750 and N08904) in a 3.5% NaCl test solution.
Galvanic couple between C69100 and S31603 stainless steel Figure 7 shows the couple potential and galvanic current density for the galvanic couple between UNS C69100 and stainless steel S31603 over an extended duration of five weeks (840 h). Daily fluctuations in the ambient temperature are clearly apparent in the measurements. The galvanic current densities, igalvanic, initially decreased markedly from 0.85 µA cm–2 to 0.25 µA cm–2 during the first 24 h and then slightly decreased further to 0.17 µA cm–2 over the following week (168 h), see Figure 7b. The galvanic current densities gradually increased to ca. 0.84 µA cm–2 during the remaining period up to 845 h. For the couple potential, a marked electropositive shift was observed during the first 24 h, from –210 mV to –187 mV, after which there was a gradual electronegative shift to –195 mV during the first week of coupling (up to 168 h). Over the remaining test period a slight electropositive shift to –185 mV occurred for the couple potential. The galvanic couples were decoupled for 1 h during the first, third, fourth and fifth week to measure the decoupled potentials for both C69100 and S31603 , as shown in Figure 7a. After decoupling, the
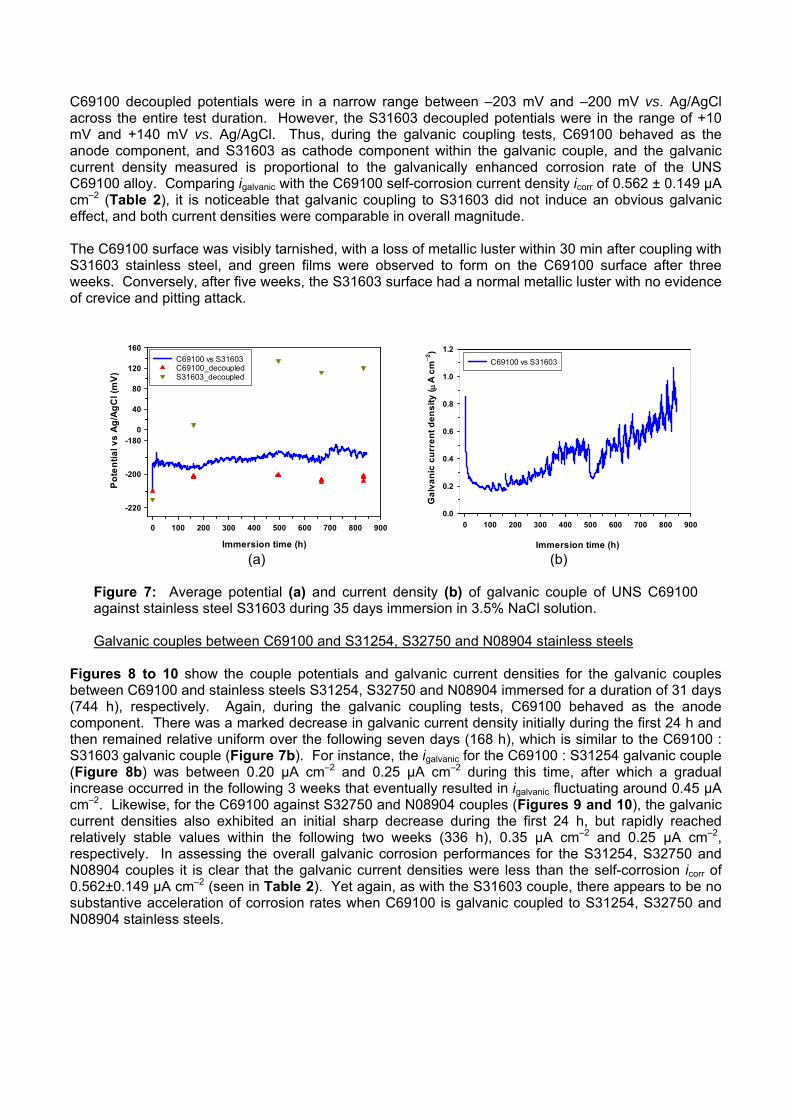
C69100 decoupled potentials were in a narrow range between –203 mV and –200 mV vs. Ag/AgCl across the entire test duration. However, the S31603 decoupled potentials were in the range of +10 mV and +140 mV vs. Ag/AgCl. Thus, during the galvanic coupling tests, C69100 behaved as the anode component, and S31603 as cathode component within the galvanic couple, and the galvanic current density measured is proportional to the galvanically enhanced corrosion rate of the UNS C69100 alloy. Comparing igalvanic with the C69100 self-corrosion current density icorr of 0.562 ± 0.149 µA cm–2 (Table 2), it is noticeable that galvanic coupling to S31603 did not induce an obvious galvanic effect, and both current densities were comparable in overall magnitude. The C69100 surface was visibly tarnished, with a loss of metallic luster within 30 min after coupling with S31603 stainless steel, and green films were observed to form on the C69100 surface after three weeks. Conversely, after five weeks, the S31603 surface had a normal metallic luster with no evidence of crevice and pitting attack.
Immersion time (h)
0 100 200 300 400 500 600 700 800 900
Po
ten
tia
l vs
Ag
/Ag
Cl (
mV
)
-220
-200
-1800
40
80
120
160
C69100 vs S31603C69100_decoupled S31603_decoupled
Immersion time (h)
0 100 200 300 400 500 600 700 800 900
Ga
lva
nic
cu
rre
nt
de
ns
ity
(
A c
m_
2)
0.0
0.2
0.4
0.6
0.8
1.0
1.2
C69100 vs S31603
(a) (b)
Figure 7: Average potential (a) and current density (b) of galvanic couple of UNS C69100 against stainless steel S31603 during 35 days immersion in 3.5% NaCl solution.
Galvanic couples between C69100 and S31254, S32750 and N08904 stainless steels
Figures 8 to 10 show the couple potentials and galvanic current densities for the galvanic couples between C69100 and stainless steels S31254, S32750 and N08904 immersed for a duration of 31 days (744 h), respectively. Again, during the galvanic coupling tests, C69100 behaved as the anode component. There was a marked decrease in galvanic current density initially during the first 24 h and then remained relative uniform over the following seven days (168 h), which is similar to the C69100 : S31603 galvanic couple (Figure 7b). For instance, the igalvanic for the C69100 : S31254 galvanic couple (Figure 8b) was between 0.20 µA cm–2 and 0.25 µA cm–2 during this time, after which a gradual increase occurred in the following 3 weeks that eventually resulted in igalvanic fluctuating around 0.45 µA cm–2. Likewise, for the C69100 against S32750 and N08904 couples (Figures 9 and 10), the galvanic current densities also exhibited an initial sharp decrease during the first 24 h, but rapidly reached relatively stable values within the following two weeks (336 h), 0.35 µA cm–2 and 0.25 µA cm–2, respectively. In assessing the overall galvanic corrosion performances for the S31254, S32750 and N08904 couples it is clear that the galvanic current densities were less than the self-corrosion icorr of 0.562±0.149 µA cm–2 (seen in Table 2). Yet again, as with the S31603 couple, there appears to be no substantive acceleration of corrosion rates when C69100 is galvanic coupled to S31254, S32750 and N08904 stainless steels.

Immersion time (h)
0 100 200 300 400 500 600 700 800
Po
ten
tia
l vs
Ag
/Ag
Cl (
mV
)
-200
-180
-100
-50
0
50
100
150
C69100 vs S31254C69100_decoupled S31254_decoupled
Immersion time (h)
0 100 200 300 400 500 600 700 800
Ga
lva
nic
cu
rre
nt
de
ns
ity
(
A c
m_
2)
0.0
0.2
0.4
0.6
0.8
1.0
1.2
C69100 vs S31254
(a) (b)
Figure 8: Average potential (a) and current density (b) of galvanic couple of UNS C69100 against stainless steel S31254 during 31 days immersion in 3.5% NaCl solution.
Immersion time (h)
0 200 400 600 800
Po
ten
tia
l vs
Ag
/Ag
Cl (
mV
)
-220
-200
-180
0
40
80
120
C69100 vs S32750C69100_decoupled S32750_decoupled
Immersion time (h)
0 200 400 600 800
Ga
lva
nic
cu
rre
nt
de
ns
ity
(
A c
m_
2)
0.0
0.2
0.4
0.6
0.8
1.0
1.2
C69100 vs S32750
(a) (b)
Figure 9: Average potential (a) and current density (b) of galvanic couple of UNS C69100 against stainless steel S32750 during 30 days immersion in 3.5% NaCl solution.
Immersion time (h)
0 200 400 600 800
Po
ten
tia
l vs
Ag
/Ag
Cl (
mV
)
-220
-200
-180
-80
-40
0
C69100 vs N08904C69100_decoupled N08904_decoupled
Immersion time (h)
0 200 400 600 800
Ga
lva
nic
cu
rre
nt
de
ns
ity
(
A c
m_
2)
0.0
0.2
0.4
0.6
0.8
1.0
1.2
C69100 vs N08904
(a) (b)
Figure 10: Average potential (a) and current density (b) of galvanic couple of UNS C69100 against stainless steel N08904 during 31 days immersion in 3.5% NaCl solution.
SEM Assessment of C69100 Protective Oxide Film
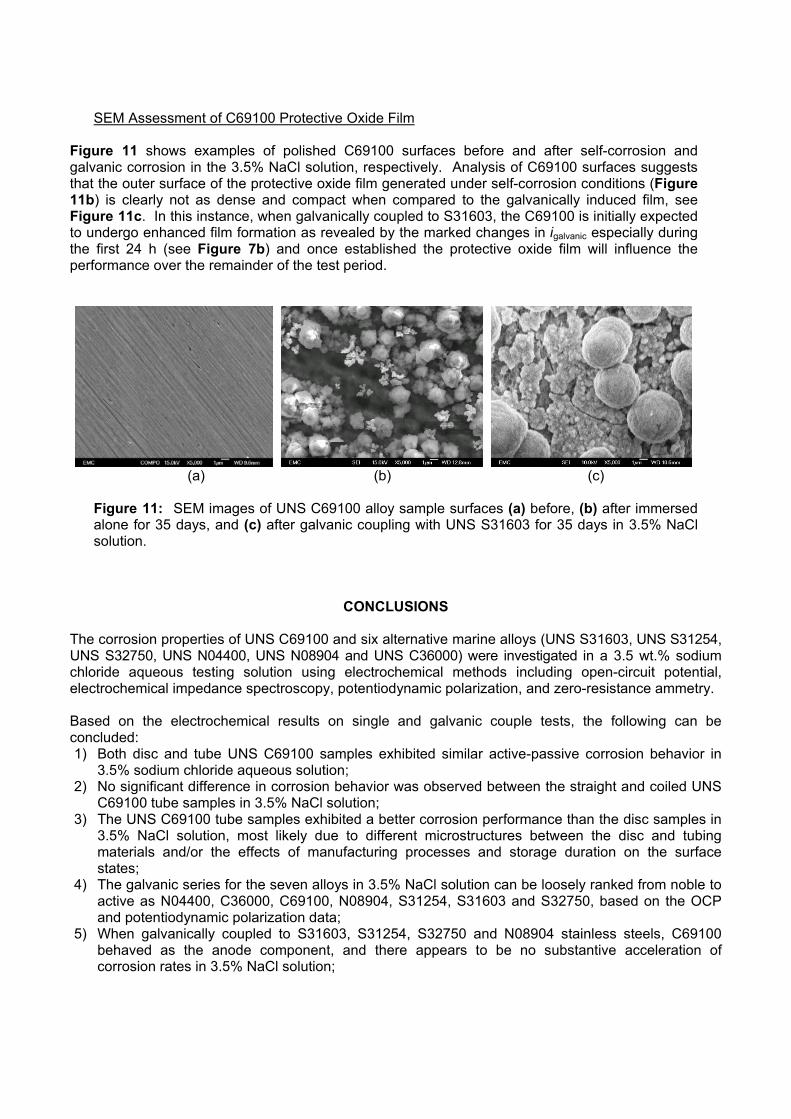
Figure 11 shows examples of polished C69100 surfaces before and after self-corrosion and galvanic corrosion in the 3.5% NaCl solution, respectively. Analysis of C69100 surfaces suggests that the outer surface of the protective oxide film generated under self-corrosion conditions (Figure 11b) is clearly not as dense and compact when compared to the galvanically induced film, see Figure 11c. In this instance, when galvanically coupled to S31603, the C69100 is initially expected to undergo enhanced film formation as revealed by the marked changes in igalvanic especially during the first 24 h (see Figure 7b) and once established the protective oxide film will influence the performance over the remainder of the test period.
(a) (b) (c)
Figure 11: SEM images of UNS C69100 alloy sample surfaces (a) before, (b) after immersed alone for 35 days, and (c) after galvanic coupling with UNS S31603 for 35 days in 3.5% NaCl solution.
CONCLUSIONS The corrosion properties of UNS C69100 and six alternative marine alloys (UNS S31603, UNS S31254, UNS S32750, UNS N04400, UNS N08904 and UNS C36000) were investigated in a 3.5 wt.% sodium chloride aqueous testing solution using electrochemical methods including open-circuit potential, electrochemical impedance spectroscopy, potentiodynamic polarization, and zero-resistance ammetry. Based on the electrochemical results on single and galvanic couple tests, the following can be concluded: 1) Both disc and tube UNS C69100 samples exhibited similar active-passive corrosion behavior in
3.5% sodium chloride aqueous solution; 2) No significant difference in corrosion behavior was observed between the straight and coiled UNS
C69100 tube samples in 3.5% NaCl solution; 3) The UNS C69100 tube samples exhibited a better corrosion performance than the disc samples in
3.5% NaCl solution, most likely due to different microstructures between the disc and tubing materials and/or the effects of manufacturing processes and storage duration on the surface states;
4) The galvanic series for the seven alloys in 3.5% NaCl solution can be loosely ranked from noble to active as N04400, C36000, C69100, N08904, S31254, S31603 and S32750, based on the OCP and potentiodynamic polarization data;
5) When galvanically coupled to S31603, S31254, S32750 and N08904 stainless steels, C69100 behaved as the anode component, and there appears to be no substantive acceleration of corrosion rates in 3.5% NaCl solution;

6) Dense and compact oxide films can be formed on the C69100 outer surface when galvanically coupled to stainless steels in 3.5% NaCl solution;
7) Further studies are necessary to determine the long-term C69100 corrosion performance and the extent of the protective oxide film formation over extended durations.
ACKNOWLEDGEMENTS The authors acknowledge the financial support from Innovate UK for this project.
REFERENCES 1. A. Kopliku, C. Mendez, “316 Stainless Steel Instrument Tubing in Marine Applications – Localized
Corrosion Problems and Solutions,” Corrosion 2010, paper no. 10305 (San Antonio, TX: NACE International,14-18 March 2010).
2. F.L. La Que, Marine Corrosion, (New York, NY: Wiley, 1975). 3. R. Francis, “Galvanic corrosion of high alloy stainless steels in sea water,” British Corrosion
Journal 29 (1994): pp 53-57, 4. B. Wallen, T. Anderson, “Galvanic Corrosion of Copper Alloys in Contact with Highly Alloyed
Stainless Steel in Seawater,” Proceedings of the 10th Scandinavian Corrosion Congress, paper no. 29 (Stockholm, Sweden, 2-4 June 1986).
5. R. Francis, Galvanic Corrosion: A Practical Guide for Engineers, (Houston, TX: NACE, 2001). 6. R. Winston Revie, Uhlig's Corrosion Handbook, 3rd ed. (Hoboken, NJ: John Wiley & Sons, Inc.,
2011). 7. R. Francis, The Corrosion of Copper and Its Alloys: A Practical Guide for Engineers, (Houston, TX:
NACE, 2010). 8. M. Kabasakaloğlu, T. Kiyak, O. Şendil, A. Asan, “Electrochemical Behavior of Brass in 0.1 M
NaCl,” Applied Surface Science 193 (2002): pp 167-174. 9. G. Kear, B.D. Barker, F.C. Walsh, “Electrochemical Corrosion of Unalloyed Copper in Chloride
media – a Critical Review,” Corrosion Science 46 (2004): pp 109-135. 10. J.A. Wharton, K.R. Stokes, “The Influence of Nickel-aluminium Bronze Microstructure and Crevice
Solution on the Nitiation of Crevice Corrosion,” Electrochimica Acta 53 (2008): pp 2463-2473. 11. E. McCafferty, “Validation of corrosion rates measured by the Tafel extrapolation method”,
Corrosion Science 47 (2005): pp 3202-3215. 12. J.B. Jorcin, M.E. Orazem, N. Pébère, B. Tribollet, “CPE Analysis by Local Electrochemical
Impedance Spectroscopy,” Electrochimica Acta 51 (2006): pp 1473-1479. 13. M. Nie, C.T. Wang, M. Qu, N. Gao, J.A. Wharton, T.G. Langdon, “The Corrosion Behaviour of
Commercial Purity Titanium Processed by High-pressure Torsion,” Journal of Materials Science 49 (2014): pp 2824–2831.
14. X. Wang, M. Nie, C.T. Wang, S.C. Wang, N. Gao, “Microhardness and Corrosion Properties of Hypoeutectic Al-7Si Alloy Processed by High-pressure Torsion,” Materials & Design 83 (2015): pp 193-202.
15. INCO, “A Guide to the Selection of Marine Materials,” 2nd (INCO, 1973). 16. D. Talbot, J. Talbot, Corrosion Science and Technology, (New York, NY: CRC Press, 1998). 17. N.G. Thompson, J.H. Payer, DC Electrochemical Test Methods, (Houston, TX: NACE, 1998).