marijuana in washington
TRANSCRIPT
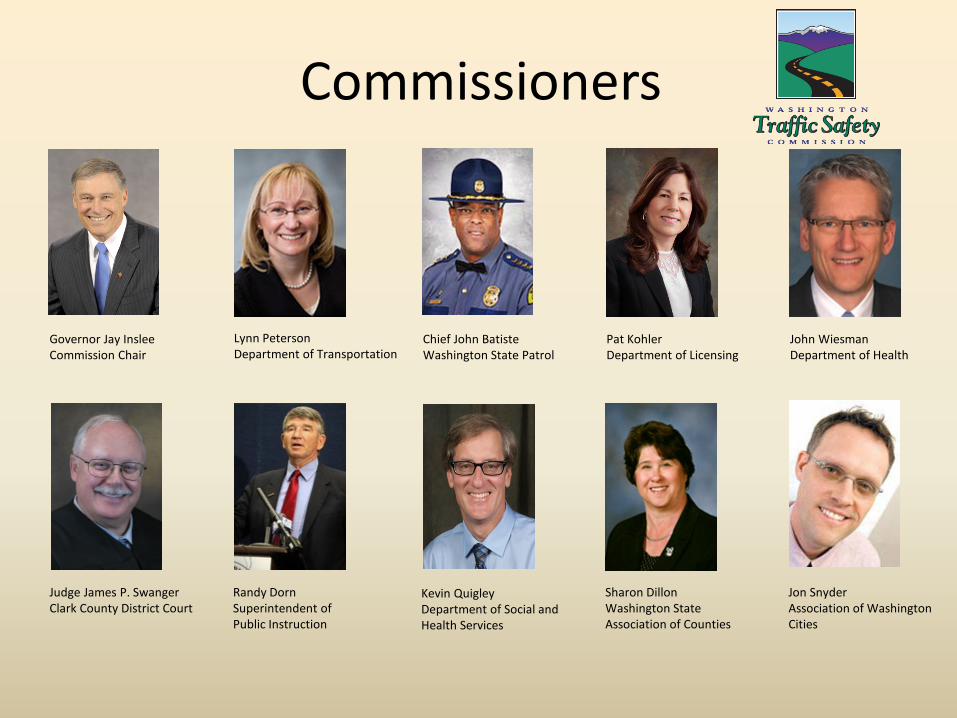
Commissioners
Chief John Batiste Washington State Patrol
Pat Kohler Department of Licensing
John Wiesman Department of Health
Judge James P. Swanger Clark County District Court
Randy Dorn Superintendent of Public Instruction
Kevin Quigley Department of Social and Health Services
Sharon Dillon Washington State Association of Counties
Jon Snyder Association of Washington Cities
Governor Jay Inslee Commission Chair
Lynn Peterson Department of Transportation

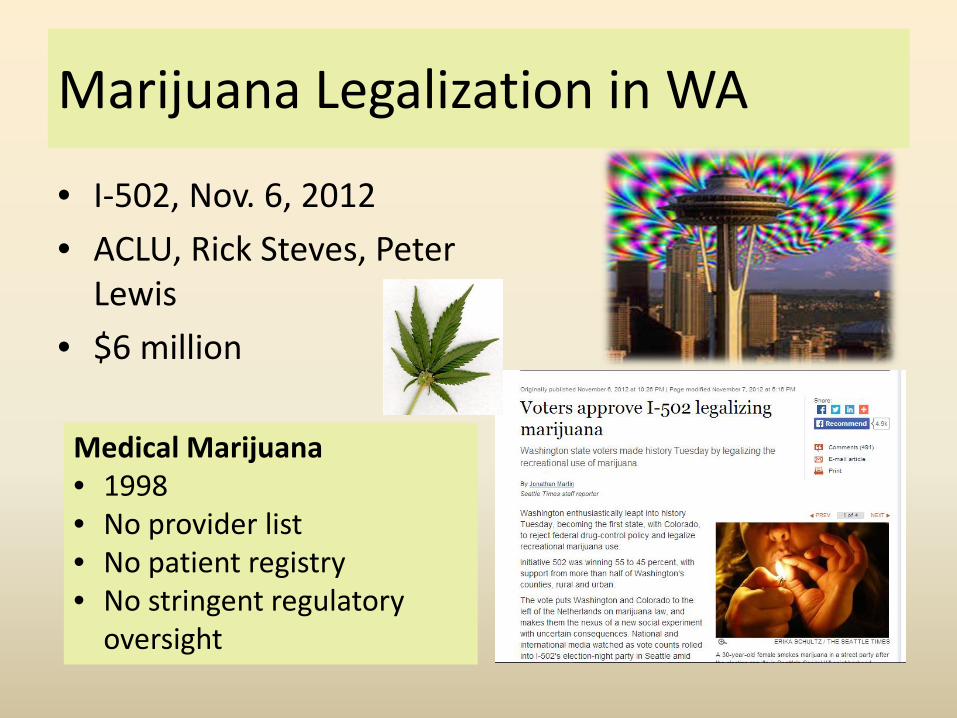
Marijuana Legalization in WA
• I-502, Nov. 6, 2012 • ACLU, Rick Steves, Peter
Lewis • $6 million
Medical Marijuana • 1998 • No provider list • No patient registry • No stringent regulatory
oversight
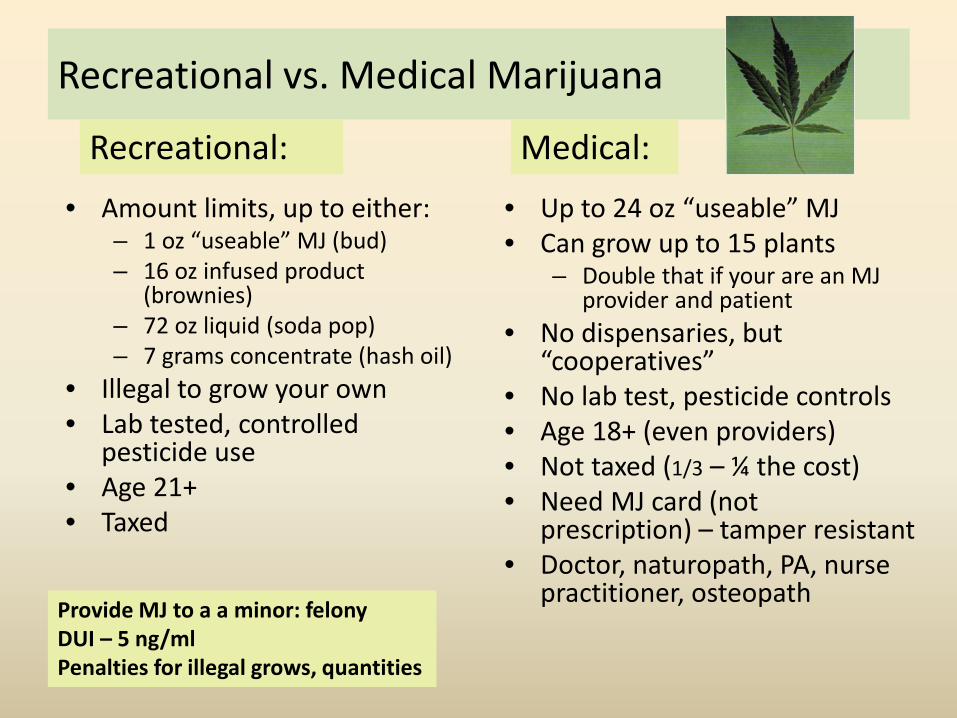
Recreational vs. Medical Marijuana
• Amount limits, up to either: – 1 oz “useable” MJ (bud) – 16 oz infused product
(brownies) – 72 oz liquid (soda pop) – 7 grams concentrate (hash oil)
• Illegal to grow your own • Lab tested, controlled
pesticide use • Age 21+ • Taxed
• Up to 24 oz “useable” MJ • Can grow up to 15 plants
– Double that if your are an MJ provider and patient
• No dispensaries, but “cooperatives”
• No lab test, pesticide controls • Age 18+ (even providers) • Not taxed (1/3 – ¼ the cost) • Need MJ card (not
prescription) – tamper resistant • Doctor, naturopath, PA, nurse
practitioner, osteopath
Recreational: Medical:
Provide MJ to a a minor: felony DUI – 5 ng/ml Penalties for illegal grows, quantities

Medical Marijuana – The path To Legalization
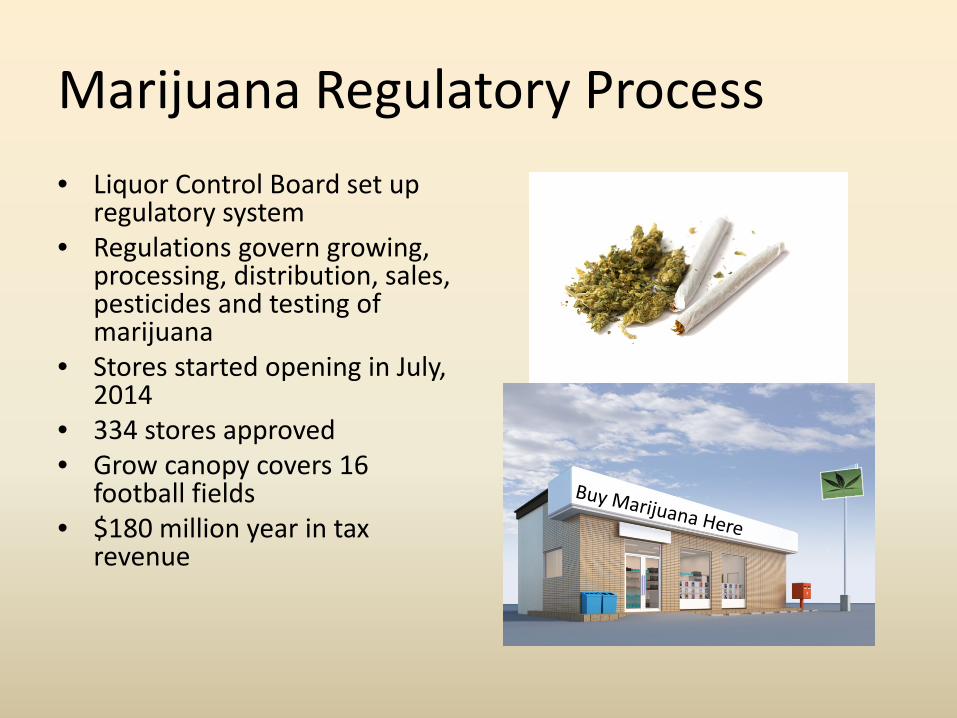
Marijuana Regulatory Process • Liquor Control Board set up
regulatory system • Regulations govern growing,
processing, distribution, sales, pesticides and testing of marijuana
• Stores started opening in July, 2014
• 334 stores approved • Grow canopy covers 16
football fields • $180 million year in tax
revenue
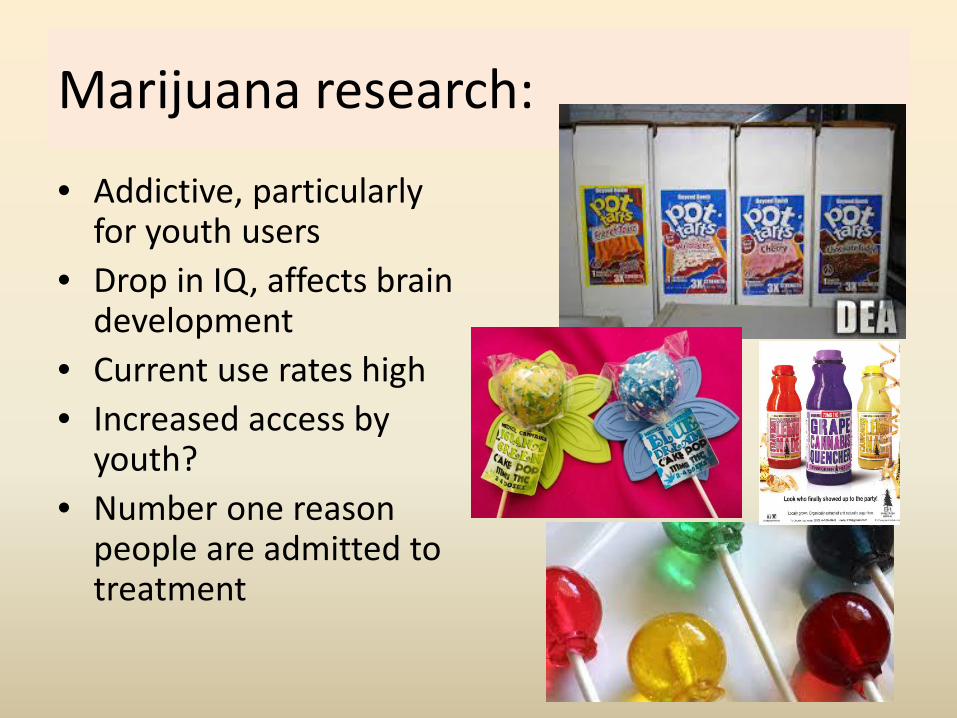
Marijuana research:
• Addictive, particularly for youth users
• Drop in IQ, affects brain development
• Current use rates high • Increased access by
youth? • Number one reason
people are admitted to treatment

Marijuana degrades driving ability
• Spatial perceptions • Concentration • Reaction times • Sleepy • Memory • Appetite • Body temperature
Doubles Crash Risk The most frequently detected drug in fatal crashes
270
257
295
255 254
285
301
272
255 265
240
199 201 195 190
215
180 174
203 194
184
166
189
152 135
126 128 125
148
119
147 146 156
165
153 152
154
110
131
50
100
150
200
250
300
350
2000 2002 2004 2006 2008 2010 2012
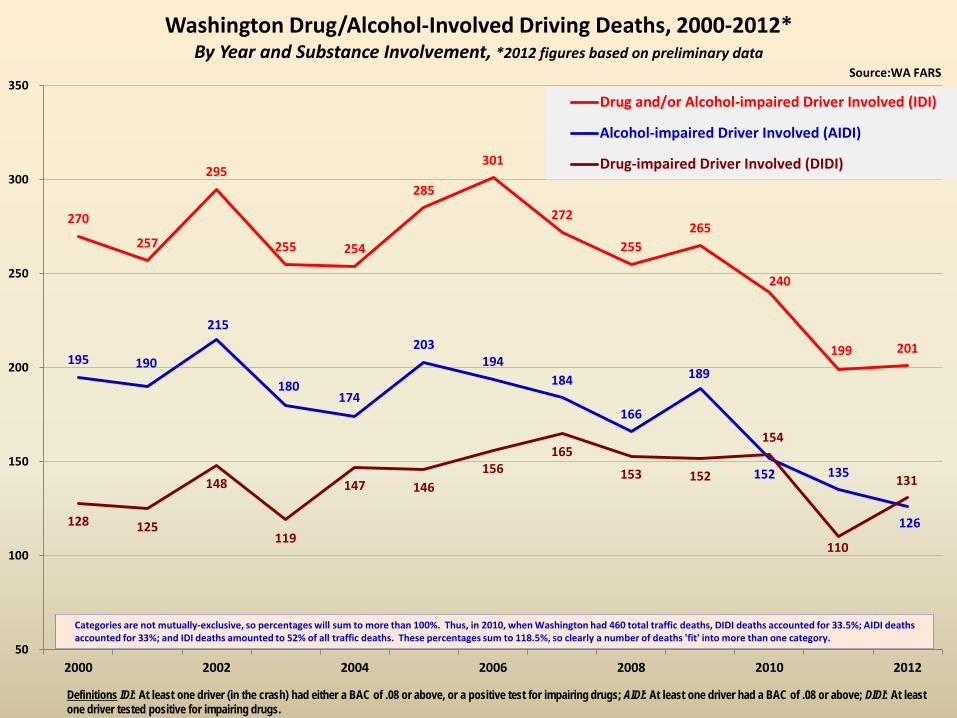
Washington Drug/Alcohol-Involved Driving Deaths, 2000-2012* By Year and Substance Involvement, *2012 figures based on preliminary data
Drug and/or Alcohol-impaired Driver Involved (IDI)
Alcohol-impaired Driver Involved (AIDI)
Drug-impaired Driver Involved (DIDI)
Categories are not mutually-exclusive, so percentages will sum to more than 100%. Thus, in 2010, when Washington had 460 total traffic deaths, DIDI deaths accounted for 33.5%; AIDI deaths accounted for 33%; and IDI deaths amounted to 52% of all traffic deaths. These percentages sum to 118.5%, so clearly a number of deaths 'fit' into more than one category.
Definitions IDI: At least one driver (in the crash) had either a BAC of .08 or above, or a positive test for impairing drugs; AIDI: At least one driver had a BAC of .08 or above; DIDI: At least one driver tested positive for impairing drugs.
Source:WA FARS
9% 10%
10%
15%
13%
12%
13% 14%
16% 16%
12%
15%
2%
3% 4%
2% 3%
4%
5%
6%
13%
8%
6%
8%
2% 2% 2% 2%
3%
4% 5%
6%
5% 5%
3% 3%
6%
8%
6%
9%
10%
9% 10%
8%
5%
7%
4%
6%
0%
5%
10%
15%
20%
2001 2002 2003 2004 2005 2006 2007 2008 2009 2010 2011 2012
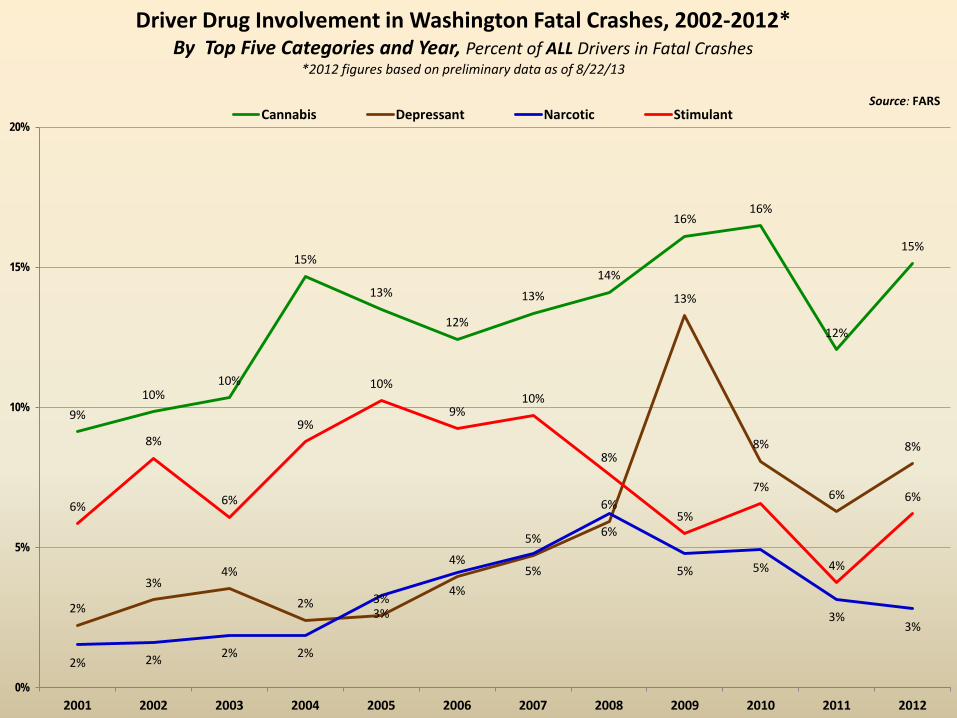
Driver Drug Involvement in Washington Fatal Crashes, 2002-2012* By Top Five Categories and Year, Percent of ALL Drivers in Fatal Crashes
*2012 figures based on preliminary data as of 8/22/13
Cannabis Depressant Narcotic StimulantSource: FARS
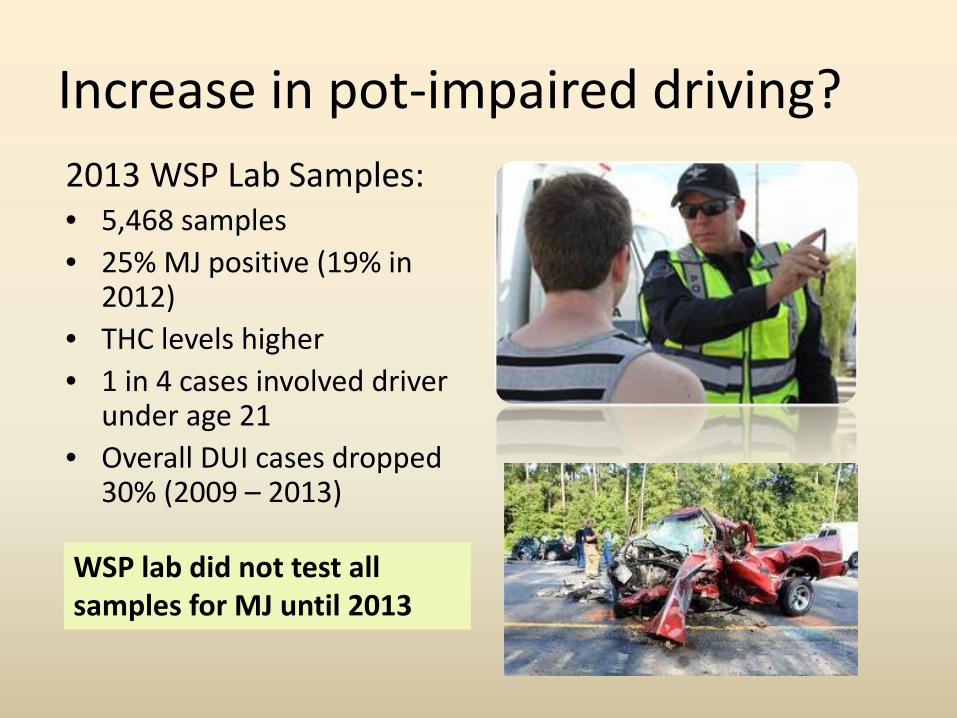
Increase in pot-impaired driving? 2013 WSP Lab Samples: • 5,468 samples • 25% MJ positive (19% in
2012) • THC levels higher • 1 in 4 cases involved driver
under age 21 • Overall DUI cases dropped
30% (2009 – 2013)
WSP lab did not test all samples for MJ until 2013
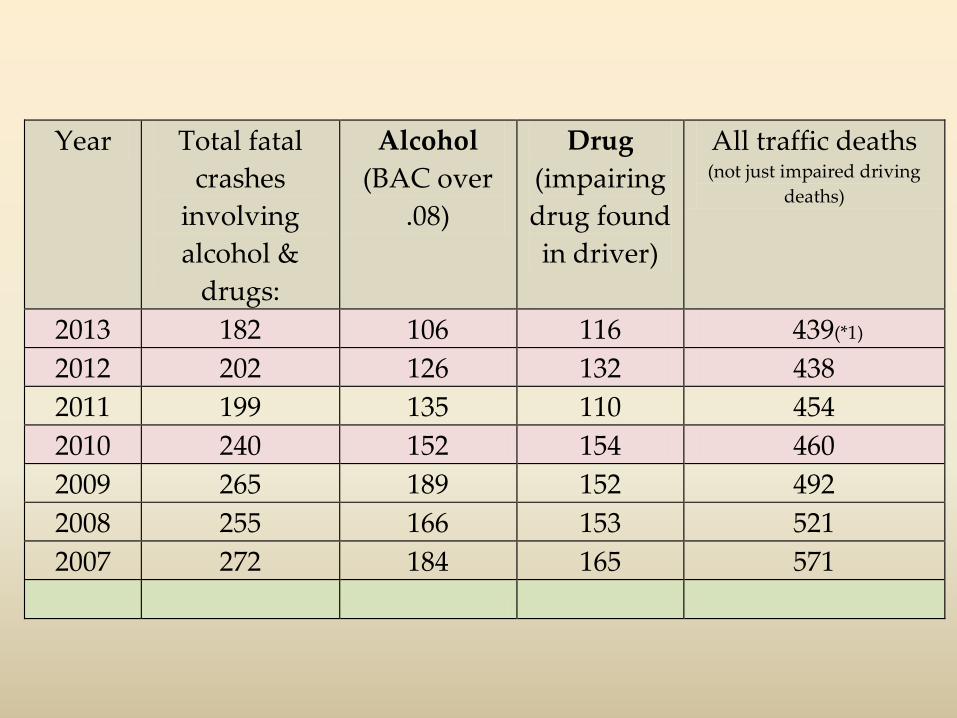
Year Total fatal crashes
involving alcohol &
drugs:
Alcohol (BAC over
.08)
Drug (impairing drug found in driver)
All traffic deaths (not just impaired driving
deaths)
2013 182 106 116 439(*1) 2012 202 126 132 438 2011 199 135 110 454 2010 240 152 154 460 2009 265 189 152 492 2008 255 166 153 521 2007 272 184 165 571
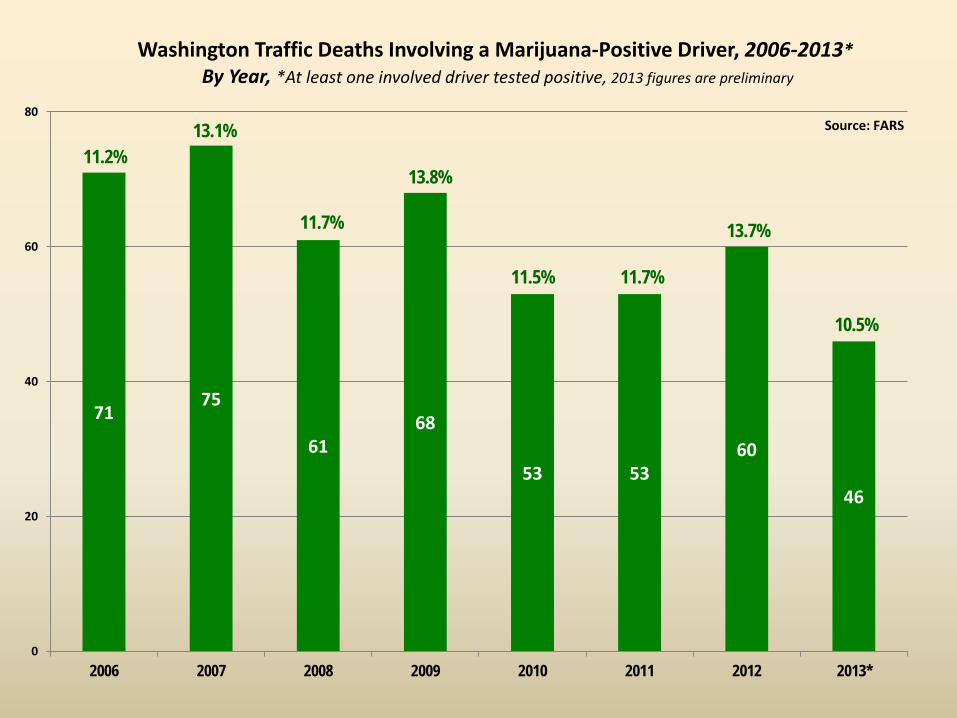
71 75
61 68
53 53 60
46
0
20
40
60
80
2006 2007 2008 2009 2010 2011 2012 2013*
Washington Traffic Deaths Involving a Marijuana-Positive Driver, 2006-2013* By Year, *At least one involved driver tested positive, 2013 figures are preliminary
Source: FARS
11.2% 13.1%
11.7%
13.8%
11.5% 11.7%
13.7%
10.5%

PIRE Pacific Institute for Research & Evaluation
• Data collection June, 2014 and January, 2015 • Statewide sample • Alcohol and drugs (75 types, with levels)
PIRE Research

PIRE 2007 Survey -- Drugs
Daytime Nighttime
No drugs 89% 85.6%
Drugs illegal and OTC
11% 16.3%
The most commonly detected drugs:
Marijuana 8.6% Cocaine 3.9%
Meth 1.3%
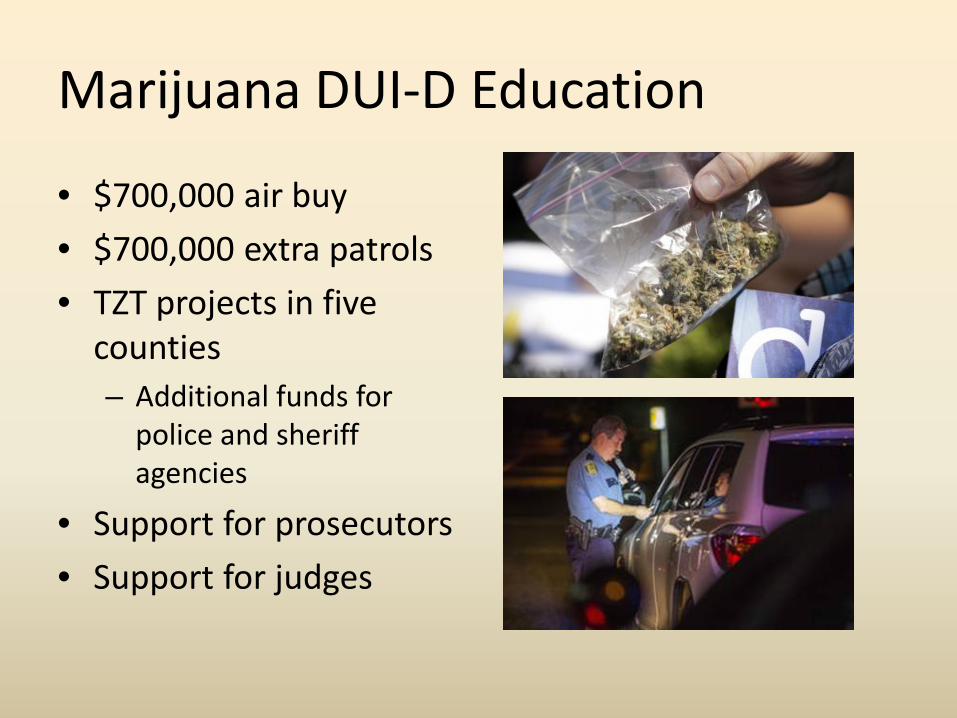
Marijuana DUI-D Education
• $700,000 air buy • $700,000 extra patrols • TZT projects in five
counties – Additional funds for
police and sheriff agencies
• Support for prosecutors • Support for judges
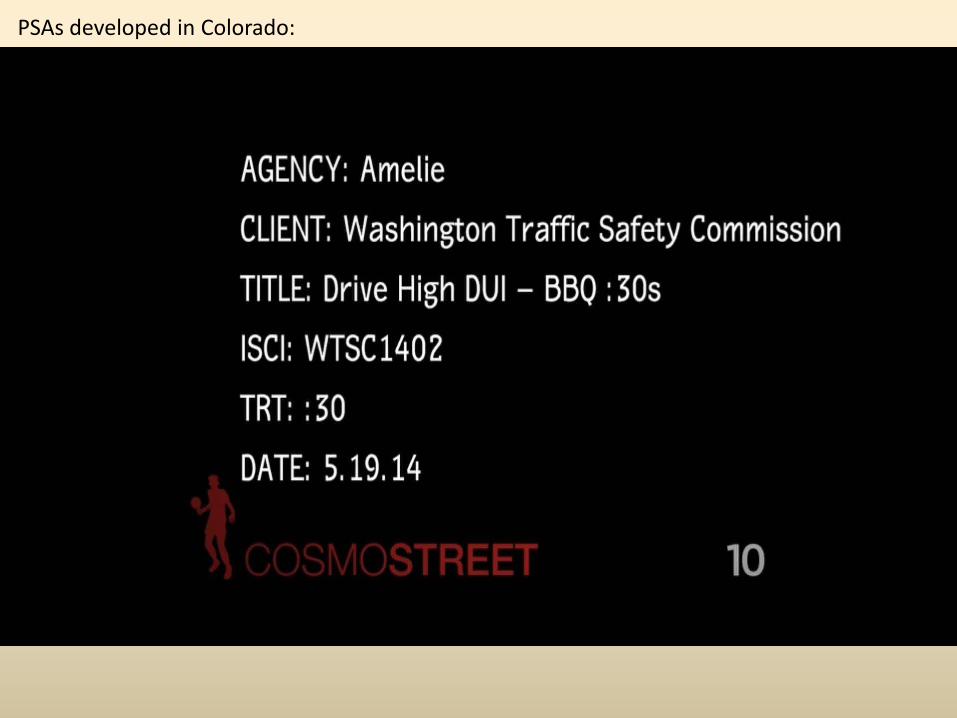
PSAs developed in Colorado:

Target Zero: Our Plan For The Future:
