marena manley - the national laboratory associationnla.org.za/webfiles/conferences/2015/t+m 2015...
TRANSCRIPT

Test & Measurement 2015 Conference & Workshop
Quality of Life: What is the measure of it?
13 October 2015
Marena Manley Stellenbosch University
Faculty of AgriSciences
Department of Food Science
Stellenbosch
1

‘then…’ • NIR region discovered in
1800
• revived and developed in the early 1950s by Karl Norris
• put into practice in the 1970s by Phil Williams
• first used in the cereal industry
94 years 82 years 2

‘now…’ • still prominent in grain, flour
milling and feed industries
• quality/process control method of choice for many more applications
• availability of on-line,handheld instruments
• PAT in pharmaceutical industry
3

Wavelength (nm)
Absorb
ance
Typical NIR spectra Wheat flour Whole wheat grain
4

5

Rooibos
Ground black pepper
Olive oil
NIR band assignments
NIR spectra contain information about the major X-H chemical bonds, i.e. C-H (oil, fat), O-H (moisture) and N-H (protein)
NIR region: 800 to 2500 nm MIR region: 2500 to 15 000 nm (4000 to 400 cm-1)
6

• Conventional methods extract
compound of interest for
measurement
NIR vs Conventional measurements
-10 0 10 20 30 40 50 60
Added buckwheat (%)
-10
0
10
20
30
40
50
60
Pre
dic
ted
bu
ckw
heat
(%)
Calibration
Cross-validation
• NIR spectroscopy measures entire sample
• Provides physical and chemical information
• Also enables measurements such as particle size, compaction
7

Calibration development
X (spectra)
Y (reference data) Model
+ =
-10 0 10 20 30 40 50 60
Added buckwheat (%)
-10
0
10
20
30
40
50
60
Pre
dic
ted
bu
ckw
heat
(%)
Calibration
Cross-validation
Manley M (2014) Near-infrared spectroscopy and hyperspectral imaging: non-destructive
analysis of biological materials. Chemical Society Reviews, 43, 8200-8214
• NIR spectrophotometers require calibration
• Calibration ‘curve’ (equation) to be determined using real samples with known chemical information for each compound to be measured
• All samples to be analysed with a reference method of known accuracy/reliability
8

Calibration development
X (spectra)
Y (reference data) Model
+ =
-10 0 10 20 30 40 50 60
Added buckwheat (%)
-10
0
10
20
30
40
50
60
Pre
dic
ted
bu
ckw
heat
(%)
Calibration
Cross-validation
Manley M (2014) Near-infrared spectroscopy and hyperspectral imaging: non-destructive
analysis of biological materials. Chemical Society Reviews, 43, 8200-8214
• Chemometrics remains vital; small portion of relevant information needs to be found
• Require proper optical measurements from representative samples
9

Instrument
• Reflectance vs. transmission
• Monochromator vs. Fourier transform vs. Diode array
• Desktop vs. On-line vs. Handheld vs. Miniature
• Wavelength range
• Wavelength interval
• Sample presentation
• Repeats
• Repacks
10
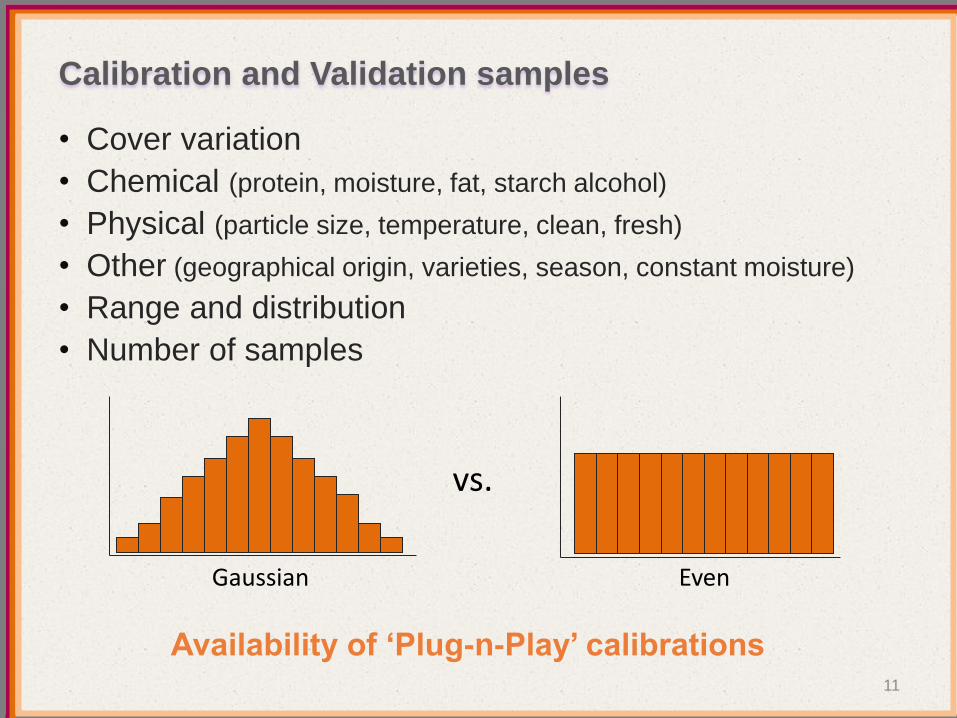
Calibration and Validation samples
• Cover variation
• Chemical (protein, moisture, fat, starch alcohol)
• Physical (particle size, temperature, clean, fresh)
• Other (geographical origin, varieties, season, constant moisture)
• Range and distribution
• Number of samples
Availability of ‘Plug-n-Play’ calibrations
vs.
Gaussian Even
11

Laboratory
• Official reference method
• Cost of analysis
• Duplicate analysis
• Which samples to analyse
• When to analyse (NIR vs. reference)
• Standard error of laboratory (SEL)
• Precision
• NIR error vs. laboratory error
12

… is establishing a regression model from known X and Y data
Calibration
X Y Model +
“Inexpensive data” “Expensive data”
13

Reference values
… information obtained on your samples, objects, observations
Y
Reference values
Analytical measurements
14

Prediction
… using the multivariate regression model to predict Y-values
X Ŷ Model +
“Inexpensive data”
15

NIR calibration and prediction procedures
• Sound understanding of the physicochemical basis of the
measurements; instrumental and chemometric principles
• Ensure modeling of compound of interest
• Possible to correlate spectral data to light scattering effects or
that of the entire sample matrix
• Data preprocessing could and should be applied to remove
scattering effects (MSC, SNV, derivatives)
• Should be demonstrated that correlations (PCR, PLS) are
based on changes in compound, e.g. external validation
16

NIR calibration and prediction procedures
• Reliable calibration model should be able to predict
unambiguously the chemical component from spectral data
of unknown sample
• Reliable predictions should be possible in the presence of all
other components present in the sample.
• Samples including variation outside the scope of model
should be identified
• Validation and statistical data to demonstrate accuracy and
robustness vital
• Robust calibration give reliable results in spite of changes in
variation
17

Pierre Dardenne NIR News, 21(1), 8-9, 14 (2010)
How to report NIR results (statistics)
18
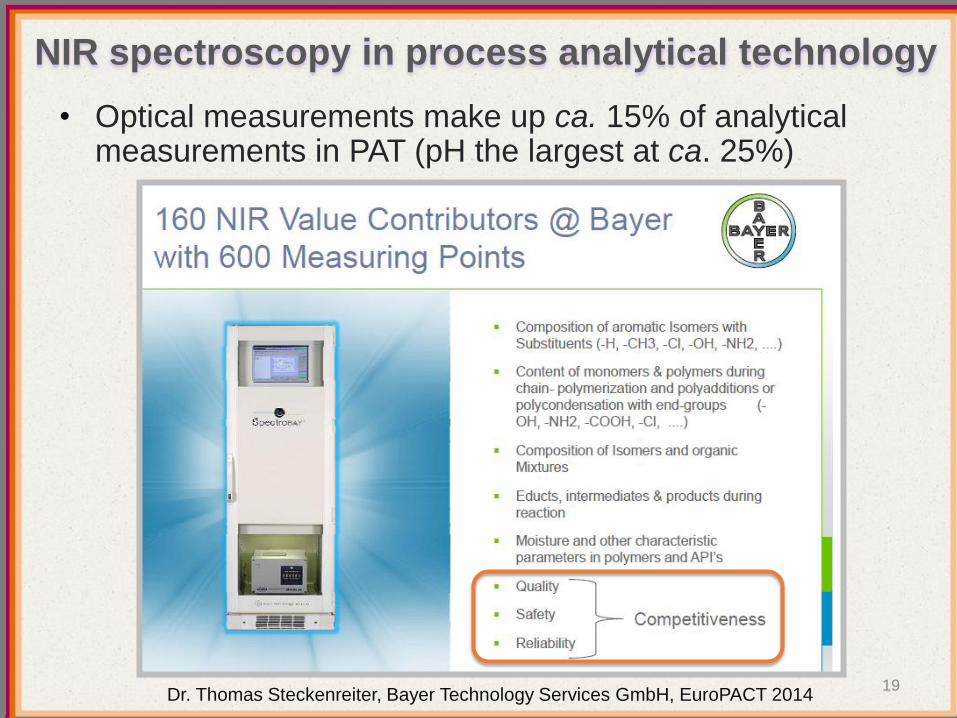
NIR spectroscopy in process analytical technology
• Optical measurements make up ca. 15% of analytical measurements in PAT (pH the largest at ca. 25%)
Dr. Thomas Steckenreiter, Bayer Technology Services GmbH, EuroPACT 2014 19

NIR calibration and prediction procedures
Guideline on the Use of NIR Spectroscopy
by the
Pharmaceutical Industry
and the
Data Requirements for New Submissions and Variations
EMEA/CHMP/CVMP/QWP/17760/ 2009 Rev 2.
European Medicines Agency, 2014.
20

NIR calibration and prediction procedures
• Success and robustness of the model depends on its
reliability over time
• After a certain period of time the results will start to
show a bias from the true values
Biased Noisy
Predicted response
Measured response 21

Reasons for models to become invalid
• samples change to a range outside original calibration
e.g. unusual combination of analytes
• new variation introduced into the samples
e.g. change in temperature
• change in sample matrix (causes relationship between analyte and measurement to change)
e.g. change in particle size
• change in hardware (causes relationship between analyte and measurement to change)
e.g. source replacement
• once problem has been found, using appropriate diagnostics: expand calibration, slope and bias correction, instrument standardisation, remodeling, revalidating
(Barry Wise, EuroPACT 2014)
22

Challenges for NIR applications
Apart from well known benefits of NIR spectroscopy:
• Biological samples are chemically (100’s compounds) and
optically (scattering) complex
• Two samples of the same commodity are always different
• Biological samples are unstable over time and affected by
variety, origin, year, location
• Calibrations will always be sensitive to these factors
• For biological material:
• ‘’It is a fallacy to believe that NIRS can replace the laboratory.
• It is better to see NIRS as a means to reproduce a model along time
or space … untill this model has to be rebuilt’’
(Jean-Michel Roger, EuroPACT 2014) 23

NIR model maintenance Continuous improvement
Maintenance
(Re-)
Development
Data collection
Calibration
Validation
• Criteria for re-validation
• Ongoing performance monitoring
• Budget for model maintenance
• Model maintenance roadmap
• Reference method
• Calibration/validation sets
• Selection/preparation of samples
• Scope of NIR calibration
• Description of method
• Elements affecting spectra
• Instrument performance verification
• Pretreatment of data
• Description of model
• Model optimisation
• Model assessment
• Key statistical functions
• Specificity
• Range
• Accuracy
• Repeatibility
• Robustness
NIR spectroscopy
Life cycle management
24

(Barry Wise, 2014)

NIR for authentication/adulteration (food fraud)
• Meat authentication; milk powder adulteration (melamine)
• Due to cost or not being published because of commercial confidentiality
• Value as screening method; even if official methods needed
• Karoo lamb geographical origin
LWT - Food Science and Technology 53 (2013) 225-232 26

NIR for authentication/adulteration
• Melamine, adulterant to increase N content and overestimate protein content of the food
• Detection limits below 1 ppm (Lu et al. (2009) JNIRS, 17, 59-67; Balabin & Smirnov (2011) Talanta 85, 562–568)
• Later, levels of 0.02% to 1%; <200 ppm if surface area is increased (Fu et al. (2014) Journal of Food Engineering, 124, 97–104)
27

“Since 2003, China developed drug quality test vehicles. China
equipped more than 300 vehicles in which FTNIR instruments
were installed.” (Yuan Hongfu, EuroPACT 2014)

Miniaturisation of NIR instruments “In PAT miniaturisation is the basis for cost
reduction and acceleration of measurements” (T. Steckenreiter, 2014)
29

NIR spectroscopy in PAT – multimodal spectroscopy
(J. Chemometrics 2013; 27: 369–378)

NIR hyperspectral imaging
Pushbroom or linescan configuration
(Burger, 2006)
SisuCHEMA
31

NIR hyperspectral imaging cameras
Reflection intensity
618 (y)
320 (x)
239 (λ)
(3D
-hyp
erc
ube
)
Pushbroom or linescan configuration 32

618 (y)
320 (x)
239 (λ)
NIR hyperspectral imaging
+
hypercube
Greyscale digital
imaging
NIR spectroscopy
33

618 (y)
320 (x)
239 (λ)
NIR spectrum of pixel at (xi,yi)
Wavelength (nm)
Ab
so
rban
ce
NIR hyperspectral imaging

618 (y)
320 (x)
239 (λ)
Image plane at λi
(xi,yi)
NIR hyperspectral imaging
35

Futuristic technologies that will change the way we live
7. SciO

Miniature instrument for consumers “Users tap the device on the organic matter they want to read, it uploads that
reading to Consumer Physics' database on the cloud where an algorithm works
out the quantities and sends the analysis back to a smartphone.”
“… has shrunk down a lab (NIR)
spectrometer -- using low cost optics
technology and advanced signal
processing algorithms”
sensor Scio
tells you the
chemical
makeup of
foods”

Miniaturisation of NIR instruments
“Right now there is no published cost, but as an example those who
achieved Super Earlybird status by pledging $149 will get a Scio device
and access to any supporting apps released in the next two years. “
https://www.kickstarter.com/projects/903107259/scio-your-sixth-sense-a-pocket-molecular-sensor-fo
http://time.com/#87205/scio-scanner/
“Consumer Physics launched a Kickstarter campaign to raise $200,000 for Scio
(which is Latin for “to know”) on April 28th, 2014.
They reached that goal in 20 h and raised a total of $400,000 in 48 h.”
12,958 backers pledged $2,762,571 to help bring this project to life.
Shipping started June 2015

Miniaturisation of NIR instruments

Miniaturisation of NIR instruments
(http://www.cnet.com/news/kickstarter-science-beware-the-marketing-hype/)
“I don't think this is a hoax, but it's not a scientific breakthrough either.
If SCiO works as claimed, it will be a very big deal indeed”
Dr Oliver Jones, School of Applied Sciences, Analytical Chemistry, RMIT University, Australia

‘next...’ • Has NIR spectroscopy reached its full potential?
• Do we just see more of the same?
• Are there any novel developments in NIR spectroscopy?
• Increasing emphasis on ensuring reliable measurements.
41

Conclusion
1. Good quality NIR spectra
2. Official / standard accurate reference methods
3. Chemometrics to extract small (relevant) portion of info
4. Model maintenance
5. Stable (miniature) NIR instruments
6. NIR spectrosopy does not stand alone anymore
7. Multimodel spectroscopy
8. NIR hyperspectral imaging (spatial dimension)

South African-Swedish Bilateral Agreement
(exchange of researchers)
Running costs and samples
Acknowledgements
Funding
UID: 76641 and 83974
Collaborators
Postgraduate students