march 2019 bank watch - mercercapital.com · econd uarter 18 march 2019 bank watch articles scale...
TRANSCRIPT

www.mercercapital.com
Second Quarter 2018
MARCH 2019
Bank WatchARTICLES Scale for Another ReasonFairness Considerations for Mergers of Equals
In This Issue
Scale for Another Reason 1
Fairness Considerations for
Mergers of Equals 3
Public Market Indicators 6
M&A Market Indicators 7
Regional Public
Bank Peer Reports 8
About Mercer Capital 9

© 2019 Mercer Capital // www.mercercapital.com 1
Mercer Capital’s Bank Watch March 2019
Scale for Another Reason I count myself among the consensus view that the merger of equals (MOE)
between Chemical Financial Corp. and TCF Financial Corp. makes a lot of sense
for both companies. It makes so much sense that the industry should see hundreds
of MOEs and quasi-MOEs among banks in the coming years because scale — or
operating leverage — is important to drive returns. The explicit assumption is that
MOE transactions are good for both companies’ shareholders, though not always in
proportion to the relative ownership.
The market seems to think MOEs make sense, too. Shares of both Chemical and
TCF rose more than 5% on the day of the announcement, which contrasts with
announcements during the past year by Synovus Financial Corp., WSFS Financial
Corp., Fifth Third Bancorp and Ameris Bancorp in which the buyer’s share prices
were hammered on the news of a major acquisition. The market thought these
companies overpaid, and in some instances, potentially incurred credit issues with the
target’s loan portfolio.
Setting aside the issue of a premium to the current market price, an MOE is like an
acquisition in that the bulk of the EPS accretion comes from expense savings. In the
case of the Chemical-TCF deal, projected expense savings approximate 13% of the
combined companies’ expense base, which does not seem like a heroic amount.
The result is projected EPS accretion of 17% for Chemical and 31% for TCF once
the expense saves are fully realized. Earnback of dilution to tangible book value
per share is projected to be less than three years. The return on average tangible
common equity is projected to be 19% in 2020 on a pro forma basis, assuming a full
phase-in of the cost savings.
What’s not to like with the projected numbers? Nothing, as long as they are realized,
which as an aside raises the issue that the projected EPS accretion for 2020 is based
upon the analysts’ consensus estimates rather than management forecasts.
Whether the 2020 consensus estimates are in the ballpark or not, TCF, Chemical and
the industry have to obtain greater scale to drive costs lower. In the short run, scale
will drive ROE higher. Over the long run I suspect improved scale may be required
to protect existing returns rather than enhance them because the Amazon effect will
apply to deposit pricing, too. Informed depositors with mobile technology will force
deposit pricing to become more competitive.
That’s what has happened to the asset management business. Widely available
information for increasingly cost conscious investors, easy-to-use technology and a
push to lower fees by behemoth Vanguard has upended the industry’s pricing model.
There is no reason that cannot happen to banks, too, in which the spread between
rates paid for core deposits and what the funds would cost if obtained in the capital
markets cannot narrow dramatically.
Jeff K. Davis, CFA, Managing Director of Mercer Capital’s Financial Institutions Group, is a regular editorial contributor to SNL Financial, a subsidiary of S&P Global Market Intelligence.
This contribution was originally published February 6, 2019, at SNL Financial. The views and opinions expressed in this piece are those of the author and do not necessarily represent the
views of S&P Global Market Intelligence. It is reprinted here with permission.

© 2019 Mercer Capital // www.mercercapital.com 2
Mercer Capital’s Bank Watch March 2019
Wall Street Journal reporter Jason Zweig recently ran a column about how a small
subset of banks — mostly online ones — were offering rates in the range of 2% to
2.5%, which is close to the rate you can get from short-term U.S. Treasuries. Both
are risk-free returns. He speculated — and I think most of you reading this would
agree — that inertia and until recently a very low opportunity cost of doing nothing
has led to a lot of lazy money sitting in banks and brokerage accounts that still earns
very little.
Zweig touched on a secular change that is afoot rather than the cyclical nature of
deposit pricing that ebbs and flows with loan demand: Depositors who are empowered
with information and mobile technology are in a position to sweep excess deposits
from their primary bank to institutions that pay much more competitive rates. In effect
everyone can be a corporate treasurer.
The secular issue I see will intensify with time as deposits and other financial assets
transition from baby boomers and their parents to tech-savvy millennials and Gen Z.
Banks are going to be forced by technology to pay rates on core deposits that are
closer to the capital market rate for an equivalent maturity. Scale to improve operating
leverage is the only offset I see.
MOEs are a logical, often-overlooked and sometimes disdained transaction that
can achieve scale for both companies’ shareholders. However, like all transactions,
execution is what really matters, because creating scale and accretion with
spreadsheets is easy.
Jeff K. Davis, CFA
615.345.0350 | [email protected]
What We’re Reading
Tupelo, MS-based BancorpSouth Bank’s M&A strategy of acquiring smaller
banks receives positive reviews from analysts.
(subscription required)
A new court decision could have important ramifications for bank M&A. The
December 2018 ruling in Akorn v. Fresenius Kabi is the first in Delaware to rule
that a material adverse effect (“MAE”) had occurred in a merger transaction.
The National Bank of Delaware County’s acquisition of a Bank of America
branch in upstate New York highlights the potential challenge for small-town
banks of keeping customers who prefer large lenders and online transactions.

© 2019 Mercer Capital // www.mercercapital.com 3
Mercer Capital’s Bank Watch March 2019
Fairness Considerations for Mergers of Equals When asked about his view of a tie years before the NCAA instituted the playoff format
in the 1990s, Coach Bear Bryant famously described the outcome as “kissing your
sister.” If he were a portfolio manager holding a position in a company that entered
into a merger of equals (MOE), his response might be the same. Wall Street generally
does not like MOEs unless the benefits are utterly obvious and/ or one or both parties
had no other path to create shareholder value. In some instances, MOEs may be
an intermediate step to a larger transaction that unlocks value. National Commerce
Financial Corporation CEO Tom Garrott once told me that part of his rationale for
entering into a $1.6 billion MOE with CCB Financial Corp. in 2000 that resulted in
CCB owning 47% of the company was because bankers told him he needed a bigger
retail footprint to elicit top dollar in a sale. It worked. National Commerce agreed to
be acquired by SunTrust Banks, Inc. in 2004 in a deal that was valued at $7 billion.
Kissing Your Sister?
MOEs, like acquisitions, typically look good in a PowerPoint presentation, but can be
tough to execute. Busts from the past include Daimler-Benz/Chrysler Corporation and
AOL/Time Warner. Among banks, the 1994 combination of Cleveland-based Society
Corporation and Albany-based KeyCorp was considered to be a struggle for several
years, while the 1995 combination of North Carolina-based Southern National Corp.
and BB&T Financial Corporation was deemed a success.
The arbiter between success and failure for MOEs typically is culture, unless the
combination was just a triumph of investment banking and hubris, as was the case
with AOL/Time Warner. The post-merger KeyCorp struggled because Society was
a centralized, commercial-lending powerhouse compared to the decentralized,
retail-focused KeyCorp. Elements of both executive management teams stuck
around. Southern National, which took the BB&T name, paid the then legacy BB&T
management to go away. At the time there was outrage expressed among investors
at the amount, but CEO John Allison noted it was necessary to ensure success
with one management team in charge. Likewise, National Commerce’s Garrott as
Executive Chairman retained the exclusive option to oust CCB’s Ernie Roessler, who
became CEO of the combined company, at the cost of $10 million if he chose to do
so. Garrett exercised the option and cut the check in mid-2003 three years after the
MOE was consummated.
Fairness Opinions for MOEs
MOEs represent a different proposition for the financial advisor in terms of rendering
advice to the Board. An MOE is not the same transaction as advising a would-be
seller about how a take-out price will compare to other transactions or the company’s
potential value based upon management’s projections. The same applies to advising
a buyer regarding the pricing of a target. In an MOE (or quasi-MOE) both parties give
up 40-50% ownership for future benefits with typically little premium if one or both are
publicly traded. Plus there are the social issues to navigate.

© 2019 Mercer Capital // www.mercercapital.com 4
Mercer Capital’s Bank Watch March 2019
Investment Merits to Consider
A key question to ask as part of the fairness analysis: are shareholders better off or
at least no worse for exchanging their shares for shares in the new company and
accepting the execution risks? In order to answer the question, the investment merits
of the pro forma company have to be weighed relative to each partner’s attributes.
» Profitability and Revenue Trends. The analysis should consider each
party’s historical and projected revenues, margins, operating earnings,
dividends and other financial metrics. Issues to be vetted include customer
concentrations, the source of growth, the source of any margin pressure
and the like. The quality of earnings and a comparison of core vs. reported
earnings over a multi-year period should be evaluated.
» Expense Savings. How much and when are the savings expected to be
realized? Do the savings come disproportionately from one party? Are the
execution risks high? How does the present value of the after-tax expense
savings compare to the pre-merger value of the two companies on a
combined basis?
» Pro Forma Projected Performance. How do the pro forma projections
compare with each party’s stand-alone projections? Does one party
sacrifice growth or margins by partnering with a slower growing and/or lower
margin company?
» Per Share Accretion. Both parties of an MOE face ownership dilution. What
is obtained in return in terms of accretion (or dilution) in EBITDA per share
(for non-banks), tangible BVPS, EPS, dividends and the like?
While much of an advisor’s role will be focused on providing analysis and advice to
the Board leading up to a meaningful corporate decision, the fairness opinion issued
by the advisor (and/or second advisor) has a narrow scope. Among other things a
fairness opinion does not opine:
» The course of action the Board should take;
» The contemplated transaction represents the highest obtainable value;
» Where a security will trade in the future; and
» How shareholders should vote.
What is opined is the fairness of the transaction from a financial point of view of the
company’s shareholders as of a specific date and subject to certain assumptions. If the
opinion is a sell-side opinion, the advisor will opine as to the fairness of the consideration
received. The buy-side opinion will opine as to the fairness of the consideration paid.
A fairness opinion for each respective party to an MOE will opine as to the fairness of
the exchange ratio because MOEs largely entail stock-for-stock structures.
Fairness is not defined legally. The Merriam-Webster dictionary defines “fair” as “just,
equitable and agreeing with what is thought to be right or acceptable.” Fairness when
judging a corporate transaction is a range concept. Some transactions are not fair,
some are in the range—reasonable, and others are very fair.
The concept of “fairness” is especially well-suited for MOEs. MOEs represent a
combination of two companies in which both shareholders will benefit from expense
savings, revenue synergies and sometimes qualitative attributes. Value is an element
of the fairness analysis, but the relative analysis takes on more importance based
upon a comparison of contributions of revenues, earnings, capital and the like
compared to pro forma ownership.

© 2019 Mercer Capital // www.mercercapital.com 5
Mercer Capital’s Bank Watch March 2019
» Distribution Capacity. One of the benefits of a more profitable company
should be (all else equal) the capacity to return a greater percentage of
earnings (or cash flow) to shareholders in the form of dividends and buybacks.
» Capital Structure. Does the pro forma company operate with an appropriate
capital structure given industry norms, cyclicality of the business and
investment needs to sustain operations? Is there an issue if one party to an
MOE is less levered and the other is highly levered?
» Balance Sheet Flexibility. Related to the capital structure should be a
detailed review of the pro forma company’s balance sheet that examines
such areas as liquidity, funding sources, and the carrying value of assets
such as deferred tax assets.
» Consensus Analyst Estimates. This can be a big consideration in terms of
Street reaction to an MOE for public companies. If pro forma EPS estimates
for both parties comfortably exceed Street estimates, then the chances
for a favorable reaction to an MOE announcement improve. If accretion
is deemed to be marginal for the risk assumed or the projections are not
viewed as credible, then reaction may be negative.
» Valuation. The valuation of the combined company based upon pro forma
per share metrics should be compared with each company’s current and
historical valuations and a relevant peer group. Also, while no opinion is
expressed about where the pro forma company’s shares will trade in the
future, the historical valuation metrics provide a context to analyze a range
of shareholder returns if earning targets are met under various valuation
scenarios. This is particularly useful when comparing the analysis with each
company on a stand-alone basis.
» Share Performance. Both parties should understand the source of their
shares and the other party’s share performance over multiyear holding
periods. For example, if the shares have significantly outperformed an index
over a given holding period, is it because earnings growth accelerated? Or, is
it because the shares were depressed at the beginning of the measurement
period? Likewise, underperformance may signal disappointing earnings, or
it may reflect a starting point valuation that was unusually high.
» Liquidity of the Shares. How much is liquidity expected to improve because
of the MOE? What is the capacity to sell shares issued in the merger? SEC
registration and even NASDAQ and NYSE listings do not guarantee that
large blocks can be liquidated efficiently.
» Strategic Position. Does the pro forma company have greater strategic value
as an acquisition candidate (or an acquirer) than the merger partners individually?
Conclusion
The list does not encompass every question that should be asked as part of the
fairness analysis for an MOE, but it points to the importance of vetting the combined
company’s investment attributes as part of addressing what shareholders stand
to gain relative to what is relinquished. We at Mercer Capital have over 30 years
of experience helping companies and financial institutions assess significant
transactions, including MOEs. Do not hesitate to contact us to discuss a transaction
or valuation issue in confidence.
Jeff K. Davis, CFA
615.345.0350 | [email protected]

© 2019 Mercer Capital // Data provided by S&P Global Market Intelligence 6
Mercer Capital’s Bank Group Index Overview Return Stratification of U.S. Banks
by Asset Size
Median Valuation Multiples
Median Total Return as of February 28, 2019 Median Valuation Multiples as of February 28, 2019
IndicesMonth-to-
DateQuarter-to-
DateLast 12
MonthsPrice/
LTM EPSPrice /
2019 (E) EPSPrice /
2020 (E) EPSPrice /
Book Value
Price / Tangible Book
ValueDividend
Yield
Atlantic Coast Index 5.7% 9.3% -5.1% 13.8x 12.3x 11.6x 119% 127% 2.2%
Midwest Index 6.0% 13.3% -0.7% 13.8x 11.8x 11.1x 128% 155% 2.5%
Northeast Index 5.6% 6.8% -1.3% 13.7x 12.2x 10.5x 125% 141% 2.5%
Southeast Index 3.5% 10.0% 0.7% 14.2x 12.3x 11.6x 127% 142% 1.6%
West Index 5.1% 9.9% 1.8% 12.8x 13.0x 11.9x 125% 136% 1.9%
Community Bank Index 5.4% 9.9% -1.1% 13.7x 12.2x 11.3x 125% 142% 2.2%
SNL Bank Index 3.2% 14.7% -8.5%
Mercer Capital’s Public Market Indicators March 2019
Assets$250 -$500M
Assets$500M -
$1B
Assets $1 -$5B
Assets $5 -$10B
Assets >$10B
Month-to-Date 4.23% 3.08% 6.27% 6.95% 3.03%Quarter-to-Date 9.31% 7.35% 12.31% 15.94% 14.76%Last 12 Months -1.72% 1.36% -0.05% 4.48% -9.26%
-20%
-10%
0%
10%
20%
As
of F
ebru
ary
28, 2
019
70
75
80
85
90
95
100
105
110
115
120
2/28/2
018
3/31/2
018
4/30/2
018
5/31/2
018
6/30/2
018
7/31/2
018
8/31/2
018
9/30/2
018
10/31
/2018
11/30
/2018
12/31
/2018
1/31/2
019
2/28/2
019
Febr
uary
28,
201
8 =
100
MCM Index - Community Banks SNL Bank S&P 500

© 2019 Mercer Capital // Data provided by S&P Global Market Intelligence 7
2006 2007 2008 2009 2010 2011 2012 2013 2014 2015 2016 2017 2018 LTM2019
U.S. 20.0% 18.4% 12.0% 6.9% 6.3% 5.4% 4.3% 5.5% 7.5% 7.5% 6.1% 10.0% 9.6% 9.2%
0%
5%
10%
15%
20%
25%
Cor
e D
epos
it P
rem
ium
s
2006 2007 2008 2009 2010 2011 2012 2013 2014 2015 2016 2017 2018 LTM2019
U.S. 243% 228% 196% 145% 141% 132% 130% 134% 155% 148% 143% 170% 178% 178%
0%
50%
100%
150%
200%
250%
300%
350%
Pric
e / T
angi
ble
Boo
k V
alue
2006 2007 2008 2009 2010 2011 2012 2013 2014 2015 2016 2017 2018 LTM2019
U.S. 22.0 22.1 19.9 19.3 21.7 21.9 17.0 16.5 17.5 18.8 18.1 19.5 22.4 21.8
0
5
10
15
20
25
30
Pric
e / L
ast 1
2 M
onth
sE
arni
ngs
Regions
Price / LTM
Earnings
Price/ Tang.
BV
Price / Core Dep Premium
No. of
Deals
Median Deal
Value ($M)
Target’s Median Assets ($000)
Target’s Median
LTM ROAE
Atlantic Coast 21.3x 179% 11.0% 12 96.0 380,064 9.2%
Midwest 19.1x 164% 7.4% 81 38.7 143,480 10.4%
Northeast 23.9x 188% 11.6% 11 62.0 495,306 7.2%
Southeast 22.2x 181% 9.7% 31 52.0 258,311 9.8%
West 24.3x 208% 11.4% 20 76.0 259,228 8.5%
National Community Banks
21.8x 178% 9.2% 155 54.7 218,638 9.6%
Median Valuation Multiples for M&A Deals
Target Banks’ Assets <$5B and LTM ROE >5%, 12 months ended February 2019
Median Core Deposit Multiples
Target Banks’ Assets <$5B and LTM ROE >5%
Median Price/Tangible Book Value Multiples
Target Banks’ Assets <$5B and LTM ROE >5%
Median Price/Earnings Multiples
Target Banks’ Assets <$5B and LTM ROE >5%
Mercer Capital’s M&A Market Indicators March 2019
Source: S&P Global Market Intelligence
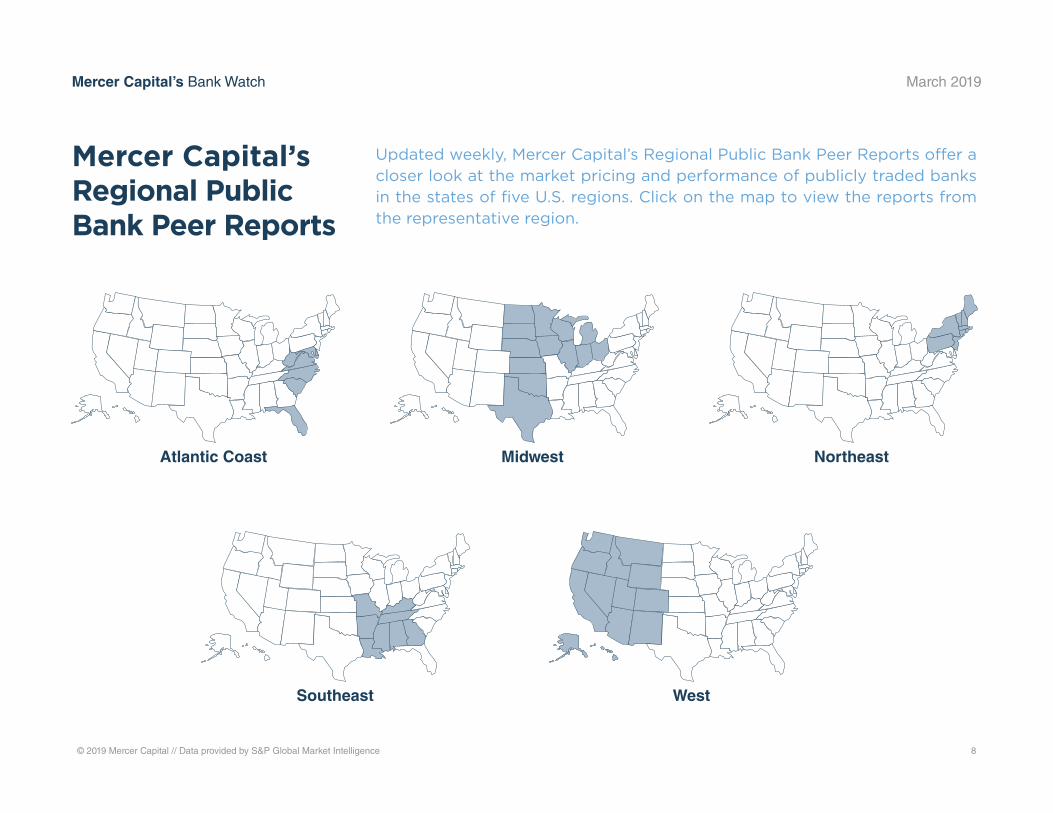
Updated weekly, Mercer Capital’s Regional Public Bank Peer Reports offer a closer look at the market pricing and performance of publicly traded banks in the states of five U.S. regions. Click on the map to view the reports from the representative region.
© 2019 Mercer Capital // Data provided by S&P Global Market Intelligence 8
Atlantic Coast Midwest Northeast
Southeast West
Mercer Capital’s Regional Public Bank Peer Reports
Mercer Capital’s Bank Watch March 2019

Mercer Capital assists banks, thrifts, and credit unions with significant corporate valuation requirements, transaction advisory services, and other strategic decisions.
Mercer Capital pairs analytical rigor with industry knowledge to deliver unique insight into issues facing banks. These insights underpin the valuation analyses that are at the
heart of Mercer Capital’s services to depository institutions.
» Bank valuation
» Financial reporting for banks
» Goodwill impairment
» Litigation support
» Stress Testing
» Loan portfolio valuation
» Tax compliance
» Transaction advisory
» Strategic planning
Depository Institutions Team
MERCER CAPITAL
Depository Institutions Services
BUSINESS VALUATION & FINANCIAL ADVISORY SERVICES
Jeff K. Davis, CFA
615.345.0350
Andrew K. Gibbs, CFA, CPA/ABV
901.322.9726
Jay D. Wilson, Jr., CFA, ASA, CBA
469.778.5860
Eden G. Stanton, CFA
901.270.7250
Mary Grace Arehart
901.322.9720
Madeleine G. Davis
901.322.9715
Brian F. Adams
901.322.9706
William C. Tobermann
901.322.9707
Copyright © 2019 Mercer Capital Management, Inc. All rights reserved. It is illegal under Federal law to reproduce this publication or any portion of its contents without the publisher’s permission. Media quotations with source attribution are encouraged.
Reporters requesting additional information or editorial comment should contact Barbara Walters Price at 901.685.2120. Mercer Capital’s Bank Watch is published monthly and does not constitute legal or financial consulting advice. It is offered as an
information service to our clients and friends. Those interested in specific guidance for legal or accounting matters should seek competent professional advice. Inquiries to discuss specific valuation matters are welcomed. To add your name to our mailing list
to receive this complimentary publication, visit our web site at www.mercercapital.com.
www.mercercapital.com

Mercer Capitalwww.mercercapital.com