march 2017 richard campbell - nfpa · electrical fires. march 2017 richard campbell ... electrical...
TRANSCRIPT

Electrical Fires
March 2017
Richard Campbell
© March 2017 National Fire Protection Association

Abstract Electrical fires U.S. fire departments responded to an estimated average of 45,210 home structure fires each
year between 2010 and 2014 that involved some type of electrical failure or malfunction as a
factor contributing to ignition. These fires resulted in an estimated 420 deaths, 1,370 injuries
and $1.4 billion in direct property damage per year. An estimated 16,070 non-home structure
fires involving some type of electrical failure or malfunction as a factor contributing to
ignition were also reported to U.S. fire departments per year. These fires resulted in an
estimated annual average of 12 civilian deaths, 210 civilian injuries, and $614 million in
direct property damage.
Electrical distribution and lighting equipment fires An estimated annual average of 31,960 non-confined home structure fires involving electrical
distribution or lighting equipment in 2010-2014 resulted in an estimated 400 civilian deaths,
1,180 civilian injuries, and $1.2 billion in direct property damage per year. An estimated
annual average of 14,760 non-confined non-home fires resulted 20 civilian deaths, 190
civilian injuries, and $659 million in direct property damage per year over this period.
These estimates are based on data from the U.S. Fire Administration’s (USFA’s) National
Fire Incident Reporting System (NFIRS) and the National Fire Protection Association’s
(NFPA’s) annual fire department experience survey.
Keywords: electrical fires, wiring, extension cords, lighting equipment, electrical arcing,
residential fires, fire statistics Acknowledgements The National Fire Protection Association thanks all the fire departments and state fire
authorities who participate in the National Fire Incident Reporting System (NFIRS) and the
annual NFPA fire experience survey. These firefighters are the original sources of the
detailed data that make this analysis possible. Their contributions allow us to estimate the
size of the fire problem.
We are also grateful to the U.S. Fire Administration for its work in developing, coordinating,
and maintaining NFIRS.
To learn more about research at NFPA visit www.nfpa.org/research.
Copies of this analysis are available from:
National Fire Protection Association
NFPA Research, Data and Analytics Division
1 Batterymarch Park
Quincy, MA 02169-7471
www.nfpa.org
E-mail: [email protected]
Phone: 617-984-7451
NFPA No. USS12A

Electrical Fires, 3/17 i NFPA Research, Quincy, MA
Table of Contents
Page Table of Contents i
List of Tables and Figures ii
Electrical Fires Fact Sheet vi
Section 1. Home Electrical Fires 1
Section 2. Non-Home Electrical Fires 19
Section 3. Home Fires Involving Electrical Distribution or Lighting Equipment 32
Section 4. Home Fires Involving Wiring and Related Equipment 47
Section 5. Home Fires Involving Lamps, Light Fixtures, and Light Bulbs 58
Section 6. Home Fires Involving Cords and Plugs 71
Section 7. Home Fires Involving Transformers or Power Supplies 86
Section 8. Non-Home Fires Involving Electrical Distribution or Lighting Equipment 99
Appendix A. How National Estimates Statistics Are Calculated 111

Electrical Fires, 3/17 ii NFPA Research, Quincy, MA
List of Tables and Figures
Page Home Structure Fires Involving Electrical Failure or Malfunction as a Factor Contributing to Ignition Figure 1. By year 1
Table A. Total fires versus total factors 2
Table B. By type of electrical failure or malfunction 3
Figure 2. By Time of Day 4
Table C. By equipment involved in ignition 5
Figure 3. Civilian deaths and injuries by victim location when injured 6
Table D. By victim activity when Injured 6
Table 1. By year 7
Table 2. By month 9
Table 3. By day of week 10
Table 4. By time of day 11
Table 5. By equipment involved in ignition 12
Table 6. By area of origin 14
Table 7. By item first ignited 16
Table 8. By general victim location when injured 17
Table 9. By victim activity when injured 18
Non-Home Structure Fires Involving Electrical Failure or Malfunction as a Factor Contributing to Ignition Figure 2.1. By Year 19
Table 2.A. By type of electrical failure or malfunction 20
Figure 2.2 By time of day 21
Table 2.1. By Year 22
Table 2.2 By month 24
Table 2.3. By day of week 25
Table 2.4. By alarm time 26
Table 2.5. By equipment involved in ignition 27
Table 2.6. By area of origin 29
Table 2.7. By item first ignited 31
Home Structure Fires Involving Electrical Distribution or Lighting Equipment Figure 3.1. By year 32
Table 3.A. By major equipment group 33
Figure 3.2. By time of day 34
Table 3.1. By year 36
Table 3.2. By month 38

Electrical Fires, 3/17 iii NFPA Research, Quincy, MA
List of Tables and Figures (Continued)
Page
Home Structure Fires Involving Electrical Distribution or Lighting Equipment (Continued) Table 3.3. By day of week 39
Table 3.4. By alarm time 40
Table 3.5. By area of origin 41
Table 3.6. By factor contributing to ignition 43
Table 3.7. By item first ignited 44
Table 3.8 By victim location when injured 45
Table 3.9. By victim location at ignition 45
Table 3.10. By victim activity when injured 46
Home Structure Fires Involving Electrical Wiring and Related Equipment Figure 4.1. By year 47
Table 4.A. By major equipment group 48
Figure 4.2. By time of day 49
Table 4.1. By year 50
Table 4.2. By month 52
Table 4.3. By day of week 53
Table 4.4. By alarm time 54
Table 4.5. By factor contributing to ignition 55
Table 4.6. By area of origin 56
Table 4.7. By item first ignited 57
Home Structure Fires Involving Lamps, Light Fixtures and Light Bulbs Figure 5.1. By year 58
Table 5.A. By type of equipment 59
Figure 5.2. By alarm time 59
Table 5.1. By year 61
Table 5.2. By month 63
Table 5.3. By day of week 64
Table 5.4. By alarm time 65
Table 5.5. By factor contributing to ignition 66
Table 5.6. By area of origin 68
Table 5.7. By item first ignited 70

Electrical Fires, 3/17 iv NFPA Research, Quincy, MA
List of Tables and Figures (Continued)
Page
Home Structure Fires Involving Cords and Plugs Figure 6.1. By year 71
Table 6.A. By type of equipment 72
Figure 6.2. By alarm time 72
Table 6.1. By year 75
Table 6.2. By month 77
Table 6.3. By day 78
Table 6.4. By alarm time 79
Table 6.5. By factor contributing to ignition 80
Table 6.6. By area of origin 81
Table 6.7. By item first ignited 82
Home Structure Fires Involving Extension Cords Table 6.8. By factor contributing to ignition 83
Table 6.9. By area of origin 84
Table 6.10. By item first ignited 85
Home Structure Fires Involving Transformers or Power Supplies Figure 7.1. By year 86
Table 7.A. By type of equipment 87
Figure 7.2. By alarm hour 88
Table 7.1. By year 89
Table 7.2. By month 91
Table 7.3. By time of day 92
Table 7.4. By alarm time 93
Table 7.5. By factor contributing to ignition 94
Table 7.6. By area of origin 96
Table 7.7. By item first ignited 98

Electrical Fires, 3/17 v NFPA Research, Quincy, MA
List of Tables and Figures (Continued)
Page
Non-Home Structure Fires Involving Electrical Distribution or Lighting Equipment Table 8.A. By type of equipment 99
Figure 8.1. By time of day 100
Table 8.1. By type of equipment 101
Table 8.2. By month 103
Table 8.3. By day of week 104
Table 8.4. By alarm time 105
Table 8.5. By factor contributing to ignition 106
Table 8.6. By area of origin 107
Table 8.7. By item first ignited 109

Electrical Fires, 3/17 vi NFPA Research, Quincy, MA
ELECTRICAL FIRES FACT SHEET
U.S. fire departments responded to an estimated annual average of 45,210 reported U.S. home
structure fires involving electrical failure or malfunction in 2010-2014. These fires resulted in
420 civilian deaths, 1,370 civilian injuries and $1.4 billion in direct property damage each year.
Some type of electrical failure or malfunction also contributed to the ignition of 16,070 non-home structure fires during this period, resulting in an estimated annual average of 12 civilian
deaths, 210 civilian injuries, and $614 million in direct property damage.
Electrical distribution or lighting equipment was involved in 57% of the home fires involving
electrical failure or malfunction. One-fifth (19%) of fires involved heating, ventilation and air
conditioning equipment, 9% involved kitchen and cooking equipment, and 7% involved personal
and household equipment.
Fires Involving Electrical Distribution or Lighting Equipment
U.S. fire departments responded to an estimated annual average of 31,960 reported non-confined
home structure fires involving electrical distribution or lighting equipment in 2010-2014. These
fires resulted in 400 civilian fire deaths, 1,180 civilian fire injuries, and $1.2 billion in direct
damage. An estimated annual average of 14,760 non-confined non-home fires resulted in 20
civilian deaths, 190 civilian injuries, and $659 million in direct property damage each year over
this period.
Wiring and related equipment accounted for the great majority of home fires and losses
involving electrical distribution and lighting equipment (69% of fires, 56% of civilian deaths,
53% of civilian injuries, and 66% of direct property damage). Cords and plugs accounted for
10% of fires, but 28% of civilian deaths and 20% of civilian injuries, as well as 12% of direct
property damage.
57%
19%
9% 7% 3% 3%
0%
20%
40%
60%
Electrical distribution,
lighting, and power
transfer
Heating, ventilation,
and air conditioning
Kitchen and cooking
equipment
Personal and
household equipment
Electronic and other
electrical equipment
No equipment
involved
Leading Types of Equipment Involved in Home Fires
Involving Electrical Failure or Malfunction, 2010-2014
69%
15%10% 5%
56%
13%
28%
3%
53%
19% 20%9%
66%
14% 12% 8%
0%
50%
100%
Wiring and related equipment Lamps, light fixtures, and light
bulbs
Cords and plugs Transformers and power supplies
Home Fires Involving Electrical Distribution or Lighting Equipment
by Major Equipment Group, 2010-2014
Fires Civilian Deaths Civilian Injuries Direct Property Damage

Electrical Fires, 3/17 1 NFPA Research, Quincy, MA
Section 1: Home Electrical Fires
In the five-year period from 2010 through 2014, there were an estimated annual average of
45,210 home structure fires that were reported to U.S. fire departments that involved some type
of electrical failure or malfunction as a factor contributing to ignition. These fires resulted in an
estimated 420 deaths, 1,370 injuries and $1.4 billion in direct property damage each year. Home
electrical fires represented 13% of total 2010-2014 home fires, 17% of associated civilian deaths,
11% of associated civilian injuries, and 21% of associated direct property damage.
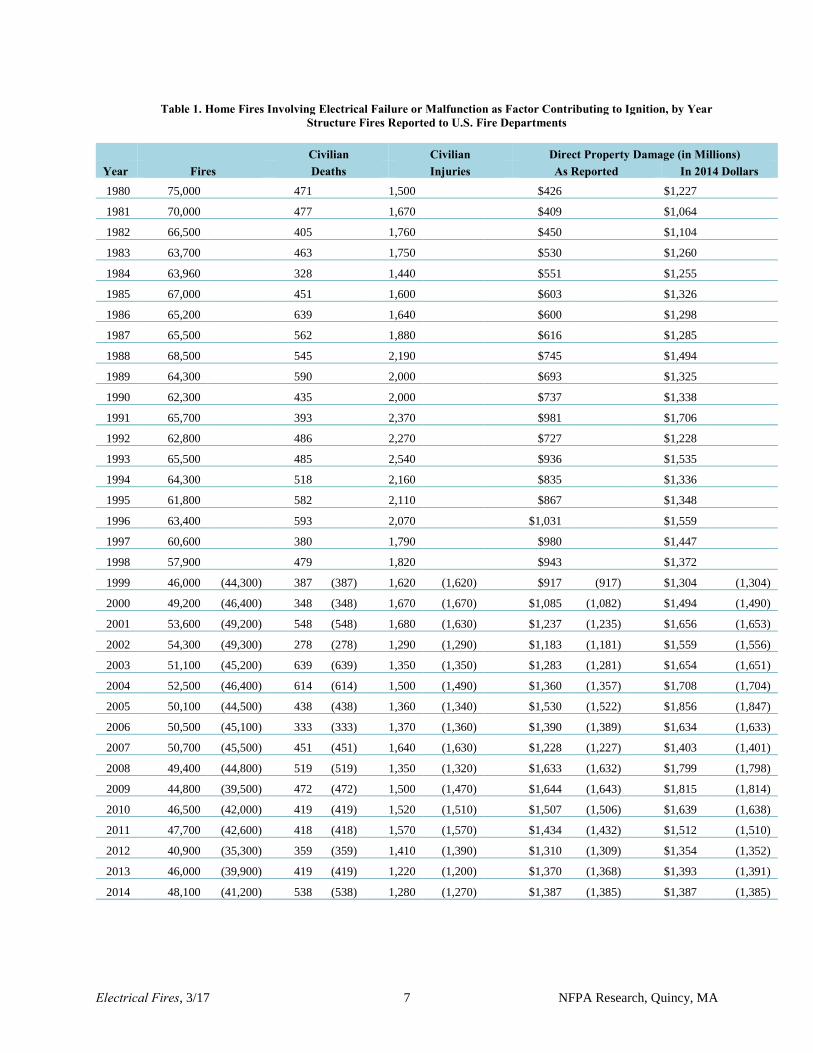
As shown in Figure 1 and Table 1, these fires were generally decreasing from 1980 until recent
years. An estimated 48,100 home electrical fires in 2014, the most recent year for which data are
available, is 36% lower than the estimated 75,000 such fires in 1980. However, the downward
trend has generally abated in the past few years after a low of 40,900 estimated home electric
fires in 2012.
Note: Because of low participation in NFIRS Version 5.0 during 1999-2001, data from these years is not reported in these tables.
See note for Table 1.
The estimates presented in this report are derived from data reported by municipal fire departments. These data are compiled by the U.S. Fire Administration’s National Fire Incident
Reporting System (NFIRS), which distinguish between “non-confined” and “confined” fires.
Confined fires are assumed to be limited to the object of origin and are generally associated with
minimal losses, as indicated in Table A. The data on fires involving electrical failure or
malfunction are identified through the NFIRS data element, “factor contributing to ignition.”
Because the NFIRS system allows for the inclusion of more than one factor for each incident, it
is possible to produce different results for home fires involving electrical failure or malfunction
on the basis of either fire incidents (“fires”) or the number of factors contributing to ignition,
which is normally greater than the number of fires, also shown in Table A. Unless otherwise noted, the data in this report will be restricted to non-confined fires, not factors.
75,000
40,900
48,100
0
10,000
20,000
30,000
40,000
50,000
60,000
70,000
80,000
Fir
es
Year
Figure 1. Annual Home Structure Fires Involving Electrical Failure or
Malfunction as Factor Contributing to Ignition, 1980-2014

Electrical Fires, 3/17 2 NFPA Research, Quincy, MA
A note of caution in interpreting 2010-2014 data Estimates for 2012-2014 were influenced by a change in NFIRS rules. In an effort to improve data
quality while reducing inconsistent or missing data, the USFA introduced a new data entry rule for
NFIRS in 2012. When the heat source or factor contributing to ignition is reported as being
equipment-related, the specific type of equipment involved in ignition must be identified.
This had two effects on the reported data. First, the number of fires coded with undetermined causal
factors other than equipment involved in ignition increased (i.e., some fires were no longer reported
as being equipment-related). At the same time, more fires were reported as having some specific type
of equipment involved in ignition, because now all the fires caused by heat from equipment have that
added detail. This resulted in a marked increase in reported fires involving electrical distribution or
lighting equipment. With the allocation of unknown data, the impact of these changes becomes even
greater. The impact of these changes is particularly noticeable with respect to trend data and requires
caution when interpreting the recent increases.
Table A. Home Fires Involving Electrical Failure or Malfunction, Fires versus Factor Contributing to Ignition 2010-2014 Annual Averages
Category Fires Civilian Deaths
Civilian Injuries
Direct Property Damage (in Millions)
Fires 45,210 (100%) 420 (100%) 1,370 (100%) $1,370 (100%)
Non-confined 39,670 (88%) 420 (100%) 1,360 (99%) $1,370 (100%)
Confined 5,540 (12%) 0 (0%) 10 (1%) $0 (0%)
Factors 46,270 (100%) 440 (100%) 1,370 (100%) $1,430 (100%)
Non-confined 40,670 (88%) 440 (100%) 1,360 (99%) $1,420 (100%)
Confined 5,600 (12%) 0 (0%) 10 (1%) $0 (0%)
Note: These are national estimates of fires reported to U.S. municipal fire departments and so exclude fires reported to federal or state
agencies or industrial fire brigades. Analyses were performed separately for non-confined and confined fires. Fires, deaths, and injuries
are rounded to the nearest ten and direct property damage to the nearest ten million dollars. Totals may not equal sums due to rounding
errors.
Source: NFIRS Version 5.0 and NFPA Fire Experience Survey.
This report analyzes fires involving electrical failure or malfunction in homes and non-home
structures. Homes include one- and two-family homes, manufactured homes, and apartments or
other multi-family housing, regardless of ownership. Non-home structures refers generically to
structures other than homes. Generally speaking, any fire in or on a structure is considered a
structure fire, including incidents in which only contents were damaged.
Types of electrical failure or malfunction involved in home fires There were an estimated 45,210 home structure fires in 2010-2014 involving electrical failure or
malfunction. In 51% of these, the specific type of failure or malfunction was not classified.
When the type of failure or malfunction could be determined, some form of arcing was most
often involved in these fires, with unspecified short circuit arcs in 25% of fires and short circuit
arcs from defective or worn insulation in another 11% of fires. Other types of arcing events
included an arc or spark from operating equipment (6%), an arc from a faulty contact or broken
conductor (5%), a short circuit arc from mechanical damage (4%), and a water-caused short
circuit arc (1%). See Table B. for details.

Electrical Fires, 3/17 3 NFPA Research, Quincy, MA
Table B. Home Fires Involving Electrical Failure or Malfunction, by Factor Contributing to Ignition 2010-2014 Annual Averages
Type of Electrical Failure or Malfunction Fires
Civilian Deaths
Civilian Injuries
Direct Property Damage (in Millions)
Unclassified electrical failure
or malfunction 22,860 (51%) 220 (53%) 700 (51%) $760 (55%)
Unspecified short-circuit arc 11,250 (25%) 130 (30%) 420 (31%) $380 (28%)
Short circuit arc from defective
or worn insulation 4,890 (11%) 40 (10%) 130 (9%) $120 (9%)
Arc or spark from operating
equipment 2,620 (6%) 10 (3%) 80 (6%) $60 (4%)
Arc from faulty contact or
broken conductor 2,140 (5%) 10 (3%) 30 (3%) $50 (4%)
Short circuit arc from
mechanical damage 1,730 (4%) 20 (4%) 40 (3%) $40 (3%)
Water caused short-circuit arc 650 (1%) 0 (0%) 10 (1%) $10 (1%)
Fluorescent light ballast 130 (0%) 0 (0%) 10 (0%) $0 (0%)
Total fires 45,210 (100%) 420 (100%) 1,370 (100%) $1,380 (100%)
Total factors 46,270 (102%) 440 (105%) 1,430 (104%) $1,430 (104%)
Note: Data in this table include non-confined and confined fires. Fires, deaths, and injuries are rounded to the nearest ten and direct property damage to the nearest ten million dollars. Figures reflect a proportional share of home fires with factor contributing to ignition
reports as unknown, unreported, none, or blank, with allocations performed separately for non-confined and confined fires. Totals may
not equal sums due to rounding.
Source: NFIRS Version 5.0 and NFPA Fire Experience Survey.
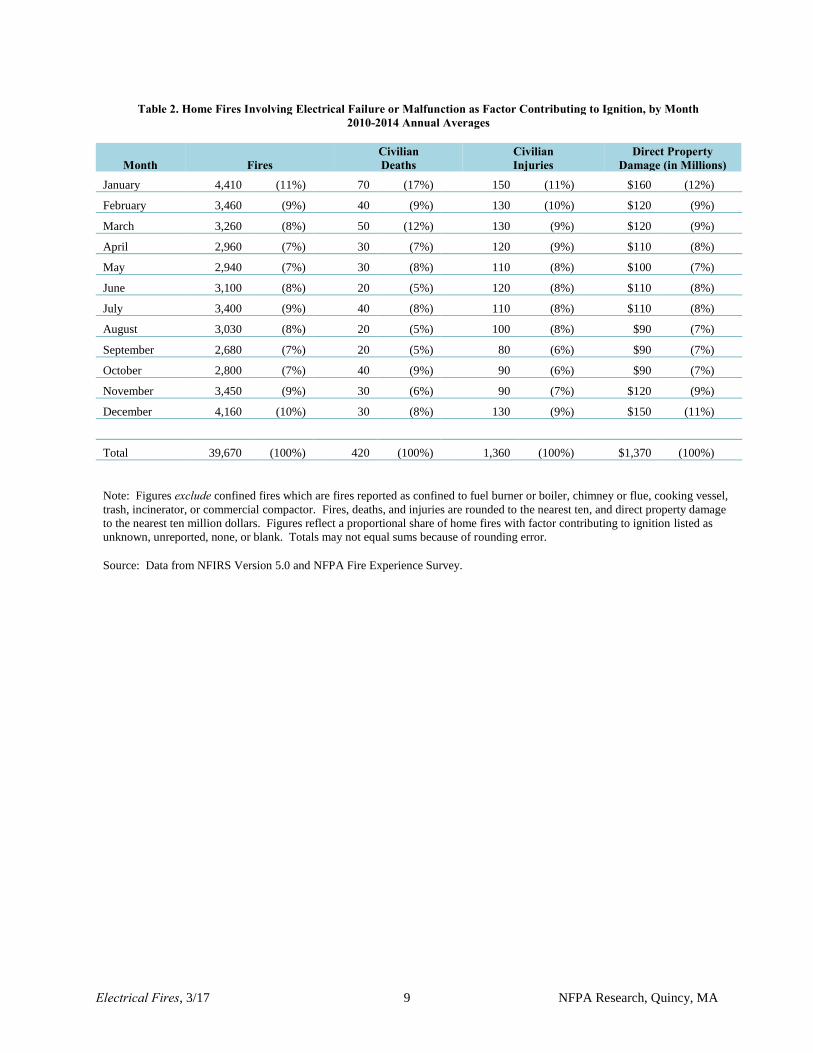
Timing of fires
The peak period for home fires involving electrical failure or malfunction from 2010 through
2014 were the cold weather months from November through February, which accounted for 39%
of fires, as well as 40% of civilian deaths, 37% of civilian injuries, and 40% of direct property
damage. The highest single month for electrical fires was January, with 11% of fires, as well as
17% of civilian fatalities. Another 10% of fires were recorded in December. See Table 2 for
details.
Electrical fires were distributed fairly evenly by day of week, as shown in Table 3, with each day
of the week accounting for a 14% to 15% share of fires.
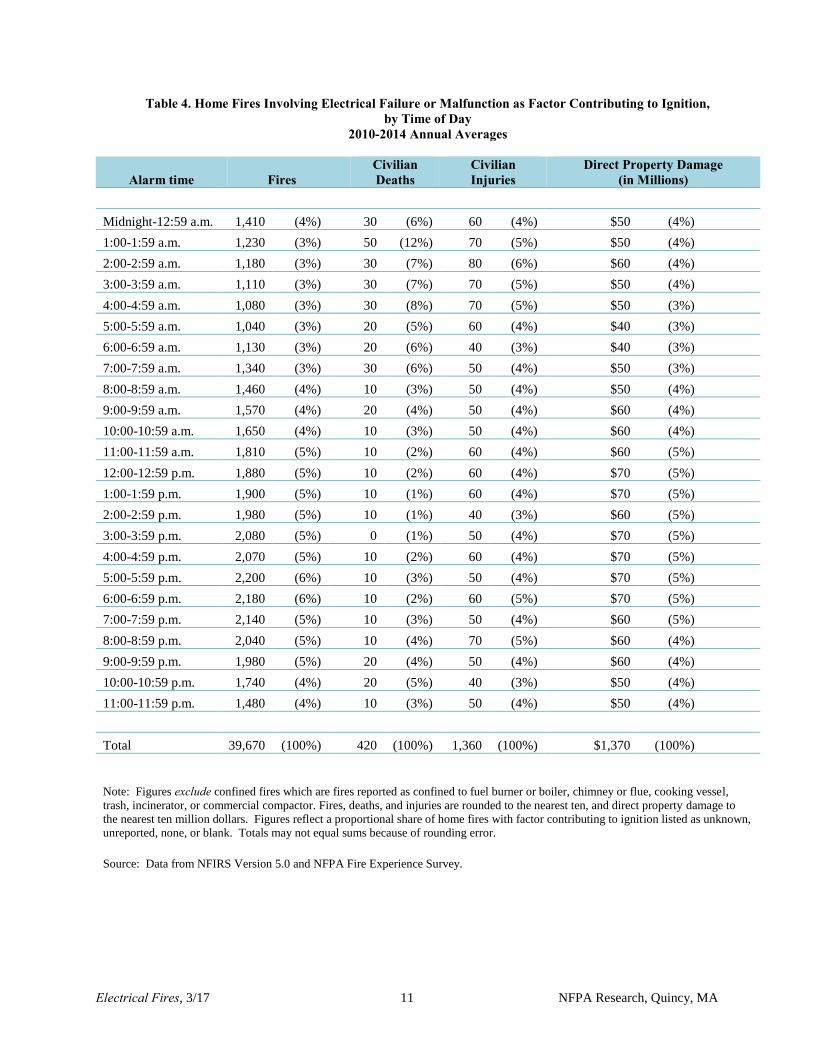
Figure 2 shows that the smallest share of electrical fires in homes by time of day in 2010 to 2014
occurred in the period from midnight to 8 a.m., with 24% of fires. However, this period
accounted for the highest shares of civilian deaths (57%) and civilian injuries (37%), as well as
28% of direct property damage. The period from 4 p.m. to midnight accounted for the largest
share of fires (40%), while also accounting for 25% of civilian deaths, 33% of civilian injuries,
and 36% of direct property damage. Nearly two of five fires occurred in the hours between

Electrical Fires, 3/17 4 NFPA Research, Quincy, MA
8 a.m. and 4 p.m. (36%). This period was also associated with the smallest share of civilian
deaths (18%) and injuries (31%).
Note: See Note for Table 4.
Source: NFIRS Version 5.0 and NFPA Fire Experience Survey.
Equipment involved in fire ignition
There were 39,670 non-confined home structure fires involving electrical failure or malfunction
in 2010-2014. Electrical distribution, lighting, and power transfer equipment accounted for the
largest share of these, with 57% of the total, followed by heating, ventilation, and air
conditioning equipment (19%), kitchen and cooking equipment (9%), personal and household
equipment (7%), and electronic and other electrical equipment (3%), as shown in Table C and
Table 5.
Table C shows that unclassified wiring was involved in 20% of fires, while an outlet or
receptacle was involved in 8% of fires, an electrical branch circuit was involved in 6% of fires,
and a panelboard, switchboard, or circuit breaker board and extension cords were each involved
in 3% of fires. The 3% of fires involving extension cords caused 13% of civilian deaths and
7% of civilian injuries. Fires involving electrical branch circuits accounted for 6% of fires, but
14% of civilian deaths). Leading types of heating, ventilation, and air conditioning equipment
involved were fans (6% of fires), air conditioners (4%), fixed or portable space heaters (4%), and
water heaters (3%). Space heater fires were associated with 8% of civilian deaths. Other leading
types of equipment included ranges or cooktops (3% of fires) and clothes dryers (4% of fires).
24%
36%
40%
57%
18%
25%
37%
31%33%
28%
36% 36%
0%
10%
20%
30%
40%
50%
60%
Midnight - 8 a.m. 8 a.m. - 4:00 p.m. 4:00 p.m. - Midnight
Figure 2. Home Fires Involving Electrical Failure or Malfunction by,
Time of Day, 2010 - 2014 Annual Averages
Fires Civilian Deaths Civilian Injuries Direct Property Damage

Electrical Fires, 3/17 5 NFPA Research, Quincy, MA
Table C. Home Fires Involving Electrical Failure or Malfunction as Factor Contributing to Ignition, by Equipment Involved in Ignition
2010-2014 Annual Averages
Equipment Involved Fires Civilian Deaths
Civilian Injuries
Direct Property Damage (in Millions)
Electrical distribution, lighting, and power transfer 22,510 (57%) 300 (70%) 760 (56%) $840 (61%)
Unclassified electrical wiring 7,880 (20%) 100 (24%) 200 (15%) $310 (22%)
Outlet or receptacle 3,090 (8%) 30 (7%) 140 (10%) $90 (7%)
Electrical branch circuit 2,230 (6%) 60 (14%) 50 (4%) $90 (7%)
Panelboard, switchboard or
circuit breaker board 1,180 (3%) 0 (0%) 30 (2%) $40 (3%)
Extension cord 1,180 (3%) 60 (13%) 100 (7%) $50 (4%)
Heating, ventilation, and air conditioning 7,530 (19%) 70 (16%) 260 (19%) $210 (15%) Fan 2,470 (6%) 20 (4%) 90 (6%) $60 (5%)
Air conditioner 1,500 (4%) 20 (5%) 70 (5%) $50 (3%)
Fixed or portable space
heater 1,400 (4%) 30 (8%) 50 (4%) $50 (4%)
Water heater 1,100 (3%) 0 (0%) 20 (1%) $20 (1%)
Kitchen and cooking equipment 3,380 (9%) 20 (4%) 150 (11%) $90 (7%)
Range or cooktop 1,050 (3%) 10 (1%) 50 (3%) $20 (1%)
Personal and household equipment 2,660 (7%) 20 (4%) 80 (6%) $70 (5%)
Clothes dryer 1,670 (4%) 0 (0%) 40 (3%) $30 (2%)
Electronic and other electrical equipment 1,170 (3%) 10 (3%) 50 (4%) $50 (3%)
No equipment involved 1,160 (3%) 0 (1%) 30 (2%) $50 (4%)
Total* 39,670 (100%) 420 (100%) 1,360 (100%) $1,370 (100%)
Note: Data in this table include non-confined fires only. Analyses were performed separately for non-confined and confined fires.
Fires, deaths, and injuries are rounded to the nearest ten and direct property damage to the nearest ten million dollars. Figures reflect a
proportional share of home fires with factor contributing to ignition reports as unknown, unreported, none, or blank, with allocations
performed separately for non-confined and confined fires. Totals may not equal sums due to rounding.
Source: NFIRS Version 5.0 and NFPA Fire Experience Survey.
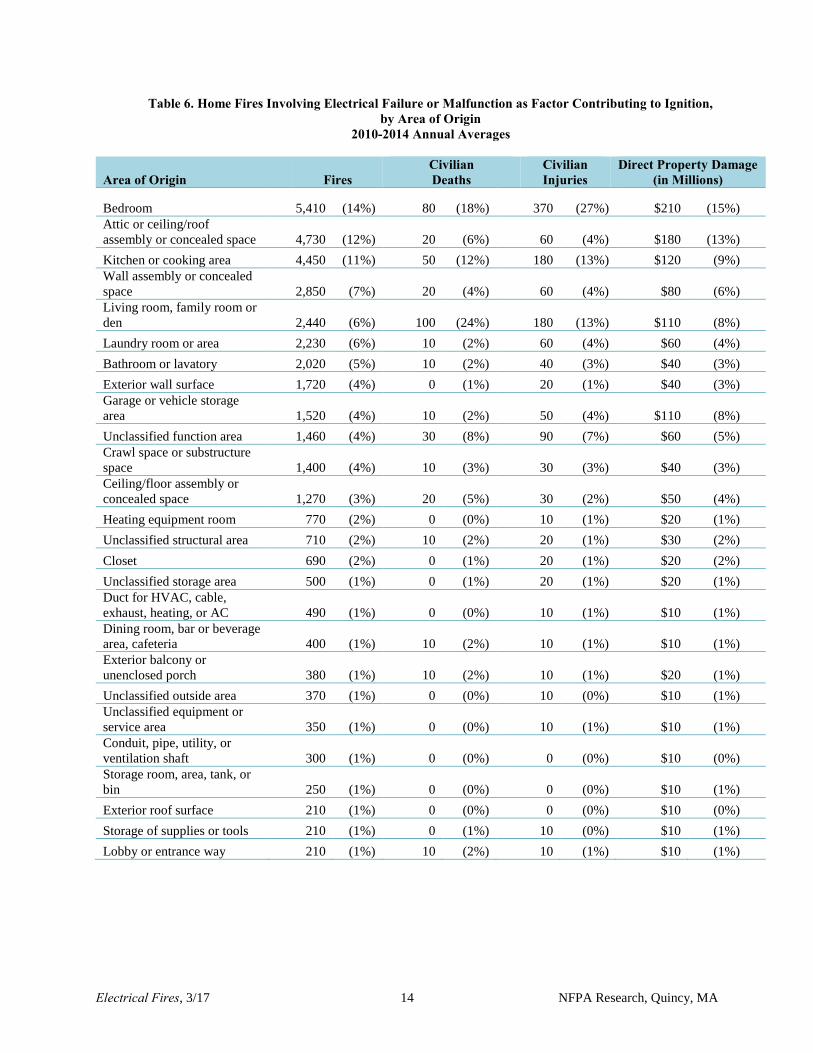
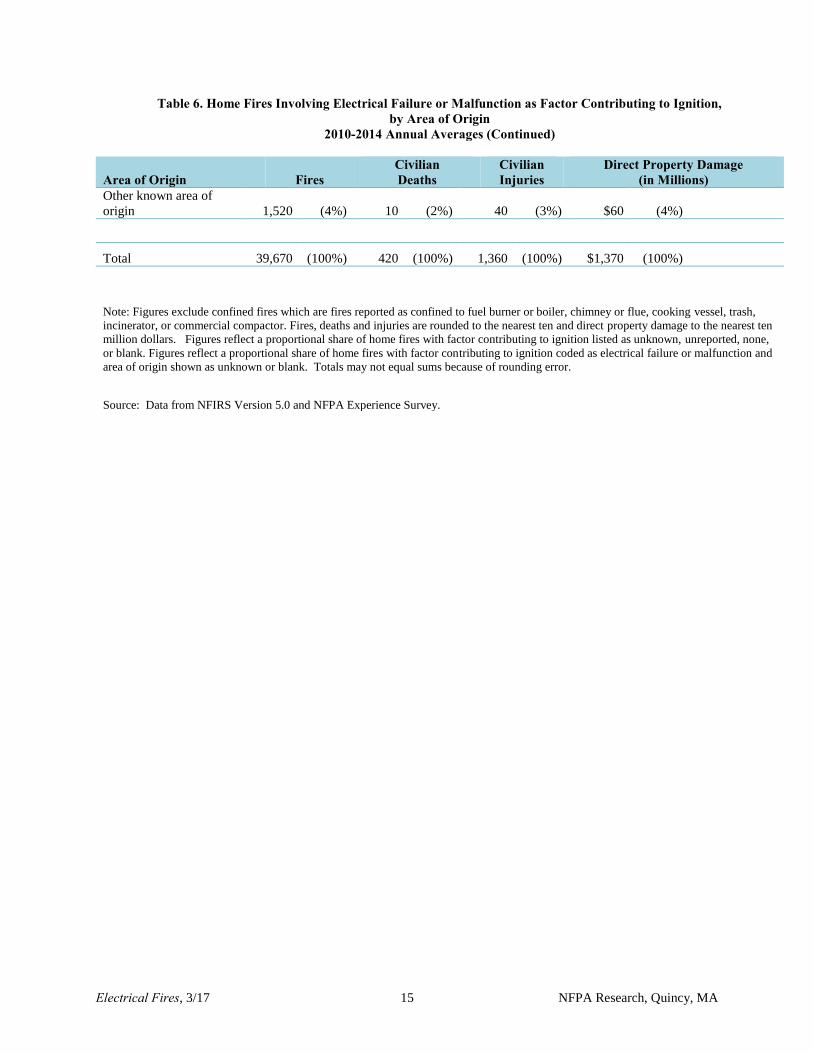
Area of origin. The leading areas of origin for home fires involving electrical failure or
malfunction were bedrooms (14% of fires), attics or ceiling/roof assemblies or concealed spaces
(12%), kitchens or cooking areas (11%), wall assemblies or concealed spaces (7%), living
rooms, family rooms or dens (6%), laundry rooms or areas (6%), and bathrooms or lavatories
(5%). Fires originating in the bedroom had the highest share of civilian injuries (27%) and direct
property damage (15%), as well as 18% of civilian deaths. Fires originating in a living room,
family room or den accounted for 6% of the total, but 24% of civilian deaths. See Table 6.
Item first ignited. The leading items first ignited in home fires involving electrical failure or
malfunction were electrical wire or insulation (31% of fires) and structural member or framing
(16%), followed by insulation within a structural area (7%), interior wall covering, excluding

Electrical Fires, 3/17 6 NFPA Research, Quincy, MA
drapes (6%), appliance housing or casing (5%), and exterior wall covering or finish (5%). The
complete list of items first ignited is available in Table 7.
Locations and activities of victims at time of injury. Information on the general location of
civilians who died or were injured in these fires indicates that 38% of those fatally injured and
54% of non-fatal injuries were in the area of fire origin, while 62% of those fatally injured and
39% of non-fatally injured were in the building, but not in the area of origin. Seven percent of
civilians who experienced non-fatal injuries were outside and not in the area of origin. See
Figure 3. and Table 8.
Note: See Note on Table 8. Source: NFIRS Version 5.0 and NFPA Fire Experience Survey
The vast majority of civilians who died in home electrical fires were either sleeping (42% of deaths)
or trying to escape (41%) at the time of injury, while 6% were unable to act. See Table D and
Table 9. Civilians who received non-fatal injuries were far less likely to be sleeping (13% of
injuries) and somewhat less likely to be in the act of escaping (36%); 25% were engaged in fire
control. Eight percent of civilians with non-fatal injuries were returning to the vicinity of the fire
before it was controlled and 7% were involved in a rescue attempt at the time of injury.
Table D. Home Fires Involving Electrical Failure or Malfunction as a Factor Contributing to Ignition, by Victim Activity When Injured
2010-2014 Annual Averages
Activity When Injured Civilian Deaths
Civilian Injuries
Sleeping 180 (42%) 170 (13%)
Escaping 170 (41%) 490 (36%)
Unable to act 30 (6%) 30 (2%)
Fire control 10 (3%) 350 (25%)
Rescue attempt 10 (3%) 100 (7%)
Irrational act 10 (2%) 10 (1%)
Returning to vicinity of fire before control 10 (2%) 120 (8%)
Unclassified activity 0 (0%) 90 (7%)
Total 420 (100%) 1,360 (100%)
Note: See Note on Table 9. Source: NFIRS Version 5.0 and NFPA Fire Experience Survey.
38%
62%
0%
54%
39%
7%
0%
20%
40%
60%
80%
In area of origin In building, but not in area of origin Outside, not in area of origin
Figure 3. Civilian Deaths and Injuries in Home Fires Involving Electrical Failure or
Malfunction, by Victim Location When Injured, 2010-2014 Annual Averages
Civilian Deaths Civilian Injuries
Electrical Fires, 3/17 7 NFPA Research, Quincy, MA
Table 1. Home Fires Involving Electrical Failure or Malfunction as Factor Contributing to Ignition, by Year Structure Fires Reported to U.S. Fire Departments
Civilian Civilian Direct Property Damage (in Millions) Year Fires Deaths Injuries As Reported In 2014 Dollars 1980 75,000 471 1,500 $426 $1,227
1981 70,000 477 1,670 $409 $1,064
1982 66,500 405 1,760 $450 $1,104
1983 63,700 463 1,750 $530 $1,260
1984 63,960 328 1,440 $551 $1,255
1985 67,000 451 1,600 $603 $1,326
1986 65,200 639 1,640 $600 $1,298
1987 65,500 562 1,880 $616 $1,285
1988 68,500 545 2,190 $745 $1,494
1989 64,300 590 2,000 $693 $1,325
1990 62,300 435 2,000 $737 $1,338
1991 65,700 393 2,370 $981 $1,706
1992 62,800 486 2,270 $727 $1,228
1993 65,500 485 2,540 $936 $1,535
1994 64,300 518 2,160 $835 $1,336
1995 61,800 582 2,110 $867 $1,348
1996 63,400 593 2,070 $1,031 $1,559
1997 60,600 380 1,790 $980 $1,447
1998 57,900 479 1,820 $943 $1,372
1999 46,000 (44,300) 387 (387) 1,620 (1,620) $917 (917) $1,304 (1,304)
2000 49,200 (46,400) 348 (348) 1,670 (1,670) $1,085 (1,082) $1,494 (1,490)
2001 53,600 (49,200) 548 (548) 1,680 (1,630) $1,237 (1,235) $1,656 (1,653)
2002 54,300 (49,300) 278 (278) 1,290 (1,290) $1,183 (1,181) $1,559 (1,556)
2003 51,100 (45,200) 639 (639) 1,350 (1,350) $1,283 (1,281) $1,654 (1,651)
2004 52,500 (46,400) 614 (614) 1,500 (1,490) $1,360 (1,357) $1,708 (1,704)
2005 50,100 (44,500) 438 (438) 1,360 (1,340) $1,530 (1,522) $1,856 (1,847)
2006 50,500 (45,100) 333 (333) 1,370 (1,360) $1,390 (1,389) $1,634 (1,633)
2007 50,700 (45,500) 451 (451) 1,640 (1,630) $1,228 (1,227) $1,403 (1,401)
2008 49,400 (44,800) 519 (519) 1,350 (1,320) $1,633 (1,632) $1,799 (1,798)
2009 44,800 (39,500) 472 (472) 1,500 (1,470) $1,644 (1,643) $1,815 (1,814)
2010 46,500 (42,000) 419 (419) 1,520 (1,510) $1,507 (1,506) $1,639 (1,638)
2011 47,700 (42,600) 418 (418) 1,570 (1,570) $1,434 (1,432) $1,512 (1,510)
2012 40,900 (35,300) 359 (359) 1,410 (1,390) $1,310 (1,309) $1,354 (1,352)
2013 46,000 (39,900) 419 (419) 1,220 (1,200) $1,370 (1,368) $1,393 (1,391)
2014 48,100 (41,200) 538 (538) 1,280 (1,270) $1,387 (1,385) $1,387 (1,385)
Electrical Fires, 3/17 8 NFPA Research, Quincy, MA
Table 1. Home Fires Involving Electrical Failure or Malfunction as Factor Contributing to Ignition, by Year Structure Fires Reported to U.S. Fire Departments (Continued)
Note: Figures in parentheses exclude confined fires, which are fires reported as confined to fuel burner or boiler, chimney or flue, cooking
vessel, trash, incinerator, or commercial compactor. These are national estimates of fires reported to U.S. municipal fire departments and
so exclude fires reported to only federal or state agencies or industrial fire brigades. National estimates are projections. Casualty and loss
projections can be heavily influenced by the inclusion or exclusion of a small number of unusually serious fires. Fires are rounded to the
nearest hundred, civilian deaths to the nearest one, civilian injuries to the nearest ten, and direct property damage to the nearest million
dollars. Figures for 1980-1998 are based on ignition factor 54-55 and reflect a proportional share of home fires with ignition factor
unknown, unreported, none, or blank. Figures for 1999 and later years reflect a proportional share of home fires with factor contributing to
ignition as unknown, unreported, none, or blank. Because of low participation in NFIRS Version 5.0 during 1999-2001, estimates for
these years are highly uncertain and must be used with caution. Inflation adjustment to 2014 dollars is calculated using the Consumer
Price Index. Home fire property damage figures for 1991 are inflated by estimation problems related to the Oakland fire storm.
Source: NFIRS (Version 5.0 after 1998) and NFPA Fire Experience Survey.
Electrical Fires, 3/17 9 NFPA Research, Quincy, MA
Table 2. Home Fires Involving Electrical Failure or Malfunction as Factor Contributing to Ignition, by Month 2010-2014 Annual Averages
Month Fires Civilian Deaths
Civilian Injuries
Direct Property Damage (in Millions)
January 4,410 (11%) 70 (17%) 150 (11%) $160 (12%)
February 3,460 (9%) 40 (9%) 130 (10%) $120 (9%)
March 3,260 (8%) 50 (12%) 130 (9%) $120 (9%)
April 2,960 (7%) 30 (7%) 120 (9%) $110 (8%)
May 2,940 (7%) 30 (8%) 110 (8%) $100 (7%)
June 3,100 (8%) 20 (5%) 120 (8%) $110 (8%)
July 3,400 (9%) 40 (8%) 110 (8%) $110 (8%)
August 3,030 (8%) 20 (5%) 100 (8%) $90 (7%)
September 2,680 (7%) 20 (5%) 80 (6%) $90 (7%)
October 2,800 (7%) 40 (9%) 90 (6%) $90 (7%)
November 3,450 (9%) 30 (6%) 90 (7%) $120 (9%)
December 4,160 (10%) 30 (8%) 130 (9%) $150 (11%)
Total 39,670 (100%) 420 (100%) 1,360 (100%) $1,370 (100%)
Note: Figures exclude confined fires which are fires reported as confined to fuel burner or boiler, chimney or flue, cooking vessel,
trash, incinerator, or commercial compactor. Fires, deaths, and injuries are rounded to the nearest ten, and direct property damage
to the nearest ten million dollars. Figures reflect a proportional share of home fires with factor contributing to ignition listed as
unknown, unreported, none, or blank. Totals may not equal sums because of rounding error.
Source: Data from NFIRS Version 5.0 and NFPA Fire Experience Survey.

Electrical Fires, 3/17 10 NFPA Research, Quincy, MA
Table 3. Home Fires Involving Electrical Failure or Malfunction as Factor Contributing to Ignition, by Day of Week
2010-2014 Annual Averages
Alarm Day of Week Fires
Civilian Deaths
Civilian Injuries Direct Property Damage (in Millions)
Sunday 5,680 (14%) 50 (12%) 210 (15%) $190 (14%)
Monday 5,690 (14%) 50 (13%) 180 (14%) $190 (14%)
Tuesday 5,620 (14%) 60 (13%) 210 (15%) $190 (14%)
Wednesday 5,600 (14%) 60 (13%) 160 (12%) $200 (14%)
Thursday 5,660 (14%) 70 (16%) 190 (14%) $210 (15%)
Friday 5,610 (14%) 70 (15%) 220 (16%) $190 (14%)
Saturday 5,810 (15%) 70 (17%) 190 (14%) $210 (15%)
Totals 39,670 (100% 420 (100%) 1,360 (100%) $1,370 (100%)
Note: Figures exclude confined fires which are fires reported as confined to fuel burner or boiler, chimney or flue, cooking vessel,
trash, incinerator, or commercial compactor. Fires, deaths, and injuries are rounded to the nearest ten, and direct property damage to
the nearest ten million dollars. Figures reflect a proportional share of home fires with factor contributing to ignition listed as unknown,
unreported, none, or blank. Totals may not equal sums because of rounding error.
Source: Data from NFIRS Version 5.0 and NFPA Fire Experience Survey.
Electrical Fires, 3/17 11 NFPA Research, Quincy, MA
Table 4. Home Fires Involving Electrical Failure or Malfunction as Factor Contributing to Ignition, by Time of Day
2010-2014 Annual Averages
Alarm time Fires Civilian Deaths
Civilian Injuries
Direct Property Damage (in Millions)
Midnight-12:59 a.m. 1,410 (4%) 30 (6%) 60 (4%) $50 (4%)
1:00-1:59 a.m. 1,230 (3%) 50 (12%) 70 (5%) $50 (4%)
2:00-2:59 a.m. 1,180 (3%) 30 (7%) 80 (6%) $60 (4%)
3:00-3:59 a.m. 1,110 (3%) 30 (7%) 70 (5%) $50 (4%)
4:00-4:59 a.m. 1,080 (3%) 30 (8%) 70 (5%) $50 (3%)
5:00-5:59 a.m. 1,040 (3%) 20 (5%) 60 (4%) $40 (3%)
6:00-6:59 a.m. 1,130 (3%) 20 (6%) 40 (3%) $40 (3%)
7:00-7:59 a.m. 1,340 (3%) 30 (6%) 50 (4%) $50 (3%)
8:00-8:59 a.m. 1,460 (4%) 10 (3%) 50 (4%) $50 (4%)
9:00-9:59 a.m. 1,570 (4%) 20 (4%) 50 (4%) $60 (4%)
10:00-10:59 a.m. 1,650 (4%) 10 (3%) 50 (4%) $60 (4%)
11:00-11:59 a.m. 1,810 (5%) 10 (2%) 60 (4%) $60 (5%)
12:00-12:59 p.m. 1,880 (5%) 10 (2%) 60 (4%) $70 (5%)
1:00-1:59 p.m. 1,900 (5%) 10 (1%) 60 (4%) $70 (5%)
2:00-2:59 p.m. 1,980 (5%) 10 (1%) 40 (3%) $60 (5%)
3:00-3:59 p.m. 2,080 (5%) 0 (1%) 50 (4%) $70 (5%)
4:00-4:59 p.m. 2,070 (5%) 10 (2%) 60 (4%) $70 (5%)
5:00-5:59 p.m. 2,200 (6%) 10 (3%) 50 (4%) $70 (5%)
6:00-6:59 p.m. 2,180 (6%) 10 (2%) 60 (5%) $70 (5%)
7:00-7:59 p.m. 2,140 (5%) 10 (3%) 50 (4%) $60 (5%)
8:00-8:59 p.m. 2,040 (5%) 10 (4%) 70 (5%) $60 (4%)
9:00-9:59 p.m. 1,980 (5%) 20 (4%) 50 (4%) $60 (4%)
10:00-10:59 p.m. 1,740 (4%) 20 (5%) 40 (3%) $50 (4%)
11:00-11:59 p.m. 1,480 (4%) 10 (3%) 50 (4%) $50 (4%)
Total 39,670 (100%) 420 (100%) 1,360 (100%) $1,370 (100%)
Note: Figures exclude confined fires which are fires reported as confined to fuel burner or boiler, chimney or flue, cooking vessel,
trash, incinerator, or commercial compactor. Fires, deaths, and injuries are rounded to the nearest ten, and direct property damage to
the nearest ten million dollars. Figures reflect a proportional share of home fires with factor contributing to ignition listed as unknown,
unreported, none, or blank. Totals may not equal sums because of rounding error.
Source: Data from NFIRS Version 5.0 and NFPA Fire Experience Survey.

Electrical Fires, 3/17 12 NFPA Research, Quincy, MA
Table 5. Home Fires Involving Electrical Failure or Malfunction as Factor Contributing to Ignition, by Equipment Involved in Ignition
2010-2014 Annual Averages
Equipment Involved Fires Civilian Deaths
Civilian Injuries
Direct Property Damage (in Millions)
Electrical distribution, lighting, and power transfer 22,510 (57%) 300 (70%) 760 (56%) $840 (61%) Unclassified electrical wiring 7,880 (20%) 100 (24%) 200 (15%) $310 (22%)
Outlet or receptacle 3,090 (8%) 30 (7%) 140 (10%) $90 (7%)
Electrical branch circuit 2,230 (6%) 60 (14%) 50 (4%) $90 (7%)
Panelboard, switchboard or circuit
breaker board 1,180 (3%) 0 (0%) 30 (2%) $40 (3%)
Extension cord 1,180 (3%) 60 (13%) 100 (7%) $50 (4%)
Electrical service supply wires
from utility 820 (2%) 0 (1%) 10 (1%) $30 (2%)
Electric meter or meter box 760 (2%) 0 (0%) 10 (1%) $20 (1%)
Wiring from meter box to circuit
breaker 590 (1%) 0 (0%) 0 (0%) $20 (1%)
Unclassified lamp or lighting 560 (1%) 10 (2%) 20 (2%) $20 (1%)
Electrical power (utility) line 560 (1%) 0 (0%) 10 (1%) $20 (1%)
Incandescent lighting fixture 530 (1%) 0 (0%) 20 (1%) $20 (1%)
Surge protector 460 (1%) 10 (2%) 30 (2%) $20 (2%)
Unclassified cord or plug 390 (1%) 20 (4%) 20 (1%) $20 (2%)
Tabletop, floor or desk lamp 290 (1%) 0 (1%) 20 (2%) $10 (1%)
Detachable power cord or plug 270 (1%) 0 (1%) 10 (1%) $10 (1%)
Permanently attached power cord
or plug 260 (1%) 0 (1%) 10 (1%) $10 (1%)
Wall switch 250 (1%) 0 (0%) 0 (0%) $10 (1%)
Fluorescent lighting fixture or
ballast 220 (1%) 0 (0%) 10 (0%) $10 (1%)
Battery charger or rectifier 210 (1%) 0 (0%) 20 (1%) $20 (1%)
Other known electrical distribution
or lighting equipment 780 (0%) 0 (1%) 30 (2%) $30 (2%)
Heating, ventilation, and air conditioning 7,530 (19%) 70 (16%) 260 (19%) $210 (15%) Fan 2,470 (6%) 20 (4%) 90 (6%) $60 (5%)
Air conditioner 1,500 (4%) 20 (5%) 70 (5%) $50 (3%)
Fixed or portable space heater 1400 (4%) 30 (8%) 50 (4%) $50 (4%)
Water heater 1,100 (3%) 0 (0%) 20 (1%) $20 (1%)
Furnace or central heating unit 360 (1%) 0 (0%) 10 (0%) $10 (1%)
Other known heating, ventilation,
and air conditioning equipment 700 (0%) 0 (0%) 20 (2%) $20 (2%)

Electrical Fires, 3/17 13 NFPA Research, Quincy, MA
Table 5. Home Fires Involving Electrical Failure or Malfunction as Factor Contributing to Ignition, by Equipment Involved in Ignition
2010-2014 Annual Averages (Continued)
Equipment Involved Fires Civilian Deaths
Civilian Injuries
Direct Property Damage (in Millions)
Kitchen and cooking equipment 3,380 (9%) 20 (4%) 150 (11%) $90 (7%) Range or cooktop 1,050 (3%) 10 (1%) 50 (3%) $20 (1%)
Refrigerator or freezer 620 (2%) 10 (1%) 30 (2%) $20 (2%)
Microwave oven 480 (1%) 0 (0%) 10 (1%) $10 (1%)
Dishwasher 450 (1%) 0 (1%) 10 (1%) $10 (1%)
Oven or rotisserie 210 (1%) 0 (0%) 0 (0%) $0 (0%)
Other known kitchen and cooking
equipment 570 (1%) 10 (1%) 40 (3%) $20 (2%)
Personal and household equipment 2,660 (7%) 20 (4%) 80 (6%) $70 (5%) Clothes dryer 1,670 (4%) 0 (0%) 40 (3%) $30 (2%)
Other known personal and
household equipment 990 (0%) 20 (4%) 40 (3%) $40 (3%)
Electronic and other electrical equipment 1,170 (3%) 10 (3%) 50 (4%) $50 (3%) Television 410 (1%) 0 (0%) 20 (2%) $20 (1%)
Other known electronic and other
electrical equipment 750 (0%) 10 (3%) 30 (2%) $30 (2%)
Shop tools and industrial equipment 290 (1%) 0 (0%) 10 (1%) $10 (1%) Other equipment involved in ignition 980 (2%) 10 (2%) 30 (2%) $50 (4%)
No equipment involved 1,160 (3%) 0 (1%) 30 (2%) $50 (4%)
Total 39,670 (100%) 420 (100%) 1,360 (100%) $1,370 (100%)
Note: Figures exclude confined fires which are fires reported as confined to fuel burner or boiler, chimney or flue, cooking vessel, trash,
incinerator, or commercial compactor. Fires, deaths, and injuries are rounded to the nearest ten, and direct property damage to the nearest
ten million dollars. Figures reflect a proportional share of home fires with factor contributing to ignition listed as unknown, unreported,
none, or blank. Totals may not equal sums because of rounding error.
Source: Data from NFIRS Version 5.0 and NFPA Fire Experience Survey.
Electrical Fires, 3/17 14 NFPA Research, Quincy, MA
Table 6. Home Fires Involving Electrical Failure or Malfunction as Factor Contributing to Ignition, by Area of Origin
2010-2014 Annual Averages
Area of Origin Fires Civilian Deaths
Civilian Injuries
Direct Property Damage (in Millions)
Bedroom 5,410 (14%) 80 (18%) 370 (27%) $210 (15%)
Attic or ceiling/roof
assembly or concealed space 4,730 (12%) 20 (6%) 60 (4%) $180 (13%)
Kitchen or cooking area 4,450 (11%) 50 (12%) 180 (13%) $120 (9%)
Wall assembly or concealed
space 2,850 (7%) 20 (4%) 60 (4%) $80 (6%)
Living room, family room or
den 2,440 (6%) 100 (24%) 180 (13%) $110 (8%)
Laundry room or area 2,230 (6%) 10 (2%) 60 (4%) $60 (4%)
Bathroom or lavatory 2,020 (5%) 10 (2%) 40 (3%) $40 (3%)
Exterior wall surface 1,720 (4%) 0 (1%) 20 (1%) $40 (3%)
Garage or vehicle storage
area 1,520 (4%) 10 (2%) 50 (4%) $110 (8%)
Unclassified function area 1,460 (4%) 30 (8%) 90 (7%) $60 (5%)
Crawl space or substructure
space 1,400 (4%) 10 (3%) 30 (3%) $40 (3%)
Ceiling/floor assembly or
concealed space 1,270 (3%) 20 (5%) 30 (2%) $50 (4%)
Heating equipment room 770 (2%) 0 (0%) 10 (1%) $20 (1%)
Unclassified structural area 710 (2%) 10 (2%) 20 (1%) $30 (2%)
Closet 690 (2%) 0 (1%) 20 (1%) $20 (2%)
Unclassified storage area 500 (1%) 0 (1%) 20 (1%) $20 (1%)
Duct for HVAC, cable,
exhaust, heating, or AC 490 (1%) 0 (0%) 10 (1%) $10 (1%)
Dining room, bar or beverage
area, cafeteria 400 (1%) 10 (2%) 10 (1%) $10 (1%)
Exterior balcony or
unenclosed porch 380 (1%) 10 (2%) 10 (1%) $20 (1%)
Unclassified outside area 370 (1%) 0 (0%) 10 (0%) $10 (1%)
Unclassified equipment or
service area 350 (1%) 0 (0%) 10 (1%) $10 (1%)
Conduit, pipe, utility, or
ventilation shaft 300 (1%) 0 (0%) 0 (0%) $10 (0%)
Storage room, area, tank, or
bin 250 (1%) 0 (0%) 0 (0%) $10 (1%)
Exterior roof surface 210 (1%) 0 (0%) 0 (0%) $10 (0%)
Storage of supplies or tools 210 (1%) 0 (1%) 10 (0%) $10 (1%)
Lobby or entrance way 210 (1%) 10 (2%) 10 (1%) $10 (1%)
Electrical Fires, 3/17 15 NFPA Research, Quincy, MA
Table 6. Home Fires Involving Electrical Failure or Malfunction as Factor Contributing to Ignition, by Area of Origin
2010-2014 Annual Averages (Continued)
Area of Origin Fires Civilian Deaths
Civilian Injuries
Direct Property Damage (in Millions)
Other known area of
origin 1,520 (4%) 10 (2%) 40 (3%) $60 (4%)
Total 39,670 (100%) 420 (100%) 1,360 (100%) $1,370 (100%)
Note: Figures exclude confined fires which are fires reported as confined to fuel burner or boiler, chimney or flue, cooking vessel, trash,
incinerator, or commercial compactor. Fires, deaths and injuries are rounded to the nearest ten and direct property damage to the nearest ten
million dollars. Figures reflect a proportional share of home fires with factor contributing to ignition listed as unknown, unreported, none,
or blank. Figures reflect a proportional share of home fires with factor contributing to ignition coded as electrical failure or malfunction and
area of origin shown as unknown or blank. Totals may not equal sums because of rounding error.
Source: Data from NFIRS Version 5.0 and NFPA Experience Survey.

Electrical Fires, 3/17 16 NFPA Research, Quincy, MA
Table 7. Home Fires Involving Electrical Failure or Malfunction as Factor Contributing to Ignition, by Item First Ignited
2010-2014 Annual Averages
Item First Ignited Fires Civilian Deaths
Civilian Injuries
Direct Property Damage (in Millions)
Electrical wire or cable insulation 12,460 (31%) 110 (27%) 360 (27%) $350 (25%)
Structural member or framing 6,200 (16%) 90 (20%) 150 (11%) $280 (20%)
Insulation within structural area 2,630 (7%) 0 (1%) 30 (2%) $60 (5%)
Interior wall covering. excluding
drapes 2,310 (6%) 20 (6%) 70 (5%) $90 (7%)
Appliance housing or casing 2,090 (5%) 10 (2%) 70 (5%) $50 (4%)
Exterior wall covering or finish 1,930 (5%) 10 (3%) 40 (3%) $60 (4%)
Unclassified structural component
or finish 1,550 (4%) 10 (3%) 50 (4%) $70 (5%)
Unclassified item first ignited 1,480 (4%) 0 (0%) 50 (4%) $40 (3%)
Interior ceiling cover or finish 1,000 (3%) 10 (3%) 20 (1%) $40 (3%)
Mattress or bedding 1,000 (3%) 10 (3%) 100 (7%) $40 (3%)
Floor covering, rug, carpet, or
mat 790 (2%) 20 (6%) 60 (5%) $30 (2%)
Clothing 660 (2%) 0 (1%) 40 (3%) $20 (2%)
Unclassified furniture or utensils 630 (2%) 20 (5%) 40 (3%) $30 (2%)
Cabinetry 630 (2%) 10 (2%) 20 (2%) $30 (2%)
Upholstered furniture or vehicle
seat 610 (2%) 40 (10%) 60 (4%) $30 (2%)
Multiple items first ignited 500 (1%) 20 (4%) 30 (2%) $40 (3%)
Unclassified soft goods or
wearing apparel 370 (1%) 0 (1%) 20 (2%) $10 (1%)
Exterior roof covering or finish 240 (1%) 0 (0%) 0 (0%) $10 (1%)
Curtains, blinds, drapery, tapestry 220 (1%) 0 (0%) 20 (2%) $10 (1%)
Dust, fiber, lint, including
sawdust or excelsior 200 (1%) 0 (0%) 0 (0%) $0 (0%)
Other known item first ignited 2,160 (5%) 20 (4%) 110 (8%) $70 (5%)
Total 39,670 (100%) 420 (100%) 1,360 (100%) $1,370 (100%)
Note: Figures exclude confined fires. Fires, deaths and injuries are rounded to the nearest ten and direct property damage to the nearest ten
million dollars. Figures reflect a proportional share of home fires with factor contributing to ignition listed as unknown, unreported, none,
or blank. Figures reflect a proportional share of home fires with factor contributing to ignition coded as electrical failure or malfunction
and item first ignited shown as unknown or blank. Totals may not equal sums because of rounding error.
Source: Data from NFIRS Version 5.0 and NFPA Experience Survey.

Electrical Fires, 3/17 17 NFPA Research, Quincy, MA
Table 8. Home Fires Involving Electrical Failure or Malfunction as a Factor Contributing to Ignition, by General Victim Location When Injured
2010-2014 Annual Averages
General Location When Injured Civilian Deaths
Civilian Injuries
In area of origin 160 (38%) 730 (54%)
In building, but not in area of origin 260 (62%) 530 (39%)
Outside, not in area of origin 0 (0%) 100 (7%)
Totals 420 (100%) 1,360 (100%)
Note: Figures exclude confined fires which are fires reported as confined to fuel burner or boiler, chimney or flue, cooking
vessel, trash, incinerator, or commercial compactor. Deaths and injuries are rounded to the nearest ten. Figures reflect a
proportional share of home fires with factor contributing to ignition listed as unknown, unreported, none, or blank. Figures
reflect a proportional share of home fires with factor contributing to ignition coded as electrical failure or malfunction and
victim location at ignition unknown or blank. Totals may not equal sums because of rounding error.
Source: Data from NFIRS Version 5.0 and NFPA Experience Survey.

Electrical Fires, 3/17 18 NFPA Research, Quincy, MA
Table 9. Home Fires Involving Electrical Failure or Malfunction as a Factor Contributing to Ignition, by Victim Activity When Injured
2010-2014 Annual Averages
Activity When Injured Civilian Deaths
Civilian Injuries
Sleeping 180 (42%) 170 (13%)
Escaping 170 (41%) 490 (36%)
Unable to act 30 (6%) 30 (2%)
Fire control 10 (3%) 350 (25%)
Rescue attempt 10 (3%) 100 (7%)
Irrational act 10 (2%) 10 (1%)
Returning to vicinity of fire before
control 10 (2%) 120 (8%)
Unclassified activity 0 (0%) 90 (7%)
Total 420 (100%) 1,360 (100%)
Note: Figures exclude confined fires which are fires reported as confined to fuel burner or boiler, chimney or flue, cooking
vessel, trash, incinerator, or commercial compactor. Deaths and injuries are rounded to the nearest ten. Figures reflect a
proportional share of home fires with factor contributing to ignition listed as unknown, unreported, none, or blank. Figures
include a proportional share of home fires with factor contributing to ignition coded as electrical failure or malfunction and
victim activity unknown or blank. Totals may not equal sums because of rounding error
Source: Data from NFIRS Version 5.0 and NFPA Experience Survey.

Electrical Fires, 3/17 19 NFPA Research, Quincy, MA
Section 2. Non-Home Electrical Fires
From 2010 through 2014, an estimated 16,070 non-home electrical fires (structure fires that involved some type of electrical failure or malfunction as a factor contributing to ignition) were reported to U.S. fire departments each year. These fires resulted in an estimated annual
average of 10 civilian deaths, 200 civilian injuries, and $610 million in direct property damage.
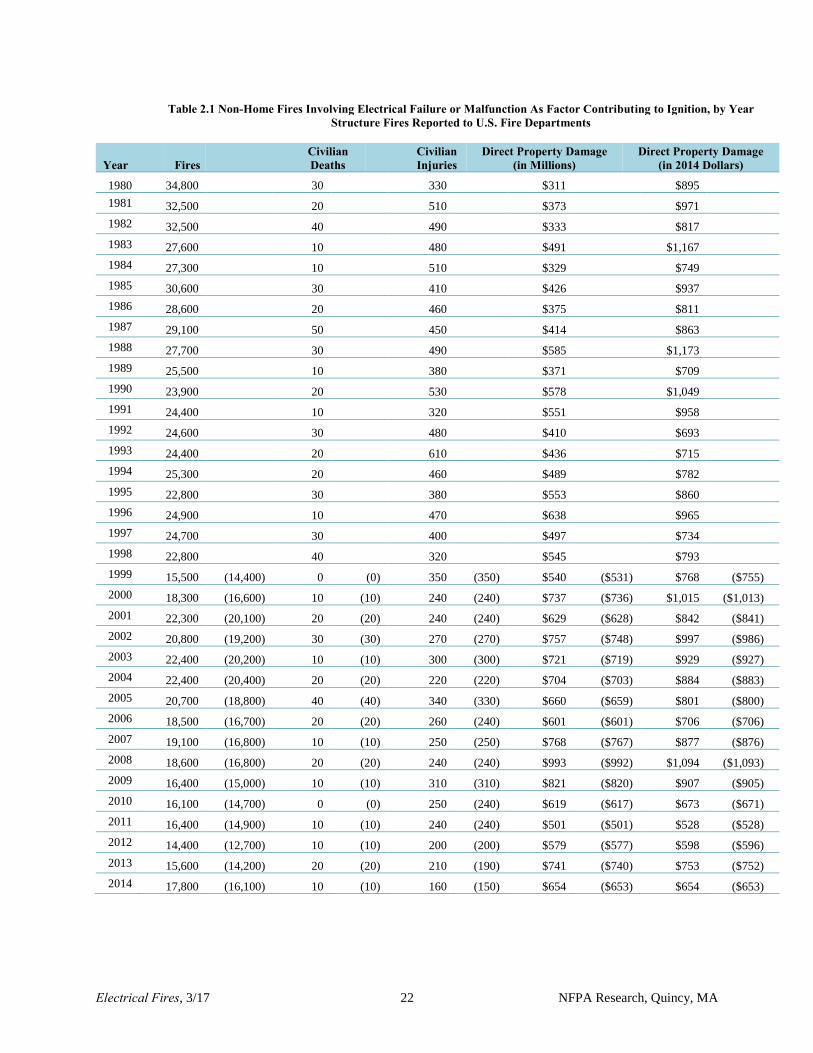
As shown in Figure 2.1 and Table 2.1, the number of non-home electrical fires has fallen
considerably since 1980, though the downward trend was arrested for most of the 1990s, then
again since 2009, although an estimated 14,400 non-home electrical fires in 2012 represented a
historic low point. Note that confined fires are included in these data.
Note: Because of low participation in NFIRS Version 5.0 during 1999-2001, data from these years is not reported in these tables.
See note for Table 2.1.
There is generally little specific information on the type of electrical failure or malfunction that was involved in non-home electrical fires. Over half (53%) of fires were reported as
unclassified electrical failure or malfunction, with another 22% reported as unspecified short-
circuit arc. Short-circuit arcs from defective or worn insulation accounted for 8% of fires and an
arc or spark form operating equipment accounted for 7% of fires, as well as 13% of civilian
injuries. Other types of failure or malfunction included arc from faulty contact or broken
conductor (4% of fires), short circuit arc from mechanical damage (3%), water caused short-
circuit arc (2%), and fluorescent light bulb (2%). Data are presented in Table 2.A.
34,800
14,400
17,800
0
5,000
10,000
15,000
20,000
25,000
30,000
35,000
40,000
Fir
es
Years
Figure 2.1. Annual Non-Home Structure Fires Involving Electrical Failure or
Malfunction as Factor Contributing to Ignition, 2010-2014

Electrical Fires, 3/17 20 NFPA Research, Quincy, MA
Table 2.A. Non-Home Fires Involving Electrical Failure or Malfunction as Factor Contributing to Ignition, 2010-2014 Annual Averages
Type of Electrical Failure or Malfunction Fires
Civilian Deaths
Civilian Injuries
Direct Property Damage (in Millions)
Unclassified electrical
failure or malfunction 8,530 (53%) 10 (87%) 90 (42%) $364 (59%)
Unspecified short-circuit
arc 3,530 (22%) 7 (22%) 60 (29%) $143 (23%)
Short circuit arc from
defective or worn
insulation 1,300 (8%) 1 (6%) 20 (8%) $36 (6%)
Arc or spark from
operating equipment 1,160 (7%) 0 (0%) 30 (13%) $34 (5%)
Arc from faulty contact or
broken conductor 610 (4%) 0 (0%) 10 (6%) $17 (3%)
Short circuit arc from
mechanical damage 560 (3%) 0 (0%) 0 (2%) $18 (3%)
Water caused short-circuit
arc 370 (2%) 0 (0%) 0 (2%) $7 (1%)
Fluorescent light bulb 330 (2%) 0 (0%) 0 (1%) $11 (2%)
Total fires 16,070 (100%) 12 (100%) 200 (100%) $614 (100%)
Total factors* 16,390 (102%) 12 (115%) 220 (102%) $630 (103%)
*Multiple entries are allowed, which can result in sums higher than total fires.
Note: Data in this table include non-confined and confined fires. Analyses were performed separately for non-confined and confined
fires. Fires and injuries are rounded to the nearest ten, deaths to the nearest one, and direct property damage to the nearest million
dollars. Figures reflect a proportional share of home fires with factor contributing to ignition reports as unknown, unreported, none, or
blank, with allocations performed separately for non-confined and confined fires. Totals may not equal sums due to rounding.
Source: NFIRS Version 5.0 and NFPA Fire Experience Survey.
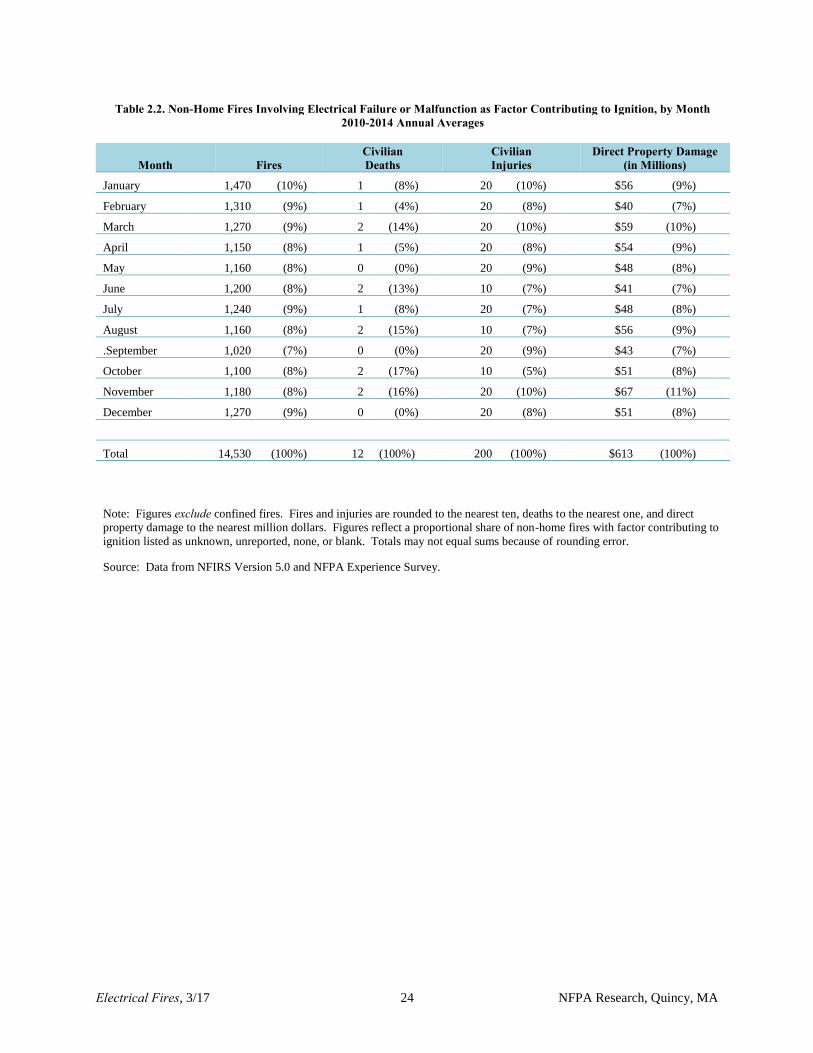
Timing of fires The greatest number of non-home fires involving electrical failure of malfunction occurred in
January, which accounted for 10% of fires. February, March, December and July each had 9%
shares of fires. The fewest fires occurred in September (7% of annual total). See Table 2.2.
Electrical fires were distributed fairly evenly by day of week, with each day of the week except
Sunday accounting for a 14% to 15% share of fires. See Table 2.3.
Figure 2.2 shows that the smallest share of non-home electrical fires by time of day occurred in
the period from midnight to 8 a.m., with 23% of fires. However, these fires accounted for the
highest share of civilian deaths (55%) and direct property damage. The hours from 8 a.m. to
4 p.m. accounted for the largest shares of fires (40%) and civilian injuries (48%), as well as
smallest shares of civilian deaths (13%) and direct property damage (30%). The period from
4 p.m. to midnight accounted for 36% of fires, 32% of civilian deaths, 28% of civilian injuries,
and 33% of direct property damage. Also see Table 2.4.
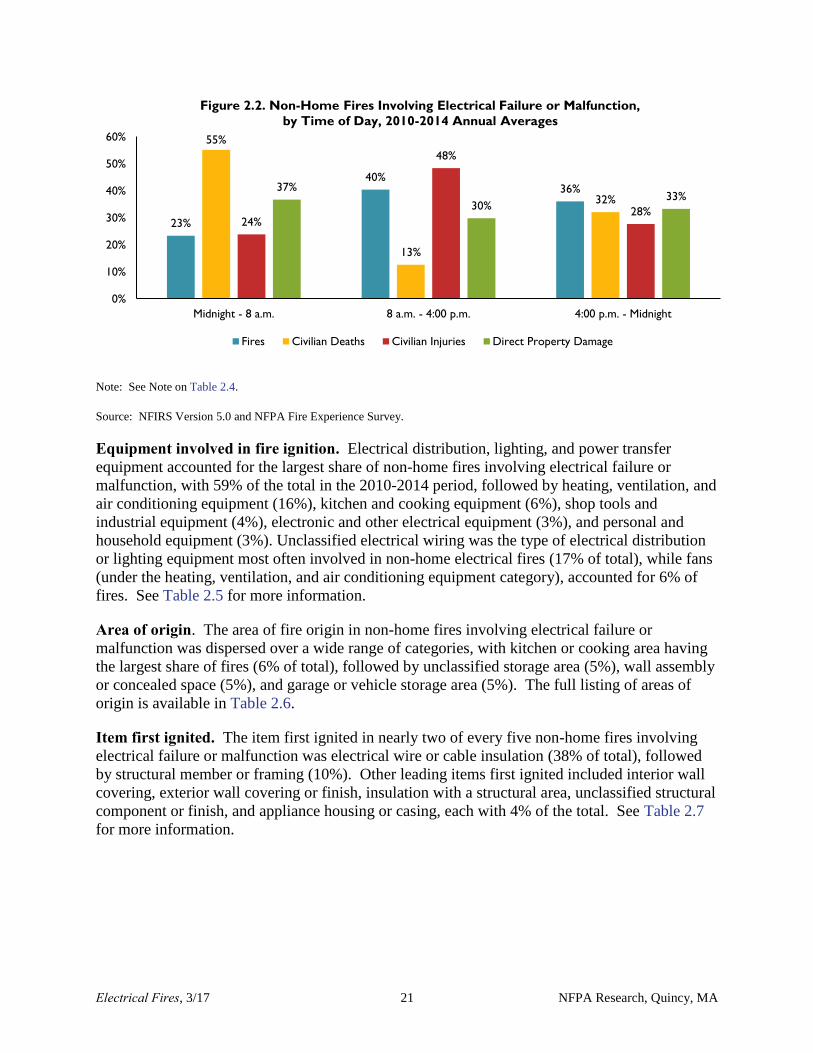
Electrical Fires, 3/17 21 NFPA Research, Quincy, MA
Note: See Note on Table 2.4.
Source: NFIRS Version 5.0 and NFPA Fire Experience Survey.
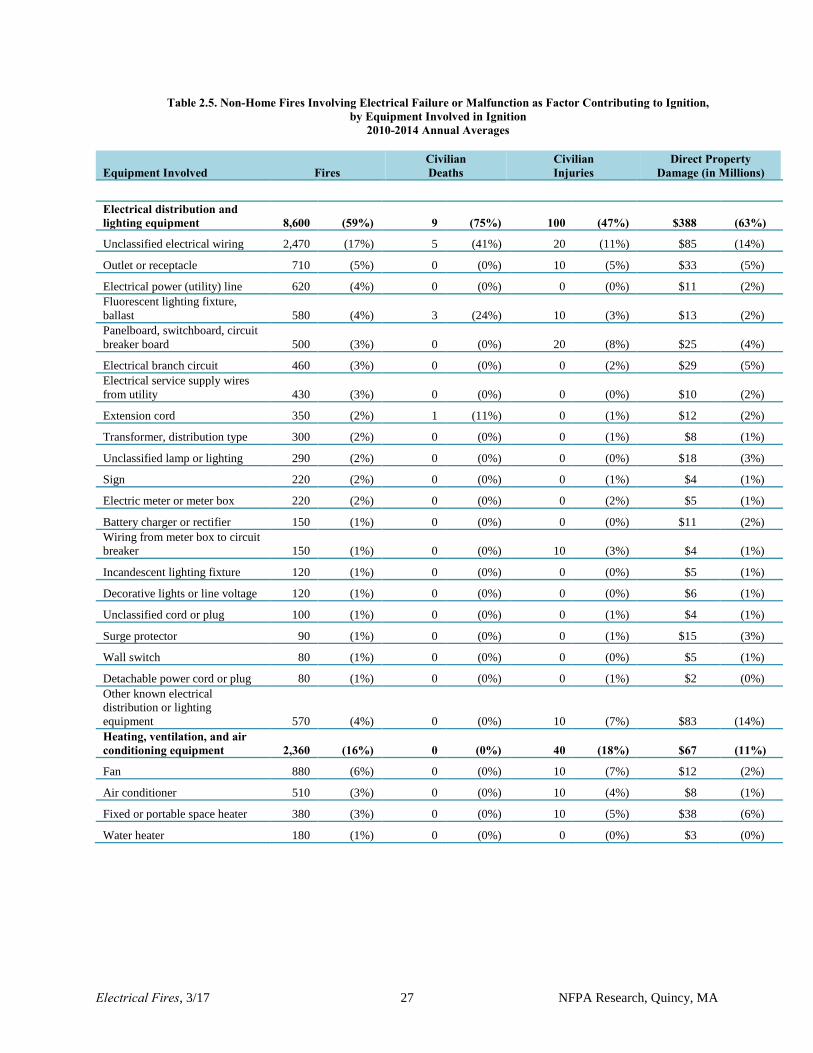
Equipment involved in fire ignition. Electrical distribution, lighting, and power transfer
equipment accounted for the largest share of non-home fires involving electrical failure or
malfunction, with 59% of the total in the 2010-2014 period, followed by heating, ventilation, and
air conditioning equipment (16%), kitchen and cooking equipment (6%), shop tools and
industrial equipment (4%), electronic and other electrical equipment (3%), and personal and
household equipment (3%). Unclassified electrical wiring was the type of electrical distribution
or lighting equipment most often involved in non-home electrical fires (17% of total), while fans
(under the heating, ventilation, and air conditioning equipment category), accounted for 6% of
fires. See Table 2.5 for more information.
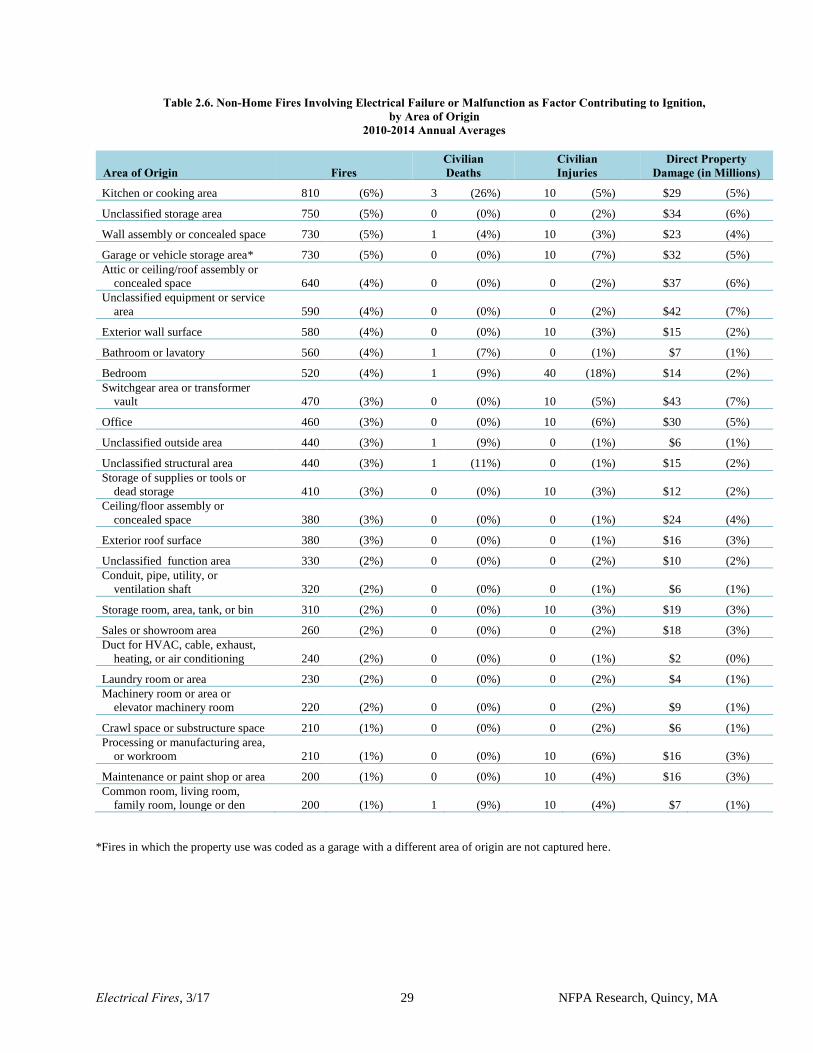
Area of origin. The area of fire origin in non-home fires involving electrical failure or
malfunction was dispersed over a wide range of categories, with kitchen or cooking area having
the largest share of fires (6% of total), followed by unclassified storage area (5%), wall assembly
or concealed space (5%), and garage or vehicle storage area (5%). The full listing of areas of
origin is available in Table 2.6.
Item first ignited. The item first ignited in nearly two of every five non-home fires involving
electrical failure or malfunction was electrical wire or cable insulation (38% of total), followed
by structural member or framing (10%). Other leading items first ignited included interior wall
covering, exterior wall covering or finish, insulation with a structural area, unclassified structural
component or finish, and appliance housing or casing, each with 4% of the total. See Table 2.7
for more information.
23%
40%36%
55%
13%
32%
24%
48%
28%
37%
30%33%
0%
10%
20%
30%
40%
50%
60%
Midnight - 8 a.m. 8 a.m. - 4:00 p.m. 4:00 p.m. - Midnight
Figure 2.2. Non-Home Fires Involving Electrical Failure or Malfunction,
by Time of Day, 2010-2014 Annual Averages
Fires Civilian Deaths Civilian Injuries Direct Property Damage
Electrical Fires, 3/17 22 NFPA Research, Quincy, MA
Table 2.1 Non-Home Fires Involving Electrical Failure or Malfunction As Factor Contributing to Ignition, by Year Structure Fires Reported to U.S. Fire Departments
Year Fires Civilian Deaths
Civilian Injuries
Direct Property Damage (in Millions)
Direct Property Damage (in 2014 Dollars)
1980 34,800 30 330 $311 $895
1981 32,500 20 510 $373 $971
1982 32,500 40 490 $333 $817
1983 27,600 10 480 $491 $1,167
1984 27,300 10 510 $329 $749
1985 30,600 30 410 $426 $937
1986 28,600 20 460 $375 $811
1987 29,100 50 450 $414 $863
1988 27,700 30 490 $585 $1,173
1989 25,500 10 380 $371 $709
1990 23,900 20 530 $578 $1,049
1991 24,400 10 320 $551 $958
1992 24,600 30 480 $410 $693
1993 24,400 20 610 $436 $715
1994 25,300 20 460 $489 $782
1995 22,800 30 380 $553 $860
1996 24,900 10 470 $638 $965
1997 24,700 30 400 $497 $734
1998 22,800 40 320 $545 $793
1999 15,500 (14,400) 0 (0) 350 (350) $540 ($531) $768 ($755)
2000 18,300 (16,600) 10 (10) 240 (240) $737 ($736) $1,015 ($1,013)
2001 22,300 (20,100) 20 (20) 240 (240) $629 ($628) $842 ($841)
2002 20,800 (19,200) 30 (30) 270 (270) $757 ($748) $997 ($986)
2003 22,400 (20,200) 10 (10) 300 (300) $721 ($719) $929 ($927)
2004 22,400 (20,400) 20 (20) 220 (220) $704 ($703) $884 ($883)
2005 20,700 (18,800) 40 (40) 340 (330) $660 ($659) $801 ($800)
2006 18,500 (16,700) 20 (20) 260 (240) $601 ($601) $706 ($706)
2007 19,100 (16,800) 10 (10) 250 (250) $768 ($767) $877 ($876)
2008 18,600 (16,800) 20 (20) 240 (240) $993 ($992) $1,094 ($1,093)
2009 16,400 (15,000) 10 (10) 310 (310) $821 ($820) $907 ($905)
2010 16,100 (14,700) 0 (0) 250 (240) $619 ($617) $673 ($671)
2011 16,400 (14,900) 10 (10) 240 (240) $501 ($501) $528 ($528)
2012 14,400 (12,700) 10 (10) 200 (200) $579 ($577) $598 ($596)
2013 15,600 (14,200) 20 (20) 210 (190) $741 ($740) $753 ($752)
2014 17,800 (16,100) 10 (10) 160 (150) $654 ($653) $654 ($653)

Electrical Fires, 3/17 23 NFPA Research, Quincy, MA
Table 2.1 Non-Home Fires Involving Electrical Failure or Malfunction As Factor Contributing to Ignition, by Year Structure Fires Reported to U.S. Fire Departments
Note: Figures in parentheses exclude confined fires, which are fires reported as confined to fuel burner or boiler, chimney or flue, cooking
vessel, trash, incinerator, or commercial compactor. These are national estimates of fires reported to U.S. municipal fire departments and
so exclude fires reported to only federal or state agencies or industrial fire brigades. National estimates are projections. Casualty and loss
projections can be heavily influenced by the inclusion or exclusion of a small number of unusually serious fires. Fires are rounded to the
nearest hundred, civilian deaths and injuries to the nearest ten, and direct property damage to the nearest million dollars. Figures for 1980-
1998 are based on ignition factor 54-55 and reflect a proportional share of home fires with ignition factor unknown, unreported, none, or
blank. Figures for 1999 and later years reflect a proportional share of non-home fires with factor contributing to ignition as unknown,
unreported, none, or blank. Because of low participation in NFIRS Version 5.0 during 1999-2001, estimates for these years are highly
uncertain and must be used with caution. Inflation adjustment to 2014 dollars is calculated using the Consumer Price Index.
Source: NFIRS (Version 5.0 after 1998) and NFPA Fire Experience Survey.
Electrical Fires, 3/17 24 NFPA Research, Quincy, MA
Table 2.2. Non-Home Fires Involving Electrical Failure or Malfunction as Factor Contributing to Ignition, by Month 2010-2014 Annual Averages
Month Fires Civilian Deaths
Civilian Injuries
Direct Property Damage (in Millions)
January 1,470 (10%) 1 (8%) 20 (10%) $56 (9%)
February 1,310 (9%) 1 (4%) 20 (8%) $40 (7%)
March 1,270 (9%) 2 (14%) 20 (10%) $59 (10%)
April 1,150 (8%) 1 (5%) 20 (8%) $54 (9%)
May 1,160 (8%) 0 (0%) 20 (9%) $48 (8%)
June 1,200 (8%) 2 (13%) 10 (7%) $41 (7%)
July 1,240 (9%) 1 (8%) 20 (7%) $48 (8%)
August 1,160 (8%) 2 (15%) 10 (7%) $56 (9%)
.September 1,020 (7%) 0 (0%) 20 (9%) $43 (7%)
October 1,100 (8%) 2 (17%) 10 (5%) $51 (8%)
November 1,180 (8%) 2 (16%) 20 (10%) $67 (11%)
December 1,270 (9%) 0 (0%) 20 (8%) $51 (8%)
Total 14,530 (100%) 12 (100%) 200 (100%) $613 (100%)
Note: Figures exclude confined fires. Fires and injuries are rounded to the nearest ten, deaths to the nearest one, and direct
property damage to the nearest million dollars. Figures reflect a proportional share of non-home fires with factor contributing to
ignition listed as unknown, unreported, none, or blank. Totals may not equal sums because of rounding error.
Source: Data from NFIRS Version 5.0 and NFPA Experience Survey.

Electrical Fires, 3/17 25 NFPA Research, Quincy, MA
Table 2.3. Non-Home Fires Involving Electrical Failure or Malfunction as Factor Contributing to Ignition, by Day of Week
2010-2014 Annual Averages
Day of Week Fires Civilian Deaths
Civilian Injuries
Direct Property Damage (in Millions)
Sunday 1,890 (13%) 2 (14%) 30 (15%) $94 (15%)
Monday 2,160 (15%) 0 (0%) 30 (15%) $81 (13%)
Tuesday 2,120 (15%) 3 (25%) 30 (15%) $96 (16%)
Wednesday 2,130 (15%) 1 (6%) 30 (15%) $115 (18%)
Thursday 2,090 (14%) 1 (9%) 30 (15%) $75 (11%)
Friday 2,100 (14%) 1 (12%) 30 (15%) $80 (13%)
Saturday 2,040 (14%) 4 (35%) 30 (15%) $72 (11%)
Total 14,530 (100%) 12 (100%) 200 (100%) $613 (100%)
Note: Figures exclude confined fires. Fires and injuries are rounded to the nearest ten, deaths to the nearest one, and direct property
damage to the nearest million dollars. Figures reflect a proportional share of non-home fires with factor contributing to ignition listed
as unknown, unreported, none, or blank. Totals may not equal sums because of rounding error.
Source: Data from NFIRS Version 5.0 and NFPA Experience Survey.

Electrical Fires, 3/17 26 NFPA Research, Quincy, MA
Table 2.4. Non-Home Fires Involving Electrical Failure or Malfunction as Factor Contributing to Ignition, by Alarm Time
2010-2014 Annual Averages
Alarm Time Fires Civilian Deaths
Civilian Injuries
Direct Property Damage (in Millions)
Midnight-12:59 a.m. 450 (3%) 2 (16%) 0 (2%) $31 (5%)
1:00-1:59 a.m. 399 (3%) 0 (0%) 0 (2%) $30 (5%)
2:00-2:59 a.m. 371 (3%) 2 (18%) 10 (6%) $30 (5%)
3:00-3:59 a.m. 373 (3%) 1 (8%) 0 (1%) $39 (6%)
4:00-4:59 a.m. 374 (3%) 0 (0%) 0 (1%) $31 (5%)
5:00-5:59 a.m. 379 (3%) 1 (4%) 10 (5%) $21 (3%)
6:00-6:59 a.m. 483 (3%) 1 (4%) 0 (2%) $23 (4%)
7:00-7:59 a.m. 574 (4%) 1 (4%) 10 (5%) $21 (3%)
8:00-8:59 a.m. 645 (4%) 0 (0%) 20 (10%) $21 (3%)
9:00-9:59 a.m. 685 (5%) 0 (0%) 10 (5%) $21 (3%)
10:00-10:59 a.m. 710 (5%) 0 (0%) 10 (5%) $19 (3%)
11:00-11:59 a.m. 767 (5%) 0 (0%) 10 (6%) $30 (5%)
12:00-12:59 p.m. 741 (5%) 1 (5%) 10 (4%) $20 (3%)
1:00-1:59 p.m. 810 (6%) 0 (0%) 20 (10%) $19 (3%)
2:00-2:59 p.m. 762 (5%) 1 (8%) 10 (5%) $31 (5%)
3:00-3:59 p.m. 759 (5%) 0 (0%) 10 (5%) $21 (4%)
4:00-4:59 p.m. 763 (5%) 0 (0%) 10 (3%) $21 (3%)
5:00-5:59 p.m. 730 (5%) 0 (0%) 10 (4%) $20 (3%)
6:00-6:59 p.m. 692 (5%) 0 (0%) 10 (3%) $40 (7%)
7:00-7:59 p.m. 721 (5%) 0 (0%) 10 (5%) $20 (3%)
8:00-8:59 p.m. 679 (5%) 0 (0%) 0 (2%) $29 (5%)
9:00-9:59 p.m. 621 (4%) 1 (6%) 10 (5%) $22 (4%)
10:00-10:59 p.m. 562 (4%) 2 (13%) 10 (4%) $24 (4%)
11:00-11:59 p.m. 481 (3%) 2 (13%) 0 (1%) $28 (5%)
Total 14,530 (100%) 12 (100%) 200 (100%) $613 (100%)
Note: Figures exclude confined fires. Fires and injuries are rounded to the nearest ten, deaths to the nearest one, and direct property
damage to the nearest million dollars. Figures reflect a proportional share of non-home fires with factor contributing to ignition listed
as unknown, unreported, none, or blank. Totals may not equal sums because of rounding error.
Source: Data from NFIRS Version 5.0 and NFPA Experience Survey.
Electrical Fires, 3/17 27 NFPA Research, Quincy, MA
Table 2.5. Non-Home Fires Involving Electrical Failure or Malfunction as Factor Contributing to Ignition, by Equipment Involved in Ignition
2010-2014 Annual Averages
Equipment Involved Fires Civilian Deaths
Civilian Injuries
Direct Property Damage (in Millions)
Electrical distribution and lighting equipment 8,600 (59%) 9 (75%) 100 (47%) $388 (63%)
Unclassified electrical wiring 2,470 (17%) 5 (41%) 20 (11%) $85 (14%)
Outlet or receptacle 710 (5%) 0 (0%) 10 (5%) $33 (5%)
Electrical power (utility) line 620 (4%) 0 (0%) 0 (0%) $11 (2%)
Fluorescent lighting fixture,
ballast 580 (4%) 3 (24%) 10 (3%) $13 (2%)
Panelboard, switchboard, circuit
breaker board 500 (3%) 0 (0%) 20 (8%) $25 (4%)
Electrical branch circuit 460 (3%) 0 (0%) 0 (2%) $29 (5%)
Electrical service supply wires
from utility 430 (3%) 0 (0%) 0 (0%) $10 (2%)
Extension cord 350 (2%) 1 (11%) 0 (1%) $12 (2%)
Transformer, distribution type 300 (2%) 0 (0%) 0 (1%) $8 (1%)
Unclassified lamp or lighting 290 (2%) 0 (0%) 0 (0%) $18 (3%)
Sign 220 (2%) 0 (0%) 0 (1%) $4 (1%)
Electric meter or meter box 220 (2%) 0 (0%) 0 (2%) $5 (1%)
Battery charger or rectifier 150 (1%) 0 (0%) 0 (0%) $11 (2%)
Wiring from meter box to circuit
breaker 150 (1%) 0 (0%) 10 (3%) $4 (1%)
Incandescent lighting fixture 120 (1%) 0 (0%) 0 (0%) $5 (1%)
Decorative lights or line voltage 120 (1%) 0 (0%) 0 (0%) $6 (1%)
Unclassified cord or plug 100 (1%) 0 (0%) 0 (1%) $4 (1%)
Surge protector 90 (1%) 0 (0%) 0 (1%) $15 (3%)
Wall switch 80 (1%) 0 (0%) 0 (0%) $5 (1%)
Detachable power cord or plug 80 (1%) 0 (0%) 0 (1%) $2 (0%)
Other known electrical
distribution or lighting
equipment 570 (4%) 0 (0%) 10 (7%) $83 (14%)
Heating, ventilation, and air conditioning equipment 2,360 (16%) 0 (0%) 40 (18%) $67 (11%)
Fan 880 (6%) 0 (0%) 10 (7%) $12 (2%)
Air conditioner 510 (3%) 0 (0%) 10 (4%) $8 (1%)
Fixed or portable space heater 380 (3%) 0 (0%) 10 (5%) $38 (6%)
Water heater 180 (1%) 0 (0%) 0 (0%) $3 (0%)

Electrical Fires, 3/17 28 NFPA Research, Quincy, MA
Table 2.5. Non-Home Fires Involving Electrical Failure or Malfunction as Factor Contributing to Ignition, by Equipment Involved in Ignition
2010-2014 Annual Averages (Continued)
Equipment Involved Fires Civilian Deaths
Civilian Injuries
Direct Property Damage (in Millions)
Heat lamp 140 (1%) 0 (0%) 0 (0%) $2 (0%)
Other known heating,
ventilation, and air conditioning
equipment 280 (2%) 0 (0%) 0 (2%) $4 (1%)
Kitchen and cooking equipment 930 (6%) 3 (25%) 10 (6%) $34 (6%) Refrigerator or refrigerator
freezer 400 (3%) 3 (25%) 0 (0%) $16 (3%)
Freezer when separate from
refrigerator 110 (1%) 0 (0%) 0 (1%) $6 (1%)
Other known kitchen and
cooking equipment 420 (3%) 0 (0%) 10 (5%) $12 (2%)
Shop tools and industrial equipment 650 (4%) 0 (0%) 20 (8%) $61 (10%)
Torch, burner, soldering iron 100 (1%) 0 (0%) 0 (1%) $5 (1%)
Air compressor 100 (1%) 0 (0%) 0 (0%) $6 (1%)
Other known 460 (3%) 0 (0%) 20 (7%) $50 (8%)
Electronic and other electrical equipment 480 (3%) 0 (0%) 0 (2%) $15 (2%)
Computer 110 (1%) 0 (0%) 0 (0%) $3 (0%)
Other electronic and other
electrical equipment 370 (3%) 0 (0%) 0 (2%) $12 (2%)
Personal and household equipment 420 (3%) 0 (0%) 10 (4%) $9 (1%)
Clothes dryer 200 (1%) 0 (0%) 0 (2%) $2 (0%)
Other known personal and
household equipment 220 (2%) 0 (0%) 10 (2%) $6 (1%)
Commercial and medical equipment 160 (1%) 0 (0%) 10 (5%) $3 (1%) Garden tools and agricultural equipment 120 (1%) 0 (0%) 0 (1%) $10 (2%) Unclassified equipment involved in ignition 480 (3%) 0 (0%) 10 (7%) $18 (3%)
None 310 (2%) 0 (0%) 0 (2%) $9 (1%)
Total 14,530 (100%) 12 (100%) 200 (100%) $613 (100%)
Note: Figures exclude confined fires. Fires and injuries are rounded to the nearest ten, deaths to the nearest one, and direct property damage
to the nearest million dollars. Damage has not been adjusted for inflation. Figures reflect a proportional share of non-home fires with factor
contributing to ignition listed as unknown, unreported, none, or blank. Figures reflect a proportional share of non-home fires with factor
contributing to ignition coded as electrical failure or malfunction and equipment involved in ignition as unknown or blank. Totals may not
equal sums because of rounding error.
Source: Data from NFIRS Version 5.0 and NFPA Experience Survey.
Electrical Fires, 3/17 29 NFPA Research, Quincy, MA
Table 2.6. Non-Home Fires Involving Electrical Failure or Malfunction as Factor Contributing to Ignition, by Area of Origin
2010-2014 Annual Averages
Area of Origin Fires Civilian Deaths
Civilian Injuries
Direct Property Damage (in Millions)
Kitchen or cooking area 810 (6%) 3 (26%) 10 (5%) $29 (5%)
Unclassified storage area 750 (5%) 0 (0%) 0 (2%) $34 (6%)
Wall assembly or concealed space 730 (5%) 1 (4%) 10 (3%) $23 (4%)
Garage or vehicle storage area* 730 (5%) 0 (0%) 10 (7%) $32 (5%)
Attic or ceiling/roof assembly or
concealed space 640 (4%) 0 (0%) 0 (2%) $37 (6%)
Unclassified equipment or service
area 590 (4%) 0 (0%) 0 (2%) $42 (7%)
Exterior wall surface 580 (4%) 0 (0%) 10 (3%) $15 (2%)
Bathroom or lavatory 560 (4%) 1 (7%) 0 (1%) $7 (1%)
Bedroom 520 (4%) 1 (9%) 40 (18%) $14 (2%)
Switchgear area or transformer
vault 470 (3%) 0 (0%) 10 (5%) $43 (7%)
Office 460 (3%) 0 (0%) 10 (6%) $30 (5%)
Unclassified outside area 440 (3%) 1 (9%) 0 (1%) $6 (1%)
Unclassified structural area 440 (3%) 1 (11%) 0 (1%) $15 (2%)
Storage of supplies or tools or
dead storage 410 (3%) 0 (0%) 10 (3%) $12 (2%)
Ceiling/floor assembly or
concealed space 380 (3%) 0 (0%) 0 (1%) $24 (4%)
Exterior roof surface 380 (3%) 0 (0%) 0 (1%) $16 (3%)
Unclassified function area 330 (2%) 0 (0%) 0 (2%) $10 (2%)
Conduit, pipe, utility, or
ventilation shaft 320 (2%) 0 (0%) 0 (1%) $6 (1%)
Storage room, area, tank, or bin 310 (2%) 0 (0%) 10 (3%) $19 (3%)
Sales or showroom area 260 (2%) 0 (0%) 0 (2%) $18 (3%)
Duct for HVAC, cable, exhaust,
heating, or air conditioning 240 (2%) 0 (0%) 0 (1%) $2 (0%)
Laundry room or area 230 (2%) 0 (0%) 0 (2%) $4 (1%)
Machinery room or area or
elevator machinery room 220 (2%) 0 (0%) 0 (2%) $9 (1%)
Crawl space or substructure space 210 (1%) 0 (0%) 0 (2%) $6 (1%)
Processing or manufacturing area,
or workroom 210 (1%) 0 (0%) 10 (6%) $16 (3%)
Maintenance or paint shop or area 200 (1%) 0 (0%) 10 (4%) $16 (3%)
Common room, living room,
family room, lounge or den 200 (1%) 1 (9%) 10 (4%) $7 (1%)
*Fires in which the property use was coded as a garage with a different area of origin are not captured here.

Electrical Fires, 3/17 30 NFPA Research, Quincy, MA
Table 2.6. Non-Home Fires Involving Electrical Failure or Malfunction as Factor Contributing to Ignition, by Area of Origin
2010-2014 Annual Averages (Continued)
Area of Origin Fires Civilian Deaths
Civilian Injuries
Direct Property Damage (in Millions)
Heating equipment room 190 (1%) 0 (0%) 0 (0%) $5 (1%)
Small assembly area 130 (1%) 0 (0%) 0 (0%) $3 (1%)
Unclassified service facility 130 (1%) 0 (0%) 0 (2%) $4 (1%)
Engine area, running gear or
wheel area vehicle 130 (1%) 0 (0%) 0 (0%) $6 (1%)
Lobby or entrance way 120 (1%) 0 (0%) 0 (0%) $7 (1%)
Unclassified assembly or sales
area 120 (1%) 0 (0%) 0 (0%) $3 (1%)
Closet 110 (1%) 0 (0%) 0 (0%) $2 (0%)
Dining room, bar or beverage
area, cafeteria 100 (1%) 0 (0%) 0 (1%) $3 (1%)
Hallway, corridor, mall 100 (1%) 1 (10%) 0 (1%) $2 (0%)
Awning 100 (1%) 0 (0%) 0 (0%) $1 (0%)
Unclassified vehicle area 90 (1%) 0 (0%) 0 (0%) $6 (1%)
On or near highway, public way
or street 90 (1%) 0 (0%) 0 (0%) $0 (0%)
Operating room 10 (0%) 0 (0%) 0 (0%) $0 (0%)
Computer room, control room or
center 80 (1%) 0 (0%) 0 (1%) $8 (1%)
Shipping, receiving or loading
area 70 (0%) 0 (0%) 0 (1%) $18 (3%)
Unclassified area of origin 440 (3%) 1 (9%) 0 (0%) $9 (1%)
Other known area of origin 1,240 (9%) 1 (5%) 10 (7%) $54 (9%)
Total 14,530 (100%) 12 (100%) 200 (100%) $613 (100%)
Note: Figures exclude confined fires. Fires and injuries are rounded to the nearest ten, deaths to the nearest one, and direct property
damage to the nearest million dollars. Damage has not been adjusted for inflation. Figures reflect a proportional share of non-home fires
with factor contributing to ignition listed as unknown, unreported, none, or blank. Figures reflect a proportional share of non-home fires
with factor contributing to ignition coded as electrical failure or malfunction and area of origin as unknown or blank. Totals may not
equal sums because of rounding error.
Source: Data from NFIRS Version 5.0 and NFPA Experience Survey.

Electrical Fires, 3/17 31 NFPA Research, Quincy, MA
Table 2.7. Non-Home Fires Involving Electrical Failure or Malfunction as Factor Contributing to Ignition, by Item First Ignited
2010-2014 Annual Averages
Item First Ignited Fires Civilian Deaths
Civilian Injuries
Direct Property Damage (in Millions)
Electrical wire or cable insulation 5,500 (38%) 1 (6%) 60 (31%) $176 (29%)
Structural member or framing 1,480 (10%) 0 (0%) 10 (4%) $72 (12%)
Interior wall covering, excluding
drapes 610 (4%) 1 (8%) 10 (4%) $36 (6%)
Exterior wall covering or finish 610 (4%) 0 (0%) 0 (2%) $22 (4%)
Insulation within structural area 540 (4%) 1 (12%) 0 (2%) $15 (2%)
Unclassified structural component
or finish 530 (4%) 3 (30%) 10 (3%) $23 (4%)
Appliance housing or casing 520 (4%) 0 (0%) 10 (3%) $10 (2%)
Flammable or combustible liquid
or gas, piping or filter 430 (3%) 0 (0%) 30 (15%) $40 (6%)
Interior ceiling cover or finish 370 (3%) 0 (0%) 0 (1%) $25 (4%)
Exterior roof covering or finish 270 (2%) 0 (0%) 0 (1%) $17 (3%)
Transformer or transformer fluids 250 (2%) 0 (0%) 0 (1%) $7 (1%)
Multiple items first ignited 230 (2%) 0 (0%) 10 (3%) $19 (3%)
Floor covering, rug, carpet, or
mat 140 (1%) 0 (0%) 0 (1%) $5 (1%)
Box, carton, bag, basket, barrel 140 (1%) 0 (0%) 0 (1%) $18 (3%)
Dust, fiber, lint, including
sawdust or excelsior 130 (1%) 0 (0%) 0 (2%) $11 (2%)
Sign, including outdoor signs
such as billboards 120 (1%) 0 (0%) 0 (0%) $1 (0%)
Light vegetation including grass 120 (1%) 0 (0%) 0 (0%) $3 (0%)
Cabinetry 120 (1%) 0 (0%) 0 (1%) $5 (1%)
Unclassified furniture or utensils 120 (1%) 0 (0%) 0 (2%) $6 (1%)
Unclassified storage supplies 110 (1%) 0 (0%) 0 (1%) $5 (1%)
Mattress or bedding 100 (1%) 1 (11%) 10 (4%) $3 (0%)
Unclassified organic materials 100 (1%) 0 (0%) 0 (0%) $5 (1%)
Upholstered furniture or vehicle
seat 90 (1%) 1 (11%) 10 (4%) $5 (1%)
Fence or pole 90 (1%) 0 (0%) 0 (0%) $0 (0%)
Unclassified item first ignited 910 (6%) 1 (11%) 10 (4%) $36 (6%)
Other known item first ignited 880 (6%) 1 (12%) 30 (13%) 48 (8%)
Total 14,530 (100%) 12 (100%) 200 (100%) $610 (100%)
Note: Figures exclude confined fires. Fires, deaths, and injuries are rounded to the nearest ten and direct property damage to the nearest
million dollars. Damage has not been adjusted for inflation. Figures reflect a proportional share of non-home fires with factor contributing to
ignition listed as unknown, unreported, none, or blank. Figures reflect a proportional share of non-home fires with factor contributing to
ignition coded as electrical failure or malfunction and item first ignited as unknown or blank. Totals may not equal sums because of rounding
error.
Source: Data from NFIRS Version 5.0 and NFPA Experience Survey.

Electrical Fires, 3/17 32 NFPA Research, Quincy, MA
Section 3: Home Fires Involving Electrical Distribution or Lighting Equipment___
In the five-year period from 2010 to 2014, there were an estimated average of 31,960 non-confined home structure fires involving electrical distribution or lighting equipment in the U.S. each year. These fires resulted in an estimated 400 civilian deaths, 1,180 civilian injuries,
and $1.2 billion in direct property damage each year. Note that these are fires in which electrical
distribution or lighting equipment was involved in ignition and this involvement does not
necessarily indicate electrical failure or malfunction.
Electrical distribution or lighting equipment was involved in 9% of home structure fires in 2010-
2014, according to the 2016 NFPA report, Home Structure Fires, by Marty Ahrens. These fires
accounted for 16% of associated civilian deaths, 9% of civilian injuries, and 18% of direct
property damage.
As shown in Figure 3.1 (and Table 3.1), home fires involving electrical distribution or lighting
equipment showed a steady downward trend between 1980 and 1998, declining by about one-
third during this period. Following the introduction of a new version of NFIRS (NFIRS 5.0) and
a transition period of 1999-2001, the downward trend was arrested and has even reversed since
2011, although fires are still well below those reported prior to 1999. Note that changes in the
National Fire Incident Reporting System (NFIRS), the source of detailed information about fires,
may have played a role. See note on page 2.
Note: Because of low participation in NFIRS Version 5.0 during 1999-2001, data from these years is not reported in these tables.
See Note on Table 3.1.
NFIRS designates several major sub-groups of electrical distribution or lighting equipment:
wiring and related equipment; lamps, light fixtures, light bulbs, and signs; cords and plugs;
transformers and power supplies (including surge protectors); electric fences; and, lightning rods
and lightning arresters. Electric fences and lightning rods and lightning arresters account for too
few fires to support detailed analysis and are not included in the discussion. In addition, because
confined fires in 2010-2014 were not a major part of fires involving electrical distribution and
lighting equipment – 500 confined fires resulted in just $0.1 million in direct property damage
and no civilian deaths or injuries -- the analysis in this section is restricted to non-confined fires.
68,400
44,500
19,200
37,900
0
10,000
20,000
30,000
40,000
50,000
60,000
70,000
80,000
Fir
es
Years
Figure 3.1. Home Structure Fires Involving Electrical Distribution
or Lighting Equipment, by Year

Electrical Fires, 3/17 33 NFPA Research, Quincy, MA
Table 3.A shows that wiring and related equipment accounted for an estimated 22,190 home
structure fires (69%) involving electrical distribution or lighting equipment in 2010-2014. These
fires were associated with 56% of civilian deaths, 53% of civilian injuries; and 66% of direct
property damage. Lamps, light fixtures, and light bulbs accounted for 15% of fires, with another
10% of fires involving cords and plugs and 5% involving transformers and power supplies. The
10% of fires involving cords and plugs accounted for 28% of civilian deaths and 20% of civilian
injuries.
Table 3.A. Home Fires Involving Electrical Distribution or Lighting Equipment, Major Equipment Group 2010-2014 Annual Averages
Major Equipment Group Fires Civilian Deaths
Civilian Injuries
Direct Property Damage (in Millions)
Wiring and related equipment 22,190 (69%) 230 (56%) 630 (53%) $804 (66%)
Lamps, light fixtures, and light
bulbs 4,920 (15%) 50 (13%) 220 (19%) $166 (14%)
Cords and plugs 3,070 (10%) 110 (28%) 230 (20%) $141 (12%)
Transformers and power supplies 1,760 (5%) 10 (3%) 100 (9%) $99 (8%)
Other known electrical
distribution or lighting equipment 20 (0%) 0 (0%) 0 (0%) $0 (0%)
Total 31,960 (100%) 400 (100%) 1,180 (100%) $1,210 (100%)
Note: Figures exclude confined fires. Fires, deaths, and injuries are rounded to the nearest ten and direct property damage to the nearest
million dollars. Figures reflect a proportional share of home fires with equipment involved in ignition unknown or recorded as electrical
distribution or lighting equipment of undetermined type. Totals may not equal sums because of rounding error.
Source: NFIRS Version 5.0 and NFPA Fire Experience Survey.
Timing of fires The cold weather months of January (11% of total) and December (10%) had the largest shares
of home fires involving electrical distribution and lighting equipment in 2010-2014, followed by
November (9%) and July (9%). The remaining months each had either a 7% or 8% share of the
total. See Table 3.2.
There was a fairly even distribution of fires by day of week, as shown in Table 3.3, with each
day of the week accounting for a 14% share of the total.
By time of day, the low period for home fires involving electrical distribution was between
midnight and 8 a.m., when 24% of fires occurred during 2010-2014. See Figure 3.2 (and Table
3.4). However, these fires accounted for 57% of civilian deaths and 38% of civilian injuries, as
well as 30% of direct property damage. The greatest share of fires came between 4 p.m. and
midnight (41% of total). These fires accounted for 26% of civilian deaths, 35% of civilian
injuries, and 36% of direct property damage. The period from 8 a.m. to 4 p.m. accounted for
35% of fires, 17% of civilian deaths, 27% of civilian injuries, and 34% of direct property
damage.
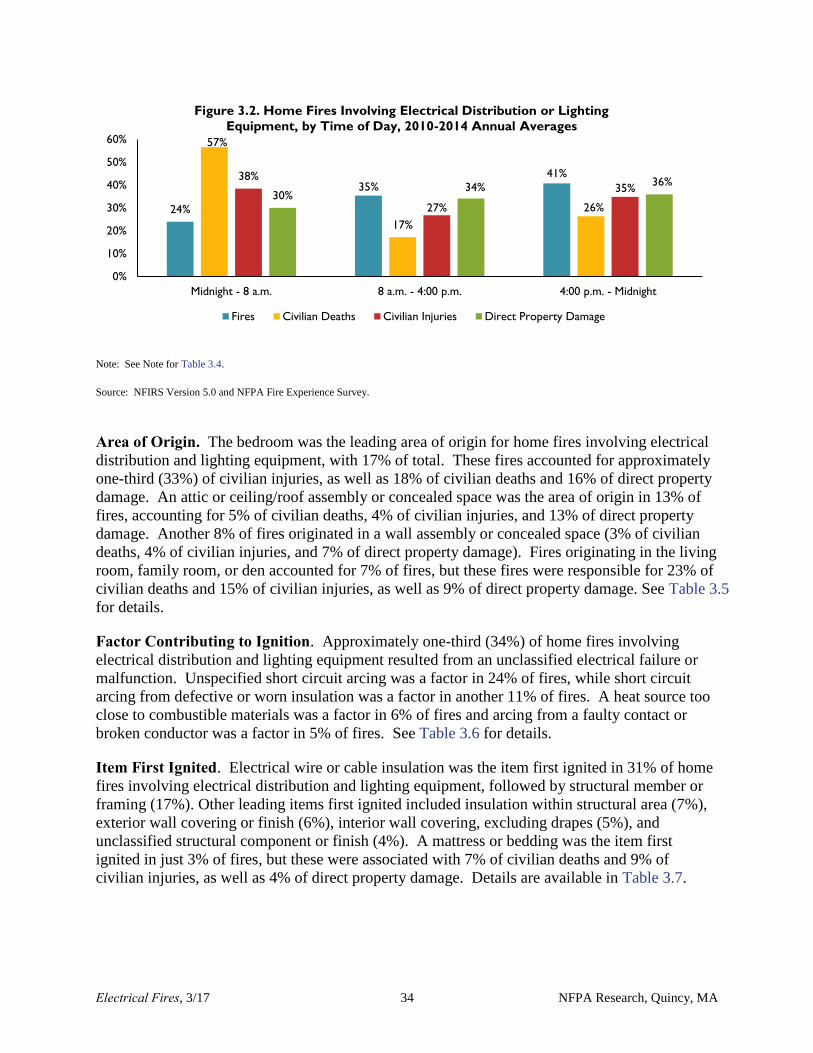
Electrical Fires, 3/17 34 NFPA Research, Quincy, MA
Note: See Note for Table 3.4.
Source: NFIRS Version 5.0 and NFPA Fire Experience Survey.
Area of Origin. The bedroom was the leading area of origin for home fires involving electrical
distribution and lighting equipment, with 17% of total. These fires accounted for approximately
one-third (33%) of civilian injuries, as well as 18% of civilian deaths and 16% of direct property
damage. An attic or ceiling/roof assembly or concealed space was the area of origin in 13% of
fires, accounting for 5% of civilian deaths, 4% of civilian injuries, and 13% of direct property
damage. Another 8% of fires originated in a wall assembly or concealed space (3% of civilian
deaths, 4% of civilian injuries, and 7% of direct property damage). Fires originating in the living
room, family room, or den accounted for 7% of fires, but these fires were responsible for 23% of
civilian deaths and 15% of civilian injuries, as well as 9% of direct property damage. See Table 3.5
for details.
Factor Contributing to Ignition. Approximately one-third (34%) of home fires involving
electrical distribution and lighting equipment resulted from an unclassified electrical failure or
malfunction. Unspecified short circuit arcing was a factor in 24% of fires, while short circuit
arcing from defective or worn insulation was a factor in another 11% of fires. A heat source too
close to combustible materials was a factor in 6% of fires and arcing from a faulty contact or
broken conductor was a factor in 5% of fires. See Table 3.6 for details.
Item First Ignited. Electrical wire or cable insulation was the item first ignited in 31% of home
fires involving electrical distribution and lighting equipment, followed by structural member or
framing (17%). Other leading items first ignited included insulation within structural area (7%),
exterior wall covering or finish (6%), interior wall covering, excluding drapes (5%), and
unclassified structural component or finish (4%). A mattress or bedding was the item first
ignited in just 3% of fires, but these were associated with 7% of civilian deaths and 9% of
civilian injuries, as well as 4% of direct property damage. Details are available in Table 3.7.
24%
35%41%
57%
17%
26%
38%
27%
35%30%
34% 36%
0%
10%
20%
30%
40%
50%
60%
Midnight - 8 a.m. 8 a.m. - 4:00 p.m. 4:00 p.m. - Midnight
Figure 3.2. Home Fires Involving Electrical Distribution or Lighting
Equipment, by Time of Day, 2010-2014 Annual Averages
Fires Civilian Deaths Civilian Injuries Direct Property Damage

Electrical Fires, 3/17 35 NFPA Research, Quincy, MA
Nearly two-thirds (65%) of fatally injured victims in home structure fires involving electrical distribution or lighting equipment were in the home but outside the area of origin when injured. This is a higher share than is the case in all home structure fires, where 47% of
fatally injured victims were in the home and outside the area of origin at time of injury. See
Table 3.8.
For non-fatal injury victims, 40% of those injured in home fires involving electrical distribution or lighting equipment were in the home but outside the area of origin at the time of injury and 53% were in the area of origin, with 7% outside the home. In
comparison, 64% of all home structure fire injury victims were in the area of origin at time of
injury, and 30% in the home but outside the area of origin. While the disparity in victim location
between home fires involving electrical distribution and lighting equipment and all home
structure fires can likely be attributed to the influence of fires caused by cooking and, smoking
materials in all home structure fires, it nevertheless underscores the critical need for homes to be
protected by fire detection equipment.
Over two in five (44%) of fatally injured victims in home structure fires involving electrical distribution and lighting equipment were neither in the area of origin nor involved at the time of ignition, compared to 26% in all home fires. Approximately one-quarter (26%) of
those who were fatally injured were outside the area of origin but involved, similar to all home
fires, where the share was 24%. Twenty percent of fatally injured victims in home fires
involving electrical distribution and lighting equipment were in the area of origin and not
involved at the time of ignition (14% in all home fires), while 10% were in the area of origin and
involved (36% in all home fires). See Table 3.9 for full results.
Almost half (48%) of those who were fatally injured in home fires involving electrical distribution and lighting equipment were attempting to escape at the time of injury. Another 29% were sleeping, with 10% unable to act and 6% engaged in a rescue attempt. By
comparison, 37% of fatal injury victims in all home fires were attempting to escape at the time of
injury and 32% were sleeping, with 11% unable to act and 3% were engaged in a rescue attempt.
A sizeable share of those who experienced non-fatal injuries were engaged in fire control – 25%
of victims in home electrical distribution and lighting equipment fires and 32% in all home
structure fires. See Table 3.10 for details.

Electrical Fires, 3/17 36 NFPA Research, Quincy, MA
Table 3.1 Home Fires Involving Electrical Distribution or Lighting Equipment, by Year Structure Fires Reported to U.S. Fire Departments
Year Fires Civilian Deaths
Civilian Injuries
Direct Property Damage (in Millions) As Reported In 2014 Dollars
1980 68,400 523 1,650 $493 $1,419
1981 62,300 553 1,500 $459 $1,194
1982 60,900 408 1,820 $519 $1,273
1983 56,700 500 1,570 $548 $1,302
1984 54,800 445 1,520 $549 $1,250
1985 56,500 470 1,400 $720 $1,583
1986 54,300 717 1,420 $597 $1,292
1987 51,600 522 1,580 $512 $1,068
1988 53,400 439 1,720 $715 $1,433
1989 47,900 610 1,500 $642 $1,228
1990 47,400 438 1,540 $683 $1,240
1991 49,000 354 1,890 $958 $1,666
1992 46,400 403 1,770 $617 $1,042
1993 48,900 418 1,900 $818 $1,341
1994 48,300 464 1,640 $714 $1,142
1995 47,200 489 1,650 $775 $1,205
1996 47,000 470 1,560 $839 $1,268
1997 46,600 352 1,580 $865 $1,277
1998 44,500 363 1,370 $843 $1,227
1999 34,800 183 530 $806 $1,146
2000 26,600 122 1,130 $631 $869
2001 26,200 436 1,030 $717 $960
2002 22,700 166 700 $593 $781
2003 19,200 320 600 $698 $900
2004 19,400 292 840 $623 $782
2005 20,800 498 1,060 $858 $1,041
2006 25,100 366 840 $776 $912
2007 25,200 274 1,050 $663 $757
2008 24,700 515 880 $964 $1,062
2009 21,000 318 1,000 $935 $1,032
2010 19,900 242 980 $774 $842
2011 21,300 295 840 $822 $867
2012 32,900 292 1,250 $1,326 $1,370
2013 37,000 601 1290 $1,418 $1,441
2014 37,900 535 1290 $1,433 $1,433

Electrical Fires, 3/17 37 NFPA Research, Quincy, MA
Table 3.1 Home Fires Involving Electrical Distribution or Lighting Equipment, by Year Structure Fires Reported to U.S. Fire Departments (Continued)
* All 1991 home fire property damage figures are inflated by estimation problems related to the handling of the Oakland fire
storm.
Note: Figures exclude confined fires. Fires are rounded to the nearest hundred, deaths to the nearest one, injuries to the nearest
ten, and property damage is rounded to the nearest million dollars. Figures reflect a proportional share of home fires with
equipment involved in ignition unknown or reported as electrical distribution or lighting equipment of undetermined type.
Because of low participation in NFIRS Version 5.0 during 1999-2001, estimates for those years are highly uncertain and must be
used with caution. Inflation adjustment to 2014 dollars is calculated using the Consumer Price Index.
Source: Data from NFIRS and NFPA Survey.

Electrical Fires, 3/17 38 NFPA Research, Quincy, MA
Table 3.2 Home Fires Involving Electrical Distribution or Lighting Equipment, by Month 2010-2014 Annual Averages
Month Fires Civilian Deaths
Civilian Injuries
Direct Property Damage (in Millions)
January 3,520 (11%) 50 (13%) 130 (11%) $135 (11%)
February 2,710 (8%) 40 (9%) 100 (8%) $104 (9%)
March 2,620 (8%) 50 (14%) 130 (11%) $108 (9%)
April 2,460 (8%) 30 (9%) 80 (6%) $100 (8%)
May 2,430 (8%) 10 (3%) 90 (8%) $91 (8%)
June 2,540 (8%) 20 (5%) 80 (7%) $97 (8%)
July 2,830 (9%) 40 (9%) 100 (8%) $103 (9%)
August 2,360 (7%) 40 (10%) 100 (8%) $81 (7%)
September 2,110 (7%) 20 (5%) 70 (6%) $84 (7%)
October 2,230 (7%) 40 (10%) 80 (7%) $78 (6%)
November 2,840 (9%) 20 (6%) 110 (9%) $100 (8%)
December 3,310 (10%) 30 (8%) 120 (10%) $127 (11%)
Total 31,960 (100%) 400 (100%) 1,180 (100%) $1,210 (100%)
Note: Figures exclude confined fires. Fires, deaths and injuries are rounded to the nearest ten and property damage is rounded to the
nearest million dollars. Figures reflect a proportional share of home fires with equipment involved in ignition unknown. Totals may
not equal sums because of rounding error.
Source: Data from NFIRS Version 5.0 and NFPA Experience Survey.

Electrical Fires, 3/17 39 NFPA Research, Quincy, MA
Table 3.3. Home Fires Involving Electrical Distribution or Lighting Equipment, by Day of Week 2010-2014 Annual Averages
Day of Week Fires Civilian Deaths
Civilian Injuries
Direct Property Damage (in Millions)
Sunday 4,530 (14%) 40 (10%) 210 (17%) $173 (14%)
Monday 4,620 (14%) 40 (10%) 130 (11%) $168 (14%)
Tuesday 4,610 (14%) 60 (15%) 200 (17%) $172 (14%)
Wednesday 4,600 (14%) 70 (17%) 150 (13%) $164 (14%)
Thursday 4,500 (14%) 80 (19%) 170 (15%) $186 (15%)
Friday 4,520 (14%) 40 (10%) 170 (15%) $178 (15%)
Saturday 4,570 (14%) 70 (18%) 150 (13%) $169 (14%)
Total 31,960 (100%) 400 (100%) 1,180 (100%) $1,210 (100%)
Note: Figures exclude confined fires. Fires, deaths and injuries are rounded to the nearest ten and property damage is rounded to the
nearest million dollars. Figures reflect a proportional share of home fires with equipment involved in ignition unknown or reported as
electrical distribution or lighting equipment of undetermined type. Totals may not equal sums because of rounding error.
Source: Data from NFIRS Version 5.0 and NFPA Experience Survey.

Electrical Fires, 3/17 40 NFPA Research, Quincy, MA
Table 3.4. Home Fires Involving Electrical Distribution or Lighting Equipment, by Alarm Time 2010-2014 Annual Averages
Alarm Time Fires Civilian Deaths
Civilian Injuries
Direct Property Damage (in Millions)
Midnight-12:59 a.m. 1,190 (4%) 20 (6%) 60 (5%) $54 (4%)
1:00-1:59 a.m. 940 (3%) 50 (11%) 80 (7%) $47 (4%)
2:00-2:59 a.m. 960 (3%) 40 (9%) 50 (5%) $55 (5%)
3:00-3:59 a.m. 890 (3%) 30 (8%) 50 (4%) $42 (3%)
4:00-4:59 a.m. 860 (3%) 40 (10%) 70 (6%) $45 (4%)
5:00-5:59 a.m. 810 (3%) 10 (3%) 40 (3%) $41 (3%)
6:00-6:59 a.m. 940 (3%) 10 (3%) 60 (5%) $34 (3%)
7:00-7:59 a.m. 1,040 (3%) 30 (7%) 40 (3%) $46 (4%)
8:00-8:59 a.m. 1,130 (4%) 0 (1%) 40 (4%) $40 (3%)
9:00-9:59 a.m. 1,210 (4%) 10 (4%) 50 (4%) $45 (4%)
10:00-10:59 a.m. 1,320 (4%) 20 (5%) 30 (3%) $43 (4%)
11:00-11:59 a.m. 1,390 (4%) 10 (3%) 40 (3%) $53 (4%)
12:00-12:59 p.m. 1,440 (4%) 10 (2%) 40 (3%) $59 (5%)
1:00-1:59 p.m. 1,560 (5%) 0 (0%) 50 (4%) $56 (5%)
2:00-2:59 p.m. 1,600 (5%) 10 (1%) 30 (3%) $57 (5%)
3:00-3:59 p.m. 1,660 (5%) 10 (1%) 40 (3%) $59 (5%)
4:00-4:59 p.m. 1,640 (5%) 10 (2%) 50 (4%) $61 (5%)
5:00-5:59 p.m. 1,720 (5%) 10 (2%) 50 (4%) $56 (5%)
6:00-6:59 p.m. 1,700 (5%) 20 (4%) 60 (5%) $58 (5%)
7:00-7:59 p.m. 1,800 (6%) 10 (3%) 50 (4%) $59 (5%)
8:00-8:59 p.m. 1,730 (5%) 20 (4%) 50 (4%) $57 (5%)
9:00-9:59 p.m. 1,690 (5%) 10 (3%) 50 (4%) $46 (4%)
10:00-10:59 p.m. 1,500 (5%) 10 (3%) 40 (4%) $44 (4%)
11:00-11:59 p.m. 1,230 (4%) 20 (5%) 70 (6%) $52 (4%)
Total 31,960 (100%) 400 (100%) 1,180 (100%) $1,210 (100%)
Note: Figures exclude confined fires. Fires, deaths and injuries are rounded to the nearest ten and property damage is rounded to the
nearest million dollars. Figures reflect a proportional share of home fires with equipment involved in ignition unknown or reported as
electrical distribution or lighting equipment of undetermined type. Totals may not equal sums because of rounding error.
Source: Data from NFIRS Version 5.0 and NFPA Experience Survey.

Electrical Fires, 3/17 41 NFPA Research, Quincy, MA
Table 3.5. Home Fires Involving Electrical Distribution or Lighting Equipment, by Area of Origin 2010-2014 Annual Averages
Area of Origin Fires Civilian Deaths
Civilian Injuries
Direct Property Damage (in Millions)
Bedroom 5,360 (17%) 70 (18%) 380 (33%) $196 (16%)
Attic or ceiling/roof
assembly or concealed
space 4,060 (13%) 20 (5%) 50 (4%) $154 (13%)
Wall assembly or
concealed space 2,680 (8%) 10 (3%) 50 (4%) $83 (7%)
Living room, family room,
or den 2,280 (7%) 90 (23%) 180 (15%) $114 (9%)
Exterior wall surface 2,000 (6%) 10 (1%) 20 (2%) $50 (4%)
Kitchen or cooking area 1,980 (6%) 40 (10%) 80 (7%) $69 (6%)
Garage or vehicle storage
area 1,320 (4%) 10 (1%) 50 (4%) $94 (8%)
Crawl space or
substructure space 1,200 (4%) 20 (4%) 30 (2%) $44 (4%)
Ceiling/floor assembly or
concealed space 1,140 (4%) 30 (7%) 20 (2%) $53 (4%)
Unclassified function area 1,120 (4%) 30 (8%) 60 (5%) $43 (4%)
Bathroom or lavatory 1,030 (3%) 0 (0%) 20 (2%) $25 (2%)
Laundry room or area 1,020 (3%) 0 (1%) 50 (4%) $28 (2%)
Closet 660 (2%) 10 (3%) 30 (2%) $29 (2%)
Unclassified structural area 530 (2%) 10 (2%) 10 (1%) $28 (2%)
Exterior balcony or
unenclosed porch 480 (2%) 20 (5%) 10 (1%) $23 (2%)
Unclassified storage area 420 (1%) 10 (2%) 20 (1%) $14 (1%)
Unclassified outside area 400 (1%) 0 (1%) 0 (0%) $18 (1%)
Conduit, pipe, utility, or
ventilation shaft 370 (1%) 0 (0%) 0 (0%) $8 (1%)
Dining room 340 (1%) 0 (1%) 20 (1%) $12 (1%)
Unclassified area of origin 340 (1%) 0 (1%) 10 (1%) $7 (1%)
Unclassified equipment or
service area 310 (1%) 0 (0%) 10 (1%) $12 (1%)
Heating equipment room 240 (1%) 0 (0%) 0 (0%) $9 (1%)
Storage room, area, tank, or
bin 230 (1%) 0 (0%) 0 (0%) $10 (1%)
Exterior roof surface 220 (1%) 0 (0%) 0 (0%) $5 (0%)
Lobby or entrance way 220 (1%) 0 (0%) 10 (1%) $9 (1%)
Storage of supplies or tools
or dead storage 220 (1%) 0 (1%) 10 (1%) $8 (1%)
Courtyard, terrace or patio 220 (1%) 0 (0%) 10 (1%) $13 (1%)
Hallway or corridor 190 (1%) 0 (0%) 10 (0%) $6 (0%)

Electrical Fires, 3/17 42 NFPA Research, Quincy, MA
Table 3.5. Home Fires Involving Electrical Distribution or Lighting Equipment, by Area of Origin 2010-2014 Annual Averages (Continued)
Area of Origin Fires Civilian Deaths
Civilian Injuries
Direct Property Damage (in Millions)
Other known area of origin 1,400 (4%) 10 (2%) 30 (2%) $48 (4%)
Total 31,960 (100%) 400 (100%) 1,180 (100%) $1,210 (100%)
Note: Figures exclude confined fires. Fires, deaths and injuries are rounded to the nearest ten and property damage is rounded to the nearest
million dollars. Figures reflect a proportional share of home fires with equipment involved in ignition unknown or reported as electrical
distribution or lighting equipment of undetermined type. Fires in which the area of origin was unknown or not reported were allocated
proportionally. Totals may not equal sums because of rounding error.
Source: Data from NFIRS Version 5.0 and NFPA Experience Survey.
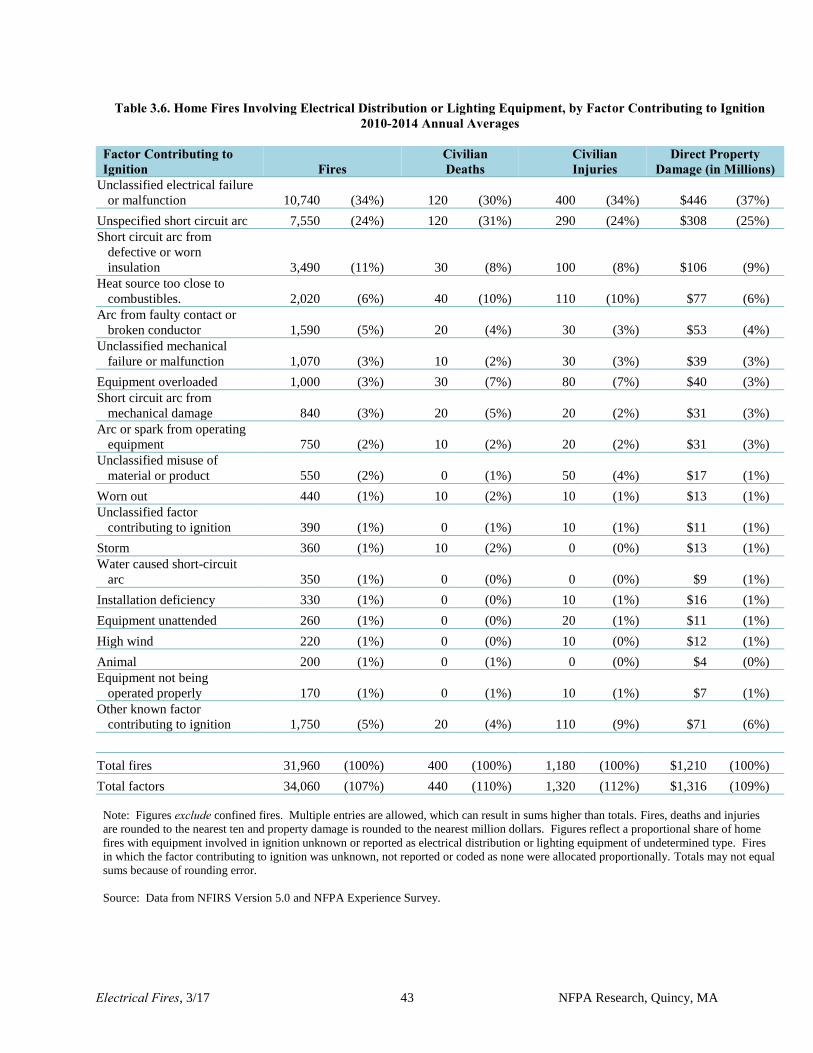
Electrical Fires, 3/17 43 NFPA Research, Quincy, MA
Table 3.6. Home Fires Involving Electrical Distribution or Lighting Equipment, by Factor Contributing to Ignition 2010-2014 Annual Averages
Factor Contributing to Ignition Fires
Civilian Deaths
Civilian Injuries
Direct Property Damage (in Millions)
Unclassified electrical failure
or malfunction 10,740 (34%) 120 (30%) 400 (34%) $446 (37%)
Unspecified short circuit arc 7,550 (24%) 120 (31%) 290 (24%) $308 (25%)
Short circuit arc from
defective or worn
insulation 3,490 (11%) 30 (8%) 100 (8%) $106 (9%)
Heat source too close to
combustibles. 2,020 (6%) 40 (10%) 110 (10%) $77 (6%)
Arc from faulty contact or
broken conductor 1,590 (5%) 20 (4%) 30 (3%) $53 (4%)
Unclassified mechanical
failure or malfunction 1,070 (3%) 10 (2%) 30 (3%) $39 (3%)
Equipment overloaded 1,000 (3%) 30 (7%) 80 (7%) $40 (3%)
Short circuit arc from
mechanical damage 840 (3%) 20 (5%) 20 (2%) $31 (3%)
Arc or spark from operating
equipment 750 (2%) 10 (2%) 20 (2%) $31 (3%)
Unclassified misuse of
material or product 550 (2%) 0 (1%) 50 (4%) $17 (1%)
Worn out 440 (1%) 10 (2%) 10 (1%) $13 (1%)
Unclassified factor
contributing to ignition 390 (1%) 0 (1%) 10 (1%) $11 (1%)
Storm 360 (1%) 10 (2%) 0 (0%) $13 (1%)
Water caused short-circuit
arc 350 (1%) 0 (0%) 0 (0%) $9 (1%)
Installation deficiency 330 (1%) 0 (0%) 10 (1%) $16 (1%)
Equipment unattended 260 (1%) 0 (0%) 20 (1%) $11 (1%)
High wind 220 (1%) 0 (0%) 10 (0%) $12 (1%)
Animal 200 (1%) 0 (1%) 0 (0%) $4 (0%)
Equipment not being
operated properly 170 (1%) 0 (1%) 10 (1%) $7 (1%)
Other known factor
contributing to ignition 1,750 (5%) 20 (4%) 110 (9%) $71 (6%)
Total fires 31,960 (100%) 400 (100%) 1,180 (100%) $1,210 (100%)
Total factors 34,060 (107%) 440 (110%) 1,320 (112%) $1,316 (109%)
Note: Figures exclude confined fires. Multiple entries are allowed, which can result in sums higher than totals. Fires, deaths and injuries
are rounded to the nearest ten and property damage is rounded to the nearest million dollars. Figures reflect a proportional share of home
fires with equipment involved in ignition unknown or reported as electrical distribution or lighting equipment of undetermined type. Fires
in which the factor contributing to ignition was unknown, not reported or coded as none were allocated proportionally. Totals may not equal
sums because of rounding error.
Source: Data from NFIRS Version 5.0 and NFPA Experience Survey.

Electrical Fires, 3/17 44 NFPA Research, Quincy, MA
Table 3.7. Home Fires Involving Electrical Distribution or Lighting Equipment, by Item First Ignited 2010-2014 Annual Averages
Item First Ignited Fires Civilian Deaths
Civilian Injuries
Direct Property Damage (in Millions)
Electrical wire or cable
insulation 10,060 (31%) 100 (25%) 350 (29%) $316 (26%)
Structural member or framing 5,420 (17%) 90 (23%) 140 (12%) $267 (22%)
Insulation within structural area 2,190 (7%) 0 (0%) 20 (2%) $56 (5%)
Exterior wall covering or finish 1,970 (6%) 20 (4%) 30 (2%) $67 (6%)
Interior wall covering,
excluding drapes 1,590 (5%) 10 (3%) 50 (4%) $70 (6%)
Unclassified structural
component or finish 1,320 (4%) 10 (2%) 30 (3%) $50 (4%)
Mattress or bedding 1,080 (3%) 30 (7%) 100 (9%) 44 (4%)
Unclassified item first Ignited 860 (3%) 10 (3%) 20 (2%) $20 (2%)
Clothing 700 (2%) 0 (1%) 50 (4%) 20 (2%)
Interior ceiling cover or finish 670 (2%) 10 (2%) 10 (1%) $25 (2%)
Floor covering rug, carpet, or
mat 660 (2%) 10 (3%) 40 (4%) $31 (3%)
Upholstered furniture 560 (2%) 40 (10%) 80 (6%) $32 (3%)
Unclassified furniture or
utensils 490 (2%) 10 (2%) 30 (3%) $21 (2%)
Appliance housing or casing 450 (1%) 0 (1%) 30 (2%) $18 (1%)
Multiple items first ignited 430 (1%) 10 (3%) 30 (3%) $32 (3%)
Cabinetry 360 (1%) 10 (2%) 20 (2%) $21 (2%)
Flammable and combustible
liquids and gases, piping and
filter 340 (1%) 0 (0%) 40 (3%) 16 (1%)
Unclassified soft goods, or
wearing apparel 330 (1%) 0 (1%) 20 (2%) $14 (1%)
Light vegetation including
grass 260 (1%) 0 (0%) 0 (0%) $6 (0%)
Curtains, blinds, drapery, or
tapestry 250 (1%) 10 (2%) 30 (2%) $9 (1%)
Exterior roof covering or finish 230 (1%) 0 (0%) 0 (0%) $7 (1%)
Box, carton, bag, basket, barrel 200 (1%) 0 (0%) 10 (1%) $13 (1%)
Linen other than bedding 200 (1%) 0 (0%) 10 (1%) $7 (1%)
Unclassified organic materials 170 (1%) 0 (0%) 0 (0%) $5 (0%)
Other known item first ignited 1,150 (4%) 20 (6%) 50 (4%) $45 (4%)
Total 31,960 (100%) 400 (100%) 1,180 (100%) $1,210 (100%)
Note: Figures exclude confined fires. Fires, deaths, and injuries are rounded to the nearest ten and direct property damage to the
nearest million dollars. Damage has not been adjusted for inflation. Figures reflect a proportional share of non-home fires with
item first ignited listed as unknown, unreported, none, or blank. Totals may not equal sums because of rounding error.
Source: Data from NFIRS Version 5.0 and NFPA Experience Survey.
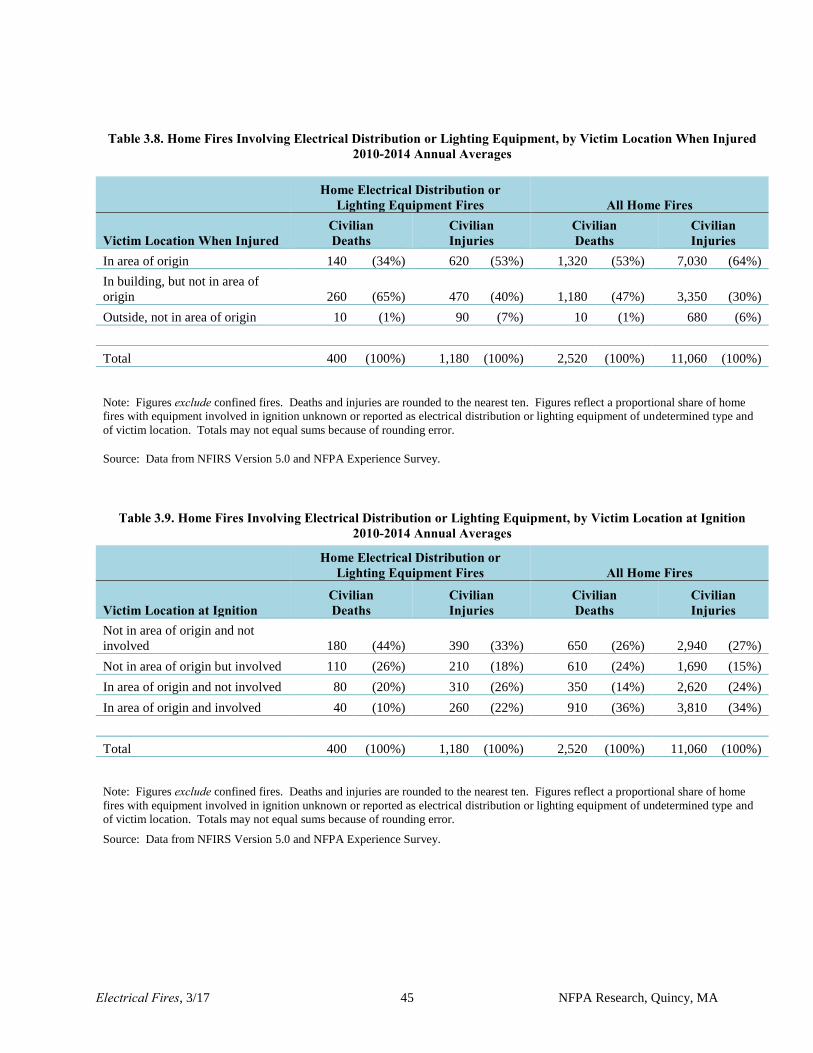
Electrical Fires, 3/17 45 NFPA Research, Quincy, MA
Table 3.8. Home Fires Involving Electrical Distribution or Lighting Equipment, by Victim Location When Injured 2010-2014 Annual Averages
Home Electrical Distribution or
Lighting Equipment Fires All Home Fires
Victim Location When Injured Civilian Deaths
Civilian Injuries
Civilian Deaths
Civilian Injuries
In area of origin 140 (34%) 620 (53%) 1,320 (53%) 7,030 (64%)
In building, but not in area of
origin 260 (65%) 470 (40%) 1,180 (47%) 3,350 (30%)
Outside, not in area of origin 10 (1%) 90 (7%) 10 (1%) 680 (6%)
Total 400 (100%) 1,180 (100%) 2,520 (100%) 11,060 (100%)
Note: Figures exclude confined fires. Deaths and injuries are rounded to the nearest ten. Figures reflect a proportional share of home
fires with equipment involved in ignition unknown or reported as electrical distribution or lighting equipment of undetermined type and
of victim location. Totals may not equal sums because of rounding error.
Source: Data from NFIRS Version 5.0 and NFPA Experience Survey.
Table 3.9. Home Fires Involving Electrical Distribution or Lighting Equipment, by Victim Location at Ignition 2010-2014 Annual Averages
Home Electrical Distribution or
Lighting Equipment Fires All Home Fires
Victim Location at Ignition Civilian Deaths
Civilian Injuries
Civilian Deaths
Civilian Injuries
Not in area of origin and not
involved 180 (44%) 390 (33%) 650 (26%) 2,940 (27%)
Not in area of origin but involved 110 (26%) 210 (18%) 610 (24%) 1,690 (15%)
In area of origin and not involved 80 (20%) 310 (26%) 350 (14%) 2,620 (24%)
In area of origin and involved 40 (10%) 260 (22%) 910 (36%) 3,810 (34%)
Total 400 (100%) 1,180 (100%) 2,520 (100%) 11,060 (100%)
Note: Figures exclude confined fires. Deaths and injuries are rounded to the nearest ten. Figures reflect a proportional share of home
fires with equipment involved in ignition unknown or reported as electrical distribution or lighting equipment of undetermined type and
of victim location. Totals may not equal sums because of rounding error.
Source: Data from NFIRS Version 5.0 and NFPA Experience Survey.

Electrical Fires, 3/17 46 NFPA Research, Quincy, MA
Table 3.10. Home Fires Involving Electrical Distribution or Lighting Equipment, by Victim Activity When Injured
2010-2014 Annual Averages
Home Electrical Distribution or Lighting
Equipment Fires All Home Fires
Victim Activity When Injured Civilian Deaths
Civilian Injuries
Civilian Deaths
Civilian Injuries
Escaping 190 (48%) 420 (36%) 930 (37%) 3,120 (28%)
Sleeping 120 (29%) 160 (13%) 810 (32%) 1,300 (12%)
Unable to act 40 (10%) 20 (1%) 280 (11%) 310 (3%)
Rescue attempt 30 (6%) 100 (9%) 70 (3%) 820 (7%)
Fire control 10 (2%) 290 (25%) 70 (3%) 3,510 (32%)
Returning to vicinity of fire
before control 10 (2%) 90 (8%) 70 (3%) 790 (7%)
Irrational act 10 (2%) 0 (0%) 140 (5%) 320 (3%)
Unclassified activity 0 (1%) 80 (7%) 130 (5%) 840 (8%)
Returning to vicinity of fire after
control 0 (0%) 10 (0%) 10 (0%) 50 (0%)
Total 400 (100%) 1,180 (100%) 2,520 (100%) 11,060 (100%)
Note: Figures exclude confined fires. Deaths and injuries are rounded to the nearest ten. Figures reflect a proportional share of home
fires with equipment involved in ignition unknown or reported as electrical distribution or lighting equipment of undetermined type
and of unknown victim activity. Totals may not equal sums because of rounding error.
Source: Data from NFIRS Version 5.0 and NFPA Experience Survey.

Electrical Fires, 3/17 47 NFPA Research, Quincy, MA
Section 4. Home Fires Involving Wiring and Related Equipment___________
In 2010-2014, an estimated average of 22,190 non-confined home structure fires involving electrical wiring and related equipment occurred each year. These fires resulted in 230 civilian
deaths, 630 civilian injuries, and $804 million in direct property damage each year. As shown in
Figure 4.1 (and Table 4.1), fires involving electrical wiring and related equipment showed a steady
decline from 1980 to 1998. Following a transition period in 1999-2001, when NFIRS 5.0 was
being phased in, the estimates settled into a range roughly one-half lower than the levels of the late
1980s, a much larger decline than would have been anticipated if the 1980-1998 trend had
continued unchanged. Some of the sharp decline after 1998 may have been due to the changes in
data categories, definitions, and rules introduced in NFIRS 5.0, rather than a true decline in the size
of the fire problem. Since 2012, the number of home fires involving electrical wiring and related
equipment have been on the rise. Some of the increase may be related to the change in NFIRS
described on page 2.
Note: Because of low participation in NFIRS Version 5.0 during 1999-2001, data from these years is not reported in these tables.
See Note for Table 4.1.
Unclassified electrical wiring was the major type of wiring and related equipment involved in home fires in 2010-2014, with 45% of the total. These fires also accounted for 52% of
civilian deaths, 49% of civilian injuries, and 49% of direct property damage. Other leading types
of electrical wiring and related equipment that were involved in home fires included outlets or
receptacles (18%) of fires, electrical branch circuits (13%), panelboards, switchboards, or circuit
breaker boards (7%), power lines (5%), and electric meters or meter boxes (5%). Fires involving
electrical branch circuits accounted for the second highest share of civilian deaths (25%), while
those involving outlets or receptacles account for the second highest share of civilian injuries
(23%). See Table 4.A for details.
38,520
10,120
27,310
0
5,000
10,000
15,000
20,000
25,000
30,000
35,000
40,000
45,000
1980 1982 1984 1986 1988 1990 1992 1994 1996 1998 2000 2002 2004 2006 2008 2010 2012 2014
Fir
es
Year
Figure 4.1. Annual Home Fires Involving Electrical Wiring
and Related Equipment, 2010-2014

Electrical Fires, 3/17 48 NFPA Research, Quincy, MA
Table 4.A. Home Fires Involving Electrical Wiring and Related Equipment, Major Equipment Group 2010-2014 Annual Averages
Major Equipment Group Fires Civilian Deaths
Civilian Injuries
Direct Property Damage (in Millions)
Unclassified electrical wiring 9,950 (45%) 120 (52%) 310 (49%) $391 (49%)
Outlet or receptacle 3,930 (18%) 40 (19%) 150 (23%) $117 (15%)
Electrical branch circuit 2,780 (13%) 60 (25%) 70 (11%) $119 (15%)
Panelboard, switchboard, or
circuit breaker board 1,500 (7%) 0 (0%) 40 (6%) $44 (6%)
Power (utility) lines 1,130 (5%) 10 (3%) 10 (2%) $43 (5%)
Electric meter or meter box 1,000 (5%) 0 (0%) 30 (4%) $28 (4%)
Electrical power (utility) line 800 (4%) 0 (0%) 10 (2%) $27 (3%)
Wiring from meter box to
circuit breaker 730 (3%) 0 (1%) 10 (2%) $21 (3%)
Wall switch 320 (1%) 0 (0%) 10 (1%) $11 (1%)
Ground fault circuit interrupter 70 (0%) 0 (0%) 0 (1%) $3 (0%)
Total 22,190 (100%) 230 (100%) 630 (100%) $804 (100%)
Note: Figures exclude confined fires. Fires, deaths, and injuries are rounded to the nearest ten and direct property damage to the nearest million dollars.
Figures reflect a proportional share of home fires with equipment involved in ignition unknown or recorded as electrical distribution or lighting equipment of undetermined type. Totals may not equal sums because of rounding error.
Source: NFIRS Version 5.0 and NFPA Fire Experience Survey.
Timing of fires
The peak months for home fires involving electrical wiring and related equipment were January
(12% of total) and December (11%), while September had the smallest share of fires (6%).
February, July, and November each recorded 9% of the total, and all other months had 7% or 8%
of fires. The fires resulting in the greatest amount of property damage were those occurring in
December and January, each of which had 11% of the total. See Table 4.2 for details.
Home fires involving electrical wiring and related equipment were quite evenly distributed by
day of week, with each day having either a 14% or 15% share of the total. See Table 4.3 for
more information.
As shown in Figure 4.2, the hours between 4 p.m. and midnight accounted for the greatest share
of home fires involving electrical wiring and related equipment (40%), with 35% of fires taking
place between 8 a.m. and 4 p.m. The remaining 25% of fires that occur between midnight and
8 a.m. resulted in 62% of civilian deaths and 38% of civilian injuries, as well as 31% of direct
property damage. Detailed information on fires by time of day is available in Table 4.4.
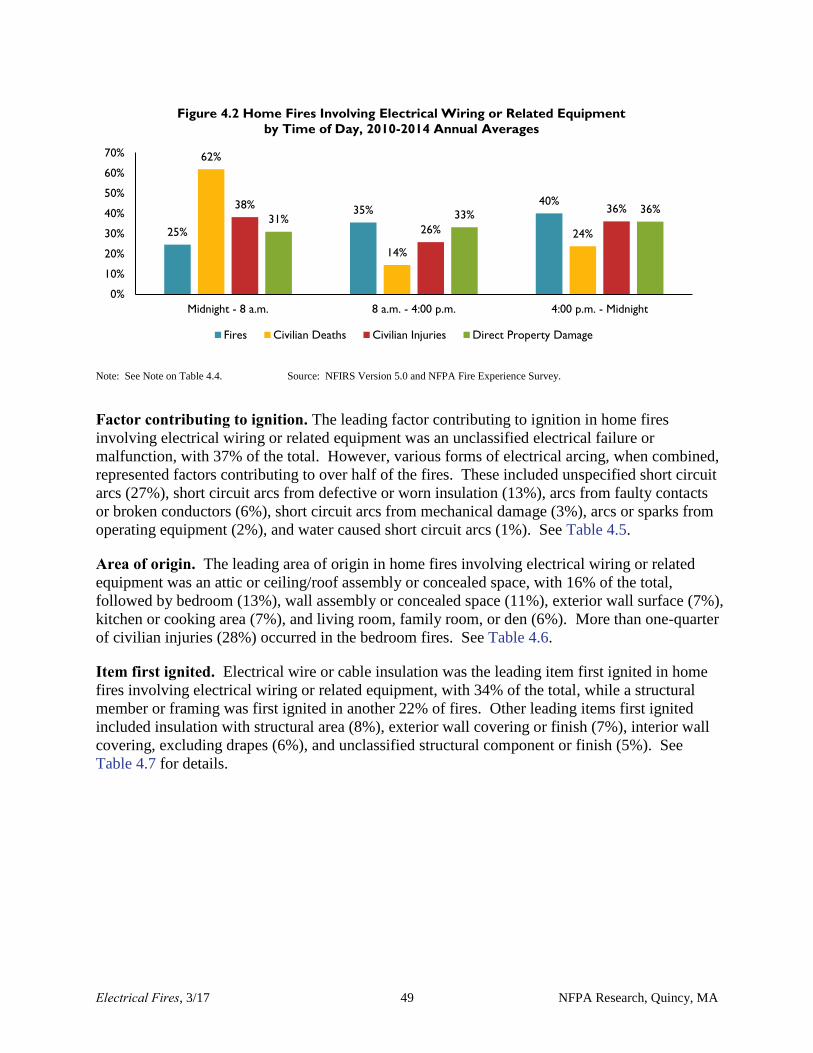
Electrical Fires, 3/17 49 NFPA Research, Quincy, MA
Note: See Note on Table 4.4. Source: NFIRS Version 5.0 and NFPA Fire Experience Survey.
Factor contributing to ignition. The leading factor contributing to ignition in home fires
involving electrical wiring or related equipment was an unclassified electrical failure or
malfunction, with 37% of the total. However, various forms of electrical arcing, when combined,
represented factors contributing to over half of the fires. These included unspecified short circuit
arcs (27%), short circuit arcs from defective or worn insulation (13%), arcs from faulty contacts
or broken conductors (6%), short circuit arcs from mechanical damage (3%), arcs or sparks from
operating equipment (2%), and water caused short circuit arcs (1%). See Table 4.5.
Area of origin. The leading area of origin in home fires involving electrical wiring or related
equipment was an attic or ceiling/roof assembly or concealed space, with 16% of the total,
followed by bedroom (13%), wall assembly or concealed space (11%), exterior wall surface (7%),
kitchen or cooking area (7%), and living room, family room, or den (6%). More than one-quarter
of civilian injuries (28%) occurred in the bedroom fires. See Table 4.6.
Item first ignited. Electrical wire or cable insulation was the leading item first ignited in home
fires involving electrical wiring or related equipment, with 34% of the total, while a structural
member or framing was first ignited in another 22% of fires. Other leading items first ignited
included insulation with structural area (8%), exterior wall covering or finish (7%), interior wall
covering, excluding drapes (6%), and unclassified structural component or finish (5%). See
Table 4.7 for details.
25%
35%40%
62%
14%
24%
38%
26%
36%31% 33%
36%
0%
10%
20%
30%
40%
50%
60%
70%
Midnight - 8 a.m. 8 a.m. - 4:00 p.m. 4:00 p.m. - Midnight
Figure 4.2 Home Fires Involving Electrical Wiring or Related Equipment
by Time of Day, 2010-2014 Annual Averages
Fires Civilian Deaths Civilian Injuries Direct Property Damage

Electrical Fires, 3/17 50 NFPA Research, Quincy, MA
Table 4.1 Home Fires Involving Electrical Wiring and Related Equipment, by Year Structure Fires Reported to U.S. Fire Departments
Year Fires Civilian Deaths
Civilian Injuries
Direct Property Damage (in Millions)
As Reported in 2014 Dollars 1980 38,520 270 670 $307 $884
1981 34,900 320 670 $261 $679
1982 35,220 160 720 $316 $775
1983 32,880 270 680 $330 $784
1984 32,300 170 660 $338 $770
1985 33,230 270 600 $385 $847
1986 31,570 330 550 $365 $790
1987 29,410 300 730 $295 $615
1988 30,550 260 720 $439 $880
1989 27,030 340 560 $393 $752
1990 26,820 150 590 $391 $710
1991 28,820 130 700 $568 $988
1992 26,580 210 760 $363 $613
1993 27,970 140 730 $402 $659
1994 27,440 260 650 $409 $654
1995 26,600 300 680 $449 $698
1996 26,150 210 630 $495 $748
1997 25,380 180 710 $484 $715
1998 24,960 190 580 $485 $706
1999 18,950 60 110 $416 $591
2000 14,260 40 240 $308 $424
2001 14,750 170 510 $411 $550
2002 12,310 50 250 $314 $414
2003 10,120 120 180 $354 $456
2004 10,380 120 360 $331 $416
2005 11,730 190 380 $452 $548
2006 15,000 140 390 $448 $527
2007 15,790 140 450 $328 $375
2008 15,760 390 290 $595 $656
2009 13,080 110 440 $558 $616
2010 12,480 80 440 $462 $503
2011 13,140 110 450 $501 $528
2012 22,780 170 650 $903 $933
2013 26,370 350 670 $945 $961
2014 27,310 370 750 $982 $982
Electrical Fires, 3/17 51 NFPA Research, Quincy, MA
Table 4.1 Home Fires Involving Electrical Wiring and Related Equipment, by Year Structure Fires Reported to U.S. Fire Departments (Continued)
* All 1991 home fire property damage figures are inflated by estimation problems related to the handling of the Oakland fire storm.
Note: Figures exclude confined fires. Fires, deaths, and injuries are rounded to the nearest ten and property damage is rounded to
the nearest million dollars. Figures reflect a proportional share of home fires with equipment involved in ignition unknown or
reported as electrical distribution or lighting equipment of undetermined type. Because of low participation in NFIRS Version 5.0
during 1999-2001, estimates for those years are highly uncertain and must be used with caution. Inflation adjustment to 2014 dollars
is calculated using the Consumer Price Index.
Source: Data from NFIRS and NFPA Survey.

Electrical Fires, 3/17 52 NFPA Research, Quincy, MA
Table 4.2. Home Fires Involving Electrical Wiring and Related Equipment, by Month 2010-2014 Annual Averages
Month Fires Civilian Deaths
Civilian Injuries
Direct Property Damage (in Millions)
January 2,580 (12%) 30 (14%) 70 (11%) $87 (11%)
February 1,910 (9%) 30 (11%) 50 (8%) $67 (8%)
March 1,820 (8%) 30 (12%) 80 (12%) $70 (9%)
April 1,620 (7%) 20 (9%) 30 (5%) $71 (9%)
May 1,630 (7%) 0 (0%) 50 (8%) $59 (7%)
June 1,740 (8%) 10 (2%) 50 (8%) $66 (8%)
July 1,980 (9%) 30 (12%) 50 (8%) $70 (9%)
August 1,590 (7%) 20 (10%) 60 (10%) $54 (7%)
September 1,420 (6%) 10 (3%) 40 (6%) $53 (7%)
October 1,530 (7%) 30 (14%) 30 (5%) $52 (6%)
November 2,020 (9%) 10 (4%) 50 (9%) $69 (9%)
December 2,360 (11%) 20 (8%) 60 (10%) $85 (11%)
Total 22,190 (100%) 230 (100%) 630 (100%) $804 (100%)
Note: Figures exclude confined fires. Fires, deaths, and injuries are rounded to the nearest ten and property damage is rounded to the
nearest million dollars. Figures reflect a proportional share of home fires with equipment involved in ignition unknown or reported as
electrical distribution or lighting equipment of undetermined type. Totals may not equal sums because of rounding error.
Source: Data from NFIRS Version 5.0 and NFPA Experience Survey.

Electrical Fires, 3/17 53 NFPA Research, Quincy, MA
Table 4.3. Home Fires Involving Electrical Wiring and Related Equipment, by Day of Week 2010-2014 Annual Averages
Day of Week Fires Civilian Deaths
Civilian Injuries
Direct Property Damage (in Millions)
Sunday 3,160 (14%) 30 (11%) 90 (15%) $111 (14%)
Monday 3,230 (15%) 20 (8%) 70 (11%) $117 (15%)
Tuesday 3,200 (14%) 30 (13%) 90 (14%) $115 (14%)
Wednesday 3,230 (15%) 40 (19%) 100 (15%) $113 (14%)
Thursday 3,120 (14%) 60 (27%) 80 (14%) $124 (15%)
Friday 3,130 (14%) 20 (9%) 110 (18%) $119 (15%)
Saturday 3,130 (14%) 30 (13%) 80 (13%) $105 (13%)
Total 22,190 (100%) 230 (100%) 630 (100%) $804 (100%)
Note: Figures exclude confined fires. Fires, deaths, and injuries are rounded to the nearest ten and property damage is rounded to the
nearest million dollars. Figures reflect a proportional share of home fires with equipment involved in ignition unknown or reported as
electrical distribution or lighting equipment of undetermined type. Totals may not equal sums because of rounding error.
Source: Data from NFIRS Version 5.0 and NFPA Experience Survey.

Electrical Fires, 3/17 54 NFPA Research, Quincy, MA
Table 4.4. Home Fires Involving Electrical Wiring and Related Equipment, by Alarm Time 2010-2014 Annual Averages
Alarm Time Fires Civilian Deaths
Civilian Injuries
Direct Property Damage (in Millions)
Midnight-12:59 a.m. 830 (4%) 20 (9%) 30 (5%) $35 (4%)
1:00-1:59 a.m. 670 (3%) 20 (10%) 50 (8%) $29 (4%)
2:00-2:59 a.m. 670 (3%) 30 (14%) 30 (4%) $42 (5%)
3:00-3:59 a.m. 650 (3%) 30 (12%) 20 (3%) $27 (3%)
4:00-4:59 a.m. 630 (3%) 20 (8%) 30 (5%) $32 (4%)
5:00-5:59 a.m. 580 (3%) 10 (5%) 30 (4%) $29 (4%)
6:00-6:59 a.m. 670 (3%) 10 (2%) 30 (4%) $25 (3%)
7:00-7:59 a.m. 760 (3%) 10 (2%) 20 (3%) $30 (4%)
8:00-8:59 a.m. 790 (4%) 0 (1%) 20 (4%) $28 (4%)
9:00-9:59 a.m. 840 (4%) 10 (3%) 20 (3%) $30 (4%)
10:00-10:59 a.m. 920 (4%) 10 (3%) 10 (2%) $25 (3%)
11:00-11:59 a.m. 960 (4%) 0 (2%) 30 (4%) $35 (4%)
12:00-12:59 p.m. 980 (4%) 0 (2%) 10 (2%) $36 (4%)
1:00-1:59 p.m. 1,080 (5%) 0 (1%) 30 (4%) $36 (4%)
2:00-2:59 p.m. 1,120 (5%) 10 (3%) 20 (4%) $39 (5%)
3:00-3:59 p.m. 1,180 (5%) 0 (1%) 20 (3%) $37 (5%)
4:00-4:59 p.m. 1,110 (5%) 0 (1%) 20 (4%) $39 (5%)
5:00-5:59 p.m. 1,190 (5%) 10 (3%) 30 (5%) $37 (5%)
6:00-6:59 p.m. 1,170 (5%) 10 (5%) 30 (5%) $41 (5%)
7:00-7:59 p.m. 1,240 (6%) 10 (2%) 20 (4%) $40 (5%)
8:00-8:59 p.m. 1,140 (5%) 10 (5%) 30 (4%) $37 (5%)
9:00-9:59 p.m. 1,140 (5%) 10 (4%) 20 (3%) $31 (4%)
10:00-10:59 p.m. 1,030 (5%) 10 (2%) 40 (6%) $30 (4%)
11:00-11:59 p.m. 860 (4%) 0 (2%) 30 (5%) $33 (4%)
Total 22,190 (100%) 230 (100%) 630 (100%) $804 (100%)
Note: Figures exclude confined fires. Fires, deaths, and injuries are rounded to the nearest ten and property damage is rounded to the
nearest million dollars. Figures reflect a proportional share of home fires with equipment involved in ignition unknown or reported as
electrical distribution or lighting equipment of undetermined type. Totals may not equal sums because of rounding error.
Source: Data from NFIRS Version 5.0 and NFPA Experience Survey.
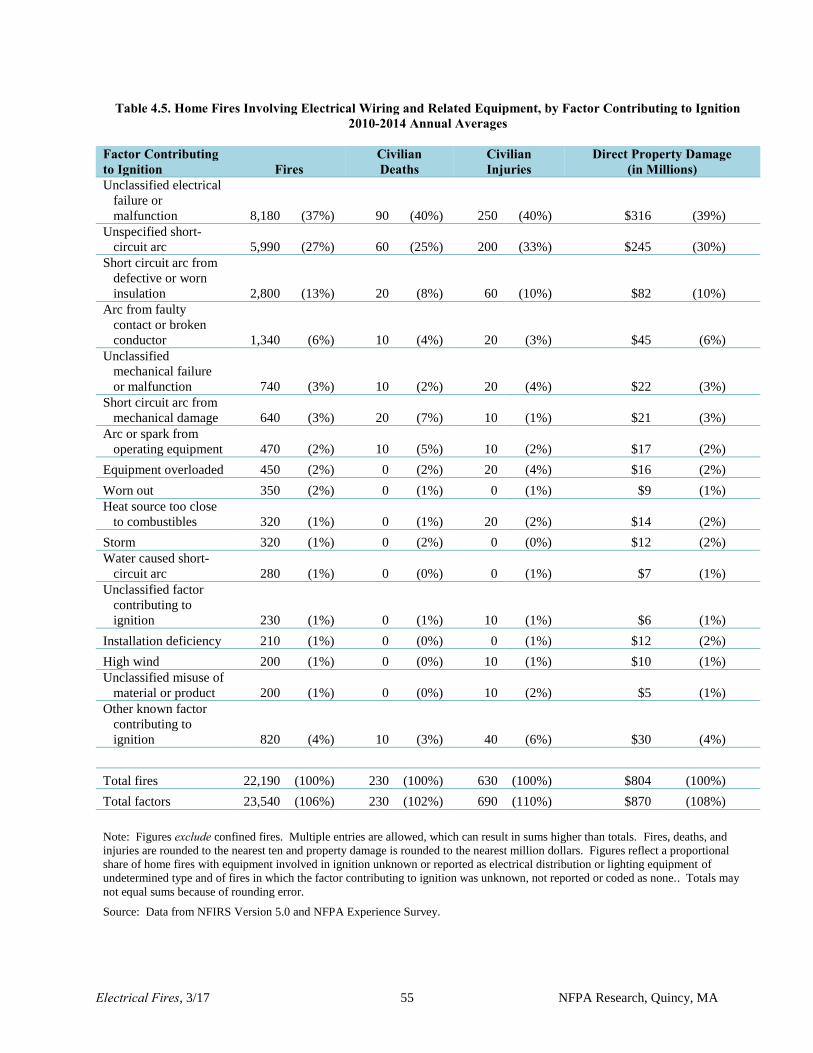
Electrical Fires, 3/17 55 NFPA Research, Quincy, MA
Table 4.5. Home Fires Involving Electrical Wiring and Related Equipment, by Factor Contributing to Ignition 2010-2014 Annual Averages
Factor Contributing to Ignition Fires
Civilian Deaths
Civilian Injuries
Direct Property Damage (in Millions)
Unclassified electrical
failure or
malfunction 8,180 (37%) 90 (40%) 250 (40%) $316 (39%)
Unspecified short-
circuit arc 5,990 (27%) 60 (25%) 200 (33%) $245 (30%)
Short circuit arc from
defective or worn
insulation 2,800 (13%) 20 (8%) 60 (10%) $82 (10%)
Arc from faulty
contact or broken
conductor 1,340 (6%) 10 (4%) 20 (3%) $45 (6%)
Unclassified
mechanical failure
or malfunction 740 (3%) 10 (2%) 20 (4%) $22 (3%)
Short circuit arc from
mechanical damage 640 (3%) 20 (7%) 10 (1%) $21 (3%)
Arc or spark from
operating equipment 470 (2%) 10 (5%) 10 (2%) $17 (2%)
Equipment overloaded 450 (2%) 0 (2%) 20 (4%) $16 (2%)
Worn out 350 (2%) 0 (1%) 0 (1%) $9 (1%)
Heat source too close
to combustibles 320 (1%) 0 (1%) 20 (2%) $14 (2%)
Storm 320 (1%) 0 (2%) 0 (0%) $12 (2%)
Water caused short-
circuit arc 280 (1%) 0 (0%) 0 (1%) $7 (1%)
Unclassified factor
contributing to
ignition 230 (1%) 0 (1%) 10 (1%) $6 (1%)
Installation deficiency 210 (1%) 0 (0%) 0 (1%) $12 (2%)
High wind 200 (1%) 0 (0%) 10 (1%) $10 (1%)
Unclassified misuse of
material or product 200 (1%) 0 (0%) 10 (2%) $5 (1%)
Other known factor
contributing to
ignition 820 (4%) 10 (3%) 40 (6%) $30 (4%)
Total fires 22,190 (100%) 230 (100%) 630 (100%) $804 (100%)
Total factors 23,540 (106%) 230 (102%) 690 (110%) $870 (108%)
Note: Figures exclude confined fires. Multiple entries are allowed, which can result in sums higher than totals. Fires, deaths, and
injuries are rounded to the nearest ten and property damage is rounded to the nearest million dollars. Figures reflect a proportional
share of home fires with equipment involved in ignition unknown or reported as electrical distribution or lighting equipment of
undetermined type and of fires in which the factor contributing to ignition was unknown, not reported or coded as none.. Totals may
not equal sums because of rounding error.
Source: Data from NFIRS Version 5.0 and NFPA Experience Survey.

Electrical Fires, 3/17 56 NFPA Research, Quincy, MA
Table 4.6. Home Fires Involving Electrical Wiring and Related Equipment, by Area of Origin 2010-2014 Annual Averages
Area of Origin Fires Civilian Deaths
Civilian Injuries
Direct Property Damage (in Millions)
Attic or ceiling/roof assembly or
concealed space 3,530 (16%) 20 (9%) 40 (7%) $133 (17%)
Bedroom 2,920 (13%) 30 (13%) 170 (28%) $101 (13%)
Wall assembly or concealed space 2,510 (11%) 10 (5%) 40 (7%) $77 (10%)
Exterior wall surface 1,500 (7%) 10 (2%) 10 (2%) $37 (5%)
Kitchen or cooking area 1,500 (7%) 30 (15%) 40 (7%) $51 (6%)
Living room, family room, or den 1,230 (6%) 40 (16%) 90 (14%) $61 (8%)
Crawl space or substructure space 970 (4%) 10 (5%) 20 (3%) $35 (4%)
Ceiling/floor assembly or
concealed space 890 (4%) 30 (13%) 20 (3%) $46 (6%)
Laundry room or area 800 (4%) 0 (2%) 40 (7%) $24 (3%)
Garage or vehicle storage area* 660 (3%) 0 (0%) 20 (3%) $40 (5%)
Unclassified function area 650 (3%) 10 (6%) 30 (4%) $26 (3%)
Lavatory or bathroom 640 (3%) 0 (1%) 10 (2%) $17 (2%)
Closet 390 (2%) 0 (1%) 10 (2%) $17 (2%)
Unclassified structural area 390 (2%) 0 (2%) 10 (2%) $21 (3%)
Conduit, pipe, utility, or
ventilation shaft 340 (2%) 0 (1%) 0 (0%) $6 (1%)
Unclassified storage area 270 (1%) 10 (3%) 10 (1%) $8 (1%)
Unclassified outside area 260 (1%) 0 (0%) 0 (0%) $10 (1%)
Unclassified equipment or service
area 260 (1%) 0 (0%) 10 (2%) $7 (1%)
Unclassified area of origin 240 (1%) 0 (1%) 0 (0%) $5 (1%)
Exterior balcony or unenclosed
porch 210 (1%) 0 (1%) 0 (0%) $10 (1%)
Dining room 190 (1%) 0 (0%) 0 (1%) $6 (1%)
Heating equipment room 190 (1%) 0 (1%) 0 (0%) $7 (1%)
Exterior roof surface 180 (1%) 0 (0%) 0 (0%) $4 (1%)
Storage room, area, tank, or bin 150 (1%) 0 (0%) 0 (0%) $7 (1%)
Storage of supplies or tools or
dead storage 120 (1%) 0 (2%) 10 (1%) $4 (0%)
Lobby or entrance way 120 (1%) 0 (0%) 0 (1%) $6 (1%)
Hallway or corridor 110 (1%) 0 (0%) 0 (0%) $4 (1%)
Other known area of origin 960 (4%) 10 (3%) 20 (3%) $34 (4%)
Total 22,190 (100%) 230 (100%) 630 (100%) 804 (100%)
*Does not include fires in which the property use was coded as a residential garage.
Note: Figures exclude confined fires. Fires, deaths, and injuries are rounded to the nearest ten and property damage is rounded
to the nearest million dollars. Figures reflect a proportional share of home fires with equipment involved in ignition unknown or
reported as electrical distribution or lighting equipment of undetermined type and of unknown area of origin. Totals may not
equal sums because of rounding error. Source: Data from NFIRS Version 5.0 and NFPA Experience Survey.

Electrical Fires, 3/17 57 NFPA Research, Quincy, MA
Table 4.7. Home Fires Involving Electrical Wiring and Related Equipment, by Item First Ignited 2010-2014 Annual Averages
Item First Ignited Fires Civilian Deaths
Civilian Injuries
Direct Property Damage (in Millions)
Electrical wire or cable
insulation 7,500 (34%) 60 (28%) 200 (32%) $216 (27%)
Structural member or framing 4,820 (22%) 80 (34%) 130 (22%) $236 (29%)
Insulation within structural
area 1,820 (8%) 0 (0%) 20 (3%) $44 (5%)
Exterior wall covering or
finish 1,520 (7%) 0 (2%) 20 (3%) $48 (6%)
Interior wall covering,
excluding drapes 1,330 (6%) 10 (6%) 40 (6%) $53 (7%)
Unclassified structural
component or finish 1,090 (5%) 10 (3%) 20 (4%) $40 (5%)
Unclassified item first ignited 520 (2%) 10 (3%) 0 (1%) $9 (1%)
Mattress or bedding 460 (2%) 0 (2%) 40 (7%) $19 (2%)
Interior ceiling cover or
finish 460 (2%) 0 (2%) 0 (1%) $19 (2%)
Multiple items first ignited 250 (1%) 0 (2%) 10 (1%) $13 (2%)
Unclassified furniture or
utensils 240 (1%) 0 (1%) 10 (2%) $12 (2%)
Upholstered furniture or
vehicle seat 200 (1%) 10 (4%) 20 (3%) $12 (1%)
Clothing 200 (1%) 0 (1%) 20 (3%) $9 (1%)
Floor covering rug, carpet, or
mat 200 (1%) 0 (1%) 10 (2%) $10 (1%)
Cabinetry 180 (1%) 10 (3%) 10 (1%) $10 (1%)
Exterior roof covering or
finish 180 (1%) 0 (0%) 0 (0%) $6 (1%)
Appliance housing or casing 170 (1%) 0 (2%) 10 (1%) $5 (1%)
Unclassified soft goods or
wearing apparel 120 (1%) 0 (1%) 10 (1%) $7 (1%)
Other known item first
ignited 930 (4%) 10 (6%) 50 (8%) $36 (5%)
Total 22,190 (100%) 230 (100%) 630 (100%) $804 (100%)
Note: Figures exclude confined fires. Fires, deaths, and injuries are rounded to the nearest ten and direct property damage to the nearest
million dollars. Figures reflect a proportional share of home fires with equipment involved in ignition unknown or reported as electrical
distribution or lighting equipment of undetermined type and of unknown item. Totals may not equal sums because of rounding error.
Source: Data from NFIRS Version 5.0 and NFPA Experience Survey.

Electrical Fires, 3/17 58 NFPA Research, Quincy, MA
Section 5. Home Fires Involving Lamps, Light Fixtures, and Light Bulbs______
In 2010-2014, there were an estimated 4,920 non-confined home structure fires involving lamps, light fixtures, and light bulbs each year. These fires resulted in an estimated annual
average of 50 civilian deaths, 220 civilian injuries, and $166 million in direct property damage.
As shown in Figure 5.1, home structure fires involving lamps, light fixtures, and light bulbs
declined sharply in the early 1980s, followed by a less dramatic downward trend through the rest
of the decade, and then rose through most of the 1990s. The number of annual fires throughout
the 2000s has been substantially lower than prior levels, despite year to year fluctuations. The
historic low of 4,120 fires in 2009 was 69% lower than the high of 13,260 fires in 1980.
Detailed information is available in Table 5.1.
Note: See Note on Table 5.1. Because of low participation in NFIRS Version 5.0 during 1999-2001, data from these years is not reported in
these tables.
Three types of equipment together accounted for 70% of home fires involving lamps, light fixtures and light bulbs: unclassified lamps or lighting (31%), incandescent lighting fixtures (21%), and tabletop, floor, or desk lamps (18%). The fires involving tabletop, floor
or desk lamps, while accounting for just under one-fifth of the fires, caused approximately one-
third of the civilian injuries (34%). Light bulbs accounted for 7% of fires, but 20% of civilian
deaths, as well as 4% of civilian injuries and 5% of direct property damage. Halogen lighting
fixtures and lamps also accounted for 7% of fires, while fluorescent lighting fixtures or ballasts
accounted for 6% of fires. Details are shown in Table 5.A.
13,260
4,120
5,140
0
2,000
4,000
6,000
8,000
10,000
12,000
14,000
Fir
es
Year
Figure 5.1. Annual Home Fires Involving Lamps, Light Fixtures,
and Light Bulbs, 1980-2014

Electrical Fires, 3/17 59 NFPA Research, Quincy, MA
Table 5.A. Home Fires Involving Lamps, Light Fixtures, and Light Bulbs, by Type of Equipment 2010-2014 Annual Averages
Type of Equipment Fires Civilian Deaths
Civilian Injuries
Direct Property Damage (in Millions)
Unclassified lamp or lighting 1,510 (31%) 20 (35%) 70 (30%) $48 (29%)
Incandescent lighting fixture 1,050 (21%) 0 (3%) 20 (11%) $31 (18%)
Tabletop, floor or desk lamp 870 (18%) 10 (21%) 70 (34%) $31 (18%)
Light bulb 360 (7%) 10 (20%) 10 (4%) $8 (5%)
Halogen lighting fixture or lamp 340 (7%) 0 (4%) 10 (3%) $15 (9%)
Fluorescent lighting fixture or
ballast 280 (6%) 0 (0%) 10 (5%) $11 (7%)
Decorative lights or line voltage 190 (4%) 10 (10%) 10 (7%) $11 (6%)
Work light or trouble light 160 (3%) 0 (4%) 10 (3%) $6 (4%)
Other known equipment involved
in ignition 150 (3%) 0 (3%) 0 (4%) $6 (4%)
Total 4,920 (100%) 50 (100%) 220 (100%) $166 (100%)
Note: Figures exclude confined fires. Fires, deaths, and injuries are rounded to the nearest ten and direct property damage to the nearest million dollars.
Figures reflect a proportional share of home fires with equipment involved in ignition unknown or recorded as electrical distribution or lighting equipment
of undetermined type. Totals may not equal sums because of rounding error.
Source: NFIRS Version 5.0 and NFPA Fire Experience Survey.
Timing of fires. December, January, and April were the peak months for home fires involving
lamps, light fixtures, and light bulbs, each with 10% of the total. May and November fires each
accounted for 9% of fires. All remaining months had 7% or 8% of the total. See Table 5.2. Fires
showed no pattern for day of week, with each day of the week having either 14% or 15% of the
total, as shown in Table 5.3 Home fires involving lamps, light fixtures, and bulbs are less
frequent in the overnight hours from midnight to 8 a.m. (22% of total), but these fires result in
higher shares of civilian death (39%) and injury (39%) than fires at other times of day. Nearly
half of the fires (46%) occurred between 4 p.m. and midnight. See Figure 5.2 for details. More
information of fires by alarm time is also available in Table 5.4.
Note: See Note on Table 5.4. Source: NFIRS Version 5.0 and NFPA Fire Experience Survey.
22%
32%
46%
39%
34%
27%
39%
27%
35%
28%
35%37%
0%
10%
20%
30%
40%
50%
Midnight - 8 a.m. 8 a.m. - 4:00 p.m. 4:00 p.m. - Midnight
Figure 5.2 Home Fires Involving Lamps, Light Fixtures, and Light Bulbs,
by Alarm Time
Fires Civilian Deaths Civilian Injuries Direct Property Damage

Electrical Fires, 3/17 60 NFPA Research, Quincy, MA
Factor Contributing to Ignition. The leading factor contributing to ignition in home fires
involving lamps, light fixtures, and bulbs is being too close to combustible material (31% of
total), as shown in Table 5.5. These fires resulted in a disproportionate share of civilian deaths
(58%), as well as 37% of civilian injuries and 28% of direct property damage. This underscores
the importance of maintaining lighting sources at a safe distance from materials that may be
ignited by the heat. Unclassified electrical failures or malfunctions contributed to 18% of the
fires, followed by unspecified short circuit arcs (12%), short circuit arcs from defective or worn
insulation (5%), and leaving equipment unattended (4%).
Area of Origin. The bedroom was the leading area of origin for home fires involving lamps,
light fixtures, and bulbs, with 22% of the total, while also accounting for 25% of civilian deaths,
40% of civilian injuries, and 20% of direct property damage. One-tenth of the fires (10%)
originated in an attic or ceiling/roof assembly or concealed space; with 9% originating in a living
room, family room, or den; 7% in a bathroom or lavatory; 6% on an exterior wall surface; and
5% in a kitchen or cooking area. The 9% of fires originating in a living room, family room, or
den accounted for 29% of civilian deaths and 15% of civilian injuries from these fires.
Item First Ignited. The leading item first ignited in home fires involving lamps, light fixtures,
and light bulbs was electrical wire or cable insulation, with 15% of the total, followed by
structural member or framing (9%), mattress or bedding (7%), clothing (7%), insulation within
structural area (7%), and exterior wall covering or finish (5%). The fires in which the item first
ignited was mattress or bedding accounted for 25% of civilian deaths, 13% of civilian injuries,
and 8% of direct property damage. See Table 5.7 for more information.
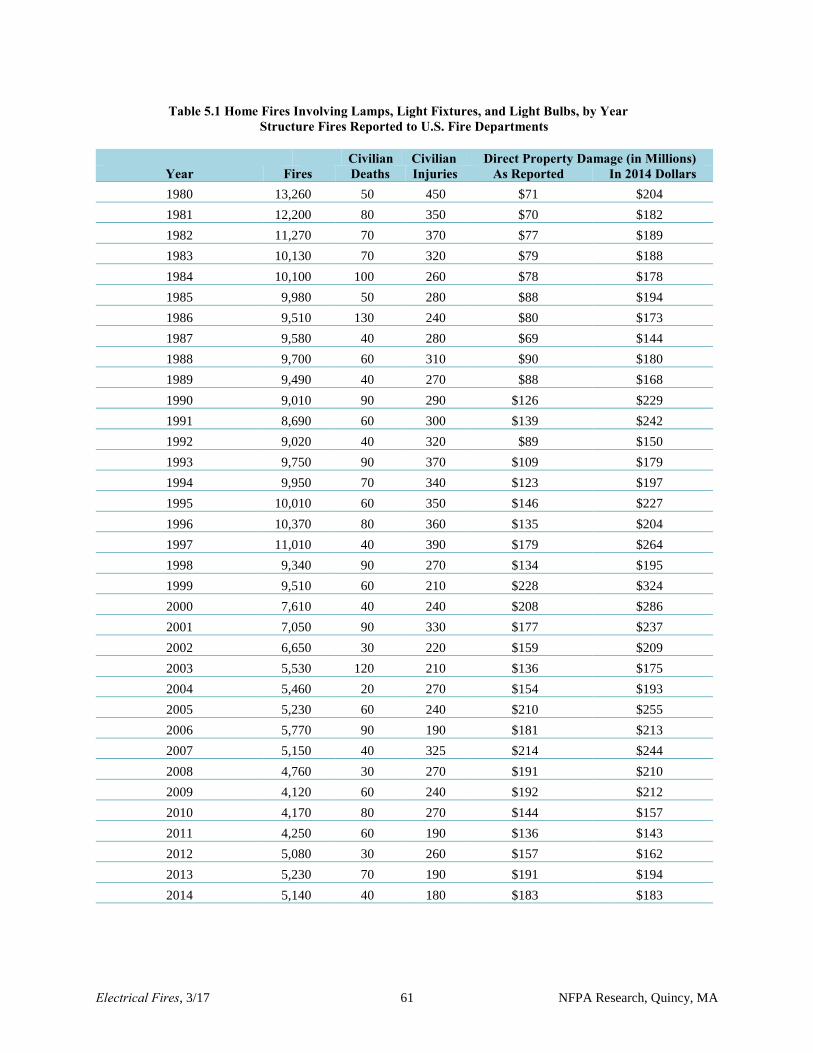
Electrical Fires, 3/17 61 NFPA Research, Quincy, MA
Table 5.1 Home Fires Involving Lamps, Light Fixtures, and Light Bulbs, by Year Structure Fires Reported to U.S. Fire Departments
Civilian Civilian Direct Property Damage (in Millions)
Year Fires Deaths Injuries As Reported In 2014 Dollars 1980 13,260 50 450 $71 $204
1981 12,200 80 350 $70 $182
1982 11,270 70 370 $77 $189
1983 10,130 70 320 $79 $188
1984 10,100 100 260 $78 $178
1985 9,980 50 280 $88 $194
1986 9,510 130 240 $80 $173
1987 9,580 40 280 $69 $144
1988 9,700 60 310 $90 $180
1989 9,490 40 270 $88 $168
1990 9,010 90 290 $126 $229
1991 8,690 60 300 $139 $242
1992 9,020 40 320 $89 $150
1993 9,750 90 370 $109 $179
1994 9,950 70 340 $123 $197
1995 10,010 60 350 $146 $227
1996 10,370 80 360 $135 $204
1997 11,010 40 390 $179 $264
1998 9,340 90 270 $134 $195
1999 9,510 60 210 $228 $324
2000 7,610 40 240 $208 $286
2001 7,050 90 330 $177 $237
2002 6,650 30 220 $159 $209
2003 5,530 120 210 $136 $175
2004 5,460 20 270 $154 $193
2005 5,230 60 240 $210 $255
2006 5,770 90 190 $181 $213
2007 5,150 40 325 $214 $244
2008 4,760 30 270 $191 $210
2009 4,120 60 240 $192 $212
2010 4,170 80 270 $144 $157
2011 4,250 60 190 $136 $143
2012 5,080 30 260 $157 $162
2013 5,230 70 190 $191 $194
2014 5,140 40 180 $183 $183

Electrical Fires, 3/17 62 NFPA Research, Quincy, MA
Table 5.1 Home Fires Involving Lamps, Light Fixtures, and Light Bulbs, by Year Structure Fires Reported to U.S. Fire Departments (Continued)
* All 1991 home fire property damage figures are inflated by estimation problems related to the handling of the Oakland fire
storm.
Note: Figures exclude confined fires. Fires, deaths, and injuries to the nearest ten, and property damage is rounded to the
nearest million dollars. Figures reflect a proportional share of home fires with equipment involved in ignition unknown or
reported as electrical distribution or lighting equipment of undetermined type. Because of low participation in NFIRS
Version 5.0 during 1999-2001, estimates for those years are highly uncertain and must be used with caution. Inflation
adjustment to 2014 dollars is calculated using the Consumer Price Index.
Source: Data from NFIRS and NFPA Survey.

Electrical Fires, 3/17 63 NFPA Research, Quincy, MA
Table 5.2. Home Fires Involving Lamps, Light Fixtures, and Light Bulbs, by Month 2010-2014 Annual Averages
Month Fires Civilian Deaths
Civilian Injuries
Direct Property Damage (in Millions)
January 490 (10%) 10 (13%) 20 (10%) $21 (13%)
February 380 (8%) 0 (3%) 20 (11%) $14 (8%)
March 390 (8%) 10 (11%) 20 (9%) $12 (7%)
April 480 (10%) 0 (4%) 10 (6%) $11 (7%)
May 430 (9%) 0 (3%) 20 (8%) $16 (10%)
June 390 (8%) 10 (17%) 10 (5%) $12 (7%)
July 390 (8%) 0 (3%) 20 (10%) $11 (6%)
August 370 (7%) 10 (20%) 10 (3%) $10 (6%)
September 360 (7%) 0 (8%) 10 (6%) $11 (7%)
October 350 (7%) 0 (4%) 20 (10%) $10 (6%)
November 440 (9%) 0 (4%) 30 (12%) $17 (10%)
December 470 (10%) 10 (10%) 20 (10%) $21 (12%)
Total 4,920 (100%) 50 (100%) 220 (100%) $166 (100%)
Note: Figures exclude confined fires. Fires, deaths, and injuries are rounded to the nearest ten and property damage is rounded to
the nearest million dollars. Figures reflect a proportional share of home fires with equipment involved in ignition unknown or
reported as electrical distribution or lighting equipment of undetermined type. Totals may not equal sums because of rounding
error.
Source: Data from NFIRS Version 5.0 and NFPA Experience Survey.

Electrical Fires, 3/17 64 NFPA Research, Quincy, MA
Table 5.3. Home Fires Involving Lamps, Light Fixtures, and Light Bulbs, by Day 2010-2014 Annual Averages
Day of Week Fires Civilian Deaths
Civilian Injuries
Direct Property Damage (in Millions)
Sunday 670 (14%) 0 (7%) 50 (21%) $27 (16%)
Monday 700 (14%) 10 (11%) 20 (9%) $21 (13%)
Tuesday 730 (15%) 10 (18%) 50 (25%) $25 (15%)
Wednesday 700 (14%) 10 (10%) 20 (8%) $21 (13%)
Thursday 680 (14%) 0 (3%) 30 (13%) $28 (17%)
Friday 720 (15%) 10 (24%) 30 (14%) $23 (14%)
Saturday 710 (15%) 10 (27%) 20 (11%) $22 (13%)
Total 4,920 (100%) 50 (100%) 220 (100%) $166 (100%)
Note: Figures exclude confined fires. Fires, deaths, and injuries are rounded to the nearest ten and property damage is rounded to
the nearest million dollars. Figures reflect a proportional share of home fires with equipment involved in ignition unknown or
reported as electrical distribution or lighting equipment of undetermined type. Totals may not equal sums because of rounding
error.
Source: Data from NFIRS Version 5.0 and NFPA Experience Survey.

Electrical Fires, 3/17 65 NFPA Research, Quincy, MA
Table 5.4. Home Fires Involving Lamps, Light Fixtures, and Light Bulbs, by Alarm Time 2010-2014 Annual Averages
Alarm Time Fires Civilian Deaths
Civilian Injuries
Direct Property Damage (in Millions)
Midnight-12:59 a.m. 200 (4%) 0 (0%) 20 (7%) $7 (4%)
1:00-1:59 a.m. 150 (3%) 0 (8%) 10 (3%) $10 (6%)
2:00-2:59 a.m. 140 (3%) 0 (3%) 10 (6%) $5 (3%)
3:00-3:59 a.m. 120 (2%) 0 (4%) 20 (10%) $5 (3%)
4:00-4:59 a.m. 120 (2%) 10 (11%) 10 (3%) $6 (4%)
5:00-5:59 a.m. 110 (2%) 0 (4%) 10 (4%) $5 (3%)
6:00-6:59 a.m. 110 (2%) 0 (0%) 10 (3%) $2 (1%)
7:00-7:59 a.m. 140 (3%) 10 (10%) 10 (3%) $5 (3%)
8:00-8:59 a.m. 160 (3%) 0 (0%) 10 (2%) $5 (3%)
9:00-9:59 a.m. 180 (4%) 0 (7%) 10 (5%) $6 (4%)
10:00-10:59 a.m. 180 (4%) 10 (20%) 10 (3%) $5 (3%)
11:00-11:59 a.m. 190 (4%) 0 (0%) 0 (2%) $7 (4%)
12:00-12:59 p.m. 200 (4%) 0 (0%) 10 (4%) $8 (5%)
1:00-1:59 p.m. 220 (5%) 0 (0%) 10 (3%) $8 (5%)
2:00-2:59 p.m. 220 (4%) 0 (0%) 0 (1%) $7 (4%)
3:00-3:59 p.m. 230 (5%) 0 (6%) 10 (6%) $11 (6%)
4:00-4:59 p.m. 240 (5%) 0 (6%) 10 (4%) $10 (6%)
5:00-5:59 p.m. 250 (5%) 0 (0%) 10 (4%) $7 (4%)
6:00-6:59 p.m. 270 (6%) 0 (4%) 10 (3%) $9 (5%)
7:00-7:59 p.m. 310 (6%) 0 (0%) 10 (6%) $9 (5%)
8:00-8:59 p.m. 350 (7%) 0 (4%) 10 (6%) $8 (5%)
9:00-9:59 p.m. 350 (7%) 0 (6%) 10 (5%) $7 (4%)
10:00-10:59 p.m. 270 (6%) 0 (0%) 0 (1%) $6 (4%)
11:00-11:59 p.m. 220 (4%) 0 (7%) 10 (5%) $7 (4%)
Total 4,920 (100%) 50 (100%) 220 (100%) $166 (100%)
Note: Figures exclude confined fires. Fires, deaths, and injuries are rounded to the nearest ten and property damage is rounded to
the nearest million dollars. Figures reflect a proportional share of home fires with equipment involved in ignition unknown or
reported as electrical distribution or lighting equipment of undetermined type. Totals may not equal sums because of rounding
error.
Source: Data from NFIRS Version 5.0 and NFPA Experience Survey.

Electrical Fires, 3/17 66 NFPA Research, Quincy, MA
Table 5.5. Home Fires Involving Lamps, Light Fixtures, and Light Bulbs, by Factor Contributing to Ignition 2010-2014 Annual Averages
Factor Contributing to Ignition Fires
Civilian Deaths
Civilian Injuries
Direct Property Damage (in Millions)
Heat source too close to
combustibles 1,510 (31%) 30 (58%) 80 (37%) $50 (28%)
Unclassified electrical failure
or malfunction 880 (18%) 10 (13%) 40 (18%) $36 (20%)
Unspecified short-circuit arc 600 (12%) 0 (9%) 20 (11%) $21 (12%)
Short circuit arc from
defective or worn insulation 270 (5%) 0 (4%) 10 (6%) $9 (5%)
Equipment unattended 180 (4%) 0 (0%) 20 (7%) $6 (3%)
Animal 150 (3%) 0 (4%) 0 (1%) $2 (1%)
Unclassified mechanical
failure or malfunction 140 (3%) 0 (0%) 10 (3%) $4 (2%)
Arc or spark from operating
equipment 130 (3%) 0 (0%) 0 (1%) $5 (3%)
Fluorescent light ballast 130 (3%) 0 (0%) 10 (4%) $6 (3%)
Unclassified misuse of
material or product 130 (3%) 0 (0%) 10 (5%) $3 (2%)
Accidentally turned on or not
turned off 130 (3%) 0 (0%) 0 (1%) $7 (4%)
Collision, knock down, run
over, or turn over 120 (2%) 0 (9%) 10 (6%) $3 (2%)
Unclassified factor
contributing to ignition 100 (2%) 0 (0%) 10 (4%) $2 (1%)
Arc from faulty contact or
broken conductor 100 (2%) 0 (0%) 0 (2%) $4 (2%)
Installation deficiency 80 (2%) 0 (0%) 0 (1%) $1 (1%)
Failure to clean 70 (1%) 0 (0%) 0 (0%) $1 (0%)
Short circuit arc from
mechanical damage 60 (1%) 0 (0%) 0 (0%) $3 (1%)
Equipment not being operated
properly 60 (1%) 0 (5%) 0 (1%) $2 (1%)
Abandoned or discarded
materials or products 50 (1%) 0 (0%) 0 (0%) $1 (0%)
Equipment not used for
intended purpose 50 (1%) 0 (0%) 0 (2%) $1 (1%)
Equipment overloaded 40 (1%) 0 (0%) 0 (0%) $2 (1%)
Worn out 40 (1%) 0 (8%) 0 (0%) $2 (1%)
Unclassified operational
deficiency 40 (1%) 0 (0%) 0 (1%) $2 (1%)
Improper container or storage 30 (1%) 0 (0%) 0 (1%) $0 (0%)
Unclassified design,
manufacture, or installation
deficiency 30 (1%) 0 (0%) 0 (1%) $1 (1%)
Other known factor
contributing to ignition 150 (3%) 0 (4%) 10 (3%) $7 (4%)

Electrical Fires, 3/17 67 NFPA Research, Quincy, MA
Table 5.5. Home Fires Involving Lamps, Light Fixtures, and Light Bulbs, by Factor Contributing to Ignition 2010-2014 Annual Averages (Continued)
Factor Contributing to Ignition Fires
Civilian Deaths
Civilian Injuries
Direct Property Damage (in Millions)
Total fires 4,920 (100%) 50 (100%) 220 (100%) $166 (100%)
Total factors 5,290 (107%) 60 (113%) 250 (115%) $180 (109%)
Note: Figures exclude confined fires. Multiple entries are allowed, which can result in sums higher than totals. Figures reflect a
proportional share of home fires with equipment involved in ignition unknown or reported as electrical distribution or lighting
equipment of undetermined type. Fires, deaths, and injuries are rounded to the nearest ten and property damage is rounded to the
nearest million dollars. Totals may not equal sums because of rounding error.
Source: Data from NFIRS Version 5.0 and NFPA Experience Survey.
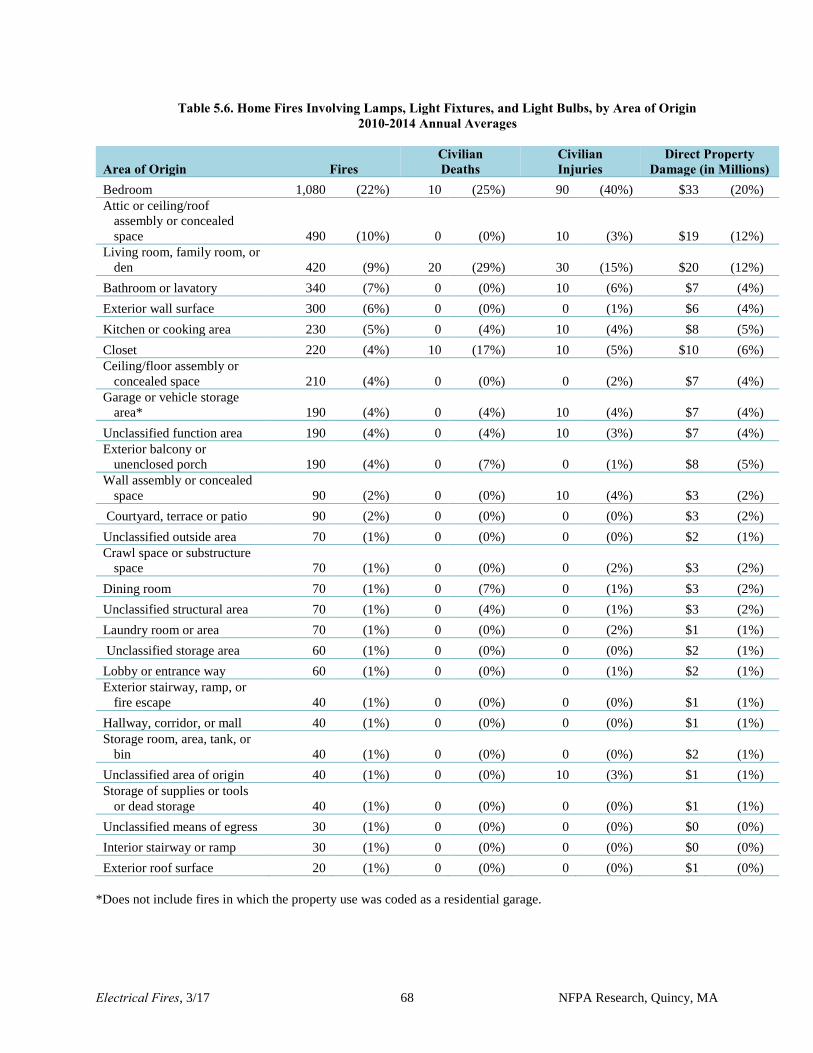
Electrical Fires, 3/17 68 NFPA Research, Quincy, MA
Table 5.6. Home Fires Involving Lamps, Light Fixtures, and Light Bulbs, by Area of Origin 2010-2014 Annual Averages
Area of Origin Fires Civilian Deaths
Civilian Injuries
Direct Property Damage (in Millions)
Bedroom 1,080 (22%) 10 (25%) 90 (40%) $33 (20%)
Attic or ceiling/roof
assembly or concealed
space 490 (10%) 0 (0%) 10 (3%) $19 (12%)
Living room, family room, or
den 420 (9%) 20 (29%) 30 (15%) $20 (12%)
Bathroom or lavatory 340 (7%) 0 (0%) 10 (6%) $7 (4%)
Exterior wall surface 300 (6%) 0 (0%) 0 (1%) $6 (4%)
Kitchen or cooking area 230 (5%) 0 (4%) 10 (4%) $8 (5%)
Closet 220 (4%) 10 (17%) 10 (5%) $10 (6%)
Ceiling/floor assembly or
concealed space 210 (4%) 0 (0%) 0 (2%) $7 (4%)
Garage or vehicle storage
area* 190 (4%) 0 (4%) 10 (4%) $7 (4%)
Unclassified function area 190 (4%) 0 (4%) 10 (3%) $7 (4%)
Exterior balcony or
unenclosed porch 190 (4%) 0 (7%) 0 (1%) $8 (5%)
Wall assembly or concealed
space 90 (2%) 0 (0%) 10 (4%) $3 (2%)
Courtyard, terrace or patio 90 (2%) 0 (0%) 0 (0%) $3 (2%)
Unclassified outside area 70 (1%) 0 (0%) 0 (0%) $2 (1%)
Crawl space or substructure
space 70 (1%) 0 (0%) 0 (2%) $3 (2%)
Dining room 70 (1%) 0 (7%) 0 (1%) $3 (2%)
Unclassified structural area 70 (1%) 0 (4%) 0 (1%) $3 (2%)
Laundry room or area 70 (1%) 0 (0%) 0 (2%) $1 (1%)
Unclassified storage area 60 (1%) 0 (0%) 0 (0%) $2 (1%)
Lobby or entrance way 60 (1%) 0 (0%) 0 (1%) $2 (1%)
Exterior stairway, ramp, or
fire escape 40 (1%) 0 (0%) 0 (0%) $1 (1%)
Hallway, corridor, or mall 40 (1%) 0 (0%) 0 (0%) $1 (1%)
Storage room, area, tank, or
bin 40 (1%) 0 (0%) 0 (0%) $2 (1%)
Unclassified area of origin 40 (1%) 0 (0%) 10 (3%) $1 (1%)
Storage of supplies or tools
or dead storage 40 (1%) 0 (0%) 0 (0%) $1 (1%)
Unclassified means of egress 30 (1%) 0 (0%) 0 (0%) $0 (0%)
Interior stairway or ramp 30 (1%) 0 (0%) 0 (0%) $0 (0%)
Exterior roof surface 20 (1%) 0 (0%) 0 (0%) $1 (0%)
*Does not include fires in which the property use was coded as a residential garage.

Electrical Fires, 3/17 69 NFPA Research, Quincy, MA
Table 5.6. Home Fires Involving Lamps, Light Fixtures, and Light Bulbs, by Area of Origin 2010-2014 Annual Averages (Continued)
Area of Origin Fires Civilian Deaths
Civilian Injuries
Direct Property Damage (in Millions)
Other known areas of origin 120 (2%) 0 (0%) 0 (1%) $5 (3%)
Total 4,920 (100%) 50 (100%) 220 (100%) $166 (100%)
Note: Figures exclude confined fires. Figures reflect a proportional share of home fires with equipment involved in ignition unknown or
reported as electrical distribution or lighting equipment of undetermined type. Fires deaths, and injuries are rounded to the nearest ten and
direct property damage to the nearest million dollars. Totals may not equal sums because of rounding error.
Source: Data from NFIRS Version 5.0 and NFPA Experience Survey.

Electrical Fires, 3/17 70 NFPA Research, Quincy, MA
Table 5.7. Home Fires Involving Lamps, Light Fixtures, and Light Bulbs, by Item First Ignited 2010-2014 Annual Averages
Item First Ignited Fires Civilian Deaths
Civilian Injuries
Direct Property Damage (in Millions)
Electrical wire or cable insulation 740 (15%) 10 (15%) 30 (16%) $20 (12%)
Structural member or framing 420 (9%) 0 (4%) 10 (3%) $18 (11%)
Mattress or bedding 370 (7%) 10 (25%) 30 (13%) $13 (8%)
Clothing 340 (7%) 0 (0%) 20 (10%) $6 (3%)
Insulation within structural area 330 (7%) 0 (0%) 0 (0%) $11 (7%)
Exterior wall covering or finish 270 (5%) 0 (0%) 0 (0%) $9 (5%)
Interior ceiling cover or finish 190 (4%) 0 (7%) 0 (2%) $6 (3%)
Light vegetation including grass 160 (3%) 0 (0%) 0 (1%) $2 (1%)
Unclassified item First Ignited 150 (3%) 0 (0%) 10 (3%) $3 (2%)
Upholstered furniture or vehicle
seat 150 (3%) 10 (19%) 20 (7%) $9 (5%)
Linen other than bedding 140 (3%) 0 (0%) 10 (3%) $5 (3%)
Floor covering rug, carpet, or
mat 140 (3%) 0 (0%) 10 (3%) $8 (5%)
Appliance housing or casing 140 (3%) 0 (0%) 10 (4%) $3 (2%)
Unclassified soft goods or
wearing apparel 140 (3%) 0 (3%) 10 (5%) $4 (3%)
Unclassified furniture or utensils 120 (2%) 0 (8%) 10 (6%) $4 (2%)
Unclassified structural component
or finish 120 (2%) 0 (0%) 0 (0%) $5 (3%)
Unclassified organic materials 120 (2%) 0 (0%) 0 (0%) $3 (2%)
Curtains, blinds, drapery, or
tapestry 110 (2%) 0 (3%) 10 (6%) $3 (2%)
Interior wall covering. excluding
drapes 90 (2%) 0 (0%) 0 (1%) $4 (3%)
Cabinetry 80 (2%) 0 (0%) 0 (1%) $4 (2%)
Box, carton, bag, basket, or barrel 70 (1%) 0 (0%) 0 (0%) $4 (2%)
Magazine, newspaper, or writing
paper 60 (1%) 0 (8%) 0 (1%) $3 (2%)
Multiple items first ignited 50 (1%) 0 (0%) 0 (2%) $4 (3%)
Other known item first ignited 430 (9%) 0 (8%) 30 (12%) $17 (10%)
Total 4,920 (100%) 50 (100%) 220 (100%) $166 (100%)
Note: Figures exclude confined fires. Fires deaths, and injuries are rounded to the nearest ten and direct property damage to the
nearest million dollars. Figures reflect a proportional share of home fires with equipment involved in ignition unknown or reported as
electrical distribution or lighting equipment of undetermined type. Damage has not been adjusted for inflation. Totals may not equal
sums because of rounding error.
Source: Data from NFIRS Version 5.0 and NFPA Experience Survey.

Electrical Fires, 3/17 71 NFPA Research, Quincy, MA
Section 6. Home Fires Involving Cords and Plugs_________________________
In 2010-2014, there were an estimated 3,070 non-confined home fires each year involving cords or plugs. These fires annually resulted in 110 civilian deaths, 230 civilian injuries, and
$141 million in direct property damage.
As shown in Figure 6.1, home fires involving cords and plugs dropped sharply through the first
half of the 1980s, then continued to decline, with some year-to-year fluctuation through 1998.
Between 2002 and 2009, there was little change in the of fires per year. Fires fell to a
historic low of an estimated 2,070 fires in 2010. The estimated number of fires has increased
every year since that low point, while remaining well below the numbers recorded prior to 2000.
Note: Because of low participation in NFIRS Version 5.0 during 1999-2001, data from these years is not reported in these tables. See Note on Table 6.1.
Extension cords account for the greatest share of home fires involving cords or plugs, with 57% of the fire total. These fires are responsible for even greater shares of civilian deaths
(70%) and civilian injuries (69%), as well as 56% of direct property damage. See Table 6.A.
Unclassified cords or plugs were responsible for another 17% of home fires involving cords or
plugs (21% of civilian deaths, 15% of civilian injuries, and 21% of direct property damage).
Detachable cords and plugs accounted for 13% of fires involving cords and plugs and
permanently attached power cords or plugs accounted for the remaining 12% of fires.
13,450
2,070
3,510
0
2,000
4,000
6,000
8,000
10,000
12,000
14,000
16,000
Fir
es
Year
Figure 6.1. Annual Home Fires Involving Cords or Plugs, 1980-2014

Electrical Fires, 3/17 72 NFPA Research, Quincy, MA
Table 6.A. Home Fires Involving Cords or Plugs 2010-2014 Annual Averages
Type of Equipment Fires Civilian Deaths
Civilian Injuries
Direct Property Damage (in Millions)
Extension cord 1,750 (57%) 80 (70%) 160 (69%) $79 (56%)
Unclassified cord or plug 540 (17%) 20 (21%) 40 (15%) $30 (21%)
Detachable power cord or
plug 400 (13%) 0 (4%) 20 (8%) $16 (12%)
Permanently attached power
cord or plug 380 (12%) 10 (5%) 20 (7%) $16 (11%)
Total 3,070 (100%) 110 (100%) 230 (100%) $141 (100%)
Note: Figures exclude confined fires. Fires, deaths, and injuries are rounded to the nearest ten and direct property damage to the nearest million dollars.
Figures reflect a proportional share of home fires with equipment involved in ignition unknown or recorded as electrical distribution or lighting equipment of undetermined type. Totals may not equal sums because of rounding error.
Source: NFIRS Version 5.0 and NFPA Fire Experience Survey
Timing of fires. The months with the greatest shares of home fires involving cords or plugs
were December (11%), January (10%), February (9%), July (9%), and November (9%). See
Table 6.2. No significant trends are apparent in these fires by day of week. Results are shown in
Table 6.3.
As shown in Figure 6.2, fewer home fires involving cords and plugs took place between
midnight and 8 a.m. (24% of total), but these fires accounted for nearly 3 in 5 civilian deaths
(57%), 40% of civilian injuries, and 26% of direct property damage. Almost two in five fires
occurred between 8 a.m. and 4 p.m., but these fires were associated with 15% of civilian deaths
and 29% of civilian injuries. The remaining 38% of fires took place between 4 p.m. and
midnight and were associated with 28% of civilian deaths, 31% of civilian injuries, and 34% of
direct property damage. The complete data is available in Table 6.4.
Note: See Note on Table 6.4. Source: NFIRS Version 5.0 and NFPA Fire Experience Survey.
24%
39% 38%
57%
15%
28%
40%
29% 31%26%
39%34%
0%
10%
20%
30%
40%
50%
60%
Midnight - 8 a.m. 8 a.m. - 4:00 p.m. 4:00 p.m. - Midnight
Figure 6.2. Home Fires Involving Cords or Plugs, by Alarm Time
2010-2014 Annual Averages
Fires Civilian Deaths Civilian Injuries Direct Property Damage
Electrical Fires, 3/17 73 NFPA Research, Quincy, MA
Factor contributing to ignition. The leading factor contributing to ignition of home fires
involving cords or plugs was unclassified electrical failure or malfunction (31% of total),
followed by unspecified short circuit arc (22%), equipment overloaded (13%), and short circuit
arc from defective or worn insulation (12%). The fires involving unspecified short circuit arcs
accounted approximately half (49%) of the civilian deaths, while overloaded equipment fires
were associated with one-fifth (20%) of civilian injuries. Other leading factors contributing to
ignition included unclassified misuse of material or product (6%), arc from faulty contact or
broken conductor (4%), short circuit arc from mechanical damage (3%), and heat source too
close to combustibles (3%). See Table 6.5 for details.
Area of origin. One-third (33%) of home fires involving cords or plugs originated in the
bedroom. These fires accounted for 21% of civilian deaths, 41% of civilian injuries, and 33% of
direct property damage. The second leading area of origin was a living room or family room,
with 15% of fires, as well as 32% of civilian deaths, 21% of civilian injuries, and 18% of direct
property damage. Other leading areas of origin included kitchens or cooking areas (6%), garages
or vehicle storage areas (6%), unclassified function areas (6%), laundry rooms (4%), and crawl
or substructure spaces (3%). See Table 6.6 for more information
Item first ignited. The leading item first ignited in home fires involving cord or plugs was
electrical wire or cable insulation, with 39% of the total, followed by floor covering, rug, carpet,
or mat (8%), mattress or bedding (7%), clothing (5%), interior wall covering, excluding drapes
(5%), structural member or framing (3%), unclassified furniture or utensils (3%), and multiple
items first ignited (3%). See Table 6.7 for details.
6.1 Home Fires Involving Extension Cords
As indicated in Table 6.A, fires involving extension cords account for 57% of the fires involving cords or plugs, as well as disproportionate shares of civilian deaths (70%) and injuries (69%). Extension cords were involved in an estimated average of 1,750 non-confined
home fires in the 2010-2014 period. These fires resulted in annual averages of 80 civilian deaths,
160 civilian injuries, and $79 million in direct property damage, as indicated in Table 6.A.
Factor contributing to ignition. Unclassified electrical failures or malfunctions (29% of fires)
and unspecified short circuit arcs (22% of fires) were the leading factors contributing to the
ignition of home fires involving extension cords. The fires in which unspecified short circuit
arcs contributed to ignition accounted for 46% of civilian deaths. Other leading factors
contributing to ignition included equipment overloaded (17% of fires), short circuit arc from
defective or worn insulation (13%), and unclassified misuse of material or product (7%). See
Table 6.8 for details.
Area of origin. Bedrooms are the leading area of origin for home fires involving extension
cords, with 35% of the total. These fires accounted for 24% of the civilian deaths, 43% of the
civilian injuries, and 34% of the direct property damage. Another 14% of fires originated in
living rooms, family rooms, or dens, and these fires resulted in 28% of the civilian deaths,
21% of civilian injuries, and 15% of direct property damage. Other leading areas of origin
included garages or vehicle storage areas (7% of fires), unclassified function areas (7%), and
kitchens or cooking areas (5%). See Table 6.9.

Electrical Fires, 3/17 74 NFPA Research, Quincy, MA
Item first ignited. In nearly two of five home fires involving extension cords (39%), the item
first ignited was electrical wire or cable insulation. These fires accounted for 18% of civilian
deaths, 35% of civilian injuries, and 36% of direct property damage. Other leading items first
ignited included floor coverings, rugs, carpets, or mats (9%), mattresses or bedding (7%),
upholstered furniture (6%), and clothing (5%). Fires in which upholstered furniture was first
ignited accounted for 27% of the civilian deaths. See Table 6.10 for more information.
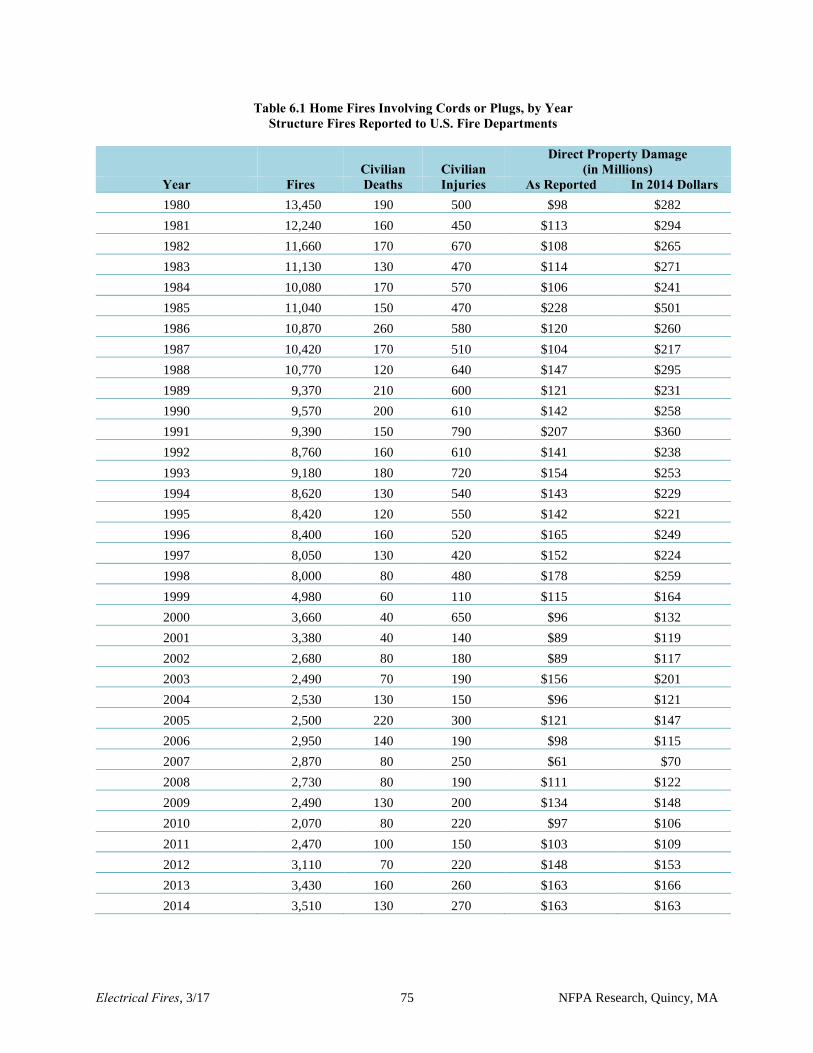
Electrical Fires, 3/17 75 NFPA Research, Quincy, MA
Table 6.1 Home Fires Involving Cords or Plugs, by Year Structure Fires Reported to U.S. Fire Departments
Civilian Civilian Direct Property Damage
(in Millions) Year Fires Deaths Injuries As Reported In 2014 Dollars 1980 13,450 190 500 $98 $282
1981 12,240 160 450 $113 $294
1982 11,660 170 670 $108 $265
1983 11,130 130 470 $114 $271
1984 10,080 170 570 $106 $241
1985 11,040 150 470 $228 $501
1986 10,870 260 580 $120 $260
1987 10,420 170 510 $104 $217
1988 10,770 120 640 $147 $295
1989 9,370 210 600 $121 $231
1990 9,570 200 610 $142 $258
1991 9,390 150 790 $207 $360
1992 8,760 160 610 $141 $238
1993 9,180 180 720 $154 $253
1994 8,620 130 540 $143 $229
1995 8,420 120 550 $142 $221
1996 8,400 160 520 $165 $249
1997 8,050 130 420 $152 $224
1998 8,000 80 480 $178 $259
1999 4,980 60 110 $115 $164
2000 3,660 40 650 $96 $132
2001 3,380 40 140 $89 $119
2002 2,680 80 180 $89 $117
2003 2,490 70 190 $156 $201
2004 2,530 130 150 $96 $121
2005 2,500 220 300 $121 $147
2006 2,950 140 190 $98 $115
2007 2,870 80 250 $61 $70
2008 2,730 80 190 $111 $122
2009 2,490 130 200 $134 $148
2010 2,070 80 220 $97 $106
2011 2,470 100 150 $103 $109
2012 3,110 70 220 $148 $153
2013 3,430 160 260 $163 $166
2014 3,510 130 270 $163 $163
Electrical Fires, 3/17 76 NFPA Research, Quincy, MA
Table 6.1 Home Fires Involving Cords or Plugs, by Year Structure Fires Reported to U.S. Fire Departments (Continued)
* All 1991 home fire property damage figures are inflated by estimation problems related to the handling of the Oakland fire
storm.
Note: Figures exclude confined fires. Fires, deaths, and injuries are rounded to the nearest ten and property damage is rounded
to the nearest million dollars. Figures reflect a proportional share of home fires with equipment involved in ignition unknown or
reported as electrical distribution or lighting equipment of undetermined type. Because of low participation in NFIRS Version
5.0 during 1999-2001, estimates for those years are highly uncertain and must be used with caution. Inflation adjustment to 2014
dollars is calculated using the Consumer Price Index.
Source: Data from NFIRS and NFPA Survey.

Electrical Fires, 3/17 77 NFPA Research, Quincy, MA
Table 6.2. Home Fires Involving Cords or Plugs, by Month 2010-2014 Annual Averages
Month Fires Civilian Deaths
Civilian Injuries
Direct Property Damage (in Millions)
January 310 (10%) 20 (14%) 30 (14%) $19 (14%)
February 280 (9%) 10 (8%) 20 (9%) $12 (9%)
March 250 (8%) 10 (13%) 20 (7%) $13 (9%)
April 240 (8%) 10 (11%) 20 (10%) $12 (9%)
May 240 (8%) 10 (8%) 20 (8%) $11 (8%)
June 240 (8%) 10 (5%) 10 (5%) $10 (7%)
July 270 (9%) 10 (6%) 10 (5%) $14 (10%)
August 230 (7%) 0 (3%) 20 (8%) $9 (6%)
September 210 (7%) 10 (9%) 10 (4%) $9 (7%)
October 210 (7%) 10 (6%) 20 (7%) $8 (5%)
November 260 (9%) 10 (12%) 20 (9%) $10 (7%)
December 340 (11%) 10 (5%) 40 (15%) $13 (9%)
Total 3,070 (100%) 110 (100%) 230 (100%) $141 (100%)
Note: Figures exclude confined fires. Fires, deaths, and injuries are rounded to the nearest ten and property damage is rounded to
the nearest million dollars. Figures reflect a proportional share of home fires with equipment involved in ignition unknown or
reported as electrical distribution or lighting equipment of undetermined type. Totals may not equal sums because of rounding error.
Source: Data from NFIRS Version 5.0 and NFPA Experience Survey.
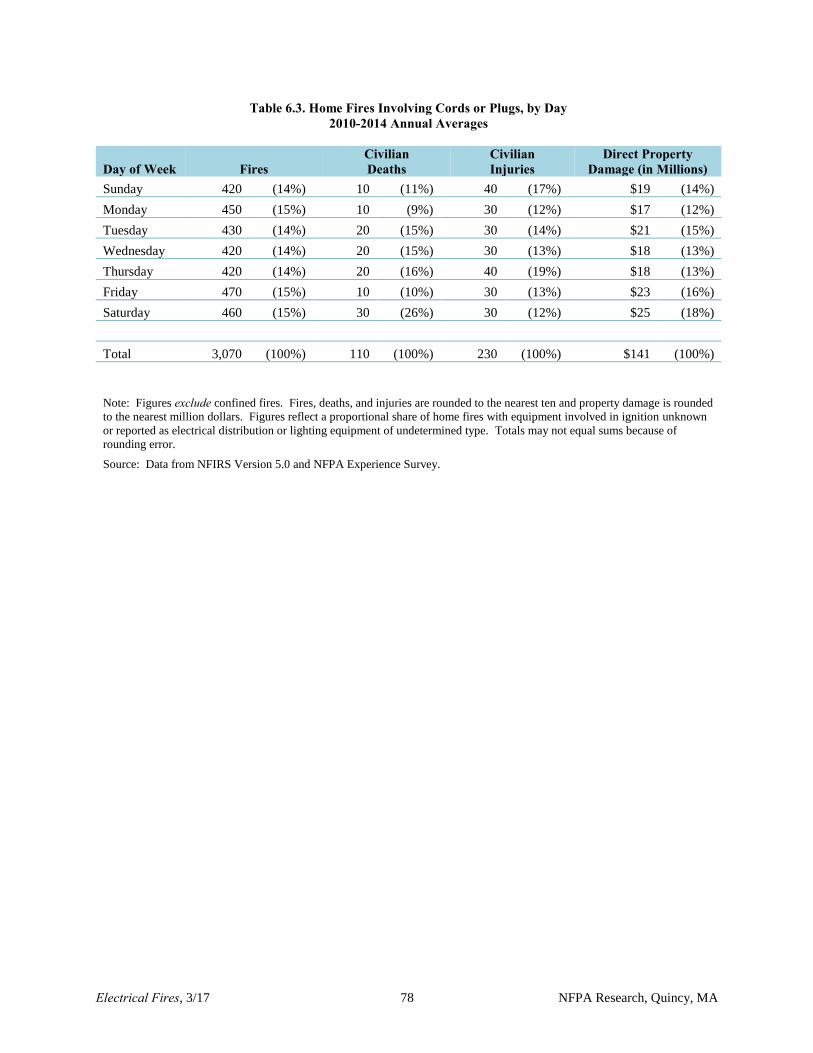
Electrical Fires, 3/17 78 NFPA Research, Quincy, MA
Table 6.3. Home Fires Involving Cords or Plugs, by Day 2010-2014 Annual Averages
Day of Week Fires Civilian Deaths
Civilian Injuries
Direct Property Damage (in Millions)
Sunday 420 (14%) 10 (11%) 40 (17%) $19 (14%)
Monday 450 (15%) 10 (9%) 30 (12%) $17 (12%)
Tuesday 430 (14%) 20 (15%) 30 (14%) $21 (15%)
Wednesday 420 (14%) 20 (15%) 30 (13%) $18 (13%)
Thursday 420 (14%) 20 (16%) 40 (19%) $18 (13%)
Friday 470 (15%) 10 (10%) 30 (13%) $23 (16%)
Saturday 460 (15%) 30 (26%) 30 (12%) $25 (18%)
Total 3,070 (100%) 110 (100%) 230 (100%) $141 (100%)
Note: Figures exclude confined fires. Fires, deaths, and injuries are rounded to the nearest ten and property damage is rounded
to the nearest million dollars. Figures reflect a proportional share of home fires with equipment involved in ignition unknown
or reported as electrical distribution or lighting equipment of undetermined type. Totals may not equal sums because of
rounding error.
Source: Data from NFIRS Version 5.0 and NFPA Experience Survey.

Electrical Fires, 3/17 79 NFPA Research, Quincy, MA
Table 6.4. Home Fires Involving Cords or Plugs, by Alarm Time 2010-2014 Annual Averages
Alarm Time Fires Civilian Deaths
Civilian Injuries
Direct Property Damage (in Millions)
Midnight-12:59 a.m. 100 (3%) 10 (5%) 10 (2%) $3 (2%)
1:00-1:59 a.m. 80 (3%) 20 (20%) 10 (5%) $4 (3%)
2:00-2:59 a.m. 100 (3%) 0 (3%) 10 (5%) $5 (4%)
3:00-3:59 a.m. 80 (3%) 0 (2%) 10 (3%) $5 (3%)
4:00-4:59 a.m. 90 (3%) 10 (13%) 20 (10%) $4 (3%)
5:00-5:59 a.m. 70 (2%) 0 (0%) 10 (2%) $5 (3%)
6:00-6:59 a.m. 100 (3%) 0 (2%) 10 (6%) $5 (3%)
7:00-7:59 a.m. 90 (3%) 10 (12%) 10 (6%) $6 (4%)
8:00-8:59 a.m. 120 (4%) 0 (2%) 10 (4%) $5 (3%)
9:00-9:59 a.m. 120 (4%) 0 (3%) 10 (4%) $6 (4%)
10:00-10:59 a.m. 130 (4%) 0 (2%) 10 (4%) $7 (5%)
11:00-11:59 a.m. 180 (6%) 0 (3%) 10 (4%) $7 (5%)
12:00-12:59 p.m. 160 (5%) 10 (5%) 10 (6%) $8 (6%)
1:00-1:59 p.m. 160 (5%) 0 (0%) 10 (4%) $8 (6%)
2:00-2:59 p.m. 150 (5%) 0 (0%) 0 (1%) $7 (5%)
3:00-3:59 p.m. 170 (6%) 0 (0%) 0 (2%) $8 (5%)
4:00-4:59 p.m. 180 (6%) 0 (3%) 10 (6%) $7 (5%)
5:00-5:59 p.m. 180 (6%) 0 (0%) 10 (3%) $9 (6%)
6:00-6:59 p.m. 140 (5%) 0 (3%) 10 (4%) $6 (4%)
7:00-7:59 p.m. 160 (5%) 0 (3%) 10 (4%) $6 (4%)
8:00-8:59 p.m. 140 (4%) 0 (0%) 10 (3%) $5 (3%)
9:00-9:59 p.m. 110 (4%) 0 (2%) 10 (5%) $3 (2%)
10:00-10:59 p.m. 140 (4%) 10 (5%) 0 (1%) $5 (4%)
11:00-11:59 p.m. 110 (4%) 10 (12%) 10 (4%) $8 (6%)
Total 3,070 (100%) 110 (100%) 230 (100%) $141 (100%)
Note: Figures exclude confined fires. Fires, deaths, and injuries are rounded to the nearest ten and property damage is rounded to the
nearest million dollars. Figures reflect a proportional share of home fires with equipment involved in ignition unknown or reported as
electrical distribution or lighting equipment of undetermined type. Totals may not equal sums because of rounding error.
Source: Data from NFIRS Version 5.0 and NFPA Experience Survey.

Electrical Fires, 3/17 80 NFPA Research, Quincy, MA
Table 6.5. Home Fires Involving Cords or Plugs, by Factor Contributing to Ignition 2010-2014 Annual Averages
Factor Contributing to Ignition Fires
Civilian Deaths
Civilian Injuries
Direct Property Damage (in Millions)
Unclassified electrical failure
or malfunction 940 (31%) 20 (14%) 80 (35%) $47 (34%)
Unspecified short circuit arc 680 (22%) 50 (49%) 40 (18%) $30 (21%)
Equipment overloaded 400 (13%) 20 (21%) 50 (20%) $18 (12%)
Short circuit arc from defective
or worn insulation 370 (12%) 10 (11%) 20 (10%) $15 (10%)
Unclassified misuse of material
or product 180 (6%) 0 (4%) 20 (9%) $8 (6%)
Arc from faulty contact or
broken conductor 110 (4%) 0 (4%) 10 (4%) $4 (3%)
Short circuit arc from
mechanical damage 100 (3%) 0 (4%) 10 (3%) $6 (5%)
Heat source too close to
combustibles. 100 (3%) 10 (7%) 10 (3%) $6 (4%)
Arc or spark from operating
equipment 70 (2%) 0 (0%) 0 (1%) $3 (2%)
Unclassified mechanical failure
or malfunction 70 (2%) 0 (2%) 0 (2%) $3 (2%)
Equipment used for not
intended purpose 60 (2%) 0 (2%) 10 (4%) $2 (1%)
Worn out 30 (1%) 0 (2%) 0 (1%) $2 (1%)
Water caused short-circuit arc 30 (1%) 0 (0%) 0 (0%) $3 (2%)
Equipment not being operated
properly 30 (1%) 0 (0%) 10 (3%) $1 (1%)
Unclassified factor contributing
to ignition 30 (1%) 0 (0%) 0 (0%) $2 (2%)
Installation deficiency 20 (1%) 0 (0%) 0 (0%) $0 (0%)
Equipment unattended 20 (1%) 0 (0%) 0 (1%) $1 (0%)
Other known factor
contributing to ignition 80 (2%) 0 (2%) 0 (2%) $4 (3%)
Total fires 3,070 (100%) 110 (100%) 230 (100%) $141 (100%)
Total factors 3,320 (108%) 140 (123%) 260 (115%) $154 (110%)
Note: Figures exclude confined fires. Multiple entries are allowed, which can result in sums higher than totals. Fires, deaths, and injuries
are rounded to the nearest ten and property damage is rounded to the nearest million dollars. Figures reflect a proportional share of home
fires with equipment involved in ignition unknown or reported as electrical distribution or lighting equipment of undetermined type.
Totals may not equal sums because of rounding error.
Source: Data from NFIRS Version 5.0 and NFPA Experience Survey.
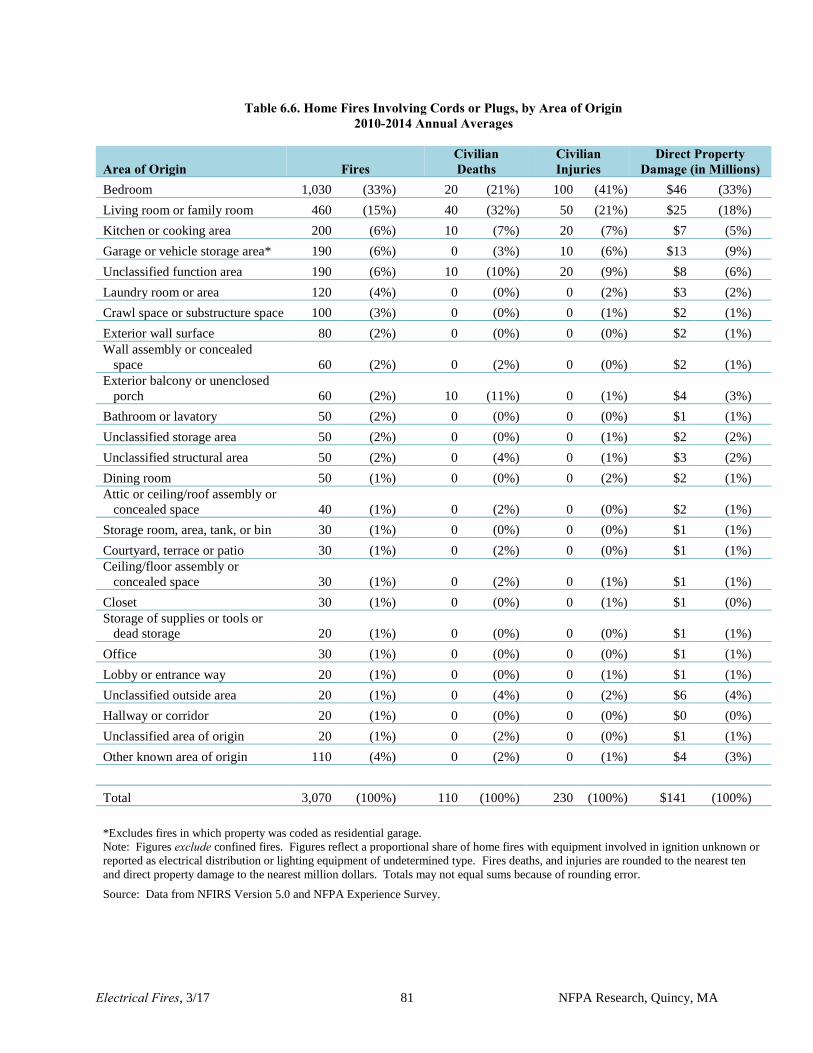
Electrical Fires, 3/17 81 NFPA Research, Quincy, MA
Table 6.6. Home Fires Involving Cords or Plugs, by Area of Origin 2010-2014 Annual Averages
Area of Origin Fires Civilian Deaths
Civilian Injuries
Direct Property Damage (in Millions)
Bedroom 1,030 (33%) 20 (21%) 100 (41%) $46 (33%)
Living room or family room 460 (15%) 40 (32%) 50 (21%) $25 (18%)
Kitchen or cooking area 200 (6%) 10 (7%) 20 (7%) $7 (5%)
Garage or vehicle storage area* 190 (6%) 0 (3%) 10 (6%) $13 (9%)
Unclassified function area 190 (6%) 10 (10%) 20 (9%) $8 (6%)
Laundry room or area 120 (4%) 0 (0%) 0 (2%) $3 (2%)
Crawl space or substructure space 100 (3%) 0 (0%) 0 (1%) $2 (1%)
Exterior wall surface 80 (2%) 0 (0%) 0 (0%) $2 (1%)
Wall assembly or concealed
space 60 (2%) 0 (2%) 0 (0%) $2 (1%)
Exterior balcony or unenclosed
porch 60 (2%) 10 (11%) 0 (1%) $4 (3%)
Bathroom or lavatory 50 (2%) 0 (0%) 0 (0%) $1 (1%)
Unclassified storage area 50 (2%) 0 (0%) 0 (1%) $2 (2%)
Unclassified structural area 50 (2%) 0 (4%) 0 (1%) $3 (2%)
Dining room 50 (1%) 0 (0%) 0 (2%) $2 (1%)
Attic or ceiling/roof assembly or
concealed space 40 (1%) 0 (2%) 0 (0%) $2 (1%)
Storage room, area, tank, or bin 30 (1%) 0 (0%) 0 (0%) $1 (1%)
Courtyard, terrace or patio 30 (1%) 0 (2%) 0 (0%) $1 (1%)
Ceiling/floor assembly or
concealed space 30 (1%) 0 (2%) 0 (1%) $1 (1%)
Closet 30 (1%) 0 (0%) 0 (1%) $1 (0%)
Storage of supplies or tools or
dead storage 20 (1%) 0 (0%) 0 (0%) $1 (1%)
Office 30 (1%) 0 (0%) 0 (0%) $1 (1%)
Lobby or entrance way 20 (1%) 0 (0%) 0 (1%) $1 (1%)
Unclassified outside area 20 (1%) 0 (4%) 0 (2%) $6 (4%)
Hallway or corridor 20 (1%) 0 (0%) 0 (0%) $0 (0%)
Unclassified area of origin 20 (1%) 0 (2%) 0 (0%) $1 (1%)
Other known area of origin 110 (4%) 0 (2%) 0 (1%) $4 (3%)
Total 3,070 (100%) 110 (100%) 230 (100%) $141 (100%)
*Excludes fires in which property was coded as residential garage.
Note: Figures exclude confined fires. Figures reflect a proportional share of home fires with equipment involved in ignition unknown or
reported as electrical distribution or lighting equipment of undetermined type. Fires deaths, and injuries are rounded to the nearest ten
and direct property damage to the nearest million dollars. Totals may not equal sums because of rounding error.
Source: Data from NFIRS Version 5.0 and NFPA Experience Survey.
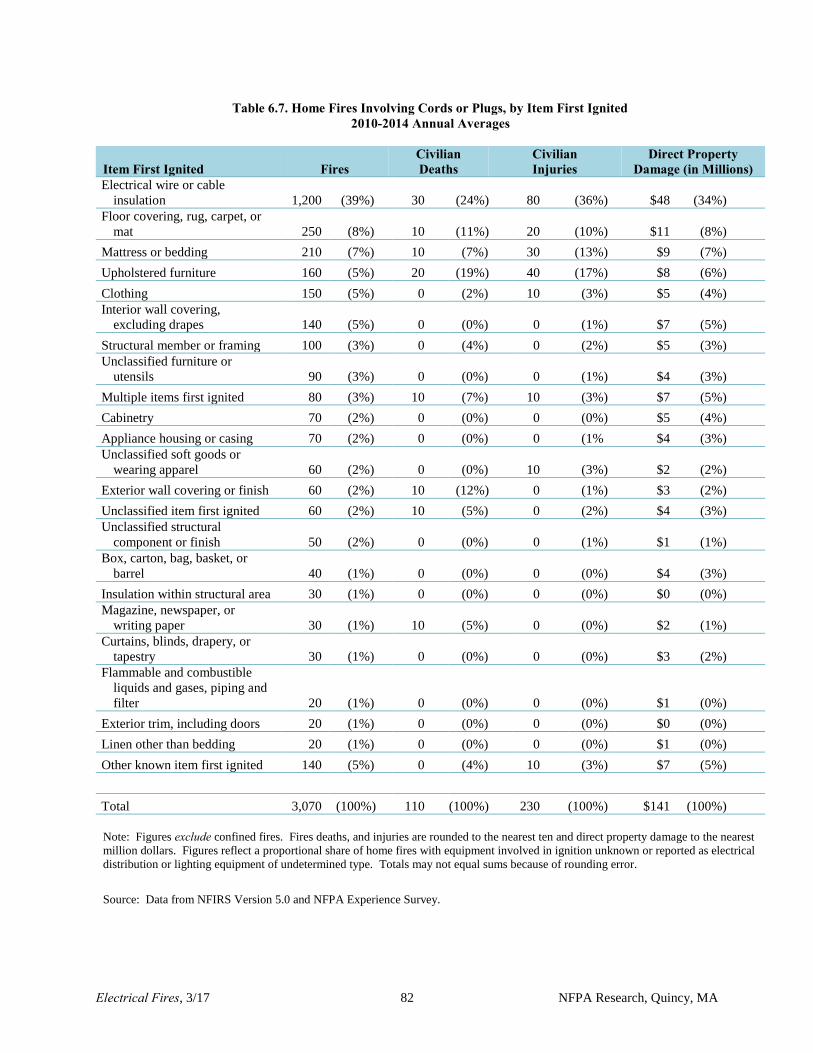
Electrical Fires, 3/17 82 NFPA Research, Quincy, MA
Table 6.7. Home Fires Involving Cords or Plugs, by Item First Ignited 2010-2014 Annual Averages
Item First Ignited Fires Civilian Deaths
Civilian Injuries
Direct Property Damage (in Millions)
Electrical wire or cable
insulation 1,200 (39%) 30 (24%) 80 (36%) $48 (34%)
Floor covering, rug, carpet, or
mat 250 (8%) 10 (11%) 20 (10%) $11 (8%)
Mattress or bedding 210 (7%) 10 (7%) 30 (13%) $9 (7%)
Upholstered furniture 160 (5%) 20 (19%) 40 (17%) $8 (6%)
Clothing 150 (5%) 0 (2%) 10 (3%) $5 (4%)
Interior wall covering,
excluding drapes 140 (5%) 0 (0%) 0 (1%) $7 (5%)
Structural member or framing 100 (3%) 0 (4%) 0 (2%) $5 (3%)
Unclassified furniture or
utensils 90 (3%) 0 (0%) 0 (1%) $4 (3%)
Multiple items first ignited 80 (3%) 10 (7%) 10 (3%) $7 (5%)
Cabinetry 70 (2%) 0 (0%) 0 (0%) $5 (4%)
Appliance housing or casing 70 (2%) 0 (0%) 0 (1% $4 (3%)
Unclassified soft goods or
wearing apparel 60 (2%) 0 (0%) 10 (3%) $2 (2%)
Exterior wall covering or finish 60 (2%) 10 (12%) 0 (1%) $3 (2%)
Unclassified item first ignited 60 (2%) 10 (5%) 0 (2%) $4 (3%)
Unclassified structural
component or finish 50 (2%) 0 (0%) 0 (1%) $1 (1%)
Box, carton, bag, basket, or
barrel 40 (1%) 0 (0%) 0 (0%) $4 (3%)
Insulation within structural area 30 (1%) 0 (0%) 0 (0%) $0 (0%)
Magazine, newspaper, or
writing paper 30 (1%) 10 (5%) 0 (0%) $2 (1%)
Curtains, blinds, drapery, or
tapestry 30 (1%) 0 (0%) 0 (0%) $3 (2%)
Flammable and combustible
liquids and gases, piping and
filter 20 (1%) 0 (0%) 0 (0%) $1 (0%)
Exterior trim, including doors 20 (1%) 0 (0%) 0 (0%) $0 (0%)
Linen other than bedding 20 (1%) 0 (0%) 0 (0%) $1 (0%)
Other known item first ignited 140 (5%) 0 (4%) 10 (3%) $7 (5%)
Total 3,070 (100%) 110 (100%) 230 (100%) $141 (100%)
Note: Figures exclude confined fires. Fires deaths, and injuries are rounded to the nearest ten and direct property damage to the nearest
million dollars. Figures reflect a proportional share of home fires with equipment involved in ignition unknown or reported as electrical
distribution or lighting equipment of undetermined type. Totals may not equal sums because of rounding error.
Source: Data from NFIRS Version 5.0 and NFPA Experience Survey.

Electrical Fires, 3/17 83 NFPA Research, Quincy, MA
Table 6.8. Home Fires Involving Extension Cords, by Factor Contributing to Ignition 2010-2014 Annual Averages
Factor Contributing to Ignition Fires
Civilian Deaths
Civilian Injuries
Direct Property Damage (in Millions)
Unclassified electrical failure
or malfunction 510 (29%) 10 (16%) 50 (32%) $27 (34%)
Unspecified short-circuit arc 380 (22%) 40 (46%) 30 (18%) $16 (20%)
Equipment overloaded 290 (17%) 20 (26%) 30 (20%) $12 (15%)
Short circuit arc from defective
or worn insulation 220 (13%) 10 (9%) 20 (13%) $9 (11%)
Unclassified misuse of material
or product 120 (7%) 0 (3%) 20 (11%) $5 (7%)
Arc from faulty contact or
broken conductor 60 (3%) 0 (6%) 10 (5%) $2 (3%)
Heat source too close to
combustibles 50 (3%) 10 (9%) 10 (4%) $4 (5%)
Short circuit arc from
mechanical damage 50 (3%) 0 (3%) 0 (2%) $3 (3%)
Equipment not used for
intended purpose 50 (3%) 0 (3%) 10 (5%) $1 (2%)
Arc or spark from operating
equipment 30 (2%) 0 (0%) 0 (1%) $2 (2%)
Unclassified mechanical failure
or malfunction 20 (1%) 0 (3%) 0 (0%) $1 (2%)
Equipment not being operated
properly 20 (1%) 0 (0%) 10 (4%) $1 (1%)
Water caused short-circuit arc 20 (1%) 0 (0%) 0 (0%) $1 (1%)
Worn out 20 (1%) 0 (3%) 0 (1%) $1 (2%)
Unclassified operational
deficiency 10 (1%) 0 (3%) 0 (1%) $1 (1%)
Equipment unattended 10 (1%) 0 (0%) 0 (0%) $0 (0%)
Installation deficiency 10 (1%) 0 (0%) 0 (0%) $0 (0%)
Unclassified factor contributing
to ignition 10 (1%) 0 (0%) 0 (0%) $1 (1%)
Other known factor
contributing to ignition 30 (1%) 0 (0%) 0 (1%) $1 (1%)
Total fires 1,750 (100%) 80 (100%) 160 (100%) $79 (100%)
Total factors 1,920 (109%) 100 (129%) 190 (118%) $87 (111%)
Note: Figures exclude confined fires. Multiple entries are allowed, which can result in sums higher than totals. Fires, deaths, and
injuries are rounded to the nearest ten and property damage is rounded to the nearest million dollars. Figures reflect a proportional share
of home fires with equipment involved in ignition unknown or reported as electrical distribution or lighting equipment of undetermined
type. Totals may not equal sums because of rounding error.
Source: Data from NFIRS Version 5.0 and NFPA Experience Survey.

Electrical Fires, 3/17 84 NFPA Research, Quincy, MA
Table 6.9. Home Fires Involving Extension Cords, by Area of Origin 2010-2014 Annual Averages
Area of Origin Fires Civilian Deaths
Civilian Injuries
Direct Property Damage (in Millions)
Bedroom 620 (35%) 20 (24%) 70 (43%) $26 (34%)
Living room, family room, or
den 240 (14%) 20 (28%) 30 (21%) $12 (15%)
Garage or vehicle storage area8 120 (7%) 0 (2%) 10 (5%) $8 (10%)
Unclassified function area 120 (7%) 10 (14%) 20 (11%) $5 (6%)
Kitchen or cooking area 90 (5%) 0 (4%) 10 (4%) $3 (3%)
Crawl space or substructure
space 60 (4%) 0 (0%) 0 (1%) $1 (2%)
Exterior wall surface 50 (3%) 0 (0%) 0 (1%) $2 (2%)
Laundry room or area 50 (3%) 0 (0%) 0 (2%) $1 (1%)
Exterior balcony or unenclosed
porch 40 (2%) 10 (15%) 0 (1%) $3 (4%)
Dining room 30 (2%) 0 (0%) 0 (3%) $1 (1%)
Unclassified structural area 30 (2%) 0 (0%) 0 (1%) $2 (2%)
Unclassified storage area 20 (1%) 0 (0%) 0 (0%) $1 (1%)
Storage room, area, tank, or bin 20 (1%) 0 (0%) 0 (0%) $1 (1%)
Attic or ceiling/roof assembly or
concealed space 20 (1%) 0 (2%) 0 (1%) $1 (2%)
Ceiling/floor assembly or
concealed space 20 (1%) 0 (2%) 0 (1%) $1 (1%)
Lobby or entrance way 20 (1%) 0 (0%) 0 (1%) $1 (1%)
Courtyard, terrace or patio 20 (1%) 0 (2%) 0 (0%) $1 (1%)
Bathroom or lavatory 20 (1%) 0 (0%) 0 (0%) $0 (0%)
Storage of supplies or tools or
dead storage 20 (1%) 0 (0%) 0 (1%) $1 (1%)
Wall assembly or concealed
space 20 (1%) 0 (0%) 0 (1%) $1 (1%)
Closet 20 (1%) 0 (0%) 0 (1%) $0 (0%)
Hallway or corridor 10 (1%) 0 (0%) 0 (0%) $0 (0%)
Office 10 (1%) 0 (0%) 0 (0%) $1 (1%)
Interior stairway or ramp 10 (1%) 0 (0%) 0 (0%) $0 (0%)
Unclassified outside area 10 (1%) 0 (5%) 0 (2%) $5 (6%)
Unclassified area of origin 10 (0%) 0 (0%) 0 (0%) $0 (0%)
Other known area of origin 50 (3%) 0 (0%) 0 (1%) $2 (3%)
Total 1,750 (100%) 80 (100%) 160 (100%) $79 (100%)
*Excludes fires in which property was coded as residential garage.
Note: Figures exclude confined fires. Figures reflect a proportional share of home fires with equipment involved in ignition unknown or
reported as electrical distribution or lighting equipment of undetermined type. Fires deaths, and injuries are rounded to the nearest ten
and direct property damage to the nearest million dollars. Totals may not equal sums because of rounding error.
Source: Data from NFIRS Version 5.0 and NFPA Experience Survey.

Electrical Fires, 3/17 85 NFPA Research, Quincy, MA
Table 6.10. Home Fires Involving Extension Cords, by Item First Ignited 2010-2014 Annual Averages
Item First Ignited Fires Civilian Deaths
Civilian Injuries
Direct Property Damage (in Millions)
Electrical wire or cable
insulation 690 (39%) 10 (18%) 60 (35%) $28 (36%)
Floor covering rug, carpet, or
mat 160 (9%) 10 (12%) 20 (10%) $7 (8%)
Mattress or bedding 120 (7%) 10 (10%) 20 (13%) $6 (7%)
Upholstered furniture 110 (6%) 20 (27%) 30 (17%) $5 (6%)
Clothing 90 (5%) 0 (3%) 10 (3%) $3 (4%)
Interior wall covering,
excluding drapes 70 (4%) 0 (0%) 0 (1%) $3 (3%)
Structural member or framing 60 (4%) 0 (0%) 0 (3%) $3 (4%)
Multiple items first ignited 50 (3%) 10 (7%) 10 (3%) $4 (5%)
Unclassified furniture or
utensils 40 (2%) 0 (0%) 0 (1%) $1 (2%)
Cabinetry 40 (2%) 0 (0%) 0 (0%) $2 (3%)
Exterior wall covering or finish 40 (2%) 10 (17%) 0 (1%) $2 (3%)
Unclassified soft goods or
wearing apparel 30 (2%) 0 (0%) 10 (3%) $2 (2%)
Box, carton, bag, basket, or
barrel 30 (2%) 0 (0%) 0 (0%) $2 (3%)
Unclassified structural
component or finish 20 (1%) 0 (0%) 0 (2%) $1 (1%)
Unclassified item first ignited 20 (1%) 0 (0%) 0 (1%) $1 (1%)
Magazine, newspaper, or
writing paper 20 (1%) 10 (6%) 0 (0%) $1 (2%)
Curtains, blinds, drapery, or
tapestry 20 (1%) 0 (0%) 0 (1%) $2 (2%)
Appliance housing or casing 20 (1%) 0 (0%) 0 (1%) $1 (1%)
Exterior trim, including doors 10 (1%) 0 (0%) 0 (1%) $0 (0%)
Insulation within structural area 10 (1%) 0 (0%) 0 (0%) $0 (0%)
Rubbish, trash, or waste 10 (1%) 0 (0%) 0 (1%) $0 (0%)
Light vegetation, including
grass 10 (1%) 0 (0%) 0 (0%) $0 (0%)
Linen other than bedding 10 (1%) 0 (0%) 0 (0%) $0 (0%)
Other known item first ignited 60 (4%) 0 (0%) 10 (3%) $4 (5%)
Total fires 1,750 (100%) 80 (100%) 160 (100%) $79 (100%)
Note: Figures exclude confined fires. Figures reflect a proportional share of home fires with equipment involved in ignition unknown
or reported as electrical distribution or lighting equipment of undetermined type. Fires deaths, and injuries are rounded to the nearest
ten and direct property damage to the nearest million dollars. Totals may not equal sums because of rounding error.
Source: Data from NFIRS Version 5.0 and NFPA Experience Survey.
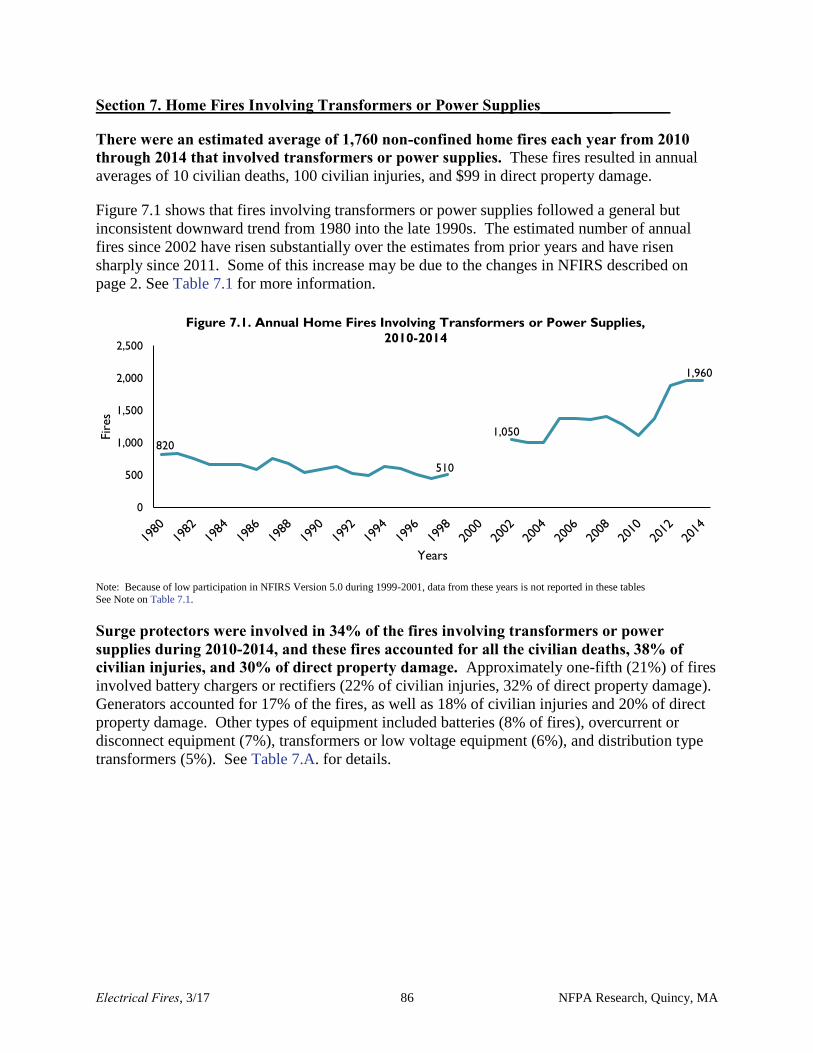
Electrical Fires, 3/17 86 NFPA Research, Quincy, MA
Section 7. Home Fires Involving Transformers or Power Supplies_________
There were an estimated average of 1,760 non-confined home fires each year from 2010 through 2014 that involved transformers or power supplies. These fires resulted in annual
averages of 10 civilian deaths, 100 civilian injuries, and $99 in direct property damage.
Figure 7.1 shows that fires involving transformers or power supplies followed a general but
inconsistent downward trend from 1980 into the late 1990s. The estimated number of annual
fires since 2002 have risen substantially over the estimates from prior years and have risen
sharply since 2011. Some of this increase may be due to the changes in NFIRS described on
page 2. See Table 7.1 for more information.
Note: Because of low participation in NFIRS Version 5.0 during 1999-2001, data from these years is not reported in these tables
See Note on Table 7.1.
Surge protectors were involved in 34% of the fires involving transformers or power supplies during 2010-2014, and these fires accounted for all the civilian deaths, 38% of civilian injuries, and 30% of direct property damage. Approximately one-fifth (21%) of fires
involved battery chargers or rectifiers (22% of civilian injuries, 32% of direct property damage).
Generators accounted for 17% of the fires, as well as 18% of civilian injuries and 20% of direct
property damage. Other types of equipment included batteries (8% of fires), overcurrent or
disconnect equipment (7%), transformers or low voltage equipment (6%), and distribution type
transformers (5%). See Table 7.A. for details.
820
510
1,050
1,960
0
500
1,000
1,500
2,000
2,500
Fir
es
Years
Figure 7.1. Annual Home Fires Involving Transformers or Power Supplies,
2010-2014
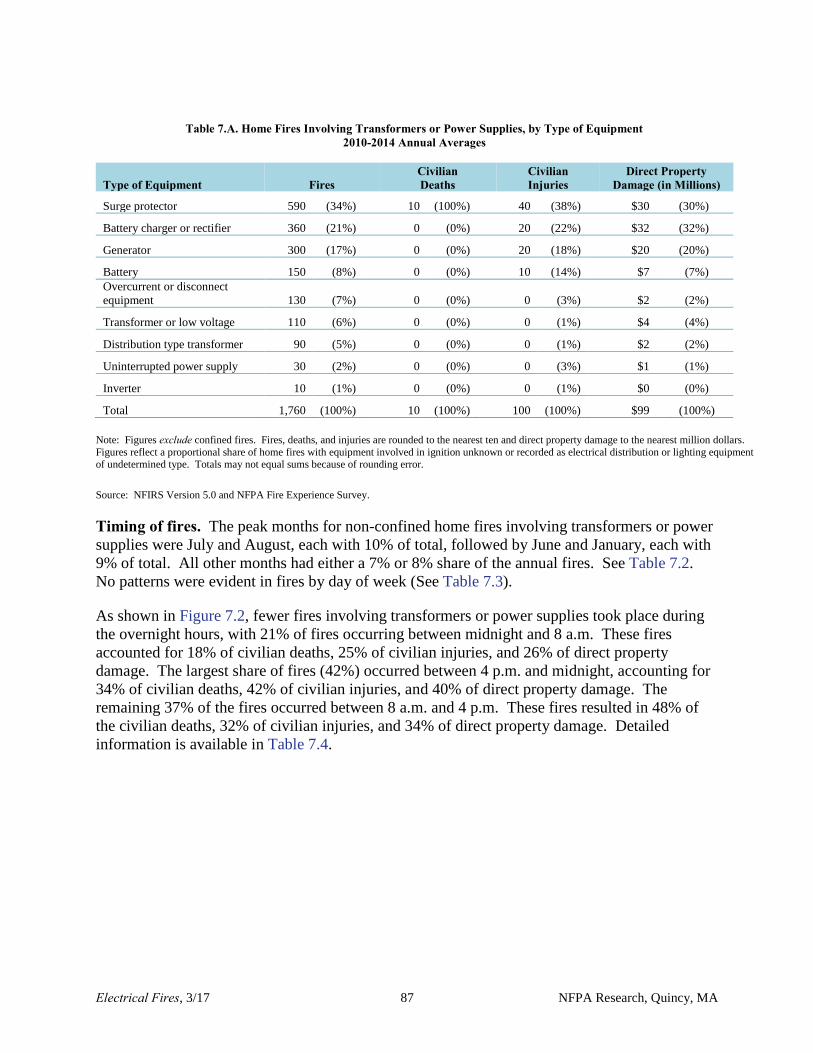
Electrical Fires, 3/17 87 NFPA Research, Quincy, MA
Table 7.A. Home Fires Involving Transformers or Power Supplies, by Type of Equipment 2010-2014 Annual Averages
Type of Equipment Fires Civilian Deaths
Civilian Injuries
Direct Property Damage (in Millions)
Surge protector 590 (34%) 10 (100%) 40 (38%) $30 (30%)
Battery charger or rectifier 360 (21%) 0 (0%) 20 (22%) $32 (32%)
Generator 300 (17%) 0 (0%) 20 (18%) $20 (20%)
Battery 150 (8%) 0 (0%) 10 (14%) $7 (7%)
Overcurrent or disconnect
equipment 130 (7%) 0 (0%) 0 (3%) $2 (2%)
Transformer or low voltage 110 (6%) 0 (0%) 0 (1%) $4 (4%)
Distribution type transformer 90 (5%) 0 (0%) 0 (1%) $2 (2%)
Uninterrupted power supply 30 (2%) 0 (0%) 0 (3%) $1 (1%)
Inverter 10 (1%) 0 (0%) 0 (1%) $0 (0%)
Total 1,760 (100%) 10 (100%) 100 (100%) $99 (100%)
Note: Figures exclude confined fires. Fires, deaths, and injuries are rounded to the nearest ten and direct property damage to the nearest million dollars.
Figures reflect a proportional share of home fires with equipment involved in ignition unknown or recorded as electrical distribution or lighting equipment of undetermined type. Totals may not equal sums because of rounding error.
Source: NFIRS Version 5.0 and NFPA Fire Experience Survey.
Timing of fires. The peak months for non-confined home fires involving transformers or power
supplies were July and August, each with 10% of total, followed by June and January, each with
9% of total. All other months had either a 7% or 8% share of the annual fires. See Table 7.2.
No patterns were evident in fires by day of week (See Table 7.3).
As shown in Figure 7.2, fewer fires involving transformers or power supplies took place during
the overnight hours, with 21% of fires occurring between midnight and 8 a.m. These fires
accounted for 18% of civilian deaths, 25% of civilian injuries, and 26% of direct property
damage. The largest share of fires (42%) occurred between 4 p.m. and midnight, accounting for
34% of civilian deaths, 42% of civilian injuries, and 40% of direct property damage. The
remaining 37% of the fires occurred between 8 a.m. and 4 p.m. These fires resulted in 48% of
the civilian deaths, 32% of civilian injuries, and 34% of direct property damage. Detailed
information is available in Table 7.4.

Electrical Fires, 3/17 88 NFPA Research, Quincy, MA
Note: See Note on Table 7.4. Source: NFIRS Version 5.0 and NFPA Fire Experience Survey.
Factor Contributing to Ignition. Unclassified electrical failures or malfunctions were the
leading factor contributing to the ignition of home fires involving transformers or power supplies
(35% of the total), followed by unspecified short circuit arcs (19%), heat sources too close to
combustible material (8%), unclassified mechanical failures or malfunctions (6%), and
equipment overloaded (6%). More detailed information is available in Table 7.5.
Area of Origin. Approximately one-fifth of fires (22%) involving transformers or power supplies
originated in the bedroom, and these fires accounted for 50% of civilian deaths, 32% of civilian
injuries, and 19% of direct property damage. Another 16% of the fires originated in a garage or
vehicle storage area, and 11% originated in a living room, family room, or den. The fires
originating in a garage or vehicle storage area accounted for the highest share of direct property
damage, with 36% of the total. Other leading areas of origin included unclassified function areas
(5%), exterior wall surfaces (5%), and kitchen or cooking areas (4%). See Table 7.6.
Item First Ignited. The item first ignited in just over one-third of home fires involving
transformers or power supplies was electrical wire or cable insulation (36%), followed by exterior
wall covering or finish (7%), floor covering, rug, carpet, or mat (5%), flammable and combustible
liquids and gases, piping and filter (5%), and structural member or framing (4%). A diffuse array
of items accounted for the remaining share of the item first ignited total. See Table 7.7.
21%
37%42%
18%
48%
34%
25%
32%
42%
26%
34%40%
0%
10%
20%
30%
40%
50%
60%
Midnight - 8 a.m. 8 a.m. - 4:00 p.m. 4:00 p.m. - Midnight
Figure 7.2. Home Fires Involving Transformers or Power Supplies,
by Alarm Hour 2010-2014 Annual Averages
Fires Civilian Deaths Civilian Injuries Direct Property Damage
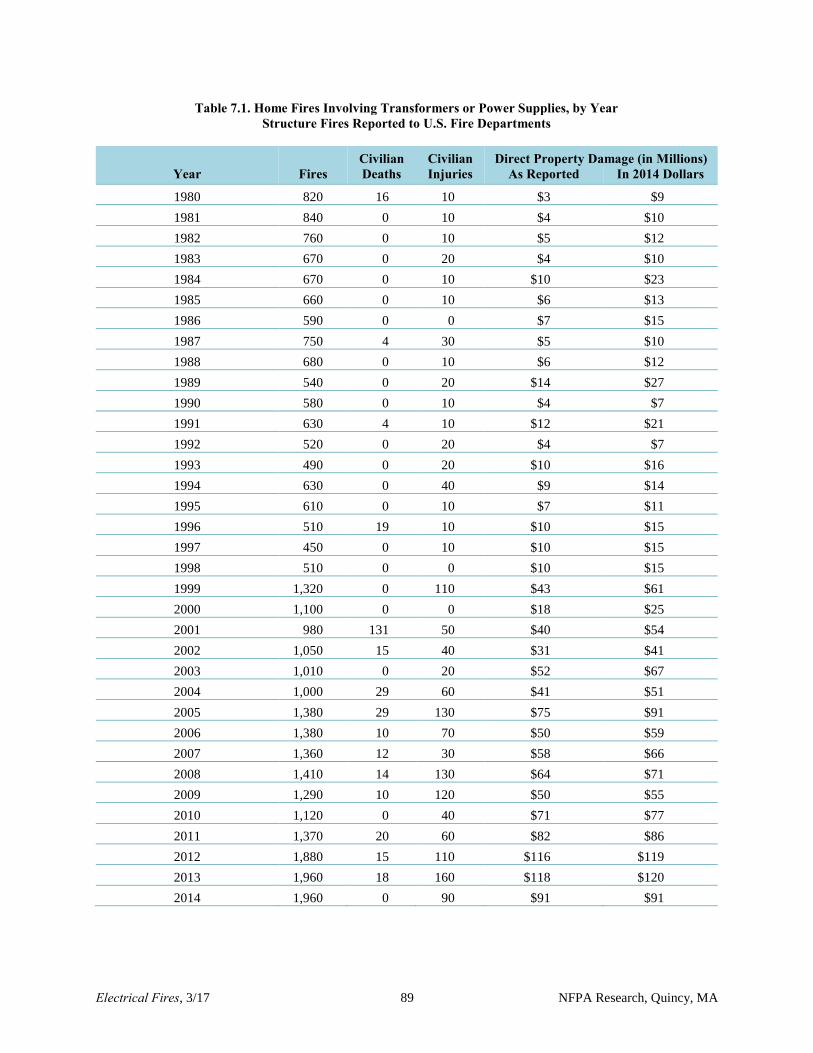
Electrical Fires, 3/17 89 NFPA Research, Quincy, MA
Table 7.1. Home Fires Involving Transformers or Power Supplies, by Year Structure Fires Reported to U.S. Fire Departments
Civilian Civilian Direct Property Damage (in Millions)
Year Fires Deaths Injuries As Reported In 2014 Dollars
1980 820 16 10 $3 $9
1981 840 0 10 $4 $10
1982 760 0 10 $5 $12
1983 670 0 20 $4 $10
1984 670 0 10 $10 $23
1985 660 0 10 $6 $13
1986 590 0 0 $7 $15
1987 750 4 30 $5 $10
1988 680 0 10 $6 $12
1989 540 0 20 $14 $27
1990 580 0 10 $4 $7
1991 630 4 10 $12 $21
1992 520 0 20 $4 $7
1993 490 0 20 $10 $16
1994 630 0 40 $9 $14
1995 610 0 10 $7 $11
1996 510 19 10 $10 $15
1997 450 0 10 $10 $15
1998 510 0 0 $10 $15
1999 1,320 0 110 $43 $61
2000 1,100 0 0 $18 $25
2001 980 131 50 $40 $54
2002 1,050 15 40 $31 $41
2003 1,010 0 20 $52 $67
2004 1,000 29 60 $41 $51
2005 1,380 29 130 $75 $91
2006 1,380 10 70 $50 $59
2007 1,360 12 30 $58 $66
2008 1,410 14 130 $64 $71
2009 1,290 10 120 $50 $55
2010 1,120 0 40 $71 $77
2011 1,370 20 60 $82 $86
2012 1,880 15 110 $116 $119
2013 1,960 18 160 $118 $120
2014 1,960 0 90 $91 $91

Electrical Fires, 3/17 90 NFPA Research, Quincy, MA
Table 7.1. Home Fires Involving Transformers or Power Supplies, by Year Structure Fires Reported to U.S. Fire Departments (Continued)
* All 1991 home fire property damage figures are inflated by estimation problems related to the handling of the Oakland fire
storm.
Note: Figures exclude confined fires. Fires, deaths, and injuries are rounded to the nearest ten and property damage is
rounded to the nearest million dollars. Figures reflect a proportional share of home fires with equipment involved in ignition
unknown or reported as electrical distribution or lighting equipment of undetermined type. Because of low participation in
NFIRS Version 5.0 during 1999-2001, estimates for those years are highly uncertain and must be used with caution. Inflation
adjustment to 2014 dollars is calculated using the Consumer Price Index.
Source: Data from NFIRS and NFPA Fire Experience survey.

Electrical Fires, 3/17 91 NFPA Research, Quincy, MA
Table 7.2. Home Fires Involving Transformers or Power Supplies, by Month 2010-2014 Annual Averages
Month Fires Civilian Deaths
Civilian Injuries
Direct Property Damage (in Millions)
January 160 (9%) 0 (0%) 10 (6%) $8 (8%)
February 140 (8%) 0 (0%) 0 (4%) $10 (10%)
March 140 (8%) 0 (34%) 10 (13%) $9 (9%)
April 130 (7%) 0 (0%) 10 (9%) $7 (7%)
May 140 (8%) 0 (18%) 10 (6%) $7 (7%)
June 160 (9%) 0 (0%) 10 (6%) $10 (10%)
July 180 (10%) 0 (0%) 10 (14%) $10 (10%)
August 170 (10%) 0 (0%) 10 (10%) $8 (8%)
September 130 (7%) 0 (0%) 10 (10%) $8 (8%)
October 140 (8%) 0 (0%) 10 (8%) $7 (7%)
November 120 (7%) 0 (0%) 10 (9%) $6 (6%)
December 150 (8%) 10 (48%) 10 (5%) $8 (9%)
Total 1,760 (100%) 10 (100%) 100 (100%) $99 (100%)
Note: Figures exclude confined fires. Figures reflect a proportional share of home fires with equipment involved in ignition
unknown or reported as electrical distribution or lighting equipment of undetermined type. Fires deaths, and injuries are
rounded to the nearest ten and direct property damage to the nearest million dollars. Totals may not equal sums because of
rounding error.
Source: Data from NFIRS Version 5.0 and NFPA Experience Survey.

Electrical Fires, 3/17 92 NFPA Research, Quincy, MA
Table 7.3. Home Fires Involving Transformers or Power Supplies, by Day 2010-2014 Annual Averages
Day of Week Fires Civilian Deaths
Civilian Injuries
Direct Property Damage (in Millions)
Sunday 260 (15%) 0 (0%) 20 (23%) $14 (15%)
Monday 250 (14%) 0 (16%) 10 (10%) $14 (14%)
Tuesday 240 (14%) 0 (37%) 20 (15%) $11 (11%)
Wednesday 250 (14%) 10 (48%) 10 (13%) $13 (13%)
Thursday 270 (15%) 0 (0%) 20 (21%) $18 (18%)
Friday 230 (13%) 0 (0%) 0 (5%) $16 (16%)
Saturday 260 (15%) 0 (0%) 10 (13%) $14 (14%)
Total 1,760 (100%) 10 (100%) 100 (100%) $99 (100%)
Note: Figures exclude confined fires. Figures reflect a proportional share of home fires with equipment involved in ignition
unknown or reported as electrical distribution or lighting equipment of undetermined type. Fires deaths, and injuries are rounded to
the nearest ten and direct property damage to the nearest million dollars. Totals may not equal sums because of rounding error.
Source: Data from NFIRS Version 5.0 and NFPA Experience Survey.
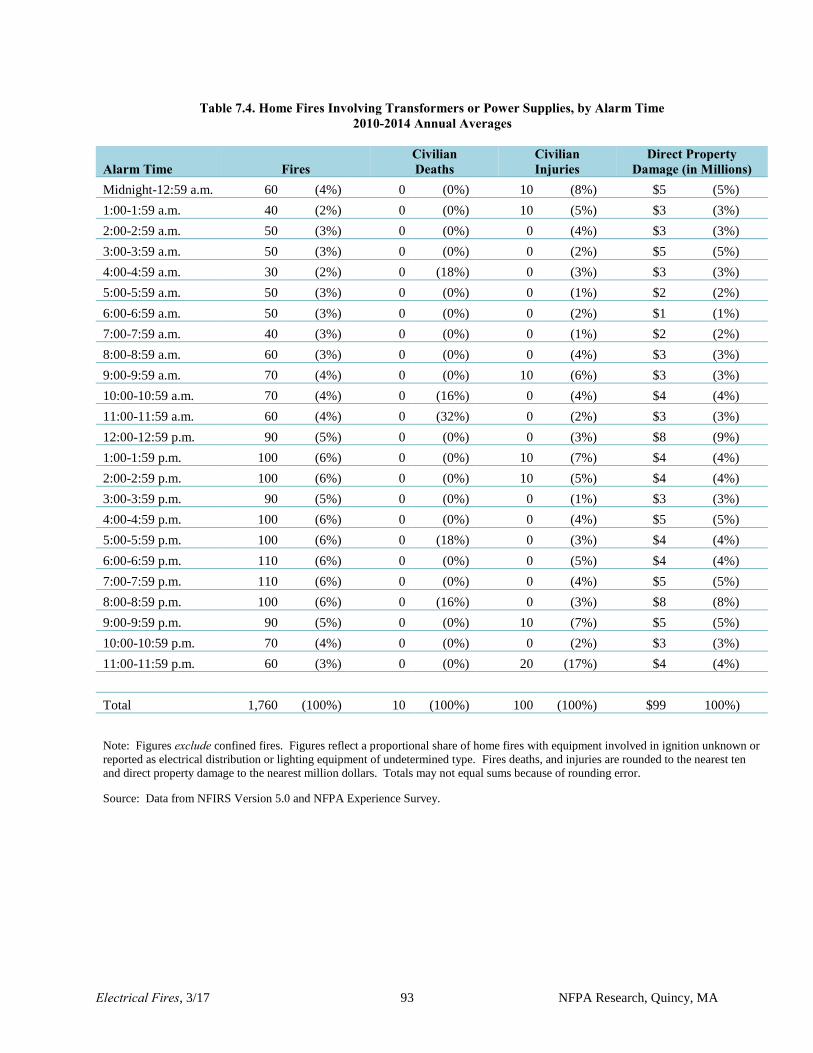
Electrical Fires, 3/17 93 NFPA Research, Quincy, MA
Table 7.4. Home Fires Involving Transformers or Power Supplies, by Alarm Time 2010-2014 Annual Averages
Alarm Time Fires Civilian Deaths
Civilian Injuries
Direct Property Damage (in Millions)
Midnight-12:59 a.m. 60 (4%) 0 (0%) 10 (8%) $5 (5%)
1:00-1:59 a.m. 40 (2%) 0 (0%) 10 (5%) $3 (3%)
2:00-2:59 a.m. 50 (3%) 0 (0%) 0 (4%) $3 (3%)
3:00-3:59 a.m. 50 (3%) 0 (0%) 0 (2%) $5 (5%)
4:00-4:59 a.m. 30 (2%) 0 (18%) 0 (3%) $3 (3%)
5:00-5:59 a.m. 50 (3%) 0 (0%) 0 (1%) $2 (2%)
6:00-6:59 a.m. 50 (3%) 0 (0%) 0 (2%) $1 (1%)
7:00-7:59 a.m. 40 (3%) 0 (0%) 0 (1%) $2 (2%)
8:00-8:59 a.m. 60 (3%) 0 (0%) 0 (4%) $3 (3%)
9:00-9:59 a.m. 70 (4%) 0 (0%) 10 (6%) $3 (3%)
10:00-10:59 a.m. 70 (4%) 0 (16%) 0 (4%) $4 (4%)
11:00-11:59 a.m. 60 (4%) 0 (32%) 0 (2%) $3 (3%)
12:00-12:59 p.m. 90 (5%) 0 (0%) 0 (3%) $8 (9%)
1:00-1:59 p.m. 100 (6%) 0 (0%) 10 (7%) $4 (4%)
2:00-2:59 p.m. 100 (6%) 0 (0%) 10 (5%) $4 (4%)
3:00-3:59 p.m. 90 (5%) 0 (0%) 0 (1%) $3 (3%)
4:00-4:59 p.m. 100 (6%) 0 (0%) 0 (4%) $5 (5%)
5:00-5:59 p.m. 100 (6%) 0 (18%) 0 (3%) $4 (4%)
6:00-6:59 p.m. 110 (6%) 0 (0%) 0 (5%) $4 (4%)
7:00-7:59 p.m. 110 (6%) 0 (0%) 0 (4%) $5 (5%)
8:00-8:59 p.m. 100 (6%) 0 (16%) 0 (3%) $8 (8%)
9:00-9:59 p.m. 90 (5%) 0 (0%) 10 (7%) $5 (5%)
10:00-10:59 p.m. 70 (4%) 0 (0%) 0 (2%) $3 (3%)
11:00-11:59 p.m. 60 (3%) 0 (0%) 20 (17%) $4 (4%)
Total 1,760 (100%) 10 (100%) 100 (100%) $99 (100%)
Note: Figures exclude confined fires. Figures reflect a proportional share of home fires with equipment involved in ignition unknown or
reported as electrical distribution or lighting equipment of undetermined type. Fires deaths, and injuries are rounded to the nearest ten
and direct property damage to the nearest million dollars. Totals may not equal sums because of rounding error.
Source: Data from NFIRS Version 5.0 and NFPA Experience Survey.

Electrical Fires, 3/17 94 NFPA Research, Quincy, MA
Table 7.5. Home Fires Involving Transformers or Power Supplies, by Factor Contributing to Ignition 2010-2014 Annual Averages
Factor Contributing to Ignition Fires Civilian Deaths
Civilian Injuries
Direct Property Damage (in Millions)
Unclassified electrical failure
or malfunction 610 (35%) 0 (27%) 30 (28%) $37 (37%)
Unspecified short circuit arc 330 (19%) 0 (27%) 20 (20%) $17 (17%)
Heat source too close to
combustibles 150 (8%) 0 (0%) 10 (13%) $11 (11%)
Unclassified mechanical
failure or malfunction 110 (6%) 0 (0%) 0 (0%) $10 (10%)
Equipment overloaded 100 (6%) 0 (23%) 10 (7%) $5 (5%)
Arc or spark from operating
equipment 80 (4%) 0 (0%) 0 (4%) $4 (4%)
Short circuit arc from
defective or worn insulation 70 (4%) 0 (0%) 0 (2%) $1 (1%)
Equipment unattended 50 (3%) 0 (0%) 0 (1%) $5 (5%)
Unclassified misuse of
material or product 50 (3%) 0 (0%) 10 (6%) $1 (1%)
Arc from faulty contact or
broken conductor 40 (2%) 10 (46%) 0 (0%) $1 (1%)
Short circuit arc from
mechanical damage 30 (2%) 0 (0%) 10 (6%) $2 (2%)
Equipment not being operated
properly 30 (2%) 0 (0%) 0 (0%) $1 (1%)
Flammable liquid or gas
spilled 30 (2%) 0 (0%) 10 (6%) $2 (2%)
Improper fueling technique 30 (2%) 0 (0%) 10 (8%) $1 (1%)
Installation deficiency 20 (1%) 0 (0%) 0 (1%) $1 (1%)
Storm 20 (1%) 0 (0%) 0 (0%) $1 (1%)
Unclassified operational
deficiency 20 (1%) 0 (0%) 0 (0%) $1 (1%)
Unclassified factor
contributing to ignition 20 (1%) 0 (0%) 0 (0%) $1 (1%)
Improper container or storage 10 (1%) 0 (0%) 0 (0%) $1 (1%)
Leak or break 10 (1%) 0 (0%) 0 (0%) $0 (0%)
Automatic control failure 10 (1%) 0 (0%) 0 (4%) $1 (1%)
Worn out 10 (1%) 0 (0%) 0 (0%) $0 (0%)
Water caused short-circuit arc 10 (1%) 0 (0%) 0 (0%) $0 (0%)
Other known factor
contributing to ignition 70 (4%) 0 (0%) 0 (2%) $6 (6%)
Total fires 1,760 (100%) 10 (100%) 100 (100%) $99 (100%)
Total factors 1,910 (109%) 10 (124%) 110 (109%) $109 (111%)

Electrical Fires, 3/17 95 NFPA Research, Quincy, MA
Table 7.5. Home Fires Involving Transformers or Power Supplies, by Factor Contributing to Ignition 2010-2014 Annual Averages (Continued)
Note: Figures exclude confined fires. Multiple entries are allowed, which can result in sums higher than totals. Fires, deaths, and
injuries are rounded to the nearest ten and property damage is rounded to the nearest million dollars. Figures reflect a proportional
share of home fires with equipment involved in ignition unknown or reported as electrical distribution or lighting equipment of
undetermined type. Totals may not equal sums because of rounding error.
Source: Data from NFIRS Version 5.0 and NFPA Experience Survey.

Electrical Fires, 3/17 96 NFPA Research, Quincy, MA
Table 7.6. Home Fires Involving Transformers or Power Supplies, by Area of Origin 2010-2014 Annual Averages
Area of Origin Fires Civilian Deaths
Civilian Injuries
Direct Property Damage (in Millions)
Bedroom 380 (22%) 10 (50%) 30 (32%) $19 (19%)
Garage or vehicle storage area* 280 (16%) 0 (0%) 10 (11%) $35 (36%)
Living room, family room, or
den 190 (11%) 0 (31%) 10 (13%) $9 (9%)
Unclassified function area 90 (5%) 0 (0%) 10 (9%) $3 (3%)
Exterior wall surface 80 (5%) 0 (0%) 0 (2%) $4 (4%)
Kitchen or cooking area 60 (4%) 0 (0%) 0 (2%) $2 (2%)
Crawl space or substructure
space 50 (3%) 0 (0%) 0 (4%) $3 (3%)
Storage of supplies or tools or
dead storage 40 (2%) 0 (0%) 0 (1%) $2 (2%)
Office 40 (2%) 0 (0%) 0 (1%) $2 (2%)
Exterior balcony or unenclosed
porch 40 (2%) 0 (18%) 0 (2%) $1 (1%)
Unclassified outside area 30 (2%) 0 (0%) 0 (0%) $1 (1%)
Attic or ceiling/roof assembly or
concealed space 30 (2%) 0 (0%) 0 (1%) $1 (1%)
Wall assembly or concealed
space 30 (2%) 0 (0%) 0 (2%) $1 (1%)
Dining room 30 (2%) 0 (0%) 10 (7%) $1 (1%)
Unclassified storage area 30 (2%) 0 (0%) 0 (2%) $1 (1%)
Switchgear area or transformer
vault 20 (1%) 0 (0%) 0 (2%) $1 (1%)
Unclassified area of origin 20 (1%) 0 (0%) 0 (0%) $0 (0%)
Unclassified structural area 20 (1%) 0 (0%) 0 (0%) $1 (1%)
Laundry room or area 20 (1%) 0 (0%) 0 (0%) $1 (1%)
Closet 20 (1%) 0 (0%) 0 (1%) $0 (0%)
Courtyard, terrace or patio 20 (1%) 0 (0%) 0 (2%) $2 (2%)
Ceiling/floor assembly or
concealed space 20 (1%) 0 (0%) 0 (0%) $0 (0%)
Lobby or entrance way 20 (1%) 0 (0%) 0 (1%) $0 (0%)
Unclassified equipment or
service area 20 (1%) 0 (0%) 0 (0%) $0 (0%)
Bathroom or lavatory 20 (1%) 0 (0%) 0 (1%) $1 (1%)
Exterior surface of vehicle 10 (1%) 0 (0%) 0 (0%) $0 (0%)
Storage room, area, tank, or bin 10 (1%) 0 (0%) 0 (0%) $0 (0%)
Heating equipment room 10 (1%) 0 (0%) 0 (0%) $0 (0%)
Hallway or corridor 10 (1%) 0 (0%) 0 (3%) $0 (0%)
Machinery room or area or
elevator machinery room 10 (1%) 0 (0%) 0 (0%) $0 (0%)
*Excludes fires in which the property was coded as a residential garage.
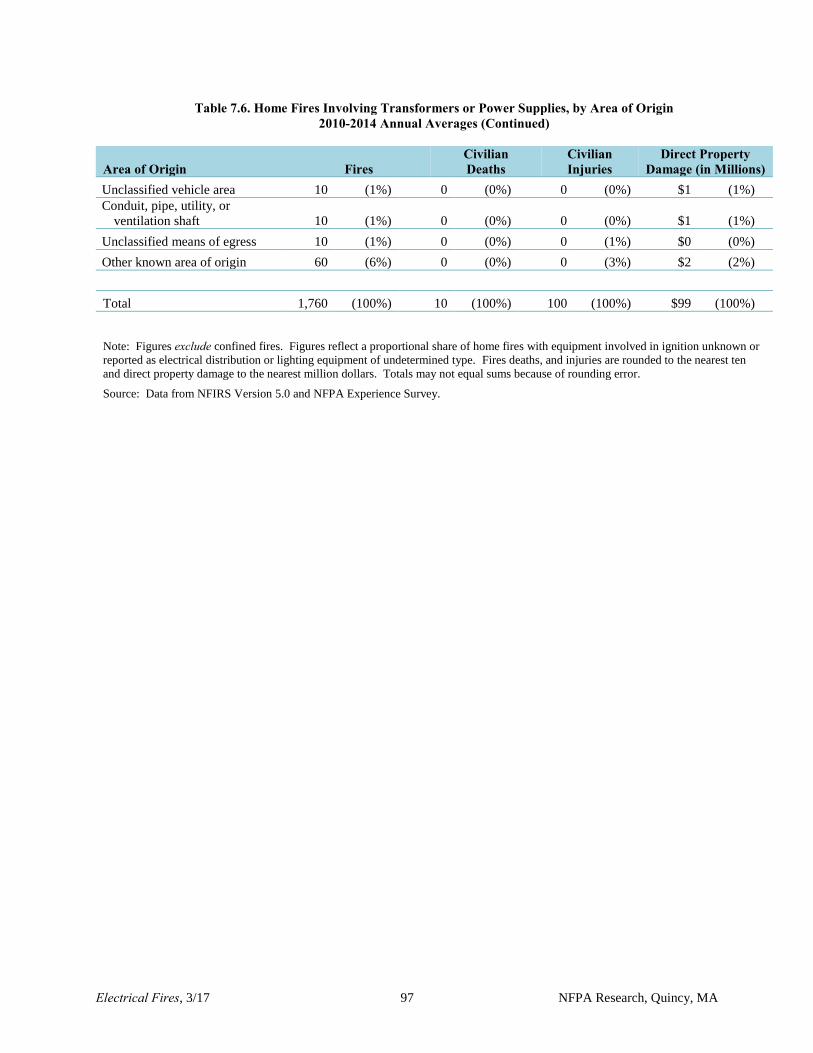
Electrical Fires, 3/17 97 NFPA Research, Quincy, MA
Table 7.6. Home Fires Involving Transformers or Power Supplies, by Area of Origin 2010-2014 Annual Averages (Continued)
Area of Origin Fires Civilian Deaths
Civilian Injuries
Direct Property Damage (in Millions)
Unclassified vehicle area 10 (1%) 0 (0%) 0 (0%) $1 (1%)
Conduit, pipe, utility, or
ventilation shaft 10 (1%) 0 (0%) 0 (0%) $1 (1%)
Unclassified means of egress 10 (1%) 0 (0%) 0 (1%) $0 (0%)
Other known area of origin 60 (6%) 0 (0%) 0 (3%) $2 (2%)
Total 1,760 (100%) 10 (100%) 100 (100%) $99 (100%)
Note: Figures exclude confined fires. Figures reflect a proportional share of home fires with equipment involved in ignition unknown or
reported as electrical distribution or lighting equipment of undetermined type. Fires deaths, and injuries are rounded to the nearest ten
and direct property damage to the nearest million dollars. Totals may not equal sums because of rounding error.
Source: Data from NFIRS Version 5.0 and NFPA Experience Survey.

Electrical Fires, 3/17 98 NFPA Research, Quincy, MA
Table 7.7. Home Fires Involving Transformers or Power Supplies, by Item First Ignited 2010-2014 Annual Averages
Item First Ignited Fires Civilian Deaths
Civilian Injuries
Direct Property Damage (in Millions)
Electrical wire or cable insulation 620 (36%) 10 (66%) 30 (26%) $33 (34%)
Exterior wall covering or finish 110 (7%) 0 (0%) 10 (8%) $8 (8%)
Unclassified item first ignited 100 (6%) 0 (0%) 0 (4%) $3 (3%)
Floor covering rug, carpet, or mat 90 (5%) 0 (0%) 10 (5%) $4 (4%)
Flammable and combustible
liquids and gases, piping and
filter 90 (5%) 0 (0%) 10 (11%) $6 (6%)
Structural member or framing 80 (4%) 0 (0%) 0 (0%) $8 (8%)
Appliance housing or casing 70 (4%) 0 (0%) 10 (7%) $5 (5%)
Mattress or bedding 60 (3%) 0 (0%) 0 (3%) 5 (5%)
Interior wall covering. excluding
drapes 50 (3%) 0 (0%) 0 (4%) $3 (3%)
Transformer or transformer fluids 50 (3%) 0 (0%) 0 (2%) $1 (1%)
Multiple items first ignited 50 (3%) 0 (0%) 10 (12%) $3 (3%)
Upholstered furniture 40 (3%) 0 (0%) 0 (1%) $4 (4%)
Unclassified furniture or utensils 40 (2%) 0 (18%) 0 (2%) $2 (2%)
Cabinetry 40 (2%) 0 (0%) 0 (1%) $3 (3%)
Unclassified structural component
or finish 30 (2%) 0 (0%) 0 (3%) $2 (2%)
Clothing 30 (2%) 0 (0%) 0 (2%) 1 (1%)
Box, carton, bag, basket, or barrel 30 (2%) 0 (0%) 0 (4%) $1 (1%)
Insulation within structural area 20 (1%) 0 (0%) 0 (0%) $1 (1%)
Unclassified soft goods or
wearing apparel 20 (1%) 0 (0%) 0 (1%) $1 (1%)
Toy or game 20 (1%) 0 (0%) 0 (0%) $0 (0%)
Magazine, newspaper, or writing
paper 20 (1%) 0 (0%) 0 (1%) $1 (1%)
Curtains, blinds, drapery, or
tapestry 10 (1%) 0 (16%) 0 (1%) $0 (0%)
Exterior roof covering or finish 10 (1%) 0 (0%) 0 (0%) $0 (0%)
Rubbish, trash, or waste 10 (1%) 0 (0%) 0 (0%) $0 (0%)
Unclassified storage supplies 9 (1%) 0 (0%) 0 (3%) $0 (1%)
Other known item first ignited 57 (3%) 0 (0%) 0 (0%) $2 (3%)
Total 1,760 (100%) 10 (100%) 100 (100%) $99 (100%)
Note: Figures exclude confined fires. Figures reflect a proportional share of home fires with equipment involved in ignition
unknown or reported as electrical distribution or lighting equipment of undetermined type. Fires deaths, and injuries are rounded
to the nearest ten and direct property damage to the nearest million dollars. Totals may not equal sums because of rounding error.
Source: Data from NFIRS Version 5.0 and NFPA Experience Survey
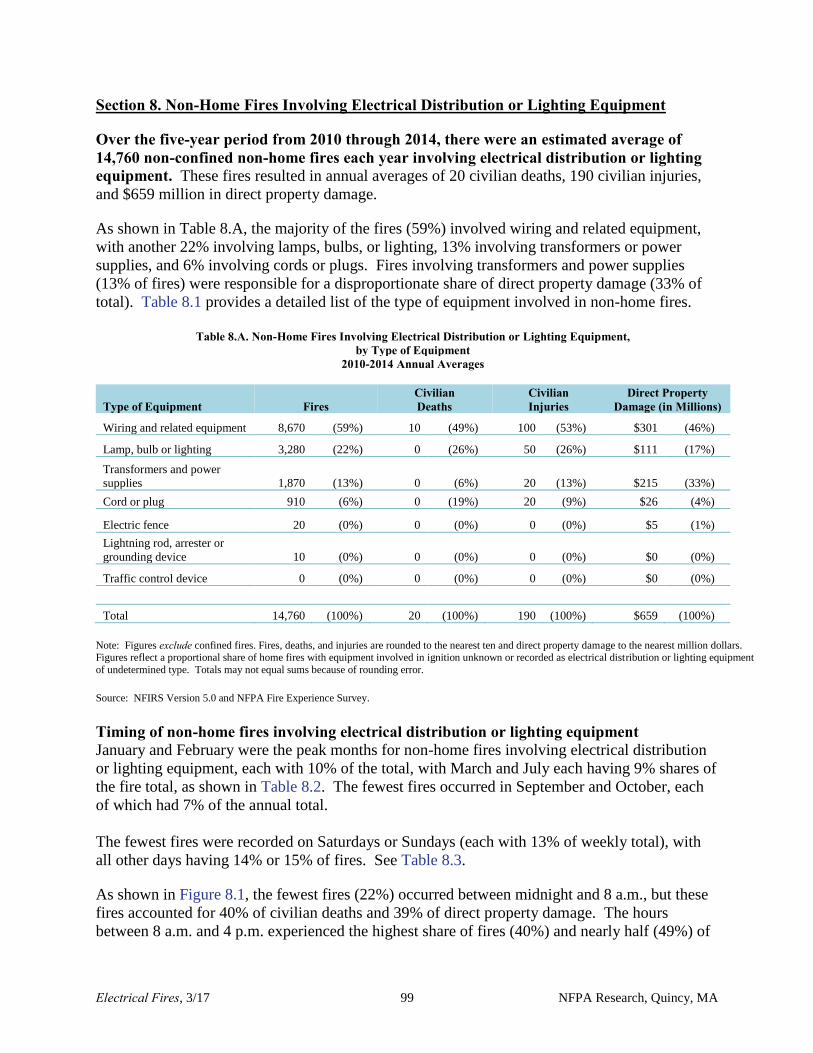
Electrical Fires, 3/17 99 NFPA Research, Quincy, MA
Section 8. Non-Home Fires Involving Electrical Distribution or Lighting Equipment
Over the five-year period from 2010 through 2014, there were an estimated average of 14,760 non-confined non-home fires each year involving electrical distribution or lighting equipment. These fires resulted in annual averages of 20 civilian deaths, 190 civilian injuries,
and $659 million in direct property damage.
As shown in Table 8.A, the majority of the fires (59%) involved wiring and related equipment,
with another 22% involving lamps, bulbs, or lighting, 13% involving transformers or power
supplies, and 6% involving cords or plugs. Fires involving transformers and power supplies
(13% of fires) were responsible for a disproportionate share of direct property damage (33% of
total). Table 8.1 provides a detailed list of the type of equipment involved in non-home fires.
Table 8.A. Non-Home Fires Involving Electrical Distribution or Lighting Equipment,
by Type of Equipment 2010-2014 Annual Averages
Type of Equipment Fires Civilian Deaths
Civilian Injuries
Direct Property Damage (in Millions)
Wiring and related equipment 8,670 (59%) 10 (49%) 100 (53%) $301 (46%)
Lamp, bulb or lighting 3,280 (22%) 0 (26%) 50 (26%) $111 (17%)
Transformers and power
supplies 1,870 (13%) 0 (6%) 20 (13%) $215 (33%)
Cord or plug 910 (6%) 0 (19%) 20 (9%) $26 (4%)
Electric fence 20 (0%) 0 (0%) 0 (0%) $5 (1%)
Lightning rod, arrester or
grounding device 10 (0%) 0 (0%) 0 (0%) $0 (0%)
Traffic control device 0 (0%) 0 (0%) 0 (0%) $0 (0%)
Total 14,760 (100%) 20 (100%) 190 (100%) $659 (100%)
Note: Figures exclude confined fires. Fires, deaths, and injuries are rounded to the nearest ten and direct property damage to the nearest million dollars. Figures reflect a proportional share of home fires with equipment involved in ignition unknown or recorded as electrical distribution or lighting equipment
of undetermined type. Totals may not equal sums because of rounding error.
Source: NFIRS Version 5.0 and NFPA Fire Experience Survey.
Timing of non-home fires involving electrical distribution or lighting equipment January and February were the peak months for non-home fires involving electrical distribution
or lighting equipment, each with 10% of the total, with March and July each having 9% shares of
the fire total, as shown in Table 8.2. The fewest fires occurred in September and October, each
of which had 7% of the annual total.
The fewest fires were recorded on Saturdays or Sundays (each with 13% of weekly total), with
all other days having 14% or 15% of fires. See Table 8.3.
As shown in Figure 8.1, the fewest fires (22%) occurred between midnight and 8 a.m., but these
fires accounted for 40% of civilian deaths and 39% of direct property damage. The hours
between 8 a.m. and 4 p.m. experienced the highest share of fires (40%) and nearly half (49%) of

Electrical Fires, 3/17 100 NFPA Research, Quincy, MA
the injuries. The hours between 4 p.m. and midnight recorded 37% of fires and 48% of civilian
deaths, as well as 33% of civilian injuries and 28% of direct property damage. More detailed
information is available in Table 8.4.
Note: See Note on Table 8.4. Source: NFIRS Version 5.0 and NFPA Fire Experience Survey.
Factor contributing to ignition. Unclassified electrical failures or malfunctions contributed to
approximately one-third (34%) of non-home fires involving electrical distribution or lighting
equipment, and these fires accounted for 50% of the civilian deaths, 22% of civilian injuries, and
35% of direct property damage. Some form of arcing contributed to two out of five of the fires,
including unspecified short circuit arcs (19% of fires), short circuit arcs from defective or worn
insulation (7%), arcs from faulty contacts or broken conductors (4%), arcs or sparks from
operating equipment (3%), short circuit arcs from mechanical damage (3%), and water-caused
short circuit arcs (3%). Unclassified mechanical failures or malfunctions contributed to 7% of
fires, with heat sources too close to combustibles contributing to 6% of fires, and fluorescent
light ballasts contributing to 3% of fires. See Table 8.5 for details.
Area of origin. Non-home fires involving electrical distribution or lighting equipment
originated in a wide variety of areas, with no dominant area of origin. The area of origin
accounting for the largest share of fires was switchgear area or transformer vault, with 7% of the
total, followed by wall assembly or concealed space (5%), exterior wall surface (5%), garage or
vehicle storage area (5%), unclassified outside area (5%), unclassified equipment or service area
(4%), unclassified storage area (4%), attic or ceiling/roof assembly or concealed space (4%), and
conduit, pipe, utility, or ventilation shaft (4%). See Table 8.6 for complete information.
Item first ignited. Electrical wire or cable insulation was the leading item first ignited in non-
home fires involving electrical distribution or lighting equipment, with 38% of the fire total.
These fires accounted for 17% of the civilian deaths, 26% of civilian injuries, and 27% of direct
property damage. A structural member or framing was first ignited in another 10% of fires,
followed by unclassified item first ignited (6%), exterior wall covering or finish (5%), flammable
and combustible liquids and gases, piping and filter (4%), and transformer or transformer fluids
(4%). Fires in which flammable and combustible liquids and gases, piping and filter were first
ignited accounted for one-fifth (20%) of civilian injuries. See Table 8.7.
22%
40%37%
40%
12%
48%
18%
49%
33%39%
32%28%
0%
10%
20%
30%
40%
50%
60%
Midnight - 8 a.m. 8 a.m. - 4:00 p.m. 4:00 p.m. - Midnight
Figure 8.1 Non-Home Fires Involving Electrical Distribution or Lighting
Equipment, by Time of Day, 2010-2014 Annual Averages
Fires Civilian Deaths Civilian Injuries Direct Property Damage

Electrical Fires, 3/17 101 NFPA Research, Quincy, MA
Table 8.1. Non-Home Fires Involving Electrical Distribution or Lighting Equipment, by Type of Equipment 2010-2014 Annual Averages
Type of Equipment Fires Civilian Deaths
Civilian Injuries
Direct Property Damage (in Millions)
Wiring and related
equipment 8,670 (59%) 10 (49%) 100 (53%) $301 (46%)
Unclassified electrical wiring 3,700 (25%) 10 (49%) 40 (21%) $128 (19%)
Electrical power (utility) line 1,110 (8%) 0 (0%) 0 (0%) $17 (3%)
Outlet or receptacle 1,000 (7%) 0 (0%) 10 (8%) $39 (6%)
Electrical service supply
wires from utility 770 (5%) 0 (0%) 10 (4%) $14 (2%)
Panelboard, switchboard or
circuit breaker board 720 (5%) 0 (0%) 20 (10%) $33 (5%)
Electrical branch circuit 670 (5%) 0 (0%) 10 (4%) $36 (5%)
Electric meter or meter box 360 (2%) 0 (0%) 0 (2%) $21 (3%)
Wiring from meter box to
circuit breaker 210 (1%) 0 (0%) 10 (3%) $7 (1%)
Wall switch 110 (1%) 0 (0%) 0 (1%) $5 (1%)
Ground fault circuit
interrupter 10 (0%) 0 (0%) 0 (0%) $0 (0%)
Lamp, bulb or lighting 3,280 (22%) 0 (26%) 50 (26%) $111 (17%)
Fluorescent lighting fixture or
ballast 880 (6%) 0 (14%) 10 (5%) $29 (4%)
Unclassified lamp or lighting 800 (5%) 0 (0%) 0 (2%) $29 (4%)
Sign 340 (2%) 0 (0%) 0 (1%) $5 (1%)
Incandescent lighting fixture 310 (2%) 0 (0%) 0 (2%) $8 (1%)
Halogen lighting fixture or
lamp 220 (1%) 0 (0%) 0 (0%) $7 (1%)
Decorative lights or line
voltage 170 (1%) 0 (0%) 0 (1%) $5 (1%)
Light bulb 160 (1%) 0 (12%) 0 (1%) $2 (0%)
Work light or trouble light 140 (1%) 0 (0%) 20 (9%) $15 (2%)
Table, floor, or desk lamp 130 (1%) 0 (0%) 0 (3%) $4 (1%)
Sodium or mercury vapor
lighting fixtures or lamps 90 (1%) 0 (0%) 0 (1%) $7 (1%)
Low voltage decorative or
landscape lighting 10 (0%) 0 (0%) 0 (0%) $0 (0%)
Nightlight 10 (0%) 0 (0%) 0 (0%) $0 (0%)
Lantern or flashlight 10 (0%) 0 (0%) 0 (1%) $0 (0%)
Transformers and power
supplies 1,870 (13%) 0 (6%) 20 (13%) $215 (33%)
Distribution type transformer 700 (5%) 0 (0%) 0 (1%) $47 (7%)
Generator 400 (3%) 0 (6%) 10 (3%) $87 (13%)
Battery charger or rectifier 230 (2%) 0 (0%) 0 (1%) $12 (2%)
Surge protector 140 (1%) 0 (0%) 0 (2%) $16 (2%)
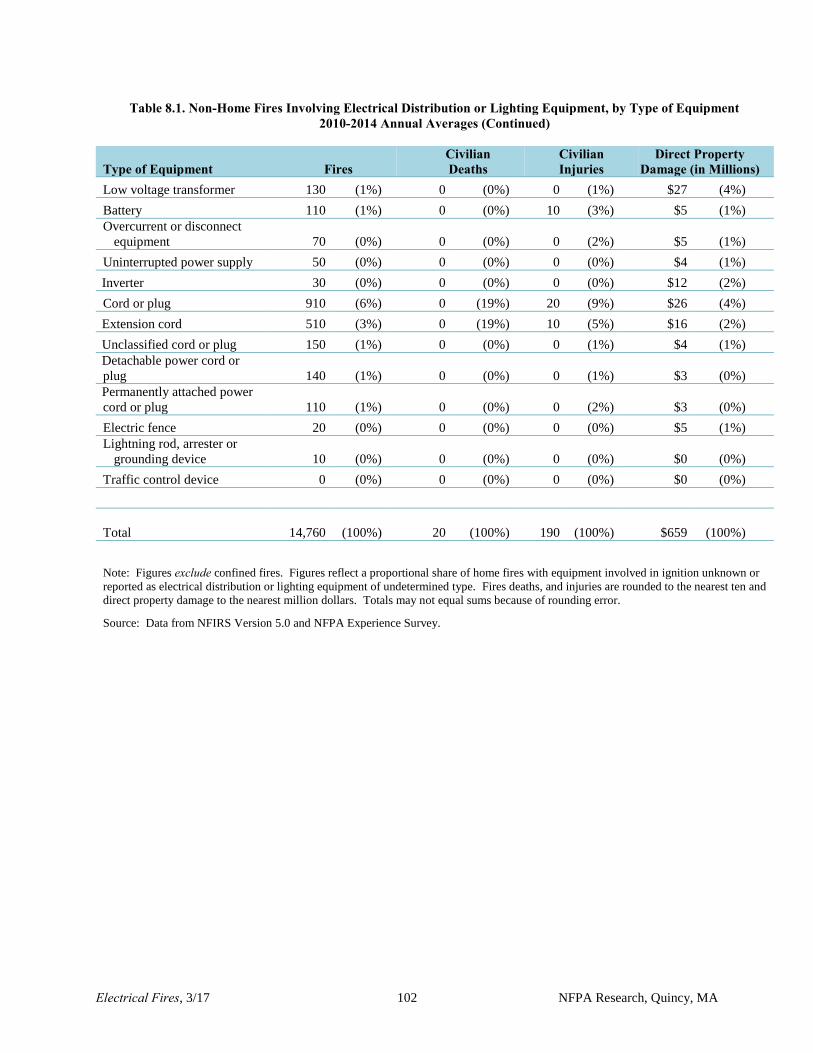
Electrical Fires, 3/17 102 NFPA Research, Quincy, MA
Table 8.1. Non-Home Fires Involving Electrical Distribution or Lighting Equipment, by Type of Equipment 2010-2014 Annual Averages (Continued)
Type of Equipment Fires Civilian Deaths
Civilian Injuries
Direct Property Damage (in Millions)
Low voltage transformer 130 (1%) 0 (0%) 0 (1%) $27 (4%)
Battery 110 (1%) 0 (0%) 10 (3%) $5 (1%)
Overcurrent or disconnect
equipment 70 (0%) 0 (0%) 0 (2%) $5 (1%)
Uninterrupted power supply 50 (0%) 0 (0%) 0 (0%) $4 (1%)
Inverter 30 (0%) 0 (0%) 0 (0%) $12 (2%)
Cord or plug 910 (6%) 0 (19%) 20 (9%) $26 (4%)
Extension cord 510 (3%) 0 (19%) 10 (5%) $16 (2%)
Unclassified cord or plug 150 (1%) 0 (0%) 0 (1%) $4 (1%)
Detachable power cord or
plug 140 (1%) 0 (0%) 0 (1%) $3 (0%)
Permanently attached power
cord or plug 110 (1%) 0 (0%) 0 (2%) $3 (0%)
Electric fence 20 (0%) 0 (0%) 0 (0%) $5 (1%)
Lightning rod, arrester or
grounding device 10 (0%) 0 (0%) 0 (0%) $0 (0%)
Traffic control device 0 (0%) 0 (0%) 0 (0%) $0 (0%)
Total 14,760 (100%) 20 (100%) 190 (100%) $659 (100%)
Note: Figures exclude confined fires. Figures reflect a proportional share of home fires with equipment involved in ignition unknown or
reported as electrical distribution or lighting equipment of undetermined type. Fires deaths, and injuries are rounded to the nearest ten and
direct property damage to the nearest million dollars. Totals may not equal sums because of rounding error.
Source: Data from NFIRS Version 5.0 and NFPA Experience Survey.

Electrical Fires, 3/17 103 NFPA Research, Quincy, MA
Table 8.2. Non-Home Fires Involving Electrical Distribution or Lighting Equipment, by Month 2010-2014 Annual Averages
Month Fires Civilian Deaths
Civilian Injuries
Direct Property Damage (in Millions)
January 1,500 (10%) 0 (0%) 20 (11%) $68 (10%)
February 1,510 (10%) 0 (12%) 20 (9%) $99 (15%)
March 1,270 (9%) 0 (15%) 10 (5%) $66 (10%)
April 1,130 (8%) 0 (0%) 10 (5%) $72 (11%)
May 1,160 (8%) 0 (0%) 10 (7%) $48 (7%)
June 1,240 (8%) 0 (6%) 20 (8%) $54 (8%)
July 1,390 (9%) 0 (0%) 10 (7%) $49 (7%)
August 1,110 (8%) 10 (34%) 20 (10%) $49 (7%)
September 960 (7%) 0 (6%) 20 (10%) $39 (6%)
October 1,080 (7%) 0 (14%) 20 (8%) $30 (5%)
November 1,190 (8%) 0 (0%) 20 (9%) $46 (7%)
December 1,210 (8%) 0 (12%) 20 (12%) $39 (6%)
Total 14,760 (100%) 20 (100%) 190 (100%) $659 (100%)
Note: Figures exclude confined fires. Figures reflect a proportional share of home fires with equipment involved in ignition
unknown or reported as electrical distribution or lighting equipment of undetermined type. Fires deaths, and injuries are rounded to
the nearest ten and direct property damage to the nearest million dollars. Totals may not equal sums because of rounding error.
Source: Data from NFIRS Version 5.0 and NFPA Experience Survey.
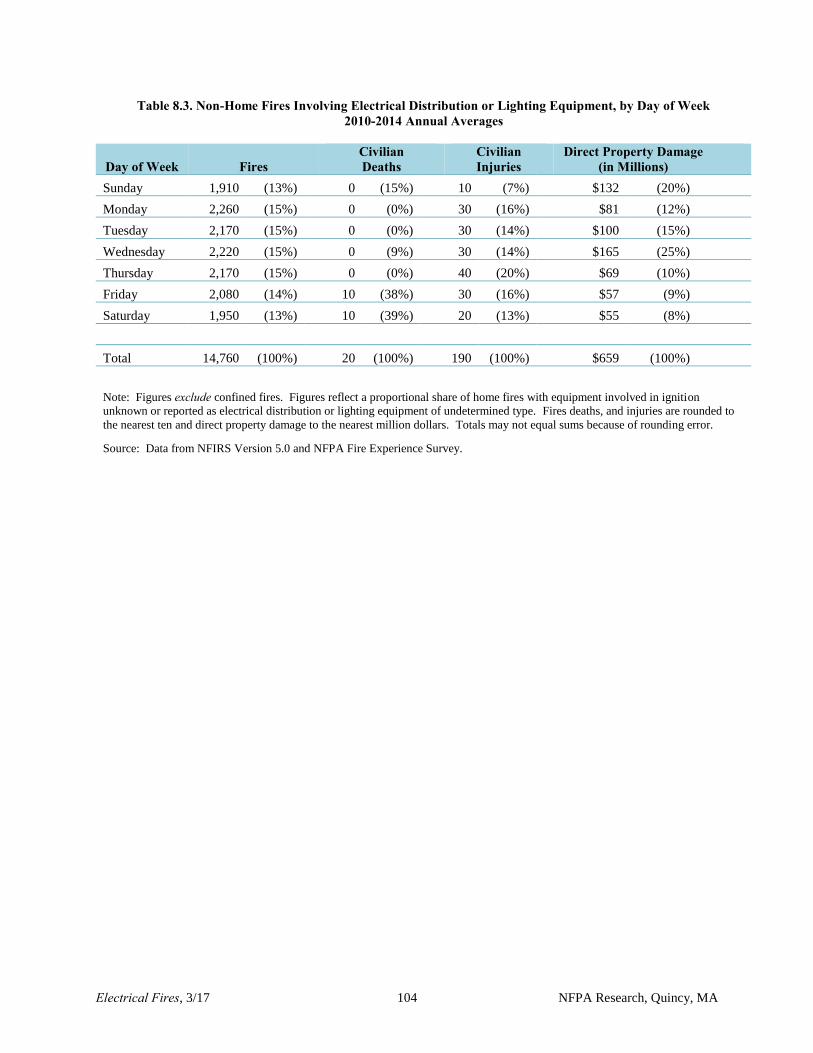
Electrical Fires, 3/17 104 NFPA Research, Quincy, MA
Table 8.3. Non-Home Fires Involving Electrical Distribution or Lighting Equipment, by Day of Week 2010-2014 Annual Averages
Day of Week Fires Civilian Deaths
Civilian Injuries
Direct Property Damage (in Millions)
Sunday 1,910 (13%) 0 (15%) 10 (7%) $132 (20%)
Monday 2,260 (15%) 0 (0%) 30 (16%) $81 (12%)
Tuesday 2,170 (15%) 0 (0%) 30 (14%) $100 (15%)
Wednesday 2,220 (15%) 0 (9%) 30 (14%) $165 (25%)
Thursday 2,170 (15%) 0 (0%) 40 (20%) $69 (10%)
Friday 2,080 (14%) 10 (38%) 30 (16%) $57 (9%)
Saturday 1,950 (13%) 10 (39%) 20 (13%) $55 (8%)
Total 14,760 (100%) 20 (100%) 190 (100%) $659 (100%)
Note: Figures exclude confined fires. Figures reflect a proportional share of home fires with equipment involved in ignition
unknown or reported as electrical distribution or lighting equipment of undetermined type. Fires deaths, and injuries are rounded to
the nearest ten and direct property damage to the nearest million dollars. Totals may not equal sums because of rounding error.
Source: Data from NFIRS Version 5.0 and NFPA Fire Experience Survey.
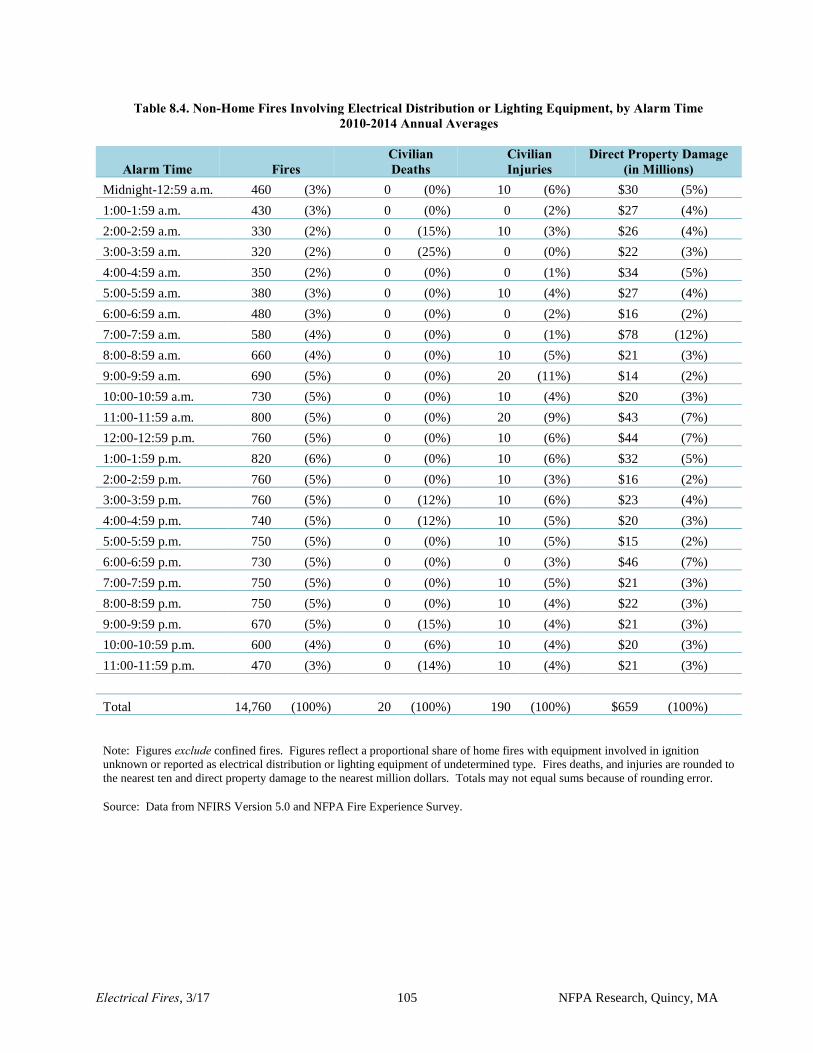
Electrical Fires, 3/17 105 NFPA Research, Quincy, MA
Table 8.4. Non-Home Fires Involving Electrical Distribution or Lighting Equipment, by Alarm Time 2010-2014 Annual Averages
Alarm Time Fires Civilian Deaths
Civilian Injuries
Direct Property Damage (in Millions)
Midnight-12:59 a.m. 460 (3%) 0 (0%) 10 (6%) $30 (5%)
1:00-1:59 a.m. 430 (3%) 0 (0%) 0 (2%) $27 (4%)
2:00-2:59 a.m. 330 (2%) 0 (15%) 10 (3%) $26 (4%)
3:00-3:59 a.m. 320 (2%) 0 (25%) 0 (0%) $22 (3%)
4:00-4:59 a.m. 350 (2%) 0 (0%) 0 (1%) $34 (5%)
5:00-5:59 a.m. 380 (3%) 0 (0%) 10 (4%) $27 (4%)
6:00-6:59 a.m. 480 (3%) 0 (0%) 0 (2%) $16 (2%)
7:00-7:59 a.m. 580 (4%) 0 (0%) 0 (1%) $78 (12%)
8:00-8:59 a.m. 660 (4%) 0 (0%) 10 (5%) $21 (3%)
9:00-9:59 a.m. 690 (5%) 0 (0%) 20 (11%) $14 (2%)
10:00-10:59 a.m. 730 (5%) 0 (0%) 10 (4%) $20 (3%)
11:00-11:59 a.m. 800 (5%) 0 (0%) 20 (9%) $43 (7%)
12:00-12:59 p.m. 760 (5%) 0 (0%) 10 (6%) $44 (7%)
1:00-1:59 p.m. 820 (6%) 0 (0%) 10 (6%) $32 (5%)
2:00-2:59 p.m. 760 (5%) 0 (0%) 10 (3%) $16 (2%)
3:00-3:59 p.m. 760 (5%) 0 (12%) 10 (6%) $23 (4%)
4:00-4:59 p.m. 740 (5%) 0 (12%) 10 (5%) $20 (3%)
5:00-5:59 p.m. 750 (5%) 0 (0%) 10 (5%) $15 (2%)
6:00-6:59 p.m. 730 (5%) 0 (0%) 0 (3%) $46 (7%)
7:00-7:59 p.m. 750 (5%) 0 (0%) 10 (5%) $21 (3%)
8:00-8:59 p.m. 750 (5%) 0 (0%) 10 (4%) $22 (3%)
9:00-9:59 p.m. 670 (5%) 0 (15%) 10 (4%) $21 (3%)
10:00-10:59 p.m. 600 (4%) 0 (6%) 10 (4%) $20 (3%)
11:00-11:59 p.m. 470 (3%) 0 (14%) 10 (4%) $21 (3%)
Total 14,760 (100%) 20 (100%) 190 (100%) $659 (100%)
Note: Figures exclude confined fires. Figures reflect a proportional share of home fires with equipment involved in ignition
unknown or reported as electrical distribution or lighting equipment of undetermined type. Fires deaths, and injuries are rounded to
the nearest ten and direct property damage to the nearest million dollars. Totals may not equal sums because of rounding error.
Source: Data from NFIRS Version 5.0 and NFPA Fire Experience Survey.

Electrical Fires, 3/17 106 NFPA Research, Quincy, MA
Table 8.5. Non-Home Fires Involving Electrical Distribution or Lighting Equipment, by Factor Contributing to Ignition
2010-2014 Annual Averages
Factor Contributing to Ignition Fires
Civilian Deaths
Civilian Injuries
Direct Property Damage (in Millions)
Unclassified electrical failure
or malfunction 4,950 (34%) 10 (50%) 40 (22%) $232 (35%)
Unspecified short circuit arc 2,810 (19%) 0 (0%) 40 (23%) $109 (17%)
Unclassified mechanical failure
or malfunction 1,050 (7%) 0 (29%) 10 (6%) $110 (17%)
Short circuit arc from defective
or worn insulation 1,020 (7%) 0 (11%) 10 (5%) $21 (3%)
Heat source too close to
combustibles. 860 (6%) 0 (0%) 20 (9%) $23 (4%)
Arc from faulty contact or
broken conductor 630 (4%) 0 (0%) 0 (2%) $13 (2%)
Arc or spark from operating
equipment 450 (3%) 0 (0%) 10 (4%) $18 (3%)
Fluorescent light ballast 450 (3%) 0 (0%) 0 (2%) $11 (2%)
Short circuit arc from
mechanical damage 380 (3%) 0 (0%) 10 (3%) $17 (3%)
Water-caused short-circuit arc 380 (3%) 0 (0%) 0 (1%) $7 (1%)
Worn out 220 (2%) 0 (0%) 0 (1%) $3 (0%)
Equipment overloaded 220 (1%) 0 (0%) 0 (2%) $4 (1%)
Storm 210 (1%) 0 (0%) 0 (0%) $9 (1%)
Unclassified factor contributing
to ignition 210 (1%) 0 (0%) 10 (3%) $8 (1%)
Unclassified misuse of material
or product 190 (1%) 0 (0%) 0 (2%) $5 (1%)
High wind 160 (1%) 0 (0%) 0 (1%) $6 (1%)
Equipment unattended 120 (1%) 0 (0%) 0 (1%) $8 (1%)
Installation deficiency 110 (1%) 0 (0%) 0 (0%) $3 (0%)
Animal 110 (1%) 0 (0%) 0 (0%) $0 (0%)
Exposure fire 100 (1%) 0 (0%) 0 (1%) $27 (4%)
Leak or break 90 (1%) 0 (0%) 0 (1%) $8 (1%)
Equipment not being operated
properly 80 (1%) 0 (14%) 0 (1%) $4 (1%)
Collision, knock down, run
over, or turn over 80 (1%) 0 (0%) 0 (1%) $5 (1%)
Other known factor
contributing to ignition 700 (5%) 0 (21%) 30 (18%) 50 (8%)
Total fires 14,760 (100%) 20 (100%) 190 (100%) $659 (100%)
Total factors 15,580 (106%) 20 (125%) 210 (109%) $702 (107%)
Note: Figures exclude confined fires. Multiple entries are allowed, which can result in sums higher than totals. Fires, deaths,
and injuries are rounded to the nearest hundred and property damage is rounded to the nearest million dollars. Figures reflect a
proportional share of home fires with equipment involved in ignition unknown or reported as electrical distribution or lighting
equipment of undetermined type. Totals may not equal sums because of rounding error.
Source: Data from NFIRS Version 5.0 and NFPA Fire Experience Survey.

Electrical Fires, 3/17 107 NFPA Research, Quincy, MA
Table 8.6. Non-Home Fires Involving Electrical Distribution or Lighting Equipment, by Area of Origin 2010-2014 Annual Averages
Area of Origin Fires Civilian Deaths
Civilian Injuries
Direct Property Damage (in Millions)
Switchgear area or transformer
vault 1,020 (7%) 0 (0%) 20 (8%) $74 (11%)
Wall assembly or concealed space 780 (5%) 0 (6%) 10 (4%) $21 (3%)
Exterior wall surface 750 (5%) 0 (0%) 0 (2%) $42 (6%)
Garage or vehicle storage area* 730 (5%) 0 (0%) 20 (9%) $24 (4%)
Unclassified outside area 700 (5%) 0 (0%) 0 (0%) $8 (1%)
Unclassified equipment or service
area 650 (4%) 0 (0%) 10 (3%) $35 (5%)
Unclassified storage area 640 (4%) 0 (0%) 0 (2%) $32 (5%)
Attic or ceiling/roof assembly or
concealed space 600 (4%) 0 (0%) 0 (0%) $29 (4%)
Conduit, pipe, utility, or
ventilation shaft 550 (4%) 0 (0%) 0 (2%) $7 (1%)
Bedroom 450 (3%) 0 (25%) 20 (11%) $9 (1%)
Storage of supplies or tools or
dead storage 450 (3%) 0 (0%) 0 (1%) $14 (2%)
Exterior roof surface 450 (3%) 0 (0%) 0 (1%) $18 (3%)
Unclassified area of origin 450 (3%) 0 (0%) 0 (1%) $6 (1%)
Kitchen or cooking area 440 (3%) 0 (15%) 0 (2%) $14 (2%)
Office 410 (3%) 0 (0%) 10 (4%) $26 (4%)
Ceiling/floor assembly or
concealed space 390 (3%) 0 (0%) 0 (1%) $21 (3%)
Unclassified structural area 370 (3%) 0 (12%) 10 (5%) $12 (2%)
Storage room, area, tank, or bin 360 (2%) 0 (0%) 10 (3%) $16 (2%)
Lavatory, bathroom, locker room
or check room 290 (2%) 0 (9%) 10 (4%) $5 (1%)
Unclassified function area 290 (2%) 0 (0%) 10 (4%) $7 (1%)
Sales or showroom area 280 (2%) 0 (0%) 0 (1%) $11 (2%)
Machinery room or area or
elevator machinery room 250 (2%) 0 (6%) 0 (2%) $8 (1%)
Crawl space or substructure space 240 (2%) 0 (0%) 0 (1%) $8 (1%)
On or near highway, public way
or street 220 (2%) 0 (0%) 0 (0%) $0 (0%)
Common room, living room,
family room, lounge or den 180 (1%) 0 (0%) 10 (4%) $7 (1%)
Awning 160 (1%) 0 (0%) 0 (0%) $1 (0%)
Maintenance or paint shop or area 160 (1%) 0 (0%) 10 (5%) $16 (2%)
Processing or manufacturing area,
or workroom 150 (1%) 0 (0%) 0 (1%) $10 (2%)
Unclassified service facility 150 (1%) 0 (0%) 0 (2%) $6 (1%)
Small assembly area, less than
100 person capacity 130 (1%) 0 (0%) 0 (2%) $11 (2%)
*Fires in which the property use was coded as a garage with a different area of origin will not be captured here.
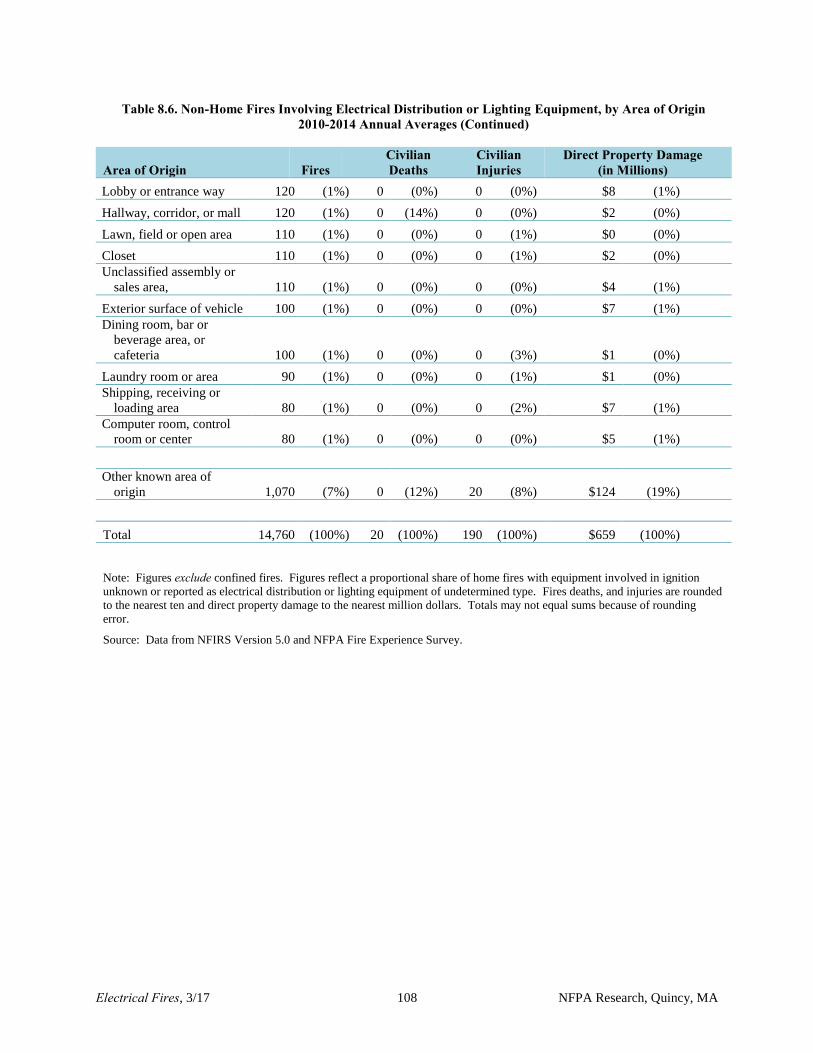
Electrical Fires, 3/17 108 NFPA Research, Quincy, MA
Table 8.6. Non-Home Fires Involving Electrical Distribution or Lighting Equipment, by Area of Origin 2010-2014 Annual Averages (Continued)
Area of Origin Fires Civilian Deaths
Civilian Injuries
Direct Property Damage (in Millions)
Lobby or entrance way 120 (1%) 0 (0%) 0 (0%) $8 (1%)
Hallway, corridor, or mall 120 (1%) 0 (14%) 0 (0%) $2 (0%)
Lawn, field or open area 110 (1%) 0 (0%) 0 (1%) $0 (0%)
Closet 110 (1%) 0 (0%) 0 (1%) $2 (0%)
Unclassified assembly or
sales area, 110 (1%) 0 (0%) 0 (0%) $4 (1%)
Exterior surface of vehicle 100 (1%) 0 (0%) 0 (0%) $7 (1%)
Dining room, bar or
beverage area, or
cafeteria 100 (1%) 0 (0%) 0 (3%) $1 (0%)
Laundry room or area 90 (1%) 0 (0%) 0 (1%) $1 (0%)
Shipping, receiving or
loading area 80 (1%) 0 (0%) 0 (2%) $7 (1%)
Computer room, control
room or center 80 (1%) 0 (0%) 0 (0%) $5 (1%)
Other known area of
origin 1,070 (7%) 0 (12%) 20 (8%) $124 (19%)
Total 14,760 (100%) 20 (100%) 190 (100%) $659 (100%)
Note: Figures exclude confined fires. Figures reflect a proportional share of home fires with equipment involved in ignition
unknown or reported as electrical distribution or lighting equipment of undetermined type. Fires deaths, and injuries are rounded
to the nearest ten and direct property damage to the nearest million dollars. Totals may not equal sums because of rounding
error.
Source: Data from NFIRS Version 5.0 and NFPA Fire Experience Survey.

Electrical Fires, 3/17 109 NFPA Research, Quincy, MA
Table 8.7. Non-Home Fires Involving Electrical Distribution or Lighting Equipment, by Item First Ignited 2010-2014 Annual Averages
Item First Ignited Fires Civilian Deaths
Civilian Injuries
Direct Property Damage (in Millions)
Electrical wire or cable
insulation 5,590 (38%) 0 (17%) 50 (26%) $177 (27%)
Structural member or framing 1,480 (10%) 0 (0%) 10 (6%) $72 (11%)
Unclassified item first Ignited 830 (6%) 0 (0%) 10 (7%) $100 (15%)
Exterior wall covering or finish 700 (5%) 0 (17%) 0 (1%) $54 (8%)
Flammable and combustible
liquids and gases, piping and
filter 600 (4%) 0 (8%) 40 (20%) $31 (5%)
Transformer or transformer
fluids 520 (4%) 0 (0%) 0 (2%) $13 (2%)
Interior wall covering.
excluding drapes 490 (3%) 0 (12%) 10 (3%) $25 (4%)
Unclassified structural
component or finish 490 (3%) 0 (28%) 0 (2%) $40 (6%)
Insulation within structural area 440 (3%) 0 (0%) 0 (1%) $9 (1%)
Exterior roof covering or finish 350 (2%) 0 (0%) 0 (1%) $18 (3%)
Interior ceiling cover or finish 300 (2%) 0 (0%) 0 (1%) $18 (3%)
Light vegetation including grass 230 (2%) 0 (0%) 0 (1%) $1 (0%)
Appliance housing or casing 210 (1%) 0 (0%) 0 (1%) $2 (0%)
Multiple items first ignited 200 (1%) 0 (0%) 0 (1%) $16 (2%)
Box, carton, bag, basket, barrel 170 (1%) 0 (0%) 0 (2%) $8 (1%)
Sign 160 (1%) 0 (0%) 0 (0%) $1 (0%)
Fence or pole 160 (1%) 0 (0%) 0 (0%) $0 (0%)
Unclassified organic materials 150 (1%) 0 (0%) 0 (0%) $2 (0%)
Mattress or bedding 140 (1%) 0 (0%) 10 (5%) $2 (0%)
Floor covering rug, carpet, or
mat 110 (1%) 0 (0%) 0 (2%) $3 (0%)
Agricultural crop, including
fruits and vegetables 100 (1%) 0 (0%) 0 (0%) $5 (1%)
Unclassified storage supplies 90 (1%) 0 (0%) 0 (0%) $3 (0%)
Clothing 90 (1%) 0 (0%) 10 (5%) $8 (1%)
Unclassified furniture, utensils 90 (1%) 0 (0%) 0 (1%) $5 (1%)
Upholstered furniture or vehicle
seat 90 (1%) 0 (0%) 10 (3%) $5 (1%)
Exterior trim, including doors 90 (1%) 0 (0%) 0 (1%) $1 (0%)
Cabinetry 80 (1%) 0 (0%) 0 (1%) $3 (0%)
Magazine, newspaper, or
writing paper 80 (1%) 0 (0%) 0 (0%) $3 (0%)
Dust, fiber, lint, including
sawdust or excelsior 80 (1%) 0 (0%) 0 (1%) $4 (1%)
Rubbish, trash, or waste 80 (1%) 0 (0%) 10 (3%) $2 (0%)

Electrical Fires, 3/17 110 NFPA Research, Quincy, MA
Table 8.7. Non-Home Fires Involving Electrical Distribution or Lighting Equipment, by Item First Ignited 2010-2014 Annual Averages (Continued)
Item First Ignited Fires Civilian Deaths
Civilian Injuries
Direct Property Damage (in Millions)
Other known item first
ignited 560 (4%) 0 (19%) 10 (4%) $29 (4%)
Total 14,760 (100%) 20 (100%) 190 (100%) $659 (100%)
Note: Figures exclude confined fires. Figures reflect a proportional share of home fires with equipment involved in ignition
unknown or reported as electrical distribution or lighting equipment of undetermined type. Fires deaths, and injuries are rounded
to the nearest ten and direct property damage to the nearest million dollars. Totals may not equal sums because of rounding error.
Source: Data from NFIRS Version 5.0 and NFPA Fire Experience Survey.

Electrical Fires, 3/17 111 NFPA Research, Quincy, MA
Appendix A. How National Estimates Statistics Are Calculated
The statistics in this analysis are estimates derived from the U.S. Fire Administration’s
(USFA’s) National Fire Incident Reporting System (NFIRS) and the National Fire
Protection Association’s (NFPA’s) annual survey of U.S. fire departments. NFIRS is a
voluntary system by which participating fire departments report detailed factors about the
fires to which they respond. Roughly two-thirds of U.S. fire departments participate,
although not all of these departments provide data every year. Fires reported to federal or
state fire departments or industrial fire brigades are not included in these estimates.
NFIRS provides the most detailed incident information of any national database not limited
to large fires. NFIRS is the only database capable of addressing national patterns for fires
of all sizes by specific property use and specific fire cause. NFIRS also captures
information on the extent of flame spread, and automatic detection and suppression
equipment. For more information about NFIRS visit http://www.nfirs.fema.gov/. Copies
of the paper forms may be downloaded from
http://www.nfirs.fema.gov/documentation/design/NFIRS_Paper_Forms_2008.pdf.
NFIRS has a wide variety of data elements and code choices. The NFIRS database
contains coded information. Many code choices describe several conditions. These
cannot be broken down further. For example, area of origin code 83 captures fires
starting in vehicle engine areas, running gear areas or wheel areas. It is impossible to tell
the portion of each from the coded data.
Methodology may change slightly from year to year. NFPA is continually examining its methodology to provide the best possible answers to
specific questions, methodological and definitional changes can occur. Earlier editions of the same report may have used different methodologies to produce the same analysis, meaning that the estimates are not directly comparable from year to year.
NFPA’s fire department experience survey provides estimates of the big picture. Each year, NFPA conducts an annual survey of fire departments which enables us to
capture a summary of fire department experience on a larger scale. Surveys are sent to
all municipal departments protecting populations of 50,000 or more and a random
sample, stratified by community size, of the smaller departments. Typically, a total of
roughly 3,000 surveys are returned, representing about one of every ten U.S. municipal
fire departments and about one third of the U.S. population.
The survey is stratified by size of population protected to reduce the uncertainty of the
final estimate. Small rural communities have fewer people protected per department and
are less likely to respond to the survey. A larger number must be surveyed to obtain an
adequate sample of those departments. (NFPA also makes follow-up calls to a sample of
the smaller fire departments that do not respond, to confirm that those that did respond
are truly representative of fire departments their size.) On the other hand, large city
departments are so few in number and protect such a large proportion of the total U.S.

Electrical Fires, 3/17 112 NFPA Research, Quincy, MA
population that it makes sense to survey all of them. Most respond, resulting in excellent
precision for their part of the final estimate.
The survey includes the following information: (1) the total number of fire incidents,
civilian deaths, and civilian injuries, and the total estimated property damage (in dollars),
for each of the major property use classes defined in NFIRS; (2) the number of on-duty
firefighter injuries, by type of duty and nature of illness; 3) the number and nature of non-
fire incidents; and (4) information on the type of community protected (e.g., county
versus township versus city) and the size of the population protected, which is used in the
statistical formula for projecting national totals from sample results. The results of the
survey are published in the annual report Fire Loss in the United States. To download a
free copy of the report, visit http://www.nfpa.org/assets/files/PDF/OS.fireloss.pdf.
Projecting NFIRS to National Estimates As noted, NFIRS is a voluntary system. Different states and jurisdictions have different
reporting requirements and practices. Participation rates in NFIRS are not necessarily
uniform across regions and community sizes, both factors correlated with frequency and
severity of fires. This means NFIRS may be susceptible to systematic biases. No one at
present can quantify the size of these deviations from the ideal, representative sample, so
no one can say with confidence that they are or are not serious problems. But there is
enough reason for concern so that a second database -- the NFPA survey -- is needed to
project NFIRS to national estimates and to project different parts of NFIRS separately.
This multiple calibration approach makes use of the annual NFPA survey where its
statistical design advantages are strongest.
Scaling ratios are obtained by comparing NFPA’s projected totals of residential structure
fires, non-residential structure fires, vehicle fires, and outside and other fires, and
associated civilian deaths, civilian injuries, and direct property damage with comparable
totals in NFIRS. Estimates of specific fire problems and circumstances are obtained by
multiplying the NFIRS data by the scaling ratios. Reports for incidents in which mutual
aid was given are excluded from NFPA’s analyses.
Analysts at the NFPA, the USFA and the Consumer Product Safety Commission
developed the specific basic analytical rules used for this procedure. “The National
Estimates Approach to U.S. Fire Statistics,” by John R. Hall, Jr. and Beatrice Harwood,
provides a more detailed explanation of national estimates. A copy of the article is
available online at http://www.nfpa.org/osds or through NFPA's One-Stop Data Shop.
Version 5.0 of NFIRS, first introduced in 1999, used a different coding structure for many data
elements, added some property use codes, and dropped others. The essentials of the approach
described by Hall and Harwood are still used, but some modifications have been necessary to
accommodate the changes in NFIRS 5.0.
Figure A.1 shows the percentage of fires originally collected in the NFIRS 5.0 system. Each
year’s release version of NFIRS data also includes data collected in older versions of NFIRS that
were converted to NFIRS 5.0 codes.

Electrical Fires, 3/17 113 NFPA Research, Quincy, MA
From 1999 data on, analyses are based on scaling ratios using only data originally collected in
NFIRS 5.0:
NFPA survey projections
NFIRS totals (Version 5.0)
For 1999 to 2001, the same rules may be applied, but estimates for these years in this form will
be less reliable due to the smaller amount of data originally collected in NFIRS 5.0; they should
be viewed with extreme caution.
Figure A.1. Fires Originally Collected in NFIRS 5.0 by Year
NFIRS 5.0 introduced six categories of confined structure fires, including:
cooking fires confined to the cooking vessel,
confined chimney or flue fires,
confined incinerator fire,
confined fuel burner or boiler fire or delayed ignition,
confined commercial compactor fire, and
trash or rubbish fires in a structure with no flame damage to the structure or its contents.
Because this analysis focused on fatalities only, no distinction was made between confined and
non-confined fires.
For most fields other than Property Use and Incident Type, NFPA allocates unknown data
proportionally among known data. This approach assumes that if the missing data were known,
it would be distributed in the same manner as the known data. NFPA makes additional
adjustments to several fields. Casualty and loss projections can be heavily influenced by the inclusion or exclusion of unusually serious fire.
In the formulas that follow, the term “all fires” refers to all fires in NFIRS on the dimension
studied. The percentages of fires with known or unknown data are provided for non-confined
7%
21%
48%
65%
79%
88%94% 94% 97% 99% 100% 100% 100%
0%
20%
40%
60%
80%
100%
1999 2000 2001 2002 2003 2004 2005 2006 2007 2008 2009 2010 2011

Electrical Fires, 3/17 114 NFPA Research, Quincy, MA
fires and associated losses, and for confined fires only.
Rounding and percentages. The data shown are estimates and generally rounded. An entry of
zero may be a true zero or it may mean that the value rounds to zero. Percentages are calculated
from unrounded values. It is quite possible to have a percentage entry of up to 100% even if the
rounded number entry is zero. The same rounded value may account for a slightly different
percentage share. Because percentages are expressed in integers and not carried out to several
decimal places, percentages that appear identical may be associated with slightly different
values.
In the formulas that follow, the term “all fires” refers to all fires in NFIRS on the dimension
studied. The percentages of fires with known or unknown data are provided for non-confined
fires and associated losses, and for confined fires only.
Cause of Ignition: This field is used chiefly to identify intentional fires. “Unintentional” in
this field is a specific entry and does not include other fires that were not intentionally set:
failure of equipment or heat source, act of nature, or “other” (unclassified).” The last should be
used for exposures but has been used for other situations as well. Fires that were coded as under
investigation and those that were coded as undetermined after investigation were treated as
unknown.
Factor Contributing to Ignition: In this field, the code “none” is treated as an unknown and
allocated proportionally. For Human Factor Contributing to Ignition, NFPA enters a code for
“not reported” when no factors are recorded. “Not reported” is treated as an unknown, but the
code “none” is treated as a known code and not allocated. Multiple entries are allowed in both of
these fields. Percentages are calculated on the total number of fires, not entries, resulting in
sums greater than 100%. Although Factor Contributing to Ignition is only required when the
cause of ignition was coded as: 2) unintentional, 3) failure of equipment or heat source; or 4) act
of nature, data is often present when not required. Consequently, any fire in which no factor
contributing to ignition was entered was treated as unknown.
In some analyses, all entries in the category of mechanical failure, malfunction (factor
contributing to ignition 20-29) are combined and shown as one entry, “mechanical failure or
malfunction.” This category includes:
21. Automatic control failure;
22. Manual control failure;
23. Leak or break. Includes leaks or breaks from containers or pipes. Excludes operational
deficiencies and spill mishaps;
25. Worn out;
26. Backfire. Excludes fires originating as a result of hot catalytic converters;
27. Improper fuel used; Includes the use of gasoline in a kerosene heater and the like; and
20. Mechanical failure or malfunction, other.
Entries in “electrical failure, malfunction” (factor contributing to ignition 30-39) may also be
combined into one entry, “electrical failure or malfunction.” This category includes:

Electrical Fires, 3/17 115 NFPA Research, Quincy, MA
31. Water-caused short circuit arc;
32. Short-circuit arc from mechanical damage;
33. Short-circuit arc from defective or worn insulation;
34. Unspecified short circuit arc;
35. Arc from faulty contact or broken connector, including broken power lines and loose
connections;
36. Arc or spark from operating equipment, switch, or electric fence;
37. Fluorescent light ballast; and
30. Electrical failure or malfunction, other.
Heat Source. In NFIRS 5.0, one grouping of codes encompasses various types of open flames
and smoking materials. In the past, these had been two separate groupings. A new code was
added to NFIRS 5.0, which is code 60: “Heat from open flame or smoking material, other.”
NFPA treats this code as a partial unknown and allocates it proportionally across the codes in the
61-69 range, shown below.
61. Cigarette;
62. Pipe or cigar;
63. Heat from undetermined smoking material;
64. Match;
65. Lighter: cigarette lighter, cigar lighter;
66. Candle;
67 Warning or road flare, fuse;
68. Backfire from internal combustion engine. Excludes flames and sparks from an exhaust
system, (11); and
69. Flame/torch used for lighting. Includes gas light and gas-/liquid-fueled lantern.
In addition to the conventional allocation of missing and undetermined fires, NFPA multiplies
fires with codes in the 61-69 range by
All fires in range 60-69
All fires in range 61-69
The downside of this approach is that heat sources that are truly a different type of open flame or
smoking material are erroneously assigned to other categories. The grouping “smoking
materials” includes codes 61-63 (cigarettes, pipes or cigars, and heat from undetermined
smoking material, with a proportional share of the code 60s and true unknown data.
Equipment Involved in Ignition (EII). NFIRS 5.0 originally defined EII as the piece of
equipment that provided the principal heat source to cause ignition if the equipment
malfunctioned or was used improperly. In 2006, the definition was modified to “the piece of
equipment that provided the principal heat source to cause ignition.” However, much of the data
predates the change. Individuals who have already been trained with the older definition may
not change their practices. To compensate, NFPA treats fires in which EII = NNN and heat
source is not in the range of 40-99 as an additional unknown.

Electrical Fires, 3/17 116 NFPA Research, Quincy, MA
To allocate unknown data for EII, the known data is multiplied by
All fires
(All fires – blank – undetermined – [fires in which EII =NNN and heat source <>40-99])
In addition, the partially unclassified codes for broad equipment groupings (i.e., code 100 -
heating, ventilation, and air conditioning, other; code 200 - electrical distribution, lighting and
power transfer, other; etc.) were allocated proportionally across the individual code choices in
their respective broad groupings (heating, ventilation, and air conditioning; electrical
distribution, lighting and power transfer, other; etc.). Equipment that is totally unclassified is not
allocated further. This approach has the same downside as the allocation of heat source 60
described above. Equipment that is truly different is erroneously assigned to other categories.
In some analyses, various types of equipment are grouped together.
Code Grouping EII Code NFIRS definitions Central heat 132 Furnace or central heating unit
133 Boiler (power, process or heating)
Fixed or portable space heater 131 Furnace, local heating unit, built-in
123 Fireplace with insert or stove
124 Heating stove
141 Heater, excluding catalytic and oil-filled
142 Catalytic heater
143 Oil-filled heater
Fireplace or chimney 120 Fireplace or chimney
121 Fireplace, masonry
122 Fireplace, factory-built
125 Chimney connector or vent connector
126 Chimney – brick, stone or masonry
127 Chimney-metal, including stovepipe or
flue
Fixed wiring and related equipment 210 Unclassified electrical wiring
211 Electrical power or utility line
212 Electrical service supply wires from
utility
213 Electric meter or meter box
214 Wiring from meter box to circuit breaker
215 Panel board, switch board or circuit
breaker board
216 Electrical branch circuit

Electrical Fires, 3/17 117 NFPA Research, Quincy, MA
217 Outlet or receptacle
218 Wall switch
219 Ground fault interrupter
Transformers and power supplies 221 Distribution-type transformer
222 Overcurrent, disconnect equipment
223 Low-voltage transformer
224 Generator
225 Inverter
226 Uninterrupted power supply (UPS)
227 Surge protector
228 Battery charger or rectifier
229 Battery (all types)
Code Grouping EII Code NFIRS definitions Lamp, bulb or lighting 230 Unclassified lamp or lighting
231 Lamp-tabletop, floor or desk
232 Lantern or flashlight
233 Incandescent lighting fixture
234 Fluorescent light fixture or ballast
235 Halogen light fixture or lamp
236 Sodium or mercury vapor light fixture or
lamp
237 Work or trouble light
238 Light bulb
241 Nightlight
242 Decorative lights – line voltage
243 Decorative or landscape lighting – low
voltage
244 Sign
Cord or plug 260 Unclassified cord or plug
261 Power cord or plug, detachable from
appliance
262 Power cord or plug- permanently
attached
263 Extension cord
Torch, burner or soldering iron 331 Welding torch
332 Cutting torch
333 Burner, including Bunsen burners
334 Soldering equipment
Portable cooking or warming
equipment
631 Coffee maker or teapot

Electrical Fires, 3/17 118 NFPA Research, Quincy, MA
632 Food warmer or hot plate
633 Kettle
634 Popcorn popper
635 Pressure cooker or canner
636 Slow cooker
637 Toaster, toaster oven, counter-top broiler
638 Waffle iron, griddle
639 Wok, frying pan, skillet
641 Breadmaking machine
Equipment was not analyzed separately for confined fires. Instead, each confined fire incident
type was listed with the equipment or as other known equipment.
Item First Ignited. In most analyses, mattress and pillows (item first ignited 31) and bedding,
blankets, sheets, and comforters (item first ignited 32) are combined and shown as “mattresses
and bedding.” In many analyses, wearing apparel not on a person (code 34) and wearing apparel
on a person (code 35) are combined and shown as “clothing.” In some analyses, flammable and
combustible liquids and gases, piping and filters (item first ignited 60-69) are combined and
shown together.
Area of Origin. Two areas of origin: bedroom for more than five people (code 21) and
bedroom for less than five people (code 22) are combined and shown as simply “bedroom.”
Chimney is no longer a valid area of origin code for non-confined fires.
Rounding and percentages. The data shown are estimates and generally rounded. An entry of
zero may be a true zero or it may mean that the value rounds to zero. Percentages are calculated
from unrounded values. It is quite possible to have a percentage entry of up to 100% even if the
rounded number entry is zero. The same rounded value may account for a slightly different
percentage share. Because percentages are expressed in integers and not carried out to several
decimal places, percentages that appear identical may be associated with slightly different
values.