march 2013 ada county housing market statistics
DESCRIPTION
Housing Market Statistics for Boise, IdahoTRANSCRIPT

Area: Ada County Report Month: March, 2013
Market Trends
Active Pending Sold
Price in
$1000's12 Mths Inventory Ask Price Sold Price
Sold to Ask
Ratio
Average
Sq Ft
Price per
SqFt
%
Distressed
0 - 100K 92 75 764 1.4 79,934 80,351 100.5% 1,183 67.90 58.4%
100 -150K 230 261 2039 1.4 127,599 126,712 99.3% 1,494 84.79 37.0%
150 - 199K 272 235 1290 2.5 175,008 172,526 98.6% 1,961 87.99 23.5%
200 - 249K 187 94 726 3.1 227,034 223,036 98.2% 2,310 96.55 16.5%
250 - 299K 162 76 444 4.4 276,056 270,778 98.1% 2,651 102.13 10.1%
300 - 349K 98 43 254 4.6 327,289 320,077 97.8% 2,826 113.24 9.1%
Average Sold Price: Historical 350 - 399K 67 30 148 5.4 376,305 368,513 97.9% 3,208 114.86 12.2%
400 - 499K 61 24 126 5.8 454,607 441,879 97.2% 3,617 122.18 9.5%
500 - 599K 37 17 70 6.3 555,183 539,313 97.1% 3,988 135.23 8.6%
600 - 799K 39 10 53 8.8 708,970 685,543 96.7% 4,279 160.19 0.0%
800 - 999K 13 2 12 13.0 902,457 794,358 88.0% 5,361 148.18 8.3%
>1M 19 3 8 28.5 1,435,000 1,276,938 89.0% 6,639 192.34 12.5%
Total 1277 870 5934 2.6 29.2%Average
Price271,233$ 208,793$ 189,947$ - 189,947 186,770 98.3% 1,955 95.52$
Report Criteria:Single Family (<2 acres), Condo, Townhouse
Minimum: 1bed, 1bath, $2000 asking price Age: <1 yr - 50+ years
Current as of Report Date
Existing Home Market Statistics
Average based on 12 Month Solds
$247,083 $241,782
$201,723$180,630
$160,113$180,440 $186,770
$-
$50,000
$100,000
$150,000
$200,000
$250,000
$300,000
2007 2008 2009 2010 2011 2012 2013
476 56
9
501 61
0
580
600
474 522
498
415
321 38
0 463
836 835 901 901 878 805 765 681 616 542 660 730 870
1518 1544
1270 1321
11761104 1152
12771337
1421151315071469
0
100
200
300
400
500
600
700
800
900
1000
Mar, 12 Apr, 12 May, 12 Jun, 12 Jul, 12 Aug, 12 Sep, 12 Oct, 12 Nov, 12 Dec, 12 Jan, 13 Feb, 13 Mar, 13
0
200
400
600
800
1000
1200
1400
1600
1800Closed Sales Pending Sales Active Listings
The information provided is derived from the Intermountain MLS. it is deemed reliable but not guaranteed. Report Date: April 6, 2013

Area: 100, N Boise Report Month: March, 2013
Market Trends
Active Pending Sold
Price in
$1000's12 Mths Inventory Ask Price Sold Price
Sold to Ask
Ratio
Average
Sq Ft
Price per
SqFt
%
Distressed
0 - 100K 8 4 27 3.6 85,125 85,343 100.3% 917 93.08 51.9%
100 -150K 8 5 86 1.1 130,169 127,389 97.9% 1,187 107.30 32.6%
150 - 199K 11 10 74 1.8 182,652 180,201 98.7% 1,569 114.88 16.2%
200 - 249K 12 4 61 2.4 228,141 225,461 98.8% 1,799 125.32 11.5%
250 - 299K 7 4 42 2.0 279,247 274,326 98.2% 2,094 131.04 4.8%
300 - 349K 12 4 40 3.6 329,138 321,381 97.6% 2,362 136.04 7.5%
Average Sold Price: Historical 350 - 399K 11 3 27 4.9 377,796 368,135 97.4% 2,477 148.61 11.1%
400 - 499K 7 4 28 3.0 452,959 442,231 97.6% 3,183 138.92 0.0%
500 - 599K 9 4 14 7.7 553,686 539,933 97.5% 3,535 152.76 0.0%
600 - 799K 10 1 20 6.0 700,366 686,024 98.0% 3,719 184.46 0.0%
800 - 999K 2 0 6 4.0 898,325 795,250 88.5% 5,181 153.48 16.7%
>1M 10 0 3 40.0 1,355,000 1,183,333 87.3% 5,288 223.78 0.0%
Total 107 43 428 3.0 16.4%Average
Price477,524$ 276,843$ 279,047$ - 279,047 271,459 97.3% 2,007 135.26$
Report Criteria:Single Family (<2 acres), Condo, Townhouse
Minimum: 1bed, 1bath, $2000 asking price Age: <1 yr - 50+ years
Current as of Report Date
Existing Home Market Statistics
Average based on 12 Month Solds
$317,738$334,469
$275,480$259,536
$238,943$268,654 $271,459
$-
$50,000
$100,000
$150,000
$200,000
$250,000
$300,000
$350,000
$400,000
2007 2008 2009 2010 2011 2012 2013
36 3341
5343 42
25
3934 32
23 21
42
60 69 69 57 57 48 55 38 45 33 39 57 43
154 155144
129
112 107
92
107108118
148148
132
0
10
20
30
40
50
60
70
80
Mar, 12 Apr, 12 May, 12 Jun, 12 Jul, 12 Aug, 12 Sep, 12 Oct, 12 Nov, 12 Dec, 12 Jan, 13 Feb, 13 Mar, 13
0
20
40
60
80
100
120
140
160
180Closed Sales Pending Sales Active Listings
The information provided is derived from the Intermountain MLS. it is deemed reliable but not guaranteed. Report Date: April 6, 2013

Area: 200, NE Boise Report Month: March, 2013
Market Trends
Active Pending Sold
Price in
$1000's12 Mths Inventory Ask Price Sold Price
Sold to Ask
Ratio
Average
Sq Ft
Price per
SqFt
%
Distressed
0 - 100K 0 0 0 0.0 0 0 0 0.0%
100 -150K 1 1 5 2.4 135,020 132,100 97.8% 1,329 99.38 60.0%
150 - 199K 0 2 17 0.0 178,865 173,229 96.8% 1,724 100.49 11.8%
200 - 249K 3 1 28 1.3 229,875 225,055 97.9% 1,869 120.38 14.3%
250 - 299K 7 6 31 2.7 275,555 270,279 98.1% 2,275 118.81 3.2%
300 - 349K 6 4 23 3.1 324,265 320,157 98.7% 2,429 131.82 0.0%
Average Sold Price: Historical 350 - 399K 2 2 14 1.7 373,607 366,729 98.2% 3,019 121.46 0.0%
400 - 499K 4 3 8 6.0 458,697 441,433 96.2% 3,197 138.08 12.5%
500 - 599K 1 2 6 2.0 552,213 546,250 98.9% 3,112 175.51 0.0%
600 - 799K 4 0 4 12.0 738,267 711,950 96.4% 4,877 146.00 0.0%
800 - 999K 0 0 2 0.0 973,700 898,750 92.3% 5,734 156.74 0.0%
>1M 3 2 1 36.0 1,195,000 1,015,500 85.0% 7,160 141.83 0.0%
Total 31 23 139 2.7 7.9%Average
Price470,134$ 428,413$ 319,634$ - 319,634 310,662 97.2% 2,449 126.84$
Report Criteria:Single Family (<2 acres), Condo, Townhouse
Minimum: 1bed, 1bath, $2000 asking price Age: <1 yr - 50+ years
Current as of Report Date
Existing Home Market Statistics
Average based on 12 Month Solds
$395,269
$331,359$300,991
$317,747$296,828 $310,894 $310,662
$-
$50,000
$100,000
$150,000
$200,000
$250,000
$300,000
$350,000
$400,000
$450,000
2007 2008 2009 2010 2011 2012 2013
7
13 12
1720
15
9
15
912
6 6 69 12 19 16 18 13 19 8 13 9 14 15 23
4448 49
44
37 37
31 31
4440
454440
0
5
10
15
20
25
Mar, 12 Apr, 12 May, 12 Jun, 12 Jul, 12 Aug, 12 Sep, 12 Oct, 12 Nov, 12 Dec, 12 Jan, 13 Feb, 13 Mar, 13
0
10
20
30
40
50
60Closed Sales Pending Sales Active Listings
The information provided is derived from the Intermountain MLS. it is deemed reliable but not guaranteed. Report Date: April 6, 2013

Area: 300, SE Boise Report Month: March, 2013
Market Trends
Active Pending Sold
Price in
$1000's12 Mths Inventory Ask Price Sold Price
Sold to Ask
Ratio
Average
Sq Ft
Price per
SqFt
%
Distressed
0 - 100K 7 4 56 1.5 81,271 79,660 98.0% 1,069 74.52 41.1%
100 -150K 24 20 155 1.9 128,091 127,399 99.5% 1,269 100.42 29.7%
150 - 199K 17 18 123 1.7 176,682 173,385 98.1% 1,641 105.68 17.1%
200 - 249K 10 10 70 1.7 224,818 219,122 97.5% 1,962 111.70 8.6%
250 - 299K 14 10 39 4.3 272,369 266,094 97.7% 2,196 121.18 2.6%
300 - 349K 9 7 33 3.3 325,988 318,535 97.7% 2,449 130.06 0.0%
Average Sold Price: Historical 350 - 399K 5 3 17 3.5 375,388 370,171 98.6% 2,924 126.59 0.0%
400 - 499K 4 3 14 3.4 458,079 437,387 95.5% 3,155 138.63 0.0%
500 - 599K 3 4 7 5.1 546,290 519,200 95.0% 3,459 150.11 14.3%
600 - 799K 1 0 8 1.5 704,188 676,000 96.0% 3,473 194.66 0.0%
800 - 999K 0 1 1 0.0 845,000 785,000 92.9% 4,900 160.20 0.0%
>1M 1 1 1 12.0 1,475,000 1,450,000 98.3% 8,492 170.75 100.0%
Total 95 81 524 2.2 18.9%Average
Price241,472$ 251,157$ 204,977$ - 204,977 200,585 97.9% 1,757 114.15$
Report Criteria:Single Family (<2 acres), Condo, Townhouse
Minimum: 1bed, 1bath, $2000 asking price Age: <1 yr - 50+ years
Current as of Report Date
Existing Home Market Statistics
Average based on 12 Month Solds
$248,843$231,165
$215,361$188,921 $180,525
$194,904 $200,585
$-
$50,000
$100,000
$150,000
$200,000
$250,000
$300,000
2007 2008 2009 2010 2011 2012 2013
38
5246
62 6654
38 3441
3425 29
42
73 71 84 84 62 49 46 53 46 40 56 63 81
121133
110 10597
84 8695
105
120
133135135
0
10
20
30
40
50
60
70
80
90
Mar, 12 Apr, 12 May, 12 Jun, 12 Jul, 12 Aug, 12 Sep, 12 Oct, 12 Nov, 12 Dec, 12 Jan, 13 Feb, 13 Mar, 13
0
20
40
60
80
100
120
140
160Closed Sales Pending Sales Active Listings
The information provided is derived from the Intermountain MLS. it is deemed reliable but not guaranteed. Report Date: April 6, 2013

Area: 400, Bench Report Month: March, 2013
Market Trends
Active Pending Sold
Price in
$1000's12 Mths Inventory Ask Price Sold Price
Sold to Ask
Ratio
Average
Sq Ft
Price per
SqFt
%
Distressed
0 - 100K 27 21 177 1.8 76,047 76,105 100.1% 1,121 67.88 54.8%
100 -150K 25 25 221 1.4 123,946 122,492 98.8% 1,438 85.21 24.0%
150 - 199K 16 19 80 2.4 173,058 167,969 97.1% 2,080 80.76 8.8%
200 - 249K 7 3 17 4.9 225,047 215,317 95.7% 2,688 80.11 17.6%
250 - 299K 4 1 8 6.0 273,750 258,568 94.5% 2,951 87.64 12.5%
300 - 349K 2 1 6 4.0 323,533 309,917 95.8% 3,122 99.26 16.7%
Average Sold Price: Historical 350 - 399K 0 0 1 0.0 375,000 340,000 90.7% 4,513 75.34 0.0%
400 - 499K 1 0 0 0.0 0 0 0 0.0%
500 - 599K 2 0 0 0.0 0 0 0 0.0%
600 - 799K 0 2 2 0.0 664,450 628,750 94.6% 4,911 128.03 0.0%
800 - 999K 1 1 0 0.0 0 0 0 0.0%
>1M 0 0 0 0.0 0 0 0 0.0%
Total 85 73 512 2.0 31.6%Average
Price165,140$ 163,673$ 125,699$ - 125,699 123,369 98.1% 1,533 80.48$
Report Criteria:Single Family (<2 acres), Condo, Townhouse
Minimum: 1bed, 1bath, $2000 asking price Age: <1 yr - 50+ years
Current as of Report Date
Existing Home Market Statistics
Average based on 12 Month Solds
$178,512$170,900
$142,157
$115,196$99,197
$115,858$123,369
$-
$20,000
$40,000
$60,000
$80,000
$100,000
$120,000
$140,000
$160,000
$180,000
$200,000
2007 2008 2009 2010 2011 2012 2013
3648
29
5242 47 50
58
3829
23
37
57
84 76 86 84 90 78 66 58 62 52 63 74 73
127120
100106
111
94 9385
110119
107114111
0
10
20
30
40
50
60
70
80
90
100
Mar, 12 Apr, 12 May, 12 Jun, 12 Jul, 12 Aug, 12 Sep, 12 Oct, 12 Nov, 12 Dec, 12 Jan, 13 Feb, 13 Mar, 13
0
20
40
60
80
100
120
140Closed Sales Pending Sales Active Listings
The information provided is derived from the Intermountain MLS. it is deemed reliable but not guaranteed. Report Date: April 6, 2013

Area: 500, S Boise Report Month: March, 2013
Market Trends
Active Pending Sold
Price in
$1000's12 Mths Inventory Ask Price Sold Price
Sold to Ask
Ratio
Average
Sq Ft
Price per
SqFt
%
Distressed
0 - 100K 1 1 23 0.5 83,307 85,093 102.1% 1,173 72.54 69.6%
100 -150K 12 6 78 1.8 128,426 128,710 100.2% 1,651 77.96 48.7%
150 - 199K 12 10 55 2.6 175,361 173,721 99.1% 2,027 85.72 29.1%
200 - 249K 4 7 23 2.1 221,596 215,022 97.0% 2,407 89.33 0.0%
250 - 299K 4 6 9 5.3 278,611 271,700 97.5% 2,875 94.50 0.0%
300 - 349K 3 0 1 36.0 324,000 303,000 93.5% 2,870 105.57 0.0%
Average Sold Price: Historical 350 - 399K 1 1 0 0.0 0 0 0 0.0%
400 - 499K 0 0 2 0.0 423,250 386,000 91.2% 4,295 89.87 50.0%
500 - 599K 0 0 0 0.0 0 0 0 0.0%
600 - 799K 0 0 0 0.0 0 0 0 0.0%
800 - 999K 0 0 0 0.0 0 0 0 0.0%
>1M 0 0 0 0.0 0 0 0 0.0%
Total 37 31 191 2.3 37.2%Average
Price196,094$ 201,435$ 158,915$ - 158,915 157,157 98.9% 1,884 83.40$
Report Criteria:Single Family (<2 acres), Condo, Townhouse
Minimum: 1bed, 1bath, $2000 asking price Age: <1 yr - 50+ years
Current as of Report Date
Existing Home Market Statistics
Average based on 12 Month Solds
$227,896
$202,140
$169,543$157,811
$141,394$152,646 $157,157
$-
$50,000
$100,000
$150,000
$200,000
$250,000
2007 2008 2009 2010 2011 2012 2013
9
19 19 1814
2117 17 17
12 14 15
925 23 27 27 34 30 30 27 20 22 24 24 31
42 41
33
4137
39 38 3738
46
41
48
43
0
5
10
15
20
25
30
35
40
Mar, 12 Apr, 12 May, 12 Jun, 12 Jul, 12 Aug, 12 Sep, 12 Oct, 12 Nov, 12 Dec, 12 Jan, 13 Feb, 13 Mar, 13
0
10
20
30
40
50
60Closed Sales Pending Sales Active Listings
The information provided is derived from the Intermountain MLS. it is deemed reliable but not guaranteed. Report Date: April 6, 2013

Area: 550, SW Boise Report Month: March, 2013
Market Trends
Active Pending Sold
Price in
$1000's12 Mths Inventory Ask Price Sold Price
Sold to Ask
Ratio
Average
Sq Ft
Price per
SqFt
%
Distressed
0 - 100K 10 2 45 2.7 82,333 82,785 100.5% 1,336 61.99 64.4%
100 -150K 12 14 159 0.9 129,744 129,556 99.9% 1,613 80.33 45.3%
150 - 199K 34 33 149 2.7 175,918 173,981 98.9% 2,067 84.17 28.2%
200 - 249K 21 11 69 3.7 224,532 220,841 98.4% 2,414 91.49 11.6%
250 - 299K 9 4 28 3.9 276,982 272,457 98.4% 2,858 95.34 17.9%
300 - 349K 4 5 7 6.9 314,229 302,357 96.2% 2,991 101.09 0.0%
Average Sold Price: Historical 350 - 399K 2 2 3 8.0 376,300 361,667 96.1% 3,990 90.64 33.3%
400 - 499K 1 0 2 6.0 427,450 408,000 95.4% 4,154 98.23 0.0%
500 - 599K 0 0 0 0.0 0 0 0 0.0%
600 - 799K 0 0 0 0.0 0 0 0 0.0%
800 - 999K 0 0 0 0.0 0 0 0 0.0%
>1M 0 0 0 0.0 0 0 0 0.0%
Total 93 71 462 2.4 34.0%Average
Price197,070$ 193,324$ 168,783$ - 168,783 166,953 98.9% 1,975 84.55$
Report Criteria:Single Family (<2 acres), Condo, Townhouse
Minimum: 1bed, 1bath, $2000 asking price Age: <1 yr - 50+ years
Current as of Report Date
Existing Home Market Statistics
Average based on 12 Month Solds
$223,476$207,194
$166,842$151,210
$136,680$159,277 $166,953
$-
$50,000
$100,000
$150,000
$200,000
$250,000
2007 2008 2009 2010 2011 2012 2013
45 4940
53
36 33
44 4434 37
31 29 32
70 73 72 65 72 75 64 50 51 39 44 56 71
121107
8893
8882 78
9397104
118115
103
0
10
20
30
40
50
60
70
80
Mar, 12 Apr, 12 May, 12 Jun, 12 Jul, 12 Aug, 12 Sep, 12 Oct, 12 Nov, 12 Dec, 12 Jan, 13 Feb, 13 Mar, 13
0
20
40
60
80
100
120
140Closed Sales Pending Sales Active Listings
The information provided is derived from the Intermountain MLS. it is deemed reliable but not guaranteed. Report Date: April 6, 2013

Area: 600, W Boise Report Month: March, 2013
Market Trends
Active Pending Sold
Price in
$1000's12 Mths Inventory Ask Price Sold Price
Sold to Ask
Ratio
Average
Sq Ft
Price per
SqFt
%
Distressed
0 - 100K 16 7 94 2.0 78,830 78,514 99.6% 1,200 65.40 50.0%
100 -150K 26 37 185 1.7 124,128 122,905 99.0% 1,526 80.55 31.9%
150 - 199K 18 10 68 3.2 170,084 167,195 98.3% 2,130 78.51 11.8%
200 - 249K 8 3 18 5.3 231,672 224,567 96.9% 2,499 89.87 22.2%
250 - 299K 4 1 10 4.8 268,450 261,445 97.4% 2,818 92.78 10.0%
300 - 349K 1 1 3 4.0 341,600 315,567 92.4% 3,126 100.94 0.0%
Average Sold Price: Historical 350 - 399K 1 0 2 6.0 379,450 370,000 97.5% 4,609 80.28 0.0%
400 - 499K 0 0 1 0.0 419,000 380,000 90.7% 3,389 112.13 0.0%
500 - 599K 1 0 0 0.0 0 0 0 0.0%
600 - 799K 2 0 0 0.0 0 0 0 0.0%
800 - 999K 0 0 0 0.0 0 0 0 0.0%
>1M 0 0 0 0.0 0 0 0 0.0%
Total 77 59 381 2.4 31.2%Average
Price172,444$ 138,942$ 133,850$ - 133,850 131,785 98.5% 1,667 79.06$
Report Criteria:Single Family (<2 acres), Condo, Townhouse
Minimum: 1bed, 1bath, $2000 asking price Age: <1 yr - 50+ years
Current as of Report Date
Existing Home Market Statistics
Average based on 12 Month Solds
$191,864
$167,917
$144,371$125,415
$110,750$125,762 $131,785
$-
$50,000
$100,000
$150,000
$200,000
$250,000
2007 2008 2009 2010 2011 2012 2013
2636
2634
47 43
27
39 37
2516
31
2056 47 55 71 62 61 54 44 35 34 48 44 59
8998
71
87
75
6166
7768 70
8880
76
0
10
20
30
40
50
60
70
80
Mar, 12 Apr, 12 May, 12 Jun, 12 Jul, 12 Aug, 12 Sep, 12 Oct, 12 Nov, 12 Dec, 12 Jan, 13 Feb, 13 Mar, 13
0
20
40
60
80
100
120Closed Sales Pending Sales Active Listings
The information provided is derived from the Intermountain MLS. it is deemed reliable but not guaranteed. Report Date: April 6, 2013

Area: 650, W Boise Report Month: March, 2013
Market Trends
Active Pending Sold
Price in
$1000's12 Mths Inventory Ask Price Sold Price
Sold to Ask
Ratio
Average
Sq Ft
Price per
SqFt
%
Distressed
0 - 100K 3 9 60 0.6 86,609 86,353 99.7% 1,252 68.95 66.7%
100 -150K 27 31 261 1.2 128,207 127,450 99.4% 1,536 82.99 34.9%
150 - 199K 31 20 142 2.6 173,269 171,352 98.9% 2,071 82.72 16.9%
200 - 249K 22 11 65 4.1 226,787 222,611 98.2% 2,533 87.88 20.0%
250 - 299K 25 3 42 7.1 272,092 266,246 97.9% 2,977 89.43 4.8%
300 - 349K 10 3 9 13.3 319,900 308,906 96.6% 3,447 89.61 0.0%
Average Sold Price: Historical 350 - 399K 2 0 6 4.0 371,117 366,967 98.9% 4,325 84.85 16.7%
400 - 499K 1 0 4 3.0 439,150 399,483 91.0% 4,864 82.14 25.0%
500 - 599K 1 0 2 6.0 557,450 547,000 98.1% 6,426 85.12 0.0%
600 - 799K 1 0 0 0.0 0 0 0 0.0%
800 - 999K 0 0 0 0.0 0 0 0 0.0%
>1M 0 0 0 0.0 0 0 0 0.0%
Total 123 77 591 2.5 29.1%Average
Price215,230$ 163,299$ 164,953$ - 164,953 162,779 98.7% 1,945 83.70$
Report Criteria:Single Family (<2 acres), Condo, Townhouse
Minimum: 1bed, 1bath, $2000 asking price Age: <1 yr - 50+ years
Current as of Report Date
Existing Home Market Statistics
Average based on 12 Month Solds
$216,775$204,732
$171,485$152,972
$133,246$155,677 $162,779
$-
$50,000
$100,000
$150,000
$200,000
$250,000
2007 2008 2009 2010 2011 2012 2013
51 49 44 49
6454
4455 59
46 4738 42
78 80 86 94 81 78 84 81 74 69 70 69 77
145 146
114120
9589
102
123
104113
141130126
0
10
20
30
40
50
60
70
80
90
100
Mar, 12 Apr, 12 May, 12 Jun, 12 Jul, 12 Aug, 12 Sep, 12 Oct, 12 Nov, 12 Dec, 12 Jan, 13 Feb, 13 Mar, 13
0
20
40
60
80
100
120
140
160Closed Sales Pending Sales Active Listings
The information provided is derived from the Intermountain MLS. it is deemed reliable but not guaranteed. Report Date: April 6, 2013

Area: 700, Garden City Report Month: March, 2013
Market Trends
Active Pending Sold
Price in
$1000's12 Mths Inventory Ask Price Sold Price
Sold to Ask
Ratio
Average
Sq Ft
Price per
SqFt
%
Distressed
0 - 100K 4 0 12 4.0 79,700 81,338 102.1% 1,318 61.73 50.0%
100 -150K 1 1 12 1.0 128,442 125,996 98.1% 1,369 92.02 33.3%
150 - 199K 3 2 5 7.2 157,340 150,942 95.9% 1,721 87.70 20.0%
200 - 249K 0 0 1 0.0 249,900 225,000 90.0% 2,100 107.14 0.0%
250 - 299K 1 0 0 0.0 0 0 0 0.0%
300 - 349K 1 0 1 12.0 349,900 335,000 95.7% 2,631 127.33 0.0%
Average Sold Price: Historical 350 - 399K 1 0 0 0.0 0 0 0 0.0%
400 - 499K 0 0 0 0.0 0 0 0 0.0%
500 - 599K 0 0 0 0.0 0 0 0 0.0%
600 - 799K 0 0 0 0.0 0 0 0 0.0%
800 - 999K 0 0 0 0.0 0 0 0 0.0%
>1M 0 0 0 0.0 0 0 0 0.0%
Total 11 3 31 4.3 35.5%Average
Price175,177$ 144,533$ 125,297$ - 125,297 122,668 97.9% 1,470 83.43$
Report Criteria:Single Family (<2 acres), Condo, Townhouse
Minimum: 1bed, 1bath, $2000 asking price Age: <1 yr - 50+ years
Current as of Report Date
Existing Home Market Statistics
Average based on 12 Month Solds
$167,112
$314,500
$175,318
$137,138$116,031 $116,939 $122,668
$-
$50,000
$100,000
$150,000
$200,000
$250,000
$300,000
$350,000
2007 2008 2009 2010 2011 2012 2013
21
34
3 3 32 2
5
0
32
4 7 8 6 6 5 1 1 3 2 3 6 3
1312
15
98
10
8
11
9
6
109
8
0
1
2
3
4
5
6
7
8
9
Mar, 12 Apr, 12 May, 12 Jun, 12 Jul, 12 Aug, 12 Sep, 12 Oct, 12 Nov, 12 Dec, 12 Jan, 13 Feb, 13 Mar, 13
0
2
4
6
8
10
12
14
16Closed Sales Pending Sales Active Listings
The information provided is derived from the Intermountain MLS. it is deemed reliable but not guaranteed. Report Date: April 6, 2013

Area: 800, NW Boise Report Month: March, 2013
Market Trends
Active Pending Sold
Price in
$1000's12 Mths Inventory Ask Price Sold Price
Sold to Ask
Ratio
Average
Sq Ft
Price per
SqFt
%
Distressed
0 - 100K 3 8 38 0.9 79,624 78,729 98.9% 1,029 76.53 60.5%
100 -150K 9 15 133 0.8 128,499 126,873 98.7% 1,354 93.68 32.3%
150 - 199K 19 13 96 2.4 173,327 171,361 98.9% 1,764 97.13 20.8%
200 - 249K 15 6 66 2.7 231,114 226,029 97.8% 2,146 105.32 12.1%
250 - 299K 10 7 38 3.2 277,108 272,606 98.4% 2,446 111.43 10.5%
300 - 349K 5 5 33 1.8 328,394 322,185 98.1% 2,658 121.21 9.1%
Average Sold Price: Historical 350 - 399K 3 9 14 2.6 379,536 368,619 97.1% 3,015 122.26 14.3%
400 - 499K 6 6 13 5.5 452,957 444,051 98.0% 3,221 137.87 23.1%
500 - 599K 3 1 5 7.2 564,525 533,608 94.5% 3,710 143.82 20.0%
600 - 799K 5 0 2 30.0 644,500 610,000 94.6% 3,712 164.35 0.0%
800 - 999K 2 0 1 24.0 990,000 925,000 93.4% 4,607 200.78 0.0%
>1M 0 0 0 0.0 0 0 0 0.0%
Total 80 70 439 2.2 24.4%Average
Price288,124$ 234,108$ 204,073$ - 204,073 200,157 98.1% 1,882 106.33$
Report Criteria:Single Family (<2 acres), Condo, Townhouse
Minimum: 1bed, 1bath, $2000 asking price Age: <1 yr - 50+ years
Current as of Report Date
Existing Home Market Statistics
Average based on 12 Month Solds
$251,033 $250,622
$206,817$184,047 $177,525
$193,904 $200,157
$-
$50,000
$100,000
$150,000
$200,000
$250,000
$300,000
2007 2008 2009 2010 2011 2012 2013
32
45 41 4336
61
2331
41
2718
29
43
59 60 54 62 59 40 44 50 32 34 53 55 70
106112
8592 90
80 83 80
113121
103104108
0
10
20
30
40
50
60
70
80
Mar, 12 Apr, 12 May, 12 Jun, 12 Jul, 12 Aug, 12 Sep, 12 Oct, 12 Nov, 12 Dec, 12 Jan, 13 Feb, 13 Mar, 13
0
20
40
60
80
100
120
140Closed Sales Pending Sales Active Listings
The information provided is derived from the Intermountain MLS. it is deemed reliable but not guaranteed. Report Date: April 6, 2013

Area: 900, Eagle Report Month: March, 2013
Market Trends
Active Pending Sold
Price in
$1000's12 Mths Inventory Ask Price Sold Price
Sold to Ask
Ratio
Average
Sq Ft
Price per
SqFt
%
Distressed
0 - 100K 1 1 14 0.9 66,500 69,071 103.9% 1,051 65.71 64.3%
100 -150K 3 2 43 0.8 134,858 133,649 99.1% 1,600 83.54 37.2%
150 - 199K 11 8 81 1.6 175,412 172,865 98.5% 1,884 91.75 30.9%
200 - 249K 11 4 58 2.3 231,017 228,296 98.8% 2,351 97.12 13.8%
250 - 299K 16 9 48 4.0 282,444 276,765 98.0% 2,758 100.34 16.7%
300 - 349K 14 4 36 4.7 330,267 323,204 97.9% 3,099 104.28 13.9%
Average Sold Price: Historical 350 - 399K 18 5 40 5.4 374,997 367,465 98.0% 3,257 112.82 17.5%
400 - 499K 33 6 47 8.4 456,252 446,364 97.8% 3,849 115.95 12.8%
500 - 599K 14 5 32 5.3 555,873 541,315 97.4% 4,282 126.43 12.5%
600 - 799K 14 6 16 10.5 702,863 679,607 96.7% 5,218 130.25 0.0%
800 - 999K 7 0 2 42.0 919,500 902,000 98.1% 6,043 149.26 0.0%
>1M 5 0 3 20.0 1,581,667 1,400,000 88.5% 7,198 194.49 0.0%
Total 147 50 420 4.2 21.0%Average
Price454,288$ 357,042$ 312,332$ - 312,332 305,250 97.7% 2,807 108.75$
Report Criteria:Single Family (<2 acres), Condo, Townhouse
Minimum: 1bed, 1bath, $2000 asking price Age: <1 yr - 50+ years
Current as of Report Date
Existing Home Market Statistics
Average based on 12 Month Solds
$366,191
$326,930 $324,768
$274,449 $274,571$294,608 $305,250
$-
$50,000
$100,000
$150,000
$200,000
$250,000
$300,000
$350,000
$400,000
2007 2008 2009 2010 2011 2012 2013
27
4336
4134
5141
3528 24 28 24
35
59 54 62 53 74 70 56 40 48 42 44 49 50
139146
131123
100 101
124
147143155
163175172
0
10
20
30
40
50
60
70
80
Mar, 12 Apr, 12 May, 12 Jun, 12 Jul, 12 Aug, 12 Sep, 12 Oct, 12 Nov, 12 Dec, 12 Jan, 13 Feb, 13 Mar, 13
0
20
40
60
80
100
120
140
160
180
200Closed Sales Pending Sales Active Listings
The information provided is derived from the Intermountain MLS. it is deemed reliable but not guaranteed. Report Date: April 6, 2013

Area: 950, Star Report Month: March, 2013
Market Trends
Active Pending Sold
Price in
$1000's12 Mths Inventory Ask Price Sold Price
Sold to Ask
Ratio
Average
Sq Ft
Price per
SqFt
%
Distressed
0 - 100K 0 0 17 0.0 83,100 83,637 100.6% 1,196 69.90 52.9%
100 -150K 5 7 44 1.4 125,577 124,646 99.3% 1,614 77.22 54.5%
150 - 199K 13 5 40 3.9 182,171 179,345 98.4% 2,416 74.23 47.5%
200 - 249K 11 5 13 10.2 217,554 216,477 99.5% 2,508 86.32 30.8%
250 - 299K 5 0 7 8.6 278,643 270,914 97.2% 3,032 89.36 14.3%
300 - 349K 1 2 7 1.7 332,536 327,379 98.4% 3,552 92.17 42.9%
Average Sold Price: Historical 350 - 399K 10 1 3 40.0 378,267 387,333 102.4% 4,722 82.02 33.3%
400 - 499K 3 2 3 12.0 431,633 431,967 100.1% 4,631 93.28 0.0%
500 - 599K 2 0 3 8.0 577,967 577,967 100.0% 4,748 121.74 0.0%
600 - 799K 2 1 1 24.0 699,450 645,000 92.2% 6,903 93.44 0.0%
800 - 999K 0 0 0 0.0 0 0 0 0.0%
>1M 0 0 0 0.0 0 0 0 0.0%
Total 52 23 138 4.5 44.2%Average
Price285,680$ 252,622$ 189,815$ - 189,815 187,820 98.9% 2,289 82.05$
Report Criteria:Single Family (<2 acres), Condo, Townhouse
Minimum: 1bed, 1bath, $2000 asking price Age: <1 yr - 50+ years
Current as of Report Date
Existing Home Market Statistics
Average based on 12 Month Solds
$237,020 $245,587
$194,119
$166,136 $162,471$180,601 $187,820
$-
$50,000
$100,000
$150,000
$200,000
$250,000
$300,000
2007 2008 2009 2010 2011 2012 2013
11
17
1215
107
1512
17
7
118 8
21 21 22 16 20 22 20 19 11 15 12 16 23
4143
35
41
31
37
45
52
39
3235
3738
0
5
10
15
20
25
Mar, 12 Apr, 12 May, 12 Jun, 12 Jul, 12 Aug, 12 Sep, 12 Oct, 12 Nov, 12 Dec, 12 Jan, 13 Feb, 13 Mar, 13
0
10
20
30
40
50
60Closed Sales Pending Sales Active Listings
The information provided is derived from the Intermountain MLS. it is deemed reliable but not guaranteed. Report Date: April 6, 2013

Area: 1000, SE Meridian Report Month: March, 2013
Market Trends
Active Pending Sold
Price in
$1000's12 Mths Inventory Ask Price Sold Price
Sold to Ask
Ratio
Average
Sq Ft
Price per
SqFt
%
Distressed
0 - 100K 0 0 2 0.0 82,400 82,950 100.7% 1,092 75.96 0.0%
100 -150K 1 8 26 0.5 137,408 137,646 100.2% 1,599 86.11 50.0%
150 - 199K 8 8 50 1.9 176,051 174,970 99.4% 1,960 89.25 30.0%
200 - 249K 7 4 41 2.0 226,156 222,767 98.5% 2,351 94.74 17.1%
250 - 299K 10 2 22 5.5 279,336 275,670 98.7% 2,713 101.59 4.5%
300 - 349K 8 1 20 4.8 321,725 317,438 98.7% 3,127 101.53 15.0%
Average Sold Price: Historical 350 - 399K 2 2 3 8.0 384,930 373,967 97.2% 3,513 106.46 0.0%
400 - 499K 1 0 1 12.0 450,000 450,000 100.0% 4,130 108.96 0.0%
500 - 599K 1 0 0 0.0 0 0 0 0.0%
600 - 799K 0 0 0 0.0 0 0 0 0.0%
800 - 999K 0 0 0 0.0 0 0 0 0.0%
>1M 0 0 0 0.0 0 0 0 0.0%
Total 38 25 165 2.8 23.6%Average
Price272,348$ 198,464$ 218,164$ - 218,164 215,830 98.9% 2,273 94.95$
Report Criteria:Single Family (<2 acres), Condo, Townhouse
Minimum: 1bed, 1bath, $2000 asking price Age: <1 yr - 50+ years
Current as of Report Date
Existing Home Market Statistics
Average based on 12 Month Solds
$279,192 $269,133
$215,905$191,140 $186,809
$211,943 $215,830
$-
$50,000
$100,000
$150,000
$200,000
$250,000
$300,000
2007 2008 2009 2010 2011 2012 2013
18
69
18
23
17 1612
16
810
1614
12 15 23 20 26 25 22 23 21 22 28 26 25
42
47
3538
42
34
4038
33
49
36
4750
0
5
10
15
20
25
30
Mar, 12 Apr, 12 May, 12 Jun, 12 Jul, 12 Aug, 12 Sep, 12 Oct, 12 Nov, 12 Dec, 12 Jan, 13 Feb, 13 Mar, 13
0
10
20
30
40
50
60Closed Sales Pending Sales Active Listings
The information provided is derived from the Intermountain MLS. it is deemed reliable but not guaranteed. Report Date: April 6, 2013

Area: 1010, SW Meridian Report Month: March, 2013
Market Trends
Active Pending Sold
Price in
$1000's12 Mths Inventory Ask Price Sold Price
Sold to Ask
Ratio
Average
Sq Ft
Price per
SqFt
%
Distressed
0 - 100K 0 1 5 0.0 88,960 97,200 109.3% 1,183 82.15 40.0%
100 -150K 4 1 14 3.4 132,479 130,329 98.4% 1,532 85.07 21.4%
150 - 199K 4 3 5 9.6 164,560 163,360 99.3% 1,765 92.58 80.0%
200 - 249K 0 0 16 0.0 224,519 219,688 97.8% 2,341 93.84 6.3%
250 - 299K 5 3 15 4.0 281,840 272,820 96.8% 2,998 91.00 33.3%
300 - 349K 3 2 6 6.0 328,517 323,750 98.5% 3,114 103.95 0.0%
Average Sold Price: Historical 350 - 399K 2 0 7 3.4 380,086 374,429 98.5% 3,578 104.66 14.3%
400 - 499K 0 0 1 0.0 449,000 430,000 95.8% 4,722 91.06 0.0%
500 - 599K 0 1 0 0.0 0 0 0 0.0%
600 - 799K 0 0 0 0.0 0 0 0 0.0%
800 - 999K 0 0 0 0.0 0 0 0 0.0%
>1M 0 0 0 0.0 0 0 0 0.0%
Total 18 11 69 3.1 23.2%Average
Price247,061$ 254,114$ 232,216$ - 232,216 227,945 98.2% 2,421 94.15$
Report Criteria:Single Family (<2 acres), Condo, Townhouse
Minimum: 1bed, 1bath, $2000 asking price Age: <1 yr - 50+ years
Current as of Report Date
Existing Home Market Statistics
Average based on 12 Month Solds
$261,105$284,680
$240,416$213,761
$243,226$227,691 $227,945
$-
$50,000
$100,000
$150,000
$200,000
$250,000
$300,000
2007 2008 2009 2010 2011 2012 2013
54
7
10
78
10
7 7
41 0
410 12 12 15 12 14 10 9 6 3 6 6 11
21
18
12
15
1211
16
1819
23
19
2121
0
2
4
6
8
10
12
14
16
Mar, 12 Apr, 12 May, 12 Jun, 12 Jul, 12 Aug, 12 Sep, 12 Oct, 12 Nov, 12 Dec, 12 Jan, 13 Feb, 13 Mar, 13
0
5
10
15
20
25Closed Sales Pending Sales Active Listings
The information provided is derived from the Intermountain MLS. it is deemed reliable but not guaranteed. Report Date: April 6, 2013

Area: 1020, NE Meridian Report Month: March, 2013
Market Trends
Active Pending Sold
Price in
$1000's12 Mths Inventory Ask Price Sold Price
Sold to Ask
Ratio
Average
Sq Ft
Price per
SqFt
%
Distressed
0 - 100K 5 5 19 3.2 83,153 86,199 103.7% 1,228 70.21 78.9%
100 -150K 20 19 163 1.5 128,738 128,405 99.7% 1,481 86.68 43.6%
150 - 199K 16 22 98 2.0 174,199 172,065 98.8% 1,998 86.10 24.5%
200 - 249K 20 10 66 3.6 225,750 223,301 98.9% 2,529 88.30 33.3%
250 - 299K 13 8 48 3.3 275,783 272,805 98.9% 2,822 96.67 10.4%
300 - 349K 8 1 12 8.0 328,500 323,483 98.5% 3,404 95.02 8.3%
Average Sold Price: Historical 350 - 399K 1 0 5 2.4 380,745 368,200 96.7% 3,914 94.07 0.0%
400 - 499K 0 0 1 0.0 409,900 398,000 97.1% 3,970 100.25 0.0%
500 - 599K 0 0 0 0.0 0 0 0 0.0%
600 - 799K 0 0 0 0.0 0 0 0 0.0%
800 - 999K 0 0 0 0.0 0 0 0 0.0%
>1M 0 0 0 0.0 0 0 0 0.0%
Total 83 65 412 2.4 33.5%Average
Price204,707$ 177,681$ 179,681$ - 179,681 178,115 99.1% 2,008 88.69$
Report Criteria:Single Family (<2 acres), Condo, Townhouse
Minimum: 1bed, 1bath, $2000 asking price Age: <1 yr - 50+ years
Current as of Report Date
Existing Home Market Statistics
Average based on 12 Month Solds
$237,134$211,861
$178,568$161,705 $154,444
$171,443 $178,115
$-
$50,000
$100,000
$150,000
$200,000
$250,000
2007 2008 2009 2010 2011 2012 2013
4843 44 42
21
56
36 32 32 35
15
27 29
59 62 69 63 72 55 45 55 42 30 45 43 65
83
91
61
6965 68
82 83
92 94899293
0
10
20
30
40
50
60
70
80
Mar, 12 Apr, 12 May, 12 Jun, 12 Jul, 12 Aug, 12 Sep, 12 Oct, 12 Nov, 12 Dec, 12 Jan, 13 Feb, 13 Mar, 13
0
10
20
30
40
50
60
70
80
90
100Closed Sales Pending Sales Active Listings
The information provided is derived from the Intermountain MLS. it is deemed reliable but not guaranteed. Report Date: April 6, 2013

Area: 1030, NW Meridian Report Month: March, 2013
Market Trends
Active Pending Sold
Price in
$1000's12 Mths Inventory Ask Price Sold Price
Sold to Ask
Ratio
Average
Sq Ft
Price per
SqFt
%
Distressed
0 - 100K 3 4 71 0.5 80,668 81,760 101.4% 1,252 65.32 63.4%
100 -150K 33 40 308 1.3 128,497 127,819 99.5% 1,524 83.86 40.6%
150 - 199K 38 44 179 2.5 174,716 172,318 98.6% 2,046 84.23 30.2%
200 - 249K 34 12 105 3.9 228,062 224,614 98.5% 2,509 89.52 20.0%
250 - 299K 26 12 52 6.0 271,133 266,508 98.3% 2,861 93.15 13.5%
300 - 349K 9 3 15 7.2 332,186 324,600 97.7% 3,111 104.34 20.0%
Average Sold Price: Historical 350 - 399K 4 1 4 12.0 373,450 370,675 99.3% 3,644 101.72 25.0%
400 - 499K 0 0 0 0.0 0 0 0 0.0%
500 - 599K 0 0 1 0.0 519,997 510,000 98.1% 5,083 100.33 0.0%
600 - 799K 0 0 0 0.0 0 0 0 0.0%
800 - 999K 0 0 0 0.0 0 0 0 0.0%
>1M 0 0 0 0.0 0 0 0 0.0%
Total 147 116 735 2.4 34.8%Average
Price207,337$ 176,040$ 165,470$ - 165,470 163,704 98.9% 1,909 85.76$
Report Criteria:Single Family (<2 acres), Condo, Townhouse
Minimum: 1bed, 1bath, $2000 asking price Age: <1 yr - 50+ years
Current as of Report Date
Existing Home Market Statistics
Average based on 12 Month Solds
$225,216$203,188
$173,426$158,607
$145,398$160,519 $163,704
$-
$50,000
$100,000
$150,000
$200,000
$250,000
2007 2008 2009 2010 2011 2012 2013
6174 74 72 79 75
4957 63
44 42 4759
114 116 109 117 100 95 99 84 70 73 80 88 116
156 156
126
145
129 124 124
147140
134
161
141142
0
20
40
60
80
100
120
140
Mar, 12 Apr, 12 May, 12 Jun, 12 Jul, 12 Aug, 12 Sep, 12 Oct, 12 Nov, 12 Dec, 12 Jan, 13 Feb, 13 Mar, 13
0
20
40
60
80
100
120
140
160
180Closed Sales Pending Sales Active Listings
The information provided is derived from the Intermountain MLS. it is deemed reliable but not guaranteed. Report Date: April 6, 2013
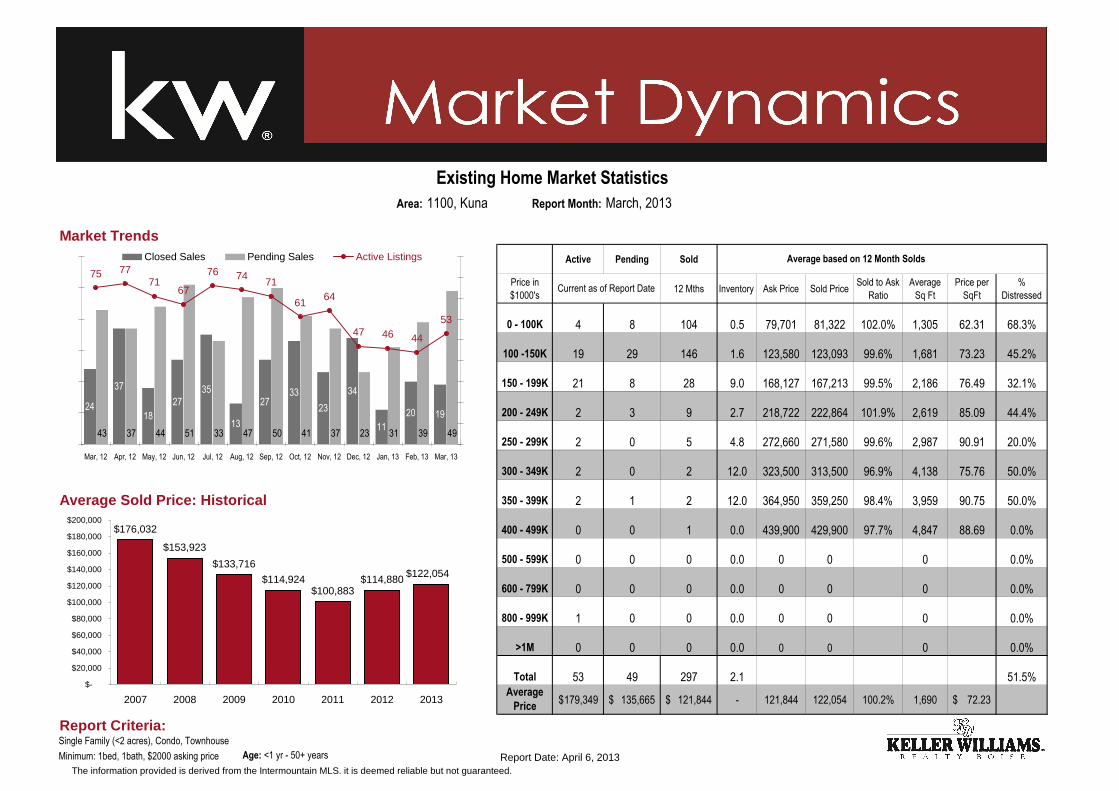
Area: 1100, Kuna Report Month: March, 2013
Market Trends
Active Pending Sold
Price in
$1000's12 Mths Inventory Ask Price Sold Price
Sold to Ask
Ratio
Average
Sq Ft
Price per
SqFt
%
Distressed
0 - 100K 4 8 104 0.5 79,701 81,322 102.0% 1,305 62.31 68.3%
100 -150K 19 29 146 1.6 123,580 123,093 99.6% 1,681 73.23 45.2%
150 - 199K 21 8 28 9.0 168,127 167,213 99.5% 2,186 76.49 32.1%
200 - 249K 2 3 9 2.7 218,722 222,864 101.9% 2,619 85.09 44.4%
250 - 299K 2 0 5 4.8 272,660 271,580 99.6% 2,987 90.91 20.0%
300 - 349K 2 0 2 12.0 323,500 313,500 96.9% 4,138 75.76 50.0%
Average Sold Price: Historical 350 - 399K 2 1 2 12.0 364,950 359,250 98.4% 3,959 90.75 50.0%
400 - 499K 0 0 1 0.0 439,900 429,900 97.7% 4,847 88.69 0.0%
500 - 599K 0 0 0 0.0 0 0 0 0.0%
600 - 799K 0 0 0 0.0 0 0 0 0.0%
800 - 999K 1 0 0 0.0 0 0 0 0.0%
>1M 0 0 0 0.0 0 0 0 0.0%
Total 53 49 297 2.1 51.5%Average
Price179,349$ 135,665$ 121,844$ - 121,844 122,054 100.2% 1,690 72.23$
Report Criteria:Single Family (<2 acres), Condo, Townhouse
Minimum: 1bed, 1bath, $2000 asking price Age: <1 yr - 50+ years
Current as of Report Date
Existing Home Market Statistics
Average based on 12 Month Solds
$176,032
$153,923
$133,716
$114,924$100,883
$114,880 $122,054
$-
$20,000
$40,000
$60,000
$80,000
$100,000
$120,000
$140,000
$160,000
$180,000
$200,000
2007 2008 2009 2010 2011 2012 2013
24
37
18
2735
13
2733
23
34
11
20 19
43 37 44 51 33 47 50 41 37 23 31 39 49
7471
6164
47 46 44
53
75 77 76
6771
0
10
20
30
40
50
60
Mar, 12 Apr, 12 May, 12 Jun, 12 Jul, 12 Aug, 12 Sep, 12 Oct, 12 Nov, 12 Dec, 12 Jan, 13 Feb, 13 Mar, 13
0
10
20
30
40
50
60
70
80
90Closed Sales Pending Sales Active Listings
The information provided is derived from the Intermountain MLS. it is deemed reliable but not guaranteed. Report Date: April 6, 2013

Area: Ada County Report Month: March, 2013
Market Trends
Active Pending Sold
Price in
$1000's12 Mths Inventory Ask Price Sold Price
Sold to Ask
Ratio
Average
Sq Ft
Price per
SqFt
%
Distressed
0 - 100K 0 0 0 0.0 0 0 0 0.0%
100 -150K 60 37 197 3.7 136,852 138,126 100.9% 1,489 92.77 0.5%
150 - 199K 177 81 427 5.0 177,208 177,495 100.2% 1,811 98.01 0.2%
200 - 249K 124 59 283 5.3 224,590 224,921 100.1% 2,044 110.03 0.0%
250 - 299K 85 67 250 4.1 275,844 276,830 100.4% 2,380 116.32 0.0%
300 - 349K 63 67 205 3.7 322,911 324,415 100.5% 2,668 121.60 0.0%
Average Sold Price: Historical 350 - 399K 40 49 110 4.4 371,169 372,760 100.4% 3,007 123.98 0.0%
400 - 499K 30 35 65 5.5 453,628 453,304 99.9% 3,076 147.38 0.0%
500 - 599K 16 9 26 7.4 549,249 546,783 99.6% 3,323 164.57 0.0%
600 - 799K 15 5 16 11.3 695,738 656,571 94.4% 3,381 194.20 0.0%
800 - 999K 4 1 1 48.0 829,000 855,710 103.2% 2,243 381.50 0.0%
>1M 3 0 2 18.0 1,779,500 1,459,625 82.0% 4,684 311.65 0.0%
Total 617 410 1582 4.7 0.1%Average
Price271,313$ 281,979$ 253,116$ - 253,116 253,236 100.0% 2,195 115.38$
Report Criteria:Single Family (<2 acres), Condo, Townhouse
Minimum: 1bed, 1bath, $2000 asking price Age: New, Under Const, To Be Built
Current as of Report Date
New Construction Market Statistics
Average based on 12 Month Solds
$272,005$249,377
$205,864$185,448
$233,056$246,912 $253,236
$-
$50,000
$100,000
$150,000
$200,000
$250,000
$300,000
2007 2008 2009 2010 2011 2012 2013
92 125 134 127 152 159 165 127 123 92 106 145
378345 323
270 258
133
393
293337 376
236
410
338296
633
649
591598
621
595605
617
565570
625
581
569
0
50
100
150
200
250
300
350
400
450
Mar, 12 Apr, 12 May, 12 Jun, 12 Jul, 12 Aug, 12 Sep, 12 Oct, 12 Nov, 12 Dec, 12 Jan, 13 Feb, 13 Mar, 13
520
540
560
580
600
620
640
660Closed Sales Pending Sales Active Listings
The information provided is derived from the Intermountain MLS. It is deemed reliable but not guaranteed.
Report Date: April 6, 2013

Area: 100, N Boise Report Month: March, 2013
Market Trends
Active Pending Sold
Price in
$1000's12 Mths Inventory Ask Price Sold Price
Sold to Ask
Ratio
Average
Sq Ft
Price per
SqFt
%
Distressed
0 - 100K 0 0 0 0.0 0 0 0 0.0%
100 -150K 0 0 0 0.0 0 0 0 0.0%
150 - 199K 0 0 6 0.0 187,467 180,483 96.3% 812 222.36 0.0%
200 - 249K 3 1 10 3.6 221,250 198,675 89.8% 1,035 191.90 0.0%
250 - 299K 6 2 4 18.0 282,850 278,375 98.4% 1,257 221.46 0.0%
300 - 349K 2 0 3 8.0 316,133 305,500 96.6% 2,034 150.22 0.0%
Average Sold Price: Historical 350 - 399K 2 0 2 12.0 374,500 369,355 98.6% 1,297 284.89 0.0%
400 - 499K 5 0 2 30.0 464,000 368,000 79.3% 1,122 327.99 0.0%
500 - 599K 2 2 4 6.0 552,567 555,662 100.6% 3,040 182.80 0.0%
600 - 799K 4 2 2 24.0 754,900 585,000 77.5% 1,694 345.34 0.0%
800 - 999K 0 0 0 0.0 0 0 0 0.0%
>1M 2 0 1 0.0 1,359,000 1,019,250 75.0% 2,340 435.58 0.0%
Total 26 7 34 9.2 0.0%Average
Price533,881$ 443,493$ 356,715$ - 356,715 321,988 90.3% 1,452 221.81$
Report Criteria:Single Family (<2 acres), Condo, Townhouse
Minimum: 1bed, 1bath, $2000 asking price Age: New, Under Const, To Be Built
Current as of Report Date
New Construction Market Statistics
Average based on 12 Month Solds
$335,908 $343,098
$279,914$260,739
$244,718
$317,408 $321,988
$-
$50,000
$100,000
$150,000
$200,000
$250,000
$300,000
$350,000
$400,000
2007 2008 2009 2010 2011 2012 2013
0 5 5 2 7 2 3 2 3 2 0 1
8
3 3
7
34
23
4
32
7
32
2827
2523 23 23
2826
2425
21
2425
0
1
2
3
4
5
6
7
8
9
Mar, 12 Apr, 12 May, 12 Jun, 12 Jul, 12 Aug, 12 Sep, 12 Oct, 12 Nov, 12 Dec, 12 Jan, 13 Feb, 13 Mar, 13
0
5
10
15
20
25
30Closed Sales Pending Sales Active Listings
The information provided is derived from the Intermountain MLS. It is deemed reliable but not guaranteed.
Report Date: April 6, 2013

Area: 200, NE Boise Report Month: March, 2013
Market Trends
Active Pending Sold
Price in
$1000's12 Mths Inventory Ask Price Sold Price
Sold to Ask
Ratio
Average
Sq Ft
Price per
SqFt
%
Distressed
0 - 100K 0 0 0 0.0 0 0 0 0.0%
100 -150K 0 0 0 0.0 0 0 0 0.0%
150 - 199K 0 0 0 0.0 0 0 0 0.0%
200 - 249K 0 0 0 0.0 0 0 0 0.0%
250 - 299K 0 0 20 0.0 283,653 284,835 100.4% 1,988 143.29 0.0%
300 - 349K 3 8 36 1.0 318,859 319,398 100.2% 2,323 137.48 0.0%
Average Sold Price: Historical 350 - 399K 3 15 18 2.0 374,141 374,098 100.0% 2,581 144.94 0.0%
400 - 499K 2 11 24 1.0 451,813 459,268 101.6% 3,078 149.22 0.0%
500 - 599K 1 2 2 6.0 530,450 530,450 100.0% 3,668 144.62 0.0%
600 - 799K 3 1 1 36.0 629,000 629,000 100.0% 3,511 179.15 0.0%
800 - 999K 0 0 0 0.0 0 0 0 0.0%
>1M 0 0 0 0.0 0 0 0 0.0%
Total 12 37 101 1.4 0.0%Average
Price476,654$ 398,506$ 359,734$ - 359,734 362,062 100.6% 2,514 144.02$
Report Criteria:Single Family (<2 acres), Condo, Townhouse
Minimum: 1bed, 1bath, $2000 asking price Age: New, Under Const, To Be Built
Current as of Report Date
New Construction Market Statistics
Average based on 12 Month Solds
$405,303
$349,954
$303,706$321,864
$355,051 $354,630 $362,062
$-
$50,000
$100,000
$150,000
$200,000
$250,000
$300,000
$350,000
$400,000
$450,000
2007 2008 2009 2010 2011 2012 2013
5 7 7 13 9 8 10 13 5 5 3 10
26 2832
24 2320
25 26
18
11
19
37
2924
23
18 18
23
15 1618
12
25
33
18
22
28
0
5
10
15
20
25
30
35
40
Mar, 12 Apr, 12 May, 12 Jun, 12 Jul, 12 Aug, 12 Sep, 12 Oct, 12 Nov, 12 Dec, 12 Jan, 13 Feb, 13 Mar, 13
0
5
10
15
20
25
30
35Closed Sales Pending Sales Active Listings
The information provided is derived from the Intermountain MLS. It is deemed reliable but not guaranteed.
Report Date: April 6, 2013

Area: 300, SE Boise Report Month: March, 2013
Market Trends
Active Pending Sold
Price in
$1000's12 Mths Inventory Ask Price Sold Price
Sold to Ask
Ratio
Average
Sq Ft
Price per
SqFt
%
Distressed
0 - 100K 0 0 0 0.0 0 0 0 0.0%
100 -150K 0 0 0 0.0 0 0 0 0.0%
150 - 199K 5 1 36 1.7 181,212 180,938 99.8% 1,525 118.67 0.0%
200 - 249K 16 6 26 7.4 228,103 228,757 100.3% 1,845 123.96 0.0%
250 - 299K 6 4 13 5.5 264,357 264,202 99.9% 2,143 123.30 0.0%
300 - 349K 1 0 2 6.0 334,196 333,735 99.9% 2,483 134.41 0.0%
Average Sold Price: Historical 350 - 399K 2 1 6 4.0 366,538 371,794 101.4% 3,015 123.31 0.0%
400 - 499K 0 0 2 0.0 439,900 442,500 100.6% 2,860 154.72 0.0%
500 - 599K 1 0 0 0.0 0 0 0 0.0%
600 - 799K 1 0 0 0.0 0 0 0 0.0%
800 - 999K 0 0 0 0.0 0 0 0 0.0%
>1M 0 0 0 0.0 0 0 0 0.0%
Total 32 12 85 4.5 0.0%Average
Price261,327$ 249,727$ 231,040$ - 231,040 231,521 100.2% 1,877 123.38$
Report Criteria:Single Family (<2 acres), Condo, Townhouse
Minimum: 1bed, 1bath, $2000 asking price Age: New, Under Const, To Be Built
Current as of Report Date
New Construction Market Statistics
Average based on 12 Month Solds
$265,219$238,731
$217,317$192,233
$224,193 $223,932 $231,521
$-
$50,000
$100,000
$150,000
$200,000
$250,000
$300,000
2007 2008 2009 2010 2011 2012 2013
6 6 11 7 8 16 7 5 5 2 3 9
1822
27 2825
12
79 9
6
912
1713
25 25
19
26 26
30 31 32
27
24 2423
26
0
5
10
15
20
25
30
Mar, 12 Apr, 12 May, 12 Jun, 12 Jul, 12 Aug, 12 Sep, 12 Oct, 12 Nov, 12 Dec, 12 Jan, 13 Feb, 13 Mar, 13
0
5
10
15
20
25
30
35Closed Sales Pending Sales Active Listings
The information provided is derived from the Intermountain MLS. It is deemed reliable but not guaranteed.
Report Date: April 6, 2013

Area: 400, Bench Report Month: March, 2013
Market Trends
Active Pending Sold
Price in
$1000's12 Mths Inventory Ask Price Sold Price
Sold to Ask
Ratio
Average
Sq Ft
Price per
SqFt
%
Distressed
0 - 100K 0 0 0 0.0 0 0 0 0.0%
100 -150K 0 0 0 0.0 0 0 0 0.0%
150 - 199K 0 0 8 0.0 192,562 192,730 100.1% 1,662 115.94 12.5%
200 - 249K 8 1 8 12.0 226,000 227,290 100.6% 1,586 143.36 0.0%
250 - 299K 1 0 4 3.0 267,750 275,003 102.7% 1,092 251.83 0.0%
300 - 349K 0 0 0 0.0 0 0 0 0.0%
Average Sold Price: Historical 350 - 399K 0 0 0 0.0 0 0 0 0.0%
400 - 499K 1 2 2 6.0 499,000 499,000 100.0% 1,891 263.95 0.0%
500 - 599K 0 0 1 0.0 580,000 580,000 100.0% 1,990 291.46 0.0%
600 - 799K 1 0 2 6.0 602,500 602,500 100.0% 1,990 302.76 0.0%
800 - 999K 1 0 1 0.0 829,000 855,710 103.2% 2,243 381.50 0.0%
>1M 0 0 1 0.0 2,200,000 1,900,000 86.4% 7,027 270.39 0.0%
Total 12 3 27 5.3 3.7%Average
Price334,608$ 371,300$ 378,944$ - 378,944 370,329 97.7% 1,829 202.52$
Report Criteria:Single Family (<2 acres), Condo, Townhouse
Minimum: 1bed, 1bath, $2000 asking price Age: New, Under Const, To Be Built
Current as of Report Date
New Construction Market Statistics
Average based on 12 Month Solds
$183,018 $177,022$144,910
$117,178
$206,893
$373,399 $370,329
$-
$50,000
$100,000
$150,000
$200,000
$250,000
$300,000
$350,000
$400,000
2007 2008 2009 2010 2011 2012 2013
1 2 2 0 5 2 3 4 2 3 0 3
5
89
11 11
8
1110
8
1
7
34
5
7
56
7
10 10
8
12
6
4
8
66
0
2
4
6
8
10
12
Mar, 12 Apr, 12 May, 12 Jun, 12 Jul, 12 Aug, 12 Sep, 12 Oct, 12 Nov, 12 Dec, 12 Jan, 13 Feb, 13 Mar, 13
0
2
4
6
8
10
12
14Closed Sales Pending Sales Active Listings
The information provided is derived from the Intermountain MLS. It is deemed reliable but not guaranteed.
Report Date: April 6, 2013

Area: 500, S Boise Report Month: March, 2013
Market Trends
Active Pending Sold
Price in
$1000's12 Mths Inventory Ask Price Sold Price
Sold to Ask
Ratio
Average
Sq Ft
Price per
SqFt
%
Distressed
0 - 100K 0 0 0.0 0 0 0 0.0%
100 -150K 0 0 0.0 0 0 0 0.0%
150 - 199K 3 5 7.2 166,390 167,202 100.5% 1,700 98.33 0.0%
200 - 249K 3 2 18.0 219,000 219,000 100.0% 2,098 104.39 0.0%
250 - 299K 1 7 1.7 270,571 271,984 100.5% 2,606 104.38 0.0%
300 - 349K 0 0 0.0 0 0 0 0.0%
Average Sold Price: Historical 350 - 399K 0 0 0.0 0 0 0 0.0%
400 - 499K 0 0 0.0 0 0 0 0.0%
500 - 599K 0 0 0.0 0 0 0 0.0%
600 - 799K 0 0 0.0 0 0 0 0.0%
800 - 999K 0 0 0.0 0 0 0 0.0%
>1M 0 0 0.0 0 0 0 0.0%
Total 7 14 6.0 0.0%Average
Price199,634$ 225,996$ - 225,996 226,993 100.4% 2,210 102.72$
Report Criteria:Single Family (<2 acres), Condo, Townhouse
Minimum: 1bed, 1bath, $2000 asking price Age: New, Under Const, To Be Built
Current as of Report Date
New Construction Market Statistics
Average based on 12 Month Solds
$232,558
$203,192
$171,400$160,484
$218,727 $218,993 $226,993
$-
$50,000
$100,000
$150,000
$200,000
$250,000
2007 2008 2009 2010 2011 2012 2013
0 1 3 4 0 0 1 2 0 1 3 01
5
4
1 0 0 1 1 10 1 00
3
11
10
9
4
6 6
7 77
3
11
10
2
0
1
2
3
4
5
6
Mar, 12 Apr, 12 May, 12 Jun, 12 Jul, 12 Aug, 12 Sep, 12 Oct, 12 Nov, 12 Dec, 12 Jan, 13 Feb, 13 Mar, 13
0
2
4
6
8
10
12Closed Sales Pending Sales Active Listings
The information provided is derived from the Intermountain MLS. It is deemed reliable but not guaranteed.
Report Date: April 6, 2013

Area: 550, SW Boise Report Month: March, 2013
Market Trends
Active Pending Sold
Price in
$1000's12 Mths Inventory Ask Price Sold Price
Sold to Ask
Ratio
Average
Sq Ft
Price per
SqFt
%
Distressed
0 - 100K 0 0 0 0.0 0 0 0 0.0%
100 -150K 17 1 52 3.9 133,386 134,017 100.5% 1,468 91.32 0.0%
150 - 199K 48 17 71 8.1 176,072 176,464 100.2% 1,916 92.10 0.0%
200 - 249K 21 12 52 4.8 223,200 224,236 100.5% 2,171 103.28 0.0%
250 - 299K 8 11 22 4.4 271,985 277,000 101.8% 2,364 117.16 0.0%
300 - 349K 1 1 4 3.0 317,175 315,625 99.5% 2,380 132.63 0.0%
Average Sold Price: Historical 350 - 399K 0 0 1 0.0 384,900 384,900 100.0% 4,017 95.82 0.0%
400 - 499K 1 0 0 0.0 0 0 0 0.0%
500 - 599K 0 0 0 0.0 0 0 0 0.0%
600 - 799K 0 0 0 0.0 0 0 0 0.0%
800 - 999K 0 0 0 0.0 0 0 0 0.0%
>1M 0 0 0 0.0 0 0 0 0.0%
Total 96 42 202 5.7 0.0%Average
Price191,963$ 216,912$ 191,489$ - 191,489 192,572 100.6% 1,935 99.54$
Report Criteria:Single Family (<2 acres), Condo, Townhouse
Minimum: 1bed, 1bath, $2000 asking price Age: New, Under Const, To Be Built
Current as of Report Date
New Construction Market Statistics
Average based on 12 Month Solds
$243,636
$209,024
$166,717 $158,531$182,266 $190,829 $192,572
$-
$50,000
$100,000
$150,000
$200,000
$250,000
$300,000
2007 2008 2009 2010 2011 2012 2013
8 17 20 14 16 28 18 13 15 10 16 15
2734
4149 49
43
3026
22
20
27
423836
71
88 8983
96 9589
96
86
65 6767
77
0
10
20
30
40
50
60
Mar, 12 Apr, 12 May, 12 Jun, 12 Jul, 12 Aug, 12 Sep, 12 Oct, 12 Nov, 12 Dec, 12 Jan, 13 Feb, 13 Mar, 13
0
20
40
60
80
100
120Closed Sales Pending Sales Active Listings
The information provided is derived from the Intermountain MLS. It is deemed reliable but not guaranteed.
Report Date: April 6, 2013

Area: 600, W Boise Report Month: March, 2013
Market Trends
Active Pending Sold
Price in
$1000's12 Mths Inventory Ask Price Sold Price
Sold to Ask
Ratio
Average
Sq Ft
Price per
SqFt
%
Distressed
0 - 100K 0 0 0 0.0 0 0 0 0.0%
100 -150K 4 24 19 2.5 138,484 139,129 100.5% 1,361 102.24 0.0%
150 - 199K 4 4 23 2.1 173,446 176,160 101.6% 1,532 114.99 0.0%
200 - 249K 0 1 0 0.0 0 0 0 0.0%
250 - 299K 0 0 0 0.0 0 0 0 0.0%
300 - 349K 0 0 3 0.0 321,984 320,373 99.5% 2,430 131.86 0.0%
Average Sold Price: Historical 350 - 399K 0 0 1 0.0 369,888 369,888 100.0% 3,336 110.88 0.0%
400 - 499K 0 2 0 0.0 0 0 0 0.0%
500 - 599K 0 0 0 0.0 0 0 0 0.0%
600 - 799K 0 0 0 0.0 0 0 0 0.0%
800 - 999K 0 0 0 0.0 0 0 0 0.0%
>1M 0 0 0 0.0 0 0 0 0.0%
Total 8 31 46 2.1 0.0%Average
Price158,650$ 159,300$ 172,963$ - 172,963 174,481 100.9% 1,559 111.92$
Report Criteria:Single Family (<2 acres), Condo, Townhouse
Minimum: 1bed, 1bath, $2000 asking price Age: New, Under Const, To Be Built
Current as of Report Date
New Construction Market Statistics
Average based on 12 Month Solds
$195,538
$167,890$146,590
$128,383 $136,978
$174,829 $174,481
$-
$50,000
$100,000
$150,000
$200,000
$250,000
2007 2008 2009 2010 2011 2012 2013
5 1 5 2 3 6 8 5 6 1 5 24
9 1012 12 11 10
8 72 3
31
12
4
17 17
13
1110
14
10
8
12
89
88
0
5
10
15
20
25
30
35
Mar, 12 Apr, 12 May, 12 Jun, 12 Jul, 12 Aug, 12 Sep, 12 Oct, 12 Nov, 12 Dec, 12 Jan, 13 Feb, 13 Mar, 13
0
2
4
6
8
10
12
14
16
18Closed Sales Pending Sales Active Listings
The information provided is derived from the Intermountain MLS. It is deemed reliable but not guaranteed.
Report Date: April 6, 2013

Area: 650, W Boise Report Month: March, 2013
Market Trends
Active Pending Sold
Price in
$1000's12 Mths Inventory Ask Price Sold Price
Sold to Ask
Ratio
Average
Sq Ft
Price per
SqFt
%
Distressed
0 - 100K 0 0 0 0.0 0 0 0 0.0%
100 -150K 0 0 7 0.0 140,114 140,888 100.6% 1,426 98.80 0.0%
150 - 199K 1 2 9 1.3 177,356 176,608 99.6% 2,037 86.71 0.0%
200 - 249K 1 3 24 0.5 227,670 228,686 100.4% 1,924 118.89 0.0%
250 - 299K 5 6 14 4.3 271,219 272,592 100.5% 2,469 110.39 0.0%
300 - 349K 3 5 5 7.2 322,376 325,053 100.8% 2,778 117.01 0.0%
Average Sold Price: Historical 350 - 399K 4 1 3 16.0 371,862 374,288 100.7% 3,322 112.68 0.0%
400 - 499K 3 4 1 36.0 429,365 423,860 98.7% 3,565 118.89 0.0%
500 - 599K 0 0 0 0.0 0 0 0 0.0%
600 - 799K 0 0 0 0.0 0 0 0 0.0%
800 - 999K 0 0 0 0.0 0 0 0 0.0%
>1M 0 0 0 0.0 0 0 0 0.0%
Total 17 21 63 3.2 0.0%Average
Price325,771$ 305,860$ 238,016$ - 238,016 238,927 100.4% 2,166 110.30$
Report Criteria:Single Family (<2 acres), Condo, Townhouse
Minimum: 1bed, 1bath, $2000 asking price Age: New, Under Const, To Be Built
Current as of Report Date
New Construction Market Statistics
Average based on 12 Month Solds
$225,345$203,874
$173,218$153,533
$206,755$230,381 $238,927
$-
$50,000
$100,000
$150,000
$200,000
$250,000
$300,000
2007 2008 2009 2010 2011 2012 2013
6 9 4 7 6 9 5 8 2 1 6 3
1720
1714 15
9 1012
10
3
13
21
1720
2422
17 17
20
14
17 17
2119
26
2322
0
5
10
15
20
25
Mar, 12 Apr, 12 May, 12 Jun, 12 Jul, 12 Aug, 12 Sep, 12 Oct, 12 Nov, 12 Dec, 12 Jan, 13 Feb, 13 Mar, 13
0
5
10
15
20
25
30Closed Sales Pending Sales Active Listings
The information provided is derived from the Intermountain MLS. It is deemed reliable but not guaranteed.
Report Date: April 6, 2013

Area: 700, Garden City Report Month: March, 2013
Market Trends
Active Pending Sold
Price in
$1000's12 Mths Inventory Ask Price Sold Price
Sold to Ask
Ratio
Average
Sq Ft
Price per
SqFt
%
Distressed
0 - 100K 0 0 0 0.0 0 0 0 0.0%
100 -150K 0 0 0 0.0 0 0 0 0.0%
150 - 199K 2 1 2 12.0 194,900 195,920 100.5% 1,678 116.76 0.0%
200 - 249K 0 0 4 0.0 233,425 232,454 99.6% 1,930 120.47 0.0%
250 - 299K 1 2 2 6.0 273,877 273,877 100.0% 2,173 126.07 0.0%
300 - 349K 0 1 0 0.0 0 0 0 0.0%
Average Sold Price: Historical 350 - 399K 1 1 0 0.0 0 0 0 0.0%
400 - 499K 0 0 0 0.0 0 0 0 0.0%
500 - 599K 0 0 0 0.0 0 0 0 0.0%
600 - 799K 0 0 0 0.0 0 0 0 0.0%
800 - 999K 0 0 0 0.0 0 0 0 0.0%
>1M 0 0 0 0.0 0 0 0 0.0%
Total 4 5 8 6.0 0.0%Average
Price251,248$ 287,098$ 233,907$ - 233,907 233,676 99.9% 1,927 121.24$
Report Criteria:Single Family (<2 acres), Condo, Townhouse
Minimum: 1bed, 1bath, $2000 asking price Age: New, Under Const, To Be Built
Current as of Report Date
New Construction Market Statistics
Average based on 12 Month Solds
$196,422
$289,758
$198,218
$142,794
$-
$237,184 $233,676
$-
$50,000
$100,000
$150,000
$200,000
$250,000
$300,000
$350,000
2007 2008 2009 2010 2011 2012 2013
0 1 0 1 0 1 2 1 1 0 1 0
3
4
5
4
5 5 5
2 2
0 1
5
3
0
1 1 1 1
2
5
6
4
5
1 111
0
1
2
3
4
5
6
Mar, 12 Apr, 12 May, 12 Jun, 12 Jul, 12 Aug, 12 Sep, 12 Oct, 12 Nov, 12 Dec, 12 Jan, 13 Feb, 13 Mar, 13
0
1
2
3
4
5
6
7Closed Sales Pending Sales Active Listings
The information provided is derived from the Intermountain MLS. It is deemed reliable but not guaranteed.
Report Date: April 6, 2013

Area: 800, NW Boise Report Month: March, 2013
Market Trends
Active Pending Sold
Price in
$1000's12 Mths Inventory Ask Price Sold Price
Sold to Ask
Ratio
Average
Sq Ft
Price per
SqFt
%
Distressed
0 - 100K 0 0 0 0.0 0 0 0 0.0%
100 -150K 0 0 13 0.0 145,263 147,166 101.3% 1,377 106.84 0.0%
150 - 199K 7 8 25 3.4 173,482 174,224 100.4% 1,621 107.47 0.0%
200 - 249K 11 5 33 4.0 227,189 227,892 100.3% 1,994 114.29 0.0%
250 - 299K 2 2 17 1.4 278,251 280,726 100.9% 2,473 113.54 0.0%
300 - 349K 3 3 9 4.0 317,612 317,016 99.8% 2,297 138.04 0.0%
Average Sold Price: Historical 350 - 399K 3 1 7 5.1 388,426 391,731 100.9% 2,988 131.10 0.0%
400 - 499K 6 0 4 18.0 438,935 446,340 101.7% 2,949 151.38 0.0%
500 - 599K 0 0 1 0.0 542,574 579,991 106.9% 3,661 158.42 0.0%
600 - 799K 0 0 1 0.0 614,407 613,603 99.9% 3,344 183.49 0.0%
800 - 999K 0 0 0 0.0 0 0 0 0.0%
>1M 0 0 0 0.0 0 0 0 0.0%
Total 32 19 110 3.5 0.0%Average
Price283,353$ 234,966$ 244,464$ - 244,464 246,349 100.8% 2,062 119.46$
Report Criteria:Single Family (<2 acres), Condo, Townhouse
Minimum: 1bed, 1bath, $2000 asking price Age: New, Under Const, To Be Built
Current as of Report Date
New Construction Market Statistics
Average based on 12 Month Solds
$292,826
$260,206
$217,061$190,133
$205,919$232,094
$246,349
$-
$50,000
$100,000
$150,000
$200,000
$250,000
$300,000
$350,000
2007 2008 2009 2010 2011 2012 2013
6 9 11 8 9 12 8 3 10 14 10 9
20
25 2426
2422
17 17
25
8
25
1917
26
33
28
19
39
45
27
31 32
4139
353537
0
5
10
15
20
25
30
Mar, 12 Apr, 12 May, 12 Jun, 12 Jul, 12 Aug, 12 Sep, 12 Oct, 12 Nov, 12 Dec, 12 Jan, 13 Feb, 13 Mar, 13
0
5
10
15
20
25
30
35
40
45
50Closed Sales Pending Sales Active Listings
The information provided is derived from the Intermountain MLS. It is deemed reliable but not guaranteed.
Report Date: April 6, 2013

Area: 900, Eagle Report Month: March, 2013
Market Trends
Active Pending Sold
Price in
$1000's12 Mths Inventory Ask Price Sold Price
Sold to Ask
Ratio
Average
Sq Ft
Price per
SqFt
%
Distressed
0 - 100K 0 0 0 0.0 0 0 0 0.0%
100 -150K 0 0 0 0.0 0 0 0 0.0%
150 - 199K 2 2 16 1.5 180,901 180,449 99.8% 1,606 112.38 0.0%
200 - 249K 6 2 19 3.8 220,464 221,463 100.5% 1,873 118.26 0.0%
250 - 299K 5 6 20 3.0 274,831 272,235 99.1% 2,397 113.59 0.0%
300 - 349K 7 6 17 4.9 317,091 319,515 100.8% 2,655 120.33 0.0%
Average Sold Price: Historical 350 - 399K 9 4 17 6.4 368,949 368,962 100.0% 2,899 127.28 0.0%
400 - 499K 8 8 15 6.4 460,256 459,988 99.9% 3,245 141.76 0.0%
500 - 599K 11 5 15 8.8 546,115 540,721 99.0% 3,419 158.15 0.0%
600 - 799K 6 2 8 9.0 698,339 700,674 100.3% 4,069 172.21 0.0%
800 - 999K 3 1 0 0.0 0 0 0 0.0%
>1M 1 0 0 0.0 0 0 0 0.0%
Total 58 36 127 5.5 0.0%Average
Price456,438$ 410,633$ 352,745$ - 352,745 352,033 99.8% 2,648 132.94$
Report Criteria:Single Family (<2 acres), Condo, Townhouse
Minimum: 1bed, 1bath, $2000 asking price Age: New, Under Const, To Be Built
Current as of Report Date
New Construction Market Statistics
Average based on 12 Month Solds
$396,178$361,040
$330,992
$283,590
$390,964$352,134 $352,033
$-
$50,000
$100,000
$150,000
$200,000
$250,000
$300,000
$350,000
$400,000
$450,000
2007 2008 2009 2010 2011 2012 2013
5 3 6 15 13 13 20 13 13 3 8 11
1824
34 36
4439 40
28 27
9
19
36
2628
5552
35
41 42
5155
58
43
53495152
0
5
10
15
20
25
30
35
40
45
50
Mar, 12 Apr, 12 May, 12 Jun, 12 Jul, 12 Aug, 12 Sep, 12 Oct, 12 Nov, 12 Dec, 12 Jan, 13 Feb, 13 Mar, 13
0
10
20
30
40
50
60
70Closed Sales Pending Sales Active Listings
The information provided is derived from the Intermountain MLS. It is deemed reliable but not guaranteed.
Report Date: April 6, 2013

Area: 950, Star Report Month: March, 2013
Market Trends
Active Pending Sold
Price in
$1000's12 Mths Inventory Ask Price Sold Price
Sold to Ask
Ratio
Average
Sq Ft
Price per
SqFt
%
Distressed
0 - 100K 0 0 0 0.0 0 0 0 0.0%
100 -150K 3 3 32 1.1 134,084 134,857 100.6% 1,550 87.03 0.0%
150 - 199K 18 10 32 6.8 179,656 179,366 99.8% 2,117 84.75 0.0%
200 - 249K 10 5 10 12.0 225,285 226,514 100.5% 2,310 98.06 0.0%
250 - 299K 26 7 8 39.0 264,905 262,721 99.2% 2,353 111.64 0.0%
300 - 349K 12 1 7 20.6 323,886 325,134 100.4% 2,692 120.76 0.0%
Average Sold Price: Historical 350 - 399K 3 0 1 36.0 351,334 353,126 100.5% 3,600 98.09 0.0%
400 - 499K 0 0 0 0.0 0 0 0 0.0%
500 - 599K 0 0 0 0.0 0 0 0 0.0%
600 - 799K 0 0 0 0.0 0 0 0 0.0%
800 - 999K 0 0 0 0.0 0 0 0 0.0%
>1M 0 0 0 0.0 0 0 0 0.0%
Total 72 26 90 9.6 0.0%Average
Price250,815$ 209,946$ 189,225$ - 189,225 189,457 100.1% 2,019 93.85$
Report Criteria:Single Family (<2 acres), Condo, Townhouse
Minimum: 1bed, 1bath, $2000 asking price Age: New, Under Const, To Be Built
Current as of Report Date
New Construction Market Statistics
Average based on 12 Month Solds
$271,809$255,487
$197,737
$164,910$151,476
$183,800 $189,457
$-
$50,000
$100,000
$150,000
$200,000
$250,000
$300,000
2007 2008 2009 2010 2011 2012 2013
3 7 4 7 9 7 10 7 6 10 7 9
1416
20 2117 16 17
10
15
8
11
26
18
13
76 7672
75 77
6672 72
5854
66
49
61
0
5
10
15
20
25
30
Mar, 12 Apr, 12 May, 12 Jun, 12 Jul, 12 Aug, 12 Sep, 12 Oct, 12 Nov, 12 Dec, 12 Jan, 13 Feb, 13 Mar, 13
0
10
20
30
40
50
60
70
80
90Closed Sales Pending Sales Active Listings
The information provided is derived from the Intermountain MLS. It is deemed reliable but not guaranteed.
Report Date: April 6, 2013

Area: 1000, SE Meridian Report Month: March, 2013
Market Trends
Active Pending Sold
Price in
$1000's12 Mths Inventory Ask Price Sold Price
Sold to Ask
Ratio
Average
Sq Ft
Price per
SqFt
%
Distressed
0 - 100K 0 0 0 0.0 0 0 0 0.0%
100 -150K 5 4 9 6.7 145,312 146,320 100.7% 1,541 94.93 0.0%
150 - 199K 27 9 43 7.5 179,292 179,808 100.3% 1,856 96.86 0.0%
200 - 249K 14 7 20 8.4 222,192 226,094 101.8% 2,560 88.33 0.0%
250 - 299K 4 4 34 1.4 276,368 277,391 100.4% 2,545 108.99 0.0%
300 - 349K 0 5 32 0.0 322,834 328,008 101.6% 2,836 115.65 0.0%
Average Sold Price: Historical 350 - 399K 4 4 10 4.8 364,747 368,426 101.0% 3,254 113.23 0.0%
400 - 499K 1 4 7 1.7 422,994 428,712 101.4% 3,533 121.33 0.0%
500 - 599K 0 0 0 0.0 0 0 0 0.0%
600 - 799K 0 0 0 0.0 0 0 0 0.0%
800 - 999K 0 0 0 0.0 0 0 0 0.0%
>1M 0 0 0 0.0 0 0 0 0.0%
Total 55 37 155 4.3 0.0%Average
Price206,316$ 261,752$ 256,754$ - 256,754 259,247 101.0% 2,448 105.90$
Report Criteria:Single Family (<2 acres), Condo, Townhouse
Minimum: 1bed, 1bath, $2000 asking price Age: New, Under Const, To Be Built
Current as of Report Date
New Construction Market Statistics
Average based on 12 Month Solds
$303,446
$257,264
$209,327$195,553
$226,988$251,235 $259,247
$-
$50,000
$100,000
$150,000
$200,000
$250,000
$300,000
$350,000
2007 2008 2009 2010 2011 2012 2013
10 8 12 12 13 9 21 12 12 11 9 20
2632
37 37 40
54 52
42 40
16
34 373332
49
59 61 61 60
53 53 5552
55
66
4852
0
10
20
30
40
50
60
Mar, 12 Apr, 12 May, 12 Jun, 12 Jul, 12 Aug, 12 Sep, 12 Oct, 12 Nov, 12 Dec, 12 Jan, 13 Feb, 13 Mar, 13
0
10
20
30
40
50
60
70Closed Sales Pending Sales Active Listings
The information provided is derived from the Intermountain MLS. It is deemed reliable but not guaranteed.
Report Date: April 6, 2013

Area: 1010, SW Meridian Report Month: March, 2013
Market Trends
Active Pending Sold
Price in
$1000's12 Mths Inventory Ask Price Sold Price
Sold to Ask
Ratio
Average
Sq Ft
Price per
SqFt
%
Distressed
0 - 100K 0 0 0 0.0 0 0 0 0.0%
100 -150K 0 0 0 0.0 0 0 0 0.0%
150 - 199K 0 0 0 0.0 0 0 0 0.0%
200 - 249K 0 2 0 0.0 0 0 0 0.0%
250 - 299K 1 5 5 2.4 274,784 275,844 100.4% 2,662 103.64 0.0%
300 - 349K 2 0 1 24.0 308,610 308,610 100.0% 2,584 119.43 0.0%
Average Sold Price: Historical 350 - 399K 0 1 2 0.0 385,500 385,500 100.0% 3,475 110.94 0.0%
400 - 499K 0 1 0 0.0 0 0 0 0.0%
500 - 599K 0 0 0 0.0 0 0 0 0.0%
600 - 799K 0 0 0 0.0 0 0 0 0.0%
800 - 999K 0 0 0 0.0 0 0 0 0.0%
>1M 0 0 0 0.0 0 0 0 0.0%
Total 3 9 8 4.5 0.0%Average
Price311,583$ 295,227$ 306,691$ - 306,691 307,354 100.2% 2,855 107.65$
Report Criteria:Single Family (<2 acres), Condo, Townhouse
Minimum: 1bed, 1bath, $2000 asking price Age: New, Under Const, To Be Built
Current as of Report Date
New Construction Market Statistics
Average based on 12 Month Solds
$355,672
$314,279
$242,861$215,513
$316,146 $302,717 $307,354
$-
$50,000
$100,000
$150,000
$200,000
$250,000
$300,000
$350,000
$400,000
2007 2008 2009 2010 2011 2012 2013
1 0 0 1 0 0 0 2 1 0 0 40 0 1 0 0 0 1 12
0
3
9
7
5
4 4
5
4 4 4
3 3
2 2
44
2
0
1
2
3
4
5
6
7
8
9
10
Mar, 12 Apr, 12 May, 12 Jun, 12 Jul, 12 Aug, 12 Sep, 12 Oct, 12 Nov, 12 Dec, 12 Jan, 13 Feb, 13 Mar, 13
0
1
2
3
4
5
6Closed Sales Pending Sales Active Listings
The information provided is derived from the Intermountain MLS. It is deemed reliable but not guaranteed.
Report Date: April 6, 2013

Area: 1020, NE Meridian Report Month: March, 2013
Market Trends
Active Pending Sold
Price in
$1000's12 Mths Inventory Ask Price Sold Price
Sold to Ask
Ratio
Average
Sq Ft
Price per
SqFt
%
Distressed
0 - 100K 0 0 0 0.0 0 0 0 0.0%
100 -150K 0 1 20 0.0 139,294 143,731 103.2% 1,562 92.04 5.0%
150 - 199K 7 11 67 1.3 175,690 175,752 100.0% 1,712 102.65 0.0%
200 - 249K 3 10 39 0.9 224,693 226,377 100.7% 2,080 108.84 0.0%
250 - 299K 5 8 44 1.4 278,953 279,974 100.4% 2,459 113.85 0.0%
300 - 349K 12 16 39 3.7 324,097 325,544 100.4% 2,774 117.34 0.0%
Average Sold Price: Historical 350 - 399K 4 6 8 6.0 359,800 367,189 102.1% 2,911 126.15 0.0%
400 - 499K 0 1 3 0.0 423,027 423,865 100.2% 3,609 117.44 0.0%
500 - 599K 0 0 0 0.0 0 0 0 0.0%
600 - 799K 0 0 0 0.0 0 0 0 0.0%
800 - 999K 0 0 0 0.0 0 0 0 0.0%
>1M 0 0 0 0.0 0 0 0 0.0%
Total 31 53 220 1.7 0.5%Average
Price286,368$ 272,793$ 238,097$ - 238,097 239,558 100.6% 2,171 110.36$
Report Criteria:Single Family (<2 acres), Condo, Townhouse
Minimum: 1bed, 1bath, $2000 asking price Age: New, Under Const, To Be Built
Current as of Report Date
New Construction Market Statistics
Average based on 12 Month Solds
$278,410
$229,577
$185,547 $176,998
$218,772$234,669 $239,558
$-
$50,000
$100,000
$150,000
$200,000
$250,000
$300,000
2007 2008 2009 2010 2011 2012 2013
14 25 14 17 27 19 17 13 20 12 12 23
4439 42 43
37 3632
2731
22
28
5358
32
6166
61
69
55
48
38
31
40
54
6769
57
0
10
20
30
40
50
60
70
Mar, 12 Apr, 12 May, 12 Jun, 12 Jul, 12 Aug, 12 Sep, 12 Oct, 12 Nov, 12 Dec, 12 Jan, 13 Feb, 13 Mar, 13
0
10
20
30
40
50
60
70
80Closed Sales Pending Sales Active Listings
The information provided is derived from the Intermountain MLS. It is deemed reliable but not guaranteed.
Report Date: April 6, 2013

Area: 1030, NW Meridian Report Month: March, 2013
Market Trends
Active Pending Sold
Price in
$1000's12 Mths Inventory Ask Price Sold Price
Sold to Ask
Ratio
Average
Sq Ft
Price per
SqFt
%
Distressed
0 - 100K 0 0 0 0.0 0 0 0 0.0%
100 -150K 13 2 25 6.2 136,917 138,762 101.3% 1,437 96.54 0.0%
150 - 199K 19 8 54 4.2 177,690 178,287 100.3% 1,975 90.29 0.0%
200 - 249K 21 4 33 7.6 222,424 222,610 100.1% 2,190 101.66 0.0%
250 - 299K 12 9 34 4.2 279,984 280,472 100.2% 2,536 110.59 0.0%
300 - 349K 16 20 47 4.1 328,919 330,041 100.3% 2,879 114.64 0.0%
Average Sold Price: Historical 350 - 399K 4 15 34 1.4 371,650 372,423 100.2% 3,227 115.42 0.0%
400 - 499K 3 2 5 7.2 444,258 444,151 100.0% 3,674 120.89 0.0%
500 - 599K 1 0 3 4.0 547,842 544,567 99.4% 3,470 156.95 0.0%
600 - 799K 0 0 2 0.0 659,950 609,500 92.4% 3,792 160.75 0.0%
800 - 999K 0 0 0 0.0 0 0 0 0.0%
>1M 0 0 0 0.0 0 0 0 0.0%
Total 89 60 237 4.5 0.0%Average
Price244,963$ 299,739$ 266,047$ - 266,047 266,361 100.1% 2,450 108.74$
Report Criteria:Single Family (<2 acres), Condo, Townhouse
Minimum: 1bed, 1bath, $2000 asking price Age: New, Under Const, To Be Built
Current as of Report Date
New Construction Market Statistics
Average based on 12 Month Solds
$246,784
$215,310
$178,085$166,944
$229,450$256,174 $266,361
$-
$50,000
$100,000
$150,000
$200,000
$250,000
$300,000
2007 2008 2009 2010 2011 2012 2013
16 21 23 16 25 19 26 21 16 16 18 18
56 60 6069
6255 53
4033
19
28
60
4644
100105
96
80 82
100
86 8984
99103
95
80
0
10
20
30
40
50
60
70
80
Mar, 12 Apr, 12 May, 12 Jun, 12 Jul, 12 Aug, 12 Sep, 12 Oct, 12 Nov, 12 Dec, 12 Jan, 13 Feb, 13 Mar, 13
0
20
40
60
80
100
120Closed Sales Pending Sales Active Listings
The information provided is derived from the Intermountain MLS. It is deemed reliable but not guaranteed.
Report Date: April 6, 2013

Area: 1100, Kuna Report Month: March, 2013
Market Trends
Active Pending Sold
Price in
$1000's12 Mths Inventory Ask Price Sold Price
Sold to Ask
Ratio
Average
Sq Ft
Price per
SqFt
%
Distressed
0 - 100K 0 0 0 0.0 0 0 0 0.0%
100 -150K 18 2 20 10.8 135,807 136,153 100.3% 1,631 83.48 0.0%
150 - 199K 34 8 30 13.6 170,462 171,224 100.4% 2,122 80.71 0.0%
200 - 249K 7 0 3 28.0 226,597 231,046 102.0% 2,483 93.04 0.0%
250 - 299K 2 1 2 12.0 258,264 258,264 100.0% 2,861 90.29 0.0%
300 - 349K 1 1 0 0.0 0 0 0 0.0%
Average Sold Price: Historical 350 - 399K 1 0 0 0.0 0 0 0 0.0%
400 - 499K 0 0 0 0.0 0 0 0 0.0%
500 - 599K 0 0 0 0.0 0 0 0 0.0%
600 - 799K 0 0 0 0.0 0 0 0 0.0%
800 - 999K 0 0 0 0.0 0 0 0 0.0%
>1M 0 0 0 0.0 0 0 0 0.0%
Total 63 12 55 13.7 0.0%Average
Price178,139$ 187,873$ 164,115$ - 164,115 164,899 100.5% 1,990 82.87$
Report Criteria:Single Family (<2 acres), Condo, Townhouse
Minimum: 1bed, 1bath, $2000 asking price Age: New, Under Const, To Be Built
Current as of Report Date
New Construction Market Statistics
Average based on 12 Month Solds
$196,008
$163,705
$136,083$123,235
$165,367 $161,811 $164,899
$-
$50,000
$100,000
$150,000
$200,000
$250,000
2007 2008 2009 2010 2011 2012 2013
6 3 7 1 2 8 6 3 6 1 5 8
6
8
1011 11 11
10
8
4
5
6
12
109
48 46 45
34
48
33
53
63
32 32
5046
33
0
2
4
6
8
10
12
14
Mar, 12 Apr, 12 May, 12 Jun, 12 Jul, 12 Aug, 12 Sep, 12 Oct, 12 Nov, 12 Dec, 12 Jan, 13 Feb, 13 Mar, 13
0
10
20
30
40
50
60
70Closed Sales Pending Sales Active Listings
The information provided is derived from the Intermountain MLS. It is deemed reliable but not guaranteed.
Report Date: April 6, 2013