marcelo fuentes capstone - final version
TRANSCRIPT
Multilevel analysis of the effects of non-educational factors on
educational attainment (PISA scores) in Latin America & Brazil
A Capstone Project Submitted in Partial Fulfillment of the Requirements of
The Renée Crown University Honors Program at Syracuse University
Marcelo M. Fuentes
Candidate for B.S. Degree in Economics, B.A Degree in International Relations,
and Renée Crown University Honors
May 2016
Honors Capstone Project in International Relations
Capstone Project Advisor: ___________________________________ (Don Dutkowsky)
Capstone Project Reader: __________________________________ (John Burdick)
Honors Director: ___________________________________________ (Stephen Kuusisto)
Date: __________________________________

© Marcelo Fuentes 2016 1
© Marcelo Fuentes, April 28th 2016
© Marcelo Fuentes 2016 2
ACKNOWLEDGEMENTS
This capstone is dedicated to my parents, Cesar and Isabel Fuentes, who have always cheered
for me granting me unconditional support. To my wife Andreacarola Urso for her continuous
patience and support during the long nights of work this paper demanded, and to my sister
Oriana Fuentes, who has always inspired me to strive for perfection. Last but not least, I would
like to thank Dr. Don Dutkowsky who gave me guidance and the much needed direction required
to nurture this project from beginning to end.
© Marcelo Fuentes 2016 3
ABSTRACT
This paper examines the different determinants of educational attainment in Latin America and
Brazil, by using PISA scores (an exam created by the OECD) as a metric for educational
attainment, and an OLS multivariable regression to assess causality. In this paper Brazil has been
used as a base case of analysis from which conclusions were drawn for the Latin American region
as a whole. Results show that, at a local scale, dependency, analphabetism, economic inequality
and unemployment are the strongest determinants of PISA scores in Brazil. At a macro level, PISA
scores appear to be affected mainly by urbanization, dependency, and GDP per capita. Results also
indicate that, within Brazil, a one percent increase in the level of dependency lowered students’
scores on PISA examinations by an average of 2.5 points. While, at a macro scale, a one percent
increase in urbanization increased students’ PISA scores by an average of 8.4 points. After careful
analysis, we suggest Latin American countries need to pay closer attention at their widening
demographic pyramids, and urbanization models to improve adolescents’ educational
performance.
© Marcelo Fuentes 2016 4
EXECUTIVE SUMMARY
Latin America is a region which has undergone unparalleled economic growth and development
in the last two decades; however, not the same can be said in matters of educational attainment.
Therefore, the purpose of this paper is to evaluate what the main determinants of educational
attainments in Latin America are, using PISA scores (a triennial exam taken by adolescents
worldwide) as the dependent variable of this study. Seeing that this is a macroeconomic issue, this
study focuses on using a statistical model (ordinary least squares) to determine what the main
macroeconomic determinants of educational attainment are (some of the variables explored were
unemployment, GDP per capita, divorce rate, etc.). After testing several models and using Brazil
as the base case for this analysis, the main results indicate that Latin America as a region should
pay closer attention to their changing demographics as well as their investment in infrastructure if
they have hopes of raising their average educational attainment levels. Furthermore, this paper
suggests other Latin American economies follow suit with Brazilian welfare policies, since these
will prevent a hard landing effect in the region once the demographic dividend is exhausted.
Interestingly, yet contrary to what was expected, GDP per capita and inequality effects on PISA
scores were negative and positive, respectively. Lastly, this study suggests that Latin America
should put more emphasis on their policies geared towards educational attainment if they wish to
be competitive in the future, given their low endowments of skilled labor.

© Marcelo Fuentes 2016 5
TABLE OF CONTENTS
I. Introduction ____________________________________________________________ 6
II. Background Information __________________________________________________ 8
II. A. PISA and Secondary Education ____________________________________________ 8
II. B. Latin America ________________________________________________________ 10
II. C. Brazil _______________________________________________________________ 15
III. Literature Review: Educational Attainment ___________________________________ 17
III. A. Income & Income inequality ____________________________________________ 17
III. B. Urbanization _________________________________________________________ 18
III. C. Dependency _________________________________________________________ 20
III. D. Analphabetism _______________________________________________________ 20
III. E. Unemployment _______________________________________________________ 22
III. F. Public Expenditure ____________________________________________________ 22
III. G. Infant Labor _________________________________________________________ 23
III. H. Divorce Rate _________________________________________________________ 24
IV. Model, Theory & Hypotheses _____________________________________________ 26
IV. A. Methodology and Data _________________________________________________ 26
IV. B. Estimated Models _____________________________________________________ 29
IV. C. Table of Expected Results ______________________________________________ 41
V. Findings ______________________________________________________________ 42
V. A. Cross-Country Model __________________________________________________ 42
V. B. Regional Model _______________________________________________________ 43
V. C. Inter-State Model ______________________________________________________ 45
VI. Discussion ____________________________________________________________ 47
VII. Conclusion ____________________________________________________________ 53
Bibliography ________________________________________________________________ 55
Annexes____________________________________________________________________ 58
Tables _____________________________________________________________________ 62
© Marcelo Fuentes 2016 6
I. INTRODUCTION
This paper uses multivariable ordinary least squares (OLS) regressions to assess what
variables should be of major concern to education policy makers in both Brazil and Latin America,
using educational performance data (PISA scores) collected from this past decade. For the
purposes of this study PISA scores were chosen as our dependent variable. GDP per capita,
urbanization rates, dependency, analphabetism, unemployment rates, Gini indexes, public
expenditure, infant labor rates, and divorce rates were chosen as its independent variables.
This study adds to the present literature on education policy since it focuses on education
policy in Latin America, which is a geographic region that has been much understudied.
Furthermore, given that PISA scores are relatively new metrics in education policy, this paper also
gives more clarity into what some of the variables are which affect adolescents’ educational
performance. Additionally, this study’s layered macro-to-micro analysis is innovative given that
few examples in present literature exhibit use of this approach.
For the reader’s convenience, this paper has been broken down into seven subsections: this
introduction where the features of this study are briefly discussed; a background information
section where some context on PISA, Latin America and Brazil is given to the reader; a literature
review, where previous contributions to this topic by different authors is summarized; a
theoretical framework where this study’s hypotheses and models are described; a findings
section where the empirical results of this study are highlighted; a discussion section with an
exhaustive analysis of the study’s results; and finally a conclusion with closing remarks for this
study, and suggestions for future ones.
© Marcelo Fuentes 2016 7
So what exactly are PISA scores? PISA (Programme of International Student Assessment)
is a triennial exam, which was tailored by the OECD (Organization for Economic Co-Operation
and Development) to objectively assess high school students worldwide on their proficiency in
mathematics, reading, writing and science. However, for the scope of this study, all the analysis
performed uses uniquely PISA scores for the mathematics portion of the exam. The decision to
use this specific portion was made on the assumption that marginal increases in proficiency in
mathematics should translate into skills yielding the highest future return for Latin Americans.
South America and Brazil were the geographies of choice for this study, primarily due to
their rising economic status in the western hemisphere. The region also has high potential for
growth given its large stocks of human capital. Therefore, considering South America’s recent
strides in the economic arena, understanding what factors are both promoting and hindering
academic performance in the region is crucial to enable these countries to pursue meaningful
economic growth.1 Since globalization will soon be pushing the supply for skilled labor even
further, if Latin America chooses not to embrace better public policies, it is likely that these
economies future will continue to be trapped in a spiral of low human capital gains and an over-
demand for skilled labor.
Therefore, this paper uses Brazil as a base case of analysis for the rest of the region,
principally due to Federative Republic’s avant garde public policies, but also due to its pivotal
position in the South American economy. It is also worth noting that Brazil has outperformed all
the countries in this study in educational attainment (given its PISA scores). Therefore, more than
1 Meaningful economic growth is driven by gains in human capital. Latin American over the past couples of decades has been notable for their export led-growth. Therefore, policies to diverge from this source of income are crucial for the region’s future.
© Marcelo Fuentes 2016 8
a few lessons might be learned from analyzing Brazilian data. In addition, finding what variables
affect proficiency in mathematics is important because technical skills are the main drivers of
progress, research and development. And considering the major brain drain2 Latin America has
suffered from in the past couple of decades, understanding how to better equip the region’s
adolescents (pre-adults) for the future is of the essence to stop and reverse this trend.
II. BACKGROUND INFORMATION
II. A. PISA AND SECONDARY EDUCATION
The Programme for International Student Assessment (PISA) is an ongoing triennial
survey that assesses the extent to which 15-year-old students near the end of compulsory education
have acquired key knowledge and skills essential to participate fully in modern societies. PISA
does not simply ascertain whether students can reproduce knowledge; rather, it examines how well
students can extrapolate from what they have learned and apply that knowledge in unfamiliar
settings, both in and outside of school. One of PISA’s main goals is to measure skills that students
will find applicable later on in life. Furthermore, PISA offers insights for education policy and
practice, and helps monitor trends in students’ acquisition of knowledge and skills across countries
and in different demographic subgroups within each country. The findings allow policy makers
around the world to gauge the knowledge of students in their own countries in comparison with
those in other countries, set policy targets against measurable goals achieved by other education
systems, and learn from policies and practices applied elsewhere (Avvisati, 10).
2 Brain Drain is defined as the movement of high skilled human capital from one geography to a different one, thus the emigration of this demographic ‘brain drains’ a country.
© Marcelo Fuentes 2016 9
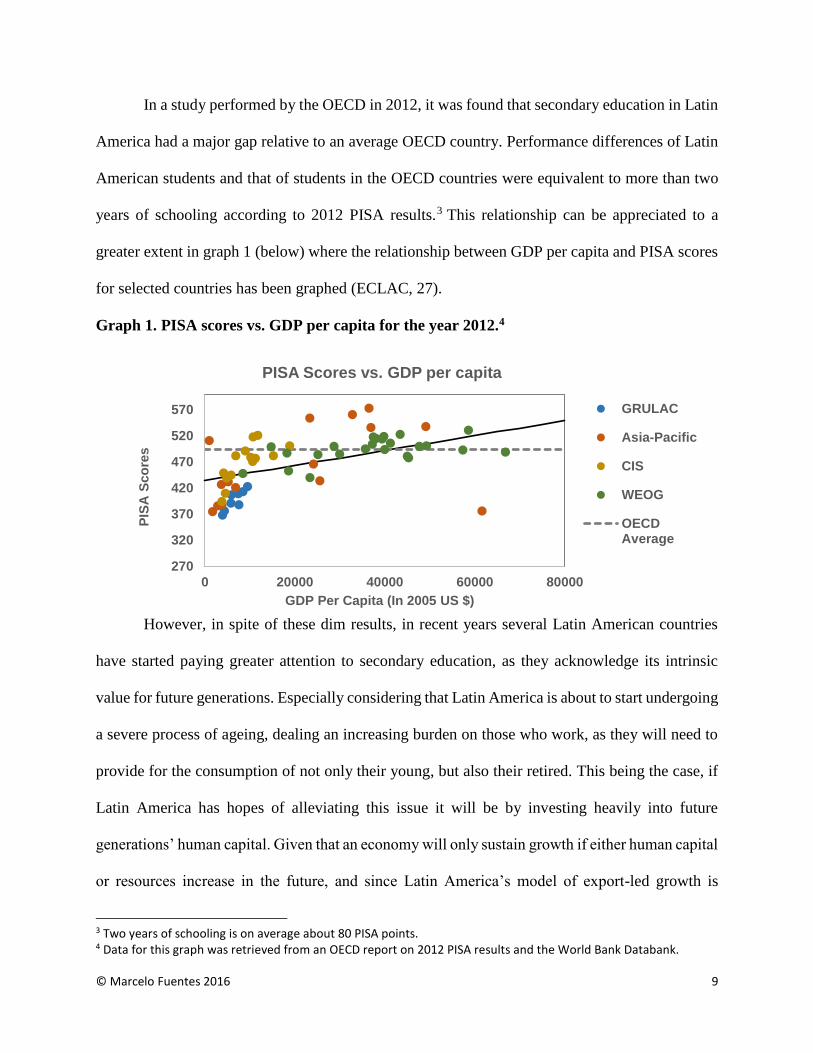
In a study performed by the OECD in 2012, it was found that secondary education in Latin
America had a major gap relative to an average OECD country. Performance differences of Latin
American students and that of students in the OECD countries were equivalent to more than two
years of schooling according to 2012 PISA results.3 This relationship can be appreciated to a
greater extent in graph 1 (below) where the relationship between GDP per capita and PISA scores
for selected countries has been graphed (ECLAC, 27).
Graph 1. PISA scores vs. GDP per capita for the year 2012.4
However, in spite of these dim results, in recent years several Latin American countries
have started paying greater attention to secondary education, as they acknowledge its intrinsic
value for future generations. Especially considering that Latin America is about to start undergoing
a severe process of ageing, dealing an increasing burden on those who work, as they will need to
provide for the consumption of not only their young, but also their retired. This being the case, if
Latin America has hopes of alleviating this issue it will be by investing heavily into future
generations’ human capital. Given that an economy will only sustain growth if either human capital
or resources increase in the future, and since Latin America’s model of export-led growth is
3 Two years of schooling is on average about 80 PISA points. 4 Data for this graph was retrieved from an OECD report on 2012 PISA results and the World Bank Databank.
270
320
370
420
470
520
570
0 20000 40000 60000 80000
PIS
A S
co
res
GDP Per Capita (In 2005 US $)
PISA Scores vs. GDP per capita
GRULAC
Asia-Pacific
CIS
WEOG
OECDAverage
© Marcelo Fuentes 2016 10
unsustainable in the future, without proper investments in human capital, an increase in production
and development will be hard to achieve (Moura Castro, 17; Glover, 99).
The changing characteristics of today’s and tomorrow’s economies require a labor force
with stronger mathematic, scientific, and communications skills. As a result, in developed
countries these demands yielded virtually universal secondary education, revised curricula, and
higher learning standards. In contrast, in Latin America and the Caribbean, school enrollment rates
have been historically lower, mainly due to schools’ subpar quality of teaching and curricula
poorly matching labor market demands. Moreover, considering that most students in Latin
America decide to delve into the labor force right after completing secondary school, the fact that
this institution is achieving poor results has a direct effect on the productive capacity of the
economy (Moura Castro, 1; Gropello, 44).
Lastly, it is a fact that education’s social returns surpass its costs, given that several studies
quote both educational attainment and learning being tied to a number of social and developmental
outcomes that generate greater social welfare in the long run, such as reducing infant mortality,
decreasing criminality, raising civil participation, decreasing risky behaviors, reducing the age of
marriage and reducing fertility rates. Therefore, governments should be driven to be stronger about
their efforts to improve educational attainment (Vegas, 11).
II. B. LATIN AMERICA
Latin America is a region where few students have access to higher education. Most young
people enter the work force right after finishing secondary school, or in some cases right before
graduating. This being said, how prepared will Latin Americans be as members of the future world,
© Marcelo Fuentes 2016 11
if the sole institution capable of giving them the tools needed to integrate into the economy is not
achieving the desired results? (Bassi, 7)
During the mid to late 1990s, several Latin American economies which had recently
stabilized after suffering massive economic recessions started implementing significant reforms to
improve the coverage, equity, and quality of their secondary education systems. This was primarily
accomplished by implementing comprehensive educational reforms based on efficient public-
private partnerships and enhancement in the level of relevance of curricula as well as vocational
education. In the past, studies on educational attainment had typically been done with data from
countries that belong to the European Union or NAFTA (mainly due to data availability). But
given that Latin America, as a region, has only experienced significant economic gains as of fairly
recent (1990’s onwards) the fruits of this growth can only be studied nowadays after some years
have passed and data has been collected (Gropello, 8).
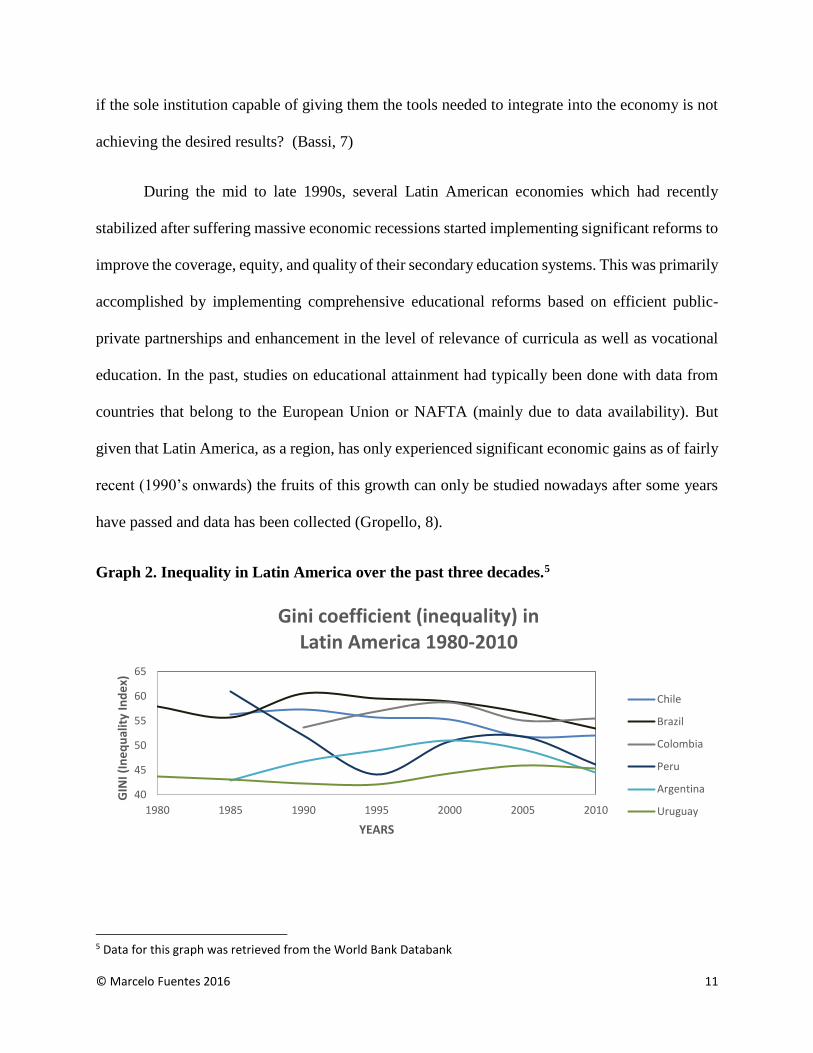
Graph 2. Inequality in Latin America over the past three decades.5
5 Data for this graph was retrieved from the World Bank Databank
40
45
50
55
60
65
1980 1985 1990 1995 2000 2005 2010
GIN
I (In
eq
ual
ity
Ind
ex)
YEARS
Gini coefficient (inequality) in Latin America 1980-2010
Chile
Brazil
Colombia
Peru
Argentina
Uruguay
© Marcelo Fuentes 2016 12
Latin America has severe issues of social and economic inequality; as can be seen in graph
2, Gini coefficients6 for the region range from 45 to 55 on average (the United States’ Gini index
for the year 2009 was 47). Therefore, inequality in education is also a major topic in Latin America.
However, the good news is that across the region income distribution has been improving in recent
years while poverty is declining. Interestingly, the two reasons for this increase in social equality
lie in improved relative earnings for low-skilled workers, as well as a drop in the earnings
premiums associated with education, which shows that as education increases in the region, social
and economic gaps are destined to close (Aedo, 6) (Manacorda, 308).
However, this optimism might need to be delayed for some years, since several countries
in the region appear to be trapped in a low-level equilibrium of low standards for entry into
teaching, low-quality candidates and relatively low (and undifferentiated) salaries – not to mention
poor education results. Hence, moving to a new equilibrium will be a difficult task to achieve,
since no Latin American school system today, with the exception of possibly Cuba, is even close
to having high academic standards (Bruns, 11).
Furthermore, another key issue in Latin America is that very few countries possess
programs and policies that orient young people in the areas of occupational placement. Since most
youth in Latin America do not see the returns of pursuing tertiary education (due to a lack of
employment opportunities where such skills are needed), there is an overall tendency to undervalue
education, which creates an oversupply of unskilled labor that ultimately foments the expansion
of industrial sectors where unskilled as opposed to skilled labor is needed. While this is negative
6 The Gini Coefficient is an index used to model inequality in a country; a value of 1 implies all the income of a country is held in the hands of one person and a value of 0 or total equality implies all income is distributed evenly within the population.
© Marcelo Fuentes 2016 13
for Latin America’s youth, it must be stressed that the overall impact on the economy is a lack of
diversification and expansion of sectors related to research, innovation and development (Barth,
6).
There are also signs that Latin America’s underperformance might be due to poor resource
allocation at the secondary education level, evidenced by Latin America’s low PISA scores
compared to those of other PISA participants in the OECD with similar capital endowments. Most
countries in Latin America, for which we have data, exhibit a relatively low per-student investment
in secondary education and an inability to turn that investment into learning achievements (as
reflected in PISA scores). This finding is suggestive of what seems to be a low quality equilibrium
where poor performance makes it hard to justify increased (or appropriate) funding, thus keeping
the system in mediocrity (Aedo, 13).
Another key issue to highlight regarding social relations and education in Latin America is
household relations. In most countries in the region, above 70% of children and grandchildren
reside with their elderly for a prolonged period of time (which is well above 20% co-residence
seen North America and Europe). Therefore, this high level of co-residency with younger
generations translates into a high intensity of intergenerational family transfers. However, most of
the transfers are directed towards younger generations, implying that younger generations tend not
to transfer much to their elderly but they do reap most of the benefits of households (Bixby, 156).
This being said, taken as a whole, Latin America is currently at the optimal stage of the
demographic dividend7, in which the dependency ratio has already reached relatively low levels
7 Demographic dividend is the notion that whenever an economy has fewer people who are economically dependent (children and elders), the workforce has extra income to spend, since they have fewer people to maintain/support.
© Marcelo Fuentes 2016 14
and continues to fall. However, since this period started at the beginning of this century and is
expected to last until the end of the next decade, it is likely that right now positive economic
outcomes might be a product of this dividend, and mishandling this surplus accordingly might
imply that, in a near future, older age people will start becoming a burden for the workforce.
Therefore, by increasing the quality of education of younger generations, higher productivity will
yield higher economic returns and safeguard the quality of life which Latin Americans have been
enjoying of in these past years. In essence, Latin America has a demographic window of
opportunity right now, in which betting for better secondary education might be optimal (Saad,
16-18).
Another key issue to highlight is that, in terms of foundational education, only some
countries in South America have compulsory secondary education cycles of school. These include
Venezuela and Ecuador, where some or all of secondary schooling is mandatory, and Brazil and
Bolivia, where the basic education cycle (including lower secondary) is compulsory. Yet, in the
remaining eight countries of the region, governments only demand that children complete primary
schooling (Gropello, 12).
Due to these aforementioned relations, nowadays there is a strong movement in several
countries in the region to pay further attention to secondary education. Chile, Argentina, Colombia,
Uruguay, Barbados, Paraguay, and El Salvador have recently undertaken major efforts to expand
and improve secondary education, while El Salvador, Costa Rica, Dominican Republic, Mexico,
and others have sought to expand and improve lower secondary education. In the case of Brazil,
we see the federative republic has sought out to make secondary education its priority over the
next four years (Moura Castro, 3).
© Marcelo Fuentes 2016 15
II. C. BRAZIL
Brazil’s case has been a particularly interesting one, not only because it represents a large
share of the Latin American economy and population, but also because of the rapid ageing process
its population has undergone. Due to this, towards the end of the 1980s Brazil introduced several
economic reforms to expand the coverage of their pension system to both poor and rural sectors,
but also for those working in the informal sector, thus providing benefits to all. However, it was
not until the late 1990’s that we saw Brazil making large investments in education with programs
such as FUNDEB8 and FUNDEF9 aimed at promoting the educational attainment of the country’s
most critical demographics. Therefore, several experts argue these systems of pensions and
subsidized education have been the trigger for Brazil’s social improvements in this past decade
(Donehower, 12).
It is also worth noting that in 1996 Brazil passed the Lei de Directrices e Bases de
Educaçao Nacional (the National Education Law), redefining the roles of both state and municipal
governments in education provision, though charging the central government with standard setting,
ensuring equity, monitoring, evaluation, and partial responsibility for education funding. Thanks
to this policy, Brazil was able to cope with the issue of mismanagement of government funds in
the education sector, but also giving more responsibility to local governments (Gropello, 64-65).
8 FUNDEB: Fundo de Manutenção e Desenvolvimento da Educação Básica e de Valorização dos Profissionais da Educação (Fund for the Maintenance and Development of Secondary Education and Valorization of Professional Educators) – this fund oversees the secondary education system, assessing professors’ performance and awarding better salaries to schools where professors are most needed. (Gropello, 64) 9 FUNDEF: Fundo de Manutenção e Desenvolvimento do Ensino Fundamental e de Valorização do Magistério (Fund for the Maintenance and Development of Elementary Education and Valorization of School Faculty) – this fund is analogous to FUNDEB, since it also oversees the salaries of teachers in the region; however, it also deals with professionals who are part of the schools’ management. (Gropello, 64)

© Marcelo Fuentes 2016 16
Another critical point to highlight is the structural changes Brazil’s labor market has
undergone in recent history. As seen in annex #1, nowadays more than 60% of Brazilians in the
labor force have completed at least secondary education. This fact should not be taken lightly, as
it sheds light onto the level of educational attainment currently being sought after by Brazilian
companies, but also by Latin American companies in the region. Thus, it is a reality that in a near
future this increasing demand for skilled workers will force those who decide not to pursue higher
education into equilibriums of low skill and low wages, since companies will look for skills
elsewhere, leaving only the most underserving jobs in the domestic market (do note, this applies
to Brazil, but also to any other Latin American economy with a similar situation) (Annex #1).
Lastly, in terms of income distribution, Brazil is one the most unequal countries in the
world. Anecdotally, education has historically played an import role in explaining this fact, since
about 50% of the income distribution in Brazil can be associated with education. The explanation
behind this is that returns to education in Brazil are very high and only a small proportion of the
population has access to higher levels of education. Moreover, although access to the first year of
schooling in Brazil is almost universal, children from poor backgrounds tend to drop out of the
school system early on. Unfortunately, one the reasons behind this high drop-out rate is typically
associated with the quality of education children receive in the public education system. For all
these reasons, this study considers it crucial to evaluate an education reform is aimed at changing
the government’s funding structure of the public school system, in order to redistribute resources
to the poorest regions and those who need them the most (Menezes-Filho, 12).
© Marcelo Fuentes 2016 17
III. LITERATURE REVIEW: EDUCATIONAL ATTAINMENT
This section introduces some of the different opinions and conclusions several academics and
international organizations have regarding the effect each one of the factors detailed below have
on educational attainment. Therefore, these previous findings are the ones guiding this paper’s
expectation of what each parameter’s effect might be on educational attainment.
III. A. INCOME & INCOME INEQUALITY
The relationship between income and educational attainment suffers from issues of
endogeneity, as pointed out by several authors such as Bruns in their 2015 World Bank report,
where it is stated that gains in educational attainment reflect large gains in economic growth. The
relationship between income and income inequality with educational attainment is far more
complex (Bruns, 3). However, in a report by World Vision it is stated that while there is a positive
relation between income and educational attainment, this relationship becomes weaker for
countries which have reached levels of income far exceeding those of the median, such as countries
in the European Union (World Vision, 11).
This particular study highlights that wealthy countries where there is large government
participation to implement education reform tend to display much higher results that those that
remain idle. This study does stress, however, that increased national income allows for higher
private spending on health and education, which in turn reflects into higher child well-being
(World Vision, 12-15). It is also important to highlight that countries’ incomes and their levels of
inequality are typically uncorrelated; however, Latin America as a region suffers from severe
income inequality, something which deeply disturbs the analysis of income and income inequality
and their effect on PISA scores. (Gropello, 52)
© Marcelo Fuentes 2016 18
In a study performed by Paul Glewwe and Hanan Jacoby in Vietnam (which by income
and geography is socioeconomically comparable to equatorial Latin American countries), they find
evidence that higher family incomes lead to more children attending school and/or attending for
longer. It must be noted that this study controlled for factors such as quantity and quality of schools
and yet arrived to the same conclusion. It is also crucial to highlight that this correlation is defended
by the Asian Development Bank as well (World Vision, 11; Glewwe, 49).
One last study performed by Catalina Gutierrez and Riuchi Tanaka suggests that countries
with high income inequality tend not to endorse public education nor any public institution
whatsoever, which translates into further restrictions for children to receive a basic education due
to high costs associated with receiving public education. As a result, due to low income families
being able to afford only low quality/price schools, the overall quality of education that children
from poorer backgrounds receive is overall lower, translating into low performance and low PISA
scores (Gutierrez, 75; Tanaka, 32).
III. B. URBANIZATION
In a study performed by Fafchamps in Nepal, where the effects that distance from the rural
portions of a city to the urban portions of cities were analyzed, the study found that children born
in households found far away from urban centers tended to work much more than their urban
counterparts. The main reason for this is that rural children assist their parents on the farm and in
house chores, while urban children do not. It was also found that children who lived in the
proximity of cities or urban centers were far more likely to attend school (Fafchamps, 29).

© Marcelo Fuentes 2016 19
In a paper by Bent, where he analyzes the main reasons behind an increase in school
enrollment in the American education system, he points out that when taking the example of the
United States and tracing it back 80 years ago, the key determinants of school performance and
attendance laid on issues regarding transportation of students from rural to urban areas (where
schools were located) and compulsory school-attendance laws. However, due to rural areas’
remoteness, enforcement was much harder to apply to children living in areas far away from the
city centers, thus lowering the opportunity cost of child labor and increasing that of education
(Bent, 16-18).
Looking into some of the other effects which are caused by rapid urbanization, Zhang
found that one of the major effects of urbanization is a considerable decline in fertility rates, which
translates into rising investments per child relative to the output per worker, given that parents’
future expenditure expectations become dramatically lower. Zhang concludes saying that a key
issue to tackle if the education of rural citizens is to be improved is for there to be better
infrastructure bridging gaps between urban and rural communities (Zhang, 115).
In a study performed by Bertinelli, he finds that cities provide incentives for investments
in education by their residents, by arguing that urban areas provide higher returns to education
than suburban areas or even rural areas. He also shows that literacy rates and educational
attainment overall tend to be higher in urban areas in comparison to rural areas, arguing that urban
agglomerations have a positive externality effect on the educational attainment of children
(Bertinelli, 82).
© Marcelo Fuentes 2016 20
III. C. DEPENDENCY
Dependency represents the ratio of the number of people who are dependent on the
workforce, over the number of people who are part of the workforce. Therefore, its impact on
educational attainment is purely derived from the shape each country’s population pyramid is. In
light of Latin America as a whole tending towards a more ‘dependent society’ it is important to
understand the different impacts each demographic composition has. As Lutz explains, whenever
birth rates start to decline and there is a decrease in the young-age dependency ratio, this translates
into a demographic bonus, where families are able to invest more in healthcare and education due
to the low level of dependents (Lutz,14-16).
In 1974, in a theoretical study carried out by Becker, he formalized a theory on the shadow
price of children with respect to their number and quality. Becker states that the higher the quality
of children, the higher their marginal costs to families. Also, the higher the number of children,
the higher their overall costs to families, given that their marginal cost would then be multiplied
by a scalar quantity. Therefore, in the case of dependency for this study, what would be expected
is that the total cost of children to families would rise with increases in the level of dependents, as
budgetary constraints would tighten. (Becker, 81-82).
III. D. ANALPHABETISM
Parental schooling is typically the way intergenerational externalities are measured. In the
Latin American context, seeing that it was only as of recent that governments were able to achieve
literacy rates above 90%, it would be prudent to analyze analphabetism or its antagonist literacy
as equivalents of ‘years of parental schooling’. One of the main examples explaining the positive
© Marcelo Fuentes 2016 21
externality effect of parents’ schooling is Behrman’s paper on intergenerational mobility in Latin
America. As Behrman defends, the intergenerational returns to schooling become incredibly large
in the Latin American context, and on average the expectations to pursue further/more degrees in
the future increases by close to 25% solely due to the positive externality effect. Therefore,
children who are in high school feel far more motivated to excel when they see that their parents
had a higher level of educational attainment (Behrman, 17-19).
In a paper by Gropello, it is suggested that by promoting mass literacy and access to
primary education countries are far more likely to ensure that their citizens will be capable to
engage in 1) more efficient economic activities and 2) ensuring future generations will be able to
secure a secondary education. Furthermore, it is stressed that a top-to-bottom approach towards
education, such as early tracking, does not promote the overall academic performance of a
community given that it focuses too much on punctual issues as opposed to overarching issues. It
must be noted, however, that this study was carried out in Tanzania and Tunisia (Gropello, 47).
In a study performed by Chevalier, findings from ordinary least square regressions suggest
that there is strong evidence of intergenerational transmission of education from parents to children
after performing an ordinary least squares regression. Furthermore, this paper finds that the effects
are most significant for maternal over paternal education, and stronger on sons than on daughters.
Therefore, under this framework it would be safe to assume that in households with divorces where
mothers as opposed of fathers keep custody of the child (controlling for education), there should
be an overall positive effect on academic achievement (Chevalier, 14).
© Marcelo Fuentes 2016 22
III. E. UNEMPLOYMENT
According to Kieselbach, long-term unemployment is highly linked with social exclusion,
which is typically in the form of institutional isolation. As Kieselbach explains, whenever someone
becomes unemployed there is an increased dependence on the welfare state and the ability to
become financially independent decreases dramatically. At the same time, with unemployment
comes institutional exclusion, where one stops having access to both financial and health services
in the private sector, either due to an inability to pay or a lack of insurance. Thus, long-term
unemployment ultimately promotes further decline in the overall ability citizens have to improve
their social condition due to institutional and social exclusion (Kieselbach, 70).
III. F. PUBLIC EXPENDITURE
As reported by Avvisati, PISA results show a positive relation between the resources
invested in education and performance, but only up to a certain point, before the effect of these
plateau. Moreover, in this study it is also shown that regardless of the level of expenditure
performed by countries, those which were top performers tended to display a far more equitable
distribution of resources to both the socioeconomically advantaged and disadvantaged. Therefore,
there is an element of governance which also comes into play, when considering the investments
in education made by countries (Avvisati, 7).
In a report drafted by Menezes-Filho, it was seen that the mathematical proficiency of
students in public schools increased after teachers’ relative wages improved (thanks to localized
investment - FUNDEF). However, Menezes-Filho also points out that this effect is mainly
concentrated in municipal schools in the poorer neighborhoods of Brazil in both the Northern and
© Marcelo Fuentes 2016 23
North-Eastern regions of the country. This result suggests that localized investment in areas of
critical need is probably the most impactful policy to improve academic performance (Menezes-
Filho, 16).
In Lee’s papers on determinants of public expenditure, he finds that typically political
variables such as weak democracy, natural resource endowments and ethnic fractionalization will
tend to obstruct a government’s ability to make public expenditure in education have a significant
impact on adolescents’ educational outcomes. As he details, whenever a country has weak
democratic institutions the effectiveness of public expenditure on education as tool for improving
educational attainment will be low. Therefore, under this framework, considering the weak
institutional framework of Latin America, it would be reasonable to see public expenditure having
weaker effects on PISA scores for less developed countries (Lee, 110).
III. G. INFANT LABOR
A study performed by Levine details that infant labor, when performed in excess of twenty
hours a week, starts to negatively impact children’s overall academic performance. In his study, it
is highlighted that the cause of this relationship lies in that children with sleep debt will typically
suffer from brief lapses of attention, impaired memory and low creativity. All of this ultimately
translates into low performance and parental frustration, making household dynamics far tenser,
and making children perform at even lower levels (Levine, 175).
Levine also notes that while infant labor does indeed impact school attendance and
academic performance, in many cases adolescents who choose employment over education are
typically less engaged in school even before they enter the labor force. Levine also found that these
© Marcelo Fuentes 2016 24
children were far more likely to exhibit developmental dysfunctions than their ‘educated’
counterparts. Lastly, Levine also states that when minors enter the labor force, their educational
expectations lower, they cut class more often, delinquency and drug abuse increase, their overall
investment in education diminishes, and autonomy from parental control increases, which results
in far more disengaged students (Levine, 176-178).
On the other hand, in a study performed by Seref Akin, he suggests that school attendance
is not a substitute for child labor, since he found that children either combine both of these activities
or do neither and remain idle. Therefore, an increase in the overall level of child labor might not
necessarily have such a strong impact on the overall level of school enrollment. This study was
carried out in Sub-Saharan Africa, however, which is the region with the highest rate of child labor
worldwide (Seref Akin, 20).
III. H. DIVORCE RATE
As seen in annex #2, in cases of divorce the custody of children pass to the hands of women
in more than 85% of the cases, which implies that women in Brazil (and speculatively in the rest
of South America) have historically been and persist to be the ones who gain custody of children
in the event of a divorce. This fact should not be taken lightly, given that it is in these same
countries where we see a rather severe degree of institutional patriarchy which directly affects the
status and income of women. Furthermore, an added externality to this relationship is that
prospects of future gains in education decrease for women who belong to this category, given that
a vast majority will choose to stay home and opt for lower wages as opposed to pursuing higher
education (Annex #2; World Bank).
© Marcelo Fuentes 2016 25
In a study performed by Bernal, he finds maternal employment, which becomes far more
prevalent in families when couples divorce, typically has a negative effect on children’s
performance. Controlling for other factors, Bernal shows that an additional year of full-time work
is associated with a reduction of test scores of about 0.8%. This means that if a mother were to
work full time during the most critical years of her children’s childhood (0 to 10 years) we could
expect to see an overall decrease of test scores of close to 8% (Bernal, 46).
© Marcelo Fuentes 2016 26
IV. MODEL, THEORY & HYPOTHESES
IV. A. METHODOLOGY AND DATA
The central focus of this paper revolves around a series of models which will be estimated
using an ordinary least squares (OLS) multivariable estimator. However, before delving into the
specifics of every variable that is being used in this model, it is important to mention that while
analyzing this data one ought to know that PISA scores (this study’s dependent variable) are
diagnostic tests (pre-tests) given that there is no teaching involved to prepare students to take this
exam. Therefore, in this regard PISA scores measure purely the state of the students at time zero
without taking into account any kind of outside influence or treatments, since they are not being
purposely trained or prepared prior to taking the test (Wellington, 13-14).
Furthermore, this study will be measuring the impact each variable has on educational
outcomes but only from the point of view of the student, as opposed to the educators. The
underlying assumption here is that in spite of teacher quality having a considerable impact on the
quality of education children receive, many factors affecting child development and their
performance lie outside the reach of the school environments.
This project is based around Latin America and Brazil mainly due to their economic
relevance in the region, but also to a large extent, due to the availability of data for Brazil at the
more micro level and Latin America at the macro level. Given that, PISA scores are fairly young
in the world of education policy, and data availability for them is indeed scarce. Also, this analysis
tries to group Brazilian states and Latin American countries based on wealth, development and
geography, to have a better understanding of what the determinants of education attainment are in
specific latitudes or regions, regardless of their wealth and/or development.
© Marcelo Fuentes 2016 27
Having said this, for the purpose of this project, three multivariable OLS regressions have
been estimated. One uses cross-country data from six different countries: Argentina, Brazil, Chile,
Colombia, Peru and Uruguay. One uses regional data from the five regions of Brazil: Center-West,
North, Northeast, South and Southeast. And lastly, one uses state-wide data from all twenty-six
Brazilian states. This quantitative method of analysis was chosen as focal point of this study due
to the linear behavior that the independent variables of this study exhibit. Moreover, to reach
certain conclusions about each one of the variables, a set of mathematical models and functions
has been designed to help make sense of the economic forces which might be underlying each one
of the variables analyzed.
Also, in this regression there have been a series of controls installed to prevent issues of
geography and development from offsetting certain trends in the overall data. These can be seen
in the tables annexed in the last portion of this paper. Briefly, the controls used were as follows,
with their specific reasons:
South Cone dummies: the cross-country OLS model used controls for the countries of the
southern cone of Latin America (Argentina, Uruguay and Chile) due to their vastly higher
levels of wealth and development comparable to Peru, Colombia and Brazil as a whole.
Recession dummies: all the OLS models used here controlled for the recession, given that all
samples included observations for the year 2009; therefore, it is conceivable these observations
showed skewedness from their normal trend due to the 2008 recession.
Southern Regions Dummies: both the regional and state-wide OLS regressions control for the
southern regions of Brazil (the South and South-east regions of Brazil). Because these two
regions have been historically wealthier, more industrial and populated than the rest of the
© Marcelo Fuentes 2016 28
country, they would be expected to show very different statistics from those of the rest of
Brazil.
Metropolis dummies: only the state-wide OLS regression uses this variable to account for the
differences in development that states with large urban centers have. Thus, any state which has
a city with a metropolitan population larger than one million inhabitants was put under this
dummy variable (i.e. Curitiba, which has 1.87 mill inhabitants, is in the state of Parana;
therefore, all of Parana’s observation received a ‘1’ for the Metropolis dummy).
Regarding data concerns, this study has tried to perform (within what is possible) the fewest
number of manipulations of data for these analyses. This was possible since most observations
were drawn from either the World Bank Data Bank, for the cross-country regressions, or the IBGE
(Brazilian Institute of Statistics) for the regional and statewide regressions. Thus, very few
interpolations were carried out to find data for specific years. The variables for which minor
interpolations were performed were:
Public expenditure: there were some discontinuities for the Uruguayan and Argentinian
samples.
Unemployment: there were some discontinuities for Argentinian data.
Regarding the divorce rate per every 1000 citizens, to use a uniform metric, the gross
number of divorces per region/state was divided by the overall population of the region and then
multiplied times 1000 to eradicate the excessive number of decimal numbers present in the series.
For the logarithm of GDP per capita, a natural logarithm of the GDP per capita of the respective
Country/Region/State is used, as opposed to the gross GDP per capita, due to the exponential rate
of growth this variable exhibits.
© Marcelo Fuentes 2016 29
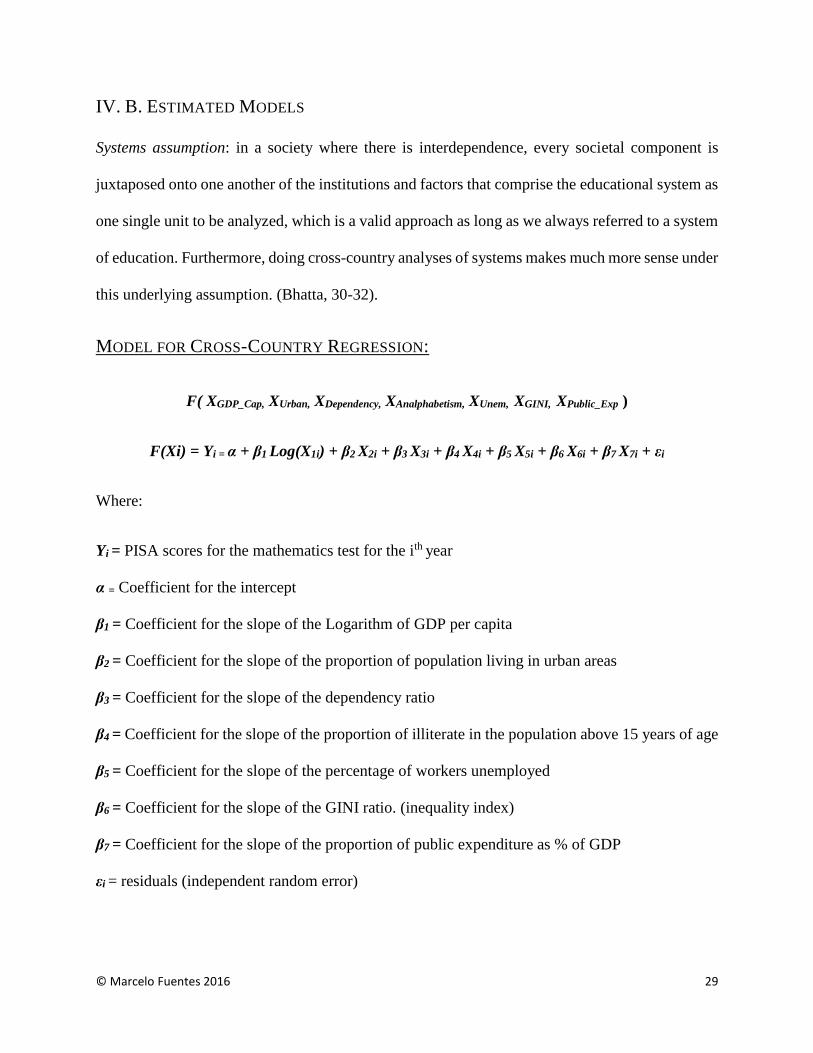
IV. B. ESTIMATED MODELS
Systems assumption: in a society where there is interdependence, every societal component is
juxtaposed onto one another of the institutions and factors that comprise the educational system as
one single unit to be analyzed, which is a valid approach as long as we always referred to a system
of education. Furthermore, doing cross-country analyses of systems makes much more sense under
this underlying assumption. (Bhatta, 30-32).
MODEL FOR CROSS-COUNTRY REGRESSION:
F( XGDP_Cap, XUrban, XDependency, XAnalphabetism, XUnem, XGINI, XPublic_Exp )
F(Xi) = Yi = α + β1 Log(X1i) + β2 X2i + β3 X3i + β4 X4i + β5 X5i + β6 X6i + β7 X7i + εi
Where:
Yi = PISA scores for the mathematics test for the ith year
α = Coefficient for the intercept
β1 = Coefficient for the slope of the Logarithm of GDP per capita
β2 = Coefficient for the slope of the proportion of population living in urban areas
β3 = Coefficient for the slope of the dependency ratio
β4 = Coefficient for the slope of the proportion of illiterate in the population above 15 years of age
β5 = Coefficient for the slope of the percentage of workers unemployed
β6 = Coefficient for the slope of the GINI ratio. (inequality index)
β7 = Coefficient for the slope of the proportion of public expenditure as % of GDP
εi = residuals (independent random error)
© Marcelo Fuentes 2016 30
Yi = YPISA_Math (Dependent Variable): PISA scores are used as the dependent variable of this study,
since PISA scores (derived from a homonymous exam designed by the OECD) aim to collect data
in the most objective way possible. Aggregate PISA scores typically factor in students’
performance in reading, writing and mathematics. However, for the purpose of this study and
seeing that the scope of this paper is to find the factors that affect the most impactful aspects of
learning (mathematics skills), only the mathematics portion of the PISA scores was chosen. The
basic intuition used here is that capital gains from reinforcing students’ skills in mathematics will
be greater than those from reading and writing. It is important to note that PISA scores are collected
every 3 years in different countries around the world.
* PISA scores were collected from a 2012 OECD Report
Log(X1i) = Log(XGDP_Cap): logarithm of GDP per capita, or the logarithm of the average economic
gains per year (GDP) for every citizen of the nation/state/region. (To account for changes in the
currency value, all the series have been deflated using either the value of 2005 US Dollars ($) for
the cross-country model or 2008 Brazilian Reais (R$) for the Brazilian models). Logarithm of
GDP per capita and not GDP per capita, has been used to account for the exponential growth rate
both GDP and populations experience. For the purpose of this study the logarithm of GDP per
capita is used a proxy/estimate of the average level of income citizens of a country/region/state
enjoy. Moreover, this variable is defined in these models as the budgetary constraints of the
students’ families. Therefore, given that PISA scores are dependent on students’ families’ ability
to pay for education, we will argue that Log(xGDP_Cap) is positively correlated to PISA scores and
will have a positive beta. A higher budget implies a higher ability to pay for health and education
and a lower budget vice versa. * *Data
was collected from the World Bank Databank

© Marcelo Fuentes 2016 31
X2i = XUrban : this variable is defined by the World Bank as the proportion of the population that
lives in urban areas as a percentage of the total. Urbanization was chosen as a variable due to the
positive externality effect that urban societies have on the upbringing of children. As several papers
mention, there are stark difference between the quality of life and education in urban areas vis-a-
vis the quality of education in rural areas; this assumption has been called urban advantage.
‘We are used to thinking of urban children as being better off than rural children in every way –
better fed, better educated, with better access to health care and a better chance of succeeding in
life. For many children, this is true’ (World Vision, 14).
In formulating this advantage we ought to think about not only the marginal cost of attending
school for children/adolescents that live in rural areas, but also the benefits that children receive
from living in urban areas. Also, what might be some relationships between these variables
allegedly:
GAttend_School= QDays*CRural (XTrans, XHours Lost, XServices .... Xi)
BAttending_School = PQDays
UAttend_School = B(P,QDays)– G(C,QDays)
Where ↓G = ↑ UAttend_School
And MUAttend_School > 0
∴ (𝜕𝑈
𝜕𝐵) (
𝜕𝐵
𝜕𝑄𝑑) + (
𝜕𝑌
𝜕𝐺) (
𝜕𝐺
𝜕𝑄𝑑) = P – C = βUrban
G is the function for the cost of attending school. QDays is the quantity of days children have to
attend school. CRural is the marginal cost of attending school. XTrans, represents the transportation
© Marcelo Fuentes 2016 32
costs for children in rural areas (which are considerably higher than those of their urban
counterparts) as they are closer to urban schools. XHours Lost represents the number of hours lost due
to travelling from rural to urban areas. XServices shows services in rural areas tend to be not only
scarcer but also much more expensive than those in urban areas. (Xi represents any other shadow
costs implicit in rural living).
B is the budget allocated to attending school, consisting of the financial, physical and
psychological endowments adolescents require to attend school and increase their human capital
while doing so. Thus, P is the marginal budget allocated to school attendance. MU must be strictly
greater than zero every day for children not to miss class.
Therefore, the expected beta of XUrban would be positive, given that with higher levels of
urbanization the cost of education should be lower (vis-à-vis those living in rural areas) and the
utility obtained from going to school is higher. Therefore, more urbanized societies should display
higher PISA scores.
* Data was collected from the World Bank Databank
X3i = XDependency: dependency as defined by the World Bank and the IBGE is a ratio of the number
of people over the aged 65 or older, plus those ages 15 or younger, divided by the number of people
who are those who are ages 16-64. Dependency is a variable that will be used to measure the
impact of demographic changes on Latin American families, focusing particularly on the
proportion of income which can be allocated to children’s development from both families and
governments. The underlying assumption is that higher levels of dependency imply tighter
budgetary constraint on families (as wage-earners need to support not only their young but also
the elderly). But also, higher levels of dependency translate into higher pressure on governmental
© Marcelo Fuentes 2016 33
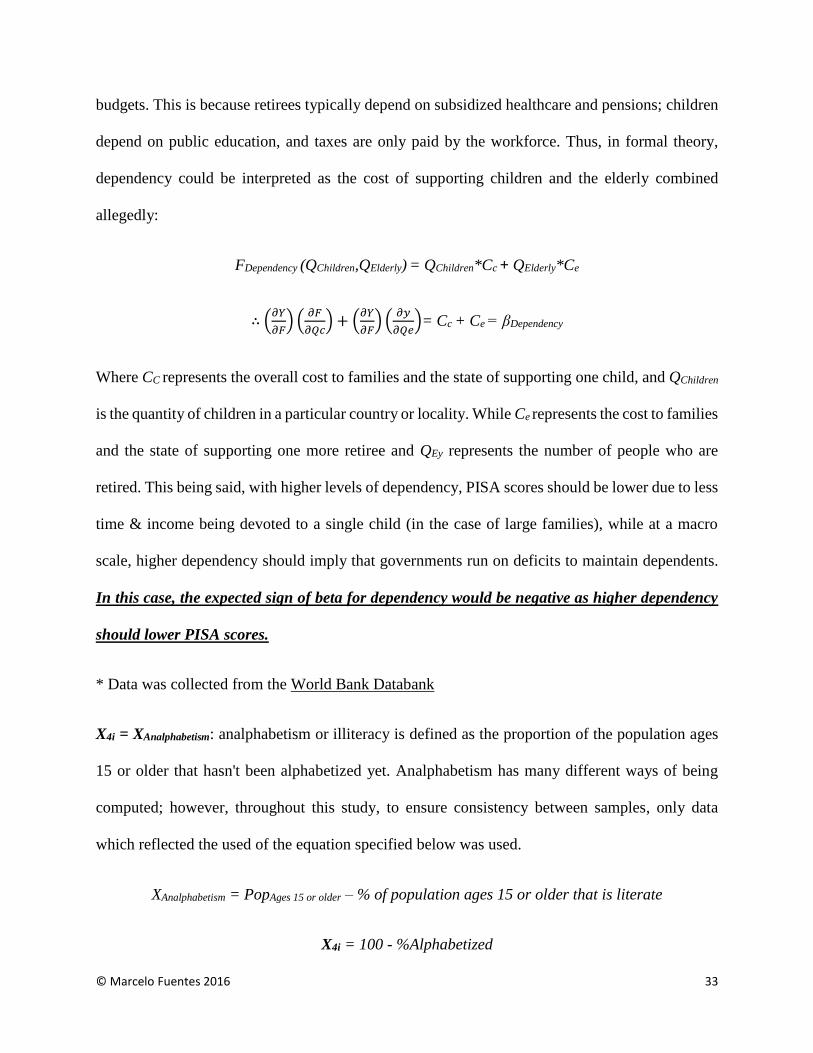
budgets. This is because retirees typically depend on subsidized healthcare and pensions; children
depend on public education, and taxes are only paid by the workforce. Thus, in formal theory,
dependency could be interpreted as the cost of supporting children and the elderly combined
allegedly:
FDependency (QChildren,QElderly) = QChildren*Cc + QElderly*Ce
∴ (𝜕𝑌
𝜕𝐹) (
𝜕𝐹
𝜕𝑄𝑐) + (
𝜕𝑌
𝜕𝐹) (
𝜕𝑦
𝜕𝑄𝑒)= Cc + Ce = βDependency
Where CC represents the overall cost to families and the state of supporting one child, and QChildren
is the quantity of children in a particular country or locality. While Ce represents the cost to families
and the state of supporting one more retiree and QEy represents the number of people who are
retired. This being said, with higher levels of dependency, PISA scores should be lower due to less
time & income being devoted to a single child (in the case of large families), while at a macro
scale, higher dependency should imply that governments run on deficits to maintain dependents.
In this case, the expected sign of beta for dependency would be negative as higher dependency
should lower PISA scores.
* Data was collected from the World Bank Databank
X4i = XAnalphabetism: analphabetism or illiteracy is defined as the proportion of the population ages
15 or older that hasn't been alphabetized yet. Analphabetism has many different ways of being
computed; however, throughout this study, to ensure consistency between samples, only data
which reflected the used of the equation specified below was used.
XAnalphabetism = PopAges 15 or older – % of population ages 15 or older that is literate
X4i = 100 - %Alphabetized
© Marcelo Fuentes 2016 34
Thus, adult analphabetism gives us an index of how instructed family members and parents of the
high school children being used for this study really are, especially given that analphabetism uses
data of the population ages 15 or older. Now, for the case of dependency we will be assuming that
there is an intergenerational educational transmission, which implies that when parents are
educated, children will typically receive a positive externality from their education; therefore, in
this case we could expect that with lower levels of analphabetism there should be higher PISA
scores. Therefore, since lower levels of analphabetism should translate into higher
intergenerational transmissions of education, we can expect this variable to have a negative beta.
It must be noted, however, that although both analphabetism and PISA scores are variables that
measure educational attainment, PISA scores are only based on adolescent mathematics
performance and our analphabetism variable is solely based around adults’ ability to read and
write,. Thus, this variable is not perceived to be endogenous to the model.
* Data was collected from the World Bank Databank
X5i = XUnem: unemployment rate is defined by the World Bank as the number of people unemployed
divided by the total number of people in the workforce. Thus, working under pre-established
frameworks it is understood that higher unemployment should lead to higher social and
institutional exclusion of those who are unemployed, making it increasingly more difficult to find
a future job, but also for the unemployed to find any kind of benefits or access to certain
institutions. Furthermore, higher unemployment implies a great restriction on both the short term
as well as long-term budgetary constraints at the micro level. Also, unemployment might drive
children to be motivated to work to expand the family budget, but in doing so negatively impact
their academic performance.
© Marcelo Fuentes 2016 35
Children of unemployed parents’ short term expected return on education
↑UUnemployment = ↓ EShort-Term(rEducation)
Parents’ budgetary constraint becomes tighter
↑UUnemployment =↓ IParents
Therefore, for XUnem what would be expected is that with higher levels of unemployment there
should be an overall decrease in the PISA scores observed - negative Betas.
* Data was collected from the World Bank Databank
X6i = XGINI: is a variable which measures the economic inequality present in a region, state or
country. It is assumed that with higher levels of economic inequality the quality of education of
the country or region will decrease, given that there will be fewer resources devoted to the general
population. This is a result of people’s expectation of the quality of public education being
mediocre at best, given that few resources are devoted to equalize the overall state of inequality
(this is particularly true for the Latin America case).
Higher inequality translates into lower expectations of the value of public education
↑GINI = ↓ E(VPublic Education)
Lower expected value of education translates into low expected return on education – thus,
lowering attendance and academic performance
↓ E(VPublic Education) = ↓ EShort-Term(rEducation)

© Marcelo Fuentes 2016 36
Therefore, from seeing this relationship, it can be said that the expected beta should be negative
given that with higher inequality, PISA scores should be lower.
* Data was collected from the World Bank Databank
X7i = XPublic_Exp: this variable measures the level of investment federal governments make towards
children/infrastructure in the secondary education system relative to the overall GDP per capita
of the country. This variable aims to measure the overall level of investment a nation is making
towards children and adolescents that are part of the secondary education system. Therefore, with
higher levels of public investment in education at the national level we could expect to see higher
PISA scores in the respective country. This being the case, we could expect to see a positive beta,
given that higher endowments should translate into higher PISA scores.
* Data was collected from the World Bank Databank
© Marcelo Fuentes 2016 37
MODEL FOR INTERREGIONAL REGRESSION:
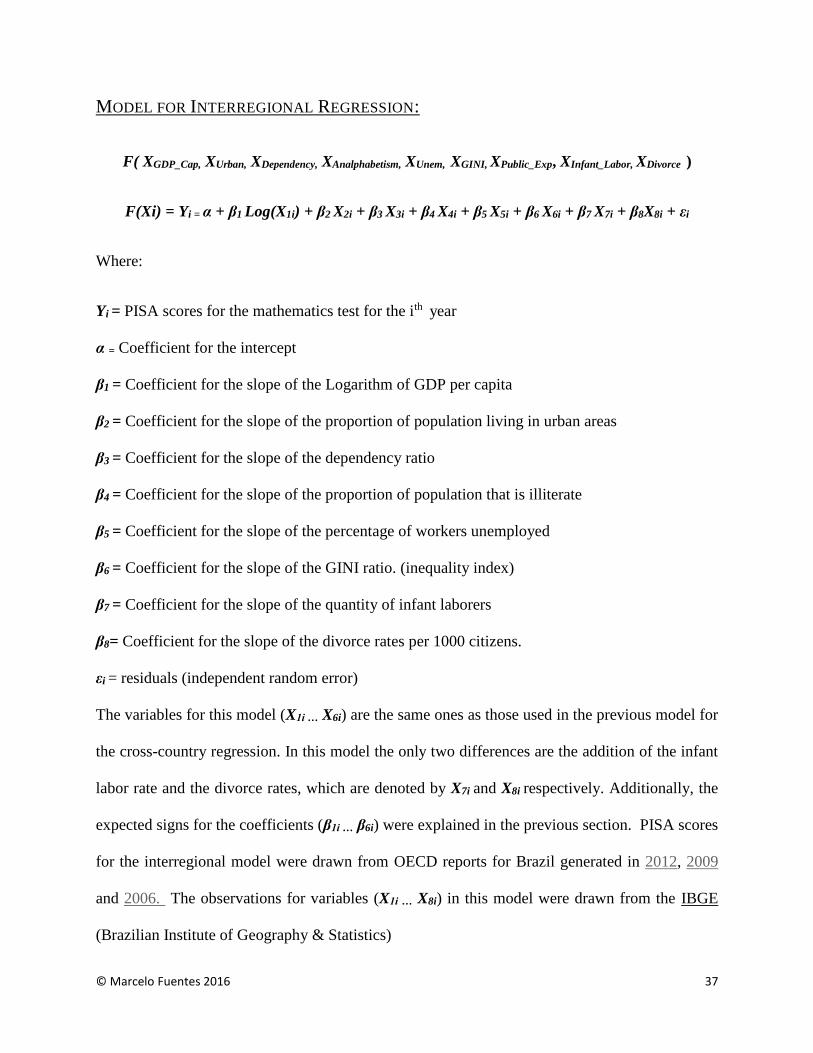
F( XGDP_Cap, XUrban, XDependency, XAnalphabetism, XUnem, XGINI, XPublic_Exp, XInfant_Labor, XDivorce )
F(Xi) = Yi = α + β1 Log(X1i) + β2 X2i + β3 X3i + β4 X4i + β5 X5i + β6 X6i + β7 X7i + β8X8i + εi
Where:
Yi = PISA scores for the mathematics test for the ith year
α = Coefficient for the intercept
β1 = Coefficient for the slope of the Logarithm of GDP per capita
β2 = Coefficient for the slope of the proportion of population living in urban areas
β3 = Coefficient for the slope of the dependency ratio
β4 = Coefficient for the slope of the proportion of population that is illiterate
β5 = Coefficient for the slope of the percentage of workers unemployed
β6 = Coefficient for the slope of the GINI ratio. (inequality index)
β7 = Coefficient for the slope of the quantity of infant laborers
β8= Coefficient for the slope of the divorce rates per 1000 citizens.
εi = residuals (independent random error)
The variables for this model (X1i … X6i) are the same ones as those used in the previous model for
the cross-country regression. In this model the only two differences are the addition of the infant
labor rate and the divorce rates, which are denoted by X7i and X8i respectively. Additionally, the
expected signs for the coefficients (β1i … β6i) were explained in the previous section. PISA scores
for the interregional model were drawn from OECD reports for Brazil generated in 2012, 2009
and 2006. The observations for variables (X1i … X8i) in this model were drawn from the IBGE
(Brazilian Institute of Geography & Statistics)
© Marcelo Fuentes 2016 38
X7i = XInfant_Labor: infant labor rate is defined as the proportion of people between the ages of 10 to
15 who are currently working/employed in the labor force either formally or informally. It is
possible that up to a certain degree XUnem would show correlation with this variable. However, the
goal of using this variable is to show the impact children’s decisions have on their academic
performance (since working and attending school are typically mutually exclusive). It is
understood that for child labor the expected utility of going to school is lower to that of going into
the labor force. However, understanding the impact this decision has on educational attainment
has to be considered particularly since policy should aim to increase the quality of children’s
educational institution, but also increase their expected utility of studying vs. working. With this
said, literature indicates that working children typically devote less time to academics, lowering
academic performance:
↑TWorking = ↓TStudying ∴ ↓PAcademics
Since, as children work more, their investment in education decreases, lowering the marginal cost
of missing class & lowering the expected return to education (trapping them in a spiral of low
attendance, low investment and low performance)
↑TWorking = ↓MCMissing_Class & ↓E(rEducation)
Therefore, using infant labor as a variable of study in relationship to children’s educational
attainment has two elements, one of which is shedding clarity on what is keeping students from
attending school, and a second one being understanding the relationship between adult
unemployment and infant labor. Hence, under this analysis, with a higher infant labor rate (and
lower school attendance) we should be seeing lower PISA scores and negative betas.
* Data was collected from the IBGE (Brazillian Institute of Geography & Statistics)
© Marcelo Fuentes 2016 39
X8i = XDivorce : divorce rate per one thousand people is defined as the gross number of divorce
filings that are performed in a year, divided by the overall population of the region/state these
occurred in, times one thousand. Several studies have proven that divorces tend to harm children’s
psychological and emotional development, potentially leading them to underperform in school.
Moreover, due to divorces pushing mothers to become part of the workforce, their investment in
their children lowers, which ultimately translates into neglected children who underperform. Also,
to understand the importance of this issue it is helpful to know that custody of children in divorce
cases is won by women 85+% of the time, and unless the receive alimony, it is most likely mothers
will go back to the workforce. Therefore, with higher divorce rates we should be seeing lower
PISA scores and negative betas.
* Data was collected from the IBGE (Brazilian Institute of Geography & Statistics)
© Marcelo Fuentes 2016 40
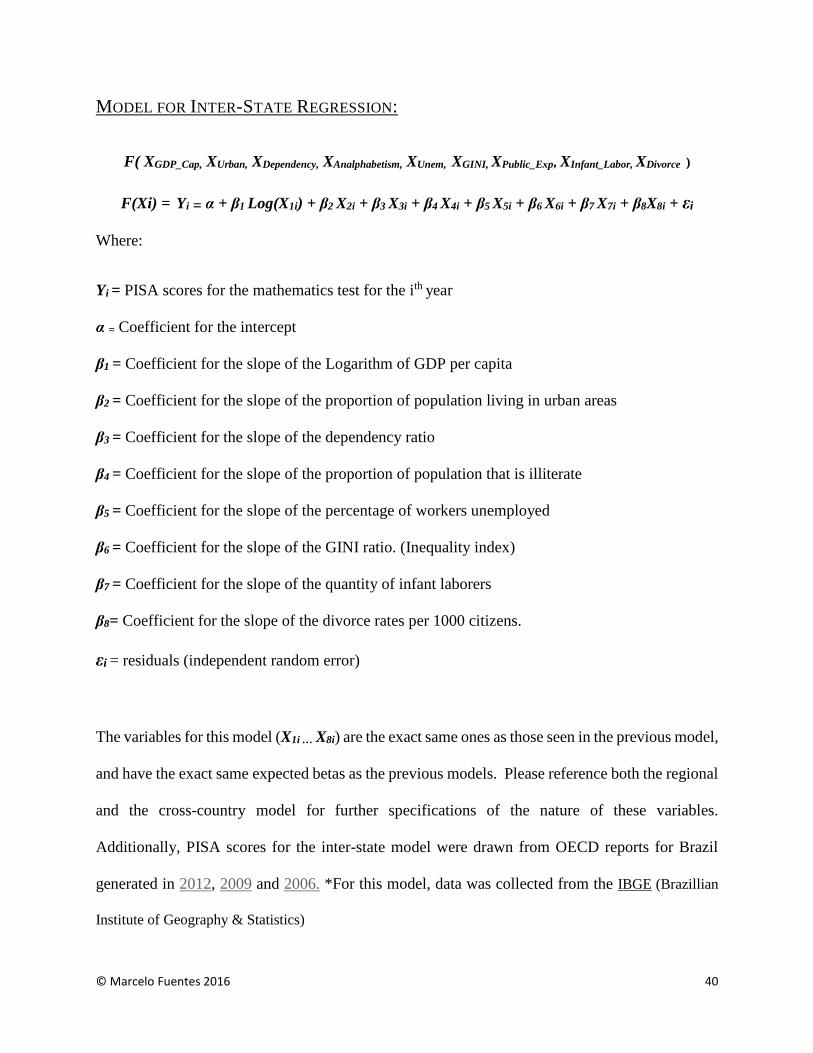
MODEL FOR INTER-STATE REGRESSION:
F( XGDP_Cap, XUrban, XDependency, XAnalphabetism, XUnem, XGINI, XPublic_Exp, XInfant_Labor, XDivorce )
F(Xi) = Yi = α + β1 Log(X1i) + β2 X2i + β3 X3i + β4 X4i + β5 X5i + β6 X6i + β7 X7i + β8X8i + εi
Where:
Yi = PISA scores for the mathematics test for the ith year
α = Coefficient for the intercept
β1 = Coefficient for the slope of the Logarithm of GDP per capita
β2 = Coefficient for the slope of the proportion of population living in urban areas
β3 = Coefficient for the slope of the dependency ratio
β4 = Coefficient for the slope of the proportion of population that is illiterate
β5 = Coefficient for the slope of the percentage of workers unemployed
β6 = Coefficient for the slope of the GINI ratio. (Inequality index)
β7 = Coefficient for the slope of the quantity of infant laborers
β8= Coefficient for the slope of the divorce rates per 1000 citizens.
εi = residuals (independent random error)
The variables for this model (X1i … X8i) are the exact same ones as those seen in the previous model,
and have the exact same expected betas as the previous models. Please reference both the regional
and the cross-country model for further specifications of the nature of these variables.
Additionally, PISA scores for the inter-state model were drawn from OECD reports for Brazil
generated in 2012, 2009 and 2006. *For this model, data was collected from the IBGE (Brazillian
Institute of Geography & Statistics)
© Marcelo Fuentes 2016 41
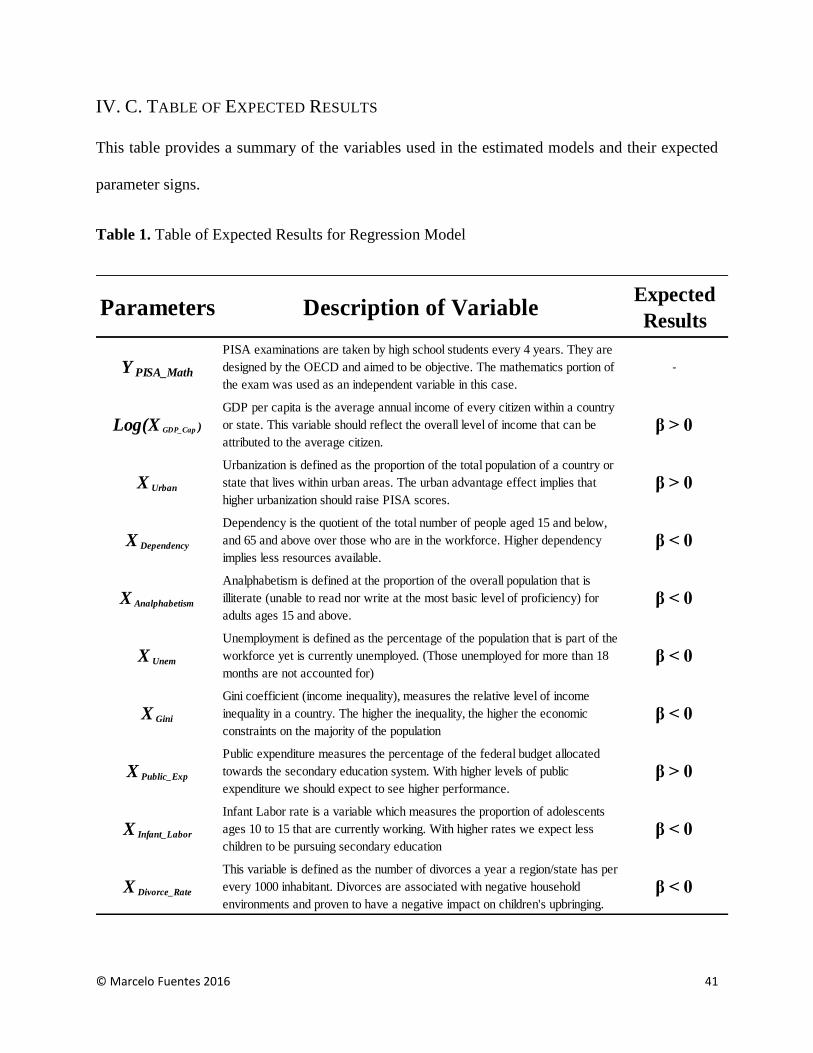
IV. C. TABLE OF EXPECTED RESULTS
This table provides a summary of the variables used in the estimated models and their expected
parameter signs.
Table 1. Table of Expected Results for Regression Model
Parameters Description of Variable Expected
Results
Y PISA_Math
PISA examinations are taken by high school students every 4 years. They are
designed by the OECD and aimed to be objective. The mathematics portion of
the exam was used as an independent variable in this case.
-
Log(X GDP_Cap )
GDP per capita is the average annual income of every citizen within a country
or state. This variable should reflect the overall level of income that can be
attributed to the average citizen.
β > 0
X Urban
Urbanization is defined as the proportion of the total population of a country or
state that lives within urban areas. The urban advantage effect implies that
higher urbanization should raise PISA scores.
β > 0
X Dependency
Dependency is the quotient of the total number of people aged 15 and below,
and 65 and above over those who are in the workforce. Higher dependency
implies less resources available.
β < 0
X Analphabetism
Analphabetism is defined at the proportion of the overall population that is
illiterate (unable to read nor write at the most basic level of proficiency) for
adults ages 15 and above.
β < 0
X Unem
Unemployment is defined as the percentage of the population that is part of the
workforce yet is currently unemployed. (Those unemployed for more than 18
months are not accounted for)
β < 0
X Gini
Gini coefficient (income inequality), measures the relative level of income
inequality in a country. The higher the inequality, the higher the economic
constraints on the majority of the population
β < 0
X Public_Exp
Public expenditure measures the percentage of the federal budget allocated
towards the secondary education system. With higher levels of public
expenditure we should expect to see higher performance.
β > 0
X Infant_Labor
Infant Labor rate is a variable which measures the proportion of adolescents
ages 10 to 15 that are currently working. With higher rates we expect less
children to be pursuing secondary education
β < 0
X Divorce_Rate
This variable is defined as the number of divorces a year a region/state has per
every 1000 inhabitant. Divorces are associated with negative household
environments and proven to have a negative impact on children's upbringing.
β < 0
© Marcelo Fuentes 2016 42
V. FINDINGS
This section presents the findings from the multiple regressions performed (which can be found in
the tables subsection). Note that throughout this analysis, Table 1 is referenced continuously (Table
1), since it is being used as the base reference for the findings presented in this section.
V. A. CROSS-COUNTRY MODEL
On Table 2a, we have the cross-country model’s table of summary statistics, where some
of the characteristics of the model’s raw data have been conveniently displayed for the reader’s
ease. The results for the regression for the cross-country model are displayed in Table 2b.
Analyzing the results for the complete regression model (1), it can be seen that the most supportive
results are given by the variables urbanization and dependency. The findings for these effects
reveal statistically significant t-statistics and betas that are in agreement with the theoretical
framework aforementioned as well as previous findings made by Fafchamps, 2004, Zhang, 2002,
and Lutz 2013. Further evidence of these relationships was plotted in a scatter graph found under
annexes #3 and #4 to shed more clarity on the relationship between these variables and PISA
scores.
Furthermore, these results also check for robustness as their significance remains when the
model is subjected to fewer controls, as can be seen in (4). Taking a closer look at the best fitted
lines plotted in annexes #3 and #4, it can be seen that more than half of the variability in PISA
scores at the international level may be explained by changes in urbanization and dependence, as
their graphs exhibit R2‘s of 0.175 and 0.546 respectively.
Additionally, (1) also finds that analphabetism rates also share a statistically significant
negative relationship with PISA scores, which supports the theory of intergenerational returns to
© Marcelo Fuentes 2016 43
schooling. However, this relationship dissipates when the model is run without the recession and
south cone variables, as can be seen in models (3) and (4). Interestingly, both unemployment rate
and public expenditure appeared to hold little to no relationship with PISA scores, as can be seen
in all four regressions. The results for these explanatory variables oscillate between positive and
negative betas which are statically insignificant.
Also, (1) shows that logarithm of GDP per capita affects PISA scores in a way which
contradicts the theory, as can be seen by comparing the value of the betas with those from Table
1. Gini coefficients show an unstable, insignificant, yet undeniably positive relationship with PISA
scores, which also goes against what was expected, as specified in Table 1. However, it is
important to note that when comparing (2), (3) and (4) to the results in (1) the statistical
significance of logarithm of GDP per capita as a determinant of PISA scores remains, which poses
a major issue under the framework of this study.
V. B. REGIONAL MODEL
On Table 3a, we have the interregional model’s table of summary statistics, where some of
the characteristics of the model’s raw data can be seen for the reader’s ease. For this model,
findings are being drawn from Table 3b of regression results. Starting with the results from model
(1), the best results obtained from this regression were those for the relationship between
unemployment rate and PISA scores. Given that, we find this relationship to be both negative and
statistically significant, which is in accordance to what had been suggested by the theory presented
before. For further clarity, this relationship has been plotted in a scatter graph found in annex #5,
under the annex section of this paper.
© Marcelo Fuentes 2016 44
Looking at (1), both divorce rates and infant labor rate appear to have a negative
relationship with PISA scores, which is in agreement to what was expected, as seen in table 1.
However, only (2) shows evidence of a significant relationship for divorce rates with PISA scores,
and only (1) shows a semi-significant relationship between infant labor rates and PISA scores. The
lack of robustness from other regressions to substantiate this analysis places some doubt on any
claim regarding the relationship between these variables and PISA scores.
On the other end, (1) shows that GDP per capita, urbanization and analphabetism hold little
to no relation with PISA scores at the regional level. However, in spite of the base model indicating
otherwise, results from regressions (3) and (4) would indicate urbanization might have a significant
positive relation with PISA scores at the regional level, which is in agreement with what had been
plotted in table 1. Similar assumptions can be made for GDP per capita, when looking at the results
obtained from (2).
This being said, some problematic results were obtained from two variables, which show
significant relations that are in contradiction to what the theory stipulated. While dependency
shows a significant effect in (1), this relationship to PISA scores appeared to fade away when the
model was estimated without specific controls in (2), (3) and (4). Thus, this result suggests a lack
of robustness, and a weakening argument in defense of this explanatory variable, going against
what had been expected. Gini coefficients on the other end appear to have strong and contradictory
results for models (1) and (2). However, this relationship fizzled in models (3) and (4) ultimately
showing a lack of robustness.
© Marcelo Fuentes 2016 45
V. C. INTER-STATE MODEL
Lastly, on table 4a we have the inter-state model’s table of summary statistics, where some of the
characteristics of the model’s raw data are conveniently showcased for the reader’s ease. The table
of regression results, which pairs with this model, is table 4b.
Considering the results for (1), the most supportive results obtained from this regression
were those for unemployment, dependency and analphabetism rate. The latter two display the most
uniform results throughout the five different regression rounds performed. These three variables
gave both statistically significant and signs that support what had been outlined in table 1.
Moreover, it is important to highlight that both dependency and analphabetism have results
significant at the 1% level for all regression runs, which goes to show that this relationship is
particularly strong and robust. Having said this, unemployment also shows highly significant
results, which are in agreement with theory throughout all the runs (1) through (5). Scatter graphs
were plotted for dependency, analphabetism and unemployment rates against PISA scores in
annexes #6, #7 and #8 respectively, to serve as visual guidance of the distribution and behavior of
the sample.
Infant labor rate is also a variable which showed significance in (1) and (2), and had signs
that matched expected results in Table 1. However, once the control for the southern regions of
Brazil was taken away, results show the relationship between this variable and PISA scores fizzled,
as can be seen in runs (3), (4) and (5). However, considering that the betas obtained are consistently
positive throughout all the runs, it could be said that infant labor does hold a negative yet weak
relationship to PISA scores. In this model, we also see that urbanization does not have a significant
relation with PISA scores, with t-statistics approaching zero at times, as seen in (3), deeming these
results statistically insignificant.
© Marcelo Fuentes 2016 46
Lastly, (1) gives us results which are consistent with the results seen in both Tables 2b and
3b, yet (once again) problematic considering that they are opposite in sign to what the theory
indicates. In Table 4b, Gini coefficients and GDP per capita show significant relations to PISA
scores, yet they contradict the theory stipulated earlier. Furthermore, in this model, we find
logarithm of GDP per capita was not robust when the model was run without controls, as can be
seen in (3), (4) and (5). However, when looking at the results given by Gini coefficients, looking
at runs (2) to (5), results are significant and betas are positive, which is troubling considering the
scope of this paper, yet valuable given that it supports the overall trends which have been seen in
previous models.
© Marcelo Fuentes 2016 47
VI. DISCUSSION
In summary, the most supportive results from this analysis were those for dependency,
urbanization, unemployment and analphabetism. Starting with dependency, it is incontrovertible
that Latin America has issues of both decreasing mortality rates and high birth rates. This implies
that if trends continue as they are, dependency in the region will be destined to increase in
following years. Therefore, something to pay attention to is the fact that dependency had a far
stronger impact on PISA scores at the international level than it did at the Brazilian inter-state
level, something which sheds light on a major issue present in the region.
As long as Latin American countries choose not to expand their social retirement plans and
public education systems, demographic changes will persist as major determinants of educational
attainment in the region. In Brazil’s case, due to its policies of social inclusion and welfare, we see
educational outcomes being less susceptive to fluctuations in the demographic structure of the
country, something which might not be said of the rest of Latin America. With this said, findings
suggest a one percent increase in dependency at the international level represents a decrease in
PISA scores of close to 5.5 points, while at the Brazilian inter-state level a one percent increase in
dependency translates into a mere decrease in PISA scores of close to 2.5 points. Therefore, seeing
these results it could be argued that Latin American policy makers should pay closer attention to
their public pension plans, as well as increasing both the quality and the funding of their public
education systems (ideally, using the same techniques used by FUNDEF and FUNDEB).
Regarding unemployment, we can see that across the board, unemployment in Latin
America and in Brazil impacts PISA scores negatively. However, when looking at international
© Marcelo Fuentes 2016 48
regression results we see unemployment impacts PISA scores in an insignificant manner. Still,
when looking at Brazilian regional and state level results we see unemployment has far more
significant and pronounced effects on PISA scores. It is also worth noting that changes in
unemployment have at the regional level have a much higher impact than those seen at the state
level, implying that there is probably a compounding effect present. Seeing that, a one percent
increase in unemployment rates decreases PISA scores by an average of 2.4 points at the Brazilian
state, and 19.3 points at the regional level. This stark different might be justified when considering
Brazilian regions as economic clusters which may be analyzed with the eyes of a macroeconomist.
The reason behind unemployment’s strong impact on PISA scores at the region level might
lay in that, while unemployment in certain states is probably associated with industrial cycles
experienced homogenously within regions, regional unemployment is probably driven by forces
that are far more immutable and powerful in nature (i.e. loss in competitiveness in the agrarian
sector, for example). Therefore, changes in unemployment at the regional level are likely to have
a strong impact on PISA scores at the regional level because they reflect the economic outlook of
a region as a whole. On a side note, it is important to note that unemployment regression results at
the international level might have not yielded the expected results because natural levels of
unemployment are determined domestically by each country. Hence, variations from mean or
historical unemployment levels for the cross-country regressions might have been a better option
in this case (as opposed to using raw unemployment statistics).
Regarding urban development, it seems to be that urbanization is a major determinant of
educational attainment at the international level. However, these results do not appear either at the
regional or at the interstate level. Thus, what this relationship suggests is that while major
infrastructural developments probably do contribute to the overall educational performance of
© Marcelo Fuentes 2016 49
countries as a whole (i.e. roads, public hospitals, schools, public transportation, etc. improve the
quality of life citizens of a country enjoy at a macro scale), at a more micro scale, increases in
urbanization might be less impactful on the overall quality of life citizens of a specific locality
might enjoy, since improvements at a micro level will tend to develop at a slower pace in
comparison to those where the federal government is involved (i.e. improved local lighting will
not have the same impact as the implementation of a full-fledged road bridging two localities).
What these results suggest is that when it comes to urban development, federal and not
local governments should be taking more action to bridge the gap between isolated, rural and
impoverished communities and those urban ones where educational centers are. Also, to explain
this lack of correlation at the micro level, it could be argued that slums/barrios/favelas also find
themselves to be secluded from the metropolitan areas of major cities. Therefore, changes in
urbanization under this context might be ultimately trivial in matters of improving educational
attainment, simply because urban advantages are typically felt whenever strong interventions from
the federal government bridge these isolated communities (something which local governments
fail to do).
When it comes to analphabetism, results suggest that at the inter-regional level, adult
literacy has little to no impact on the overall educational attainment of children. However, when
taking a look at inter-state-level regression results, the story being told by these results is quite
different. Since it seems that while results show that at a macro scale overall adult illiteracy has no
major impact on the aggregate performance of adolescents in mathematics, at the inter-state level
results indicate this relationship to work otherwise.
© Marcelo Fuentes 2016 50
What is observed is that analphabetism’s significance increases when we pass it through
data that is more granular in nature. Therefore, it could be argued that analphabetism may be seen
as less of a federal concern, considering the results obtained at the macro level (since PISA scores
are not affected by changes in the overall alphabetization of a country’s citizens). However, given
that the state level puts in evidence that there is a strong relation (even if the slope is small), it
could be argued that addressing illiteracy should be proposed as a long-term goal of federal
governments, given that national PISA score performance will not increase dramatically if federal
governments draw most of their attention to illiteracy. However, these results suggest that
empowering local governments to improve literacy within their localities should be pursued.
Regarding infant labor and divorce rates, further study might be required to make stronger
claims on their relevance as determinants of educational attainment within Brazil, given that results
were not as salient as those for variables previously explained. While infant labor displayed
coefficients in agreement with what had been expected in models (1) and (2) at the interstate level
and in model (1) at the regional level, there was a lack of robustness in subsequent regression runs
at both the regional and the state level, suggesting infant labor might be a significant determinant
of educational attainment when controlling for other confounding factors; however, arguing it is
the root cause of decreasing educational attainment in Brazil would be excessive. Furthermore, the
fact that coefficients for this variable are considerably higher at the regional level in comparison
to the state level would indicate that this issue should be addressed by regional governments
instead of local ones.
On the end of divorce rates, considering the fact that at the regional level only regressions
(2) and (4) displayed significant and supporting results and that, at the inter-state level, only
regressions (1) and (2) displayed significant results (even though they contradicted what theory
© Marcelo Fuentes 2016 51
stipulated) sheds led on a series of issue, divorce rates in southern states appear to have significant
effects on children’s educational attainment. But also, results indicate that a one unit increase in
divorce rates appears to have severe consequences in adolescent educational attainments, since the
effects seen are negative 25 PISA scores at the state level and positive 100 PISA scores at the
regional level. However, this duplicity only sheds light on the magnitude of the effect this variable
has on educational attainment, but not the true nature of its effect, since results are unclear.
However, it could be possible that with more trials and larger datasets this study could find
evidence of clearer relations between these two variables. But for now, this is all that we may
claim.
Some of the results which were conflicting with the aforementioned theory were those for
GDP per capita and income inequality. Originally it had been proposed that increasing GDP per
capita would have a significant positive impact on PISA scores, and that inequality was going to
have a significant negative impact on PISA scores. However after testing several models at both
the macro and the micro level, the results were completely opposite to what had been originally
proposed. One theory for these contradicting results might be that income inequality ultimately
pushes the general population to have a much stronger drive to rise and perceive education as a
safe long-term investment given their uncertain futures. GDP per capita’s contradicting results
might be the result of a GDP growth being driven not by human capital gains but rather due to
resource exports, which might explain the lack of human capital gains with increasing GDP per
capita.
Lastly, regarding public expenditure, due to the large amount of inconsistency in results
and statistical insignificance, it is clear that little to no conclusions can be drawn from these results
and most importantly that public expenditure per student in the secondary education system might
© Marcelo Fuentes 2016 52
not be the best explanatory variable to understand what drives educational attainment.
Furthermore, this study suggests that, whenever public expenditure in education will be used as an
explanatory variable, future researchers should be wary of what kind of ‘public expenditure’ they
are using. In this study, public expenditure on education in a country’s secondary education system
is used, since considering solely what is devoted to students in the secondary education system
might not be the best iteration of this variable for a study of this nature. Furthermore, it is possible
public expenditure effects on education attainment might suffer of a slight degree of delay, which
is not being accounted for in this study. Caveats aside, our study provides evidence that public
expenditure in the secondary education system does not drive adolescents’ educational attainment.
Furthermore, in the future, Latin American nations might want to use models such as FUNDEF’s
or FUNDEB’s when in search of better results, since Brazil appears to have a good record in this
regard so far.
© Marcelo Fuentes 2016 53
VII. CONCLUSION
This paper evaluates the different impacts a set of social and economic variables have on
the overall educational attainment of adolescents in Latin America, by using PISA scores as the
study’s dependent variable. This study finds that urbanization, dependency and unemployment
appear to be significant determinants of educational attainment in Latin America, while estimated
effects that support the theory and are statistically significant variables, such and infant labor and
divorce rates, generated mixed results. However, further studies would need to be carried out in
order to completely discard these two variables as issues that should concern education policy
makers in the region. Furthermore, throughout every regression model estimated in this study, it
was found that both GDP per capita and the Gini inequality coefficient displayed behaviors that
went against what theory stipulates (GDP per capita had a negative effect on PISA scores and Gini
had a positive one).
This study does find, however, that when it comes to domestic policy in Latin America,
two major issues should be addressed in order to gain traction in matters of education deficits:
countries should pay closer attention to their changing demographics and over investment into
public education. These two issues need to be addressed if Latin America hopes to reap the benefits
of it in less than a decade from now. An interesting finding particular to this study is that Brazilian
educational attainment appears to be less susceptive to changes in the country’s demographic
structure in comparison to its South American peers, primarily due to their embracing and
widening welfare state. A lesson South America must take from the Brazilian economy is that the
future benefit of investing into a country’s human capital reflects in the long run sooner than one
might expect.

© Marcelo Fuentes 2016 54
For future reference, some adjustments and improvements I would make to this study
would probably be regarding the variables that were chosen. For example, choosing a variable
such as divorce rate, which in theory seemed sound, ended up displaying little to no results once
the model was estimated. Furthermore, in the future something interesting would be to look for
series in alternative and/or untapped databases from non-traditional sources, especially
considering how much survey data exists nowadays (i.e. number of books in households, average
number of TV’s in households, etc.). Also, given how significant and relevant a determinant’s
dependency was in relationship to PISA scores, performing a study solely on the impact that
demographics have on educational attainment would probably be incredibly interesting (i.e.
running regressions solely with old age dependents vs. PISA, and some with only young age
dependents vs. PISA). Lastly, an expansion to be performed on this paper would probably happen
by the end of this year, once PISA scores are released for the year 2015, since these observations
would imply an expansion of the sample period of this study, allowing for more precise estimates
and stronger conclusions, but until then this study will have to wait patiently.

© Marcelo Fuentes 2016 55
BIBLIOGRAPHY
Aedo, Christian. Directions in Development: Human Development. Skills for the 21st Century in
Latin America and the Caribbean. 2012. PDF.
Avvisati, Francesco. Programme for International Student Assessment (PISA) Results from 2012,
Brazil, OECD. 2012. PDF
Barth, Espen. Bridging the Skills and Innovation Gap to Boost Productivity in Latin America The
Competitiveness Lab: A World Economic Forum Initiative. World Economic Forum. 2015. PDF
Bassi, Marina. Disconnected: Skills, Education and Employment in Latin America. Inter-American
Development Bank. 2012. PDF.
Becker, Gary. Economics of the Family: Marriage, Children, and Human Capital. Interaction
between Quantity and Quality of Children. University of Chicago Press. 1974. PDF.
Behrman, Jere. et. al. Intergenerational Mobility in Latin America. Inter-American Development
Bank. 2001. PDF.
Bent, Rudyard K. Principles of Secondary Education. McGraw-Hill Book Company. Six Edition.
1970. Print.
Bernal, Raquel. Employment and Child Care Decisions of Mothers and the Well-being of their
Children. New York University. 2003. PDF.
Bertinelli, Luisito. Urbanization and growth. Journal of Urban Economics. 2002. PDF
Bhatta, Ganesha. Secondary Education: A Systems Perspective. Ashish Publishing House, New
Delhi. 1990. Print.
Bruns, Barbara, et.al. Great Teachers: How To Raise Student Learning in Latin America and the
Caribbean. World Bank Group. 2015.
Chevalier, Arnaud. The Impact of Parental Income and Education on the Schooling of Their
Children, IZA. Discussion Paper Series. 2005. PDF
Donehower, Gretchen. Population ageing, intergenerational transfers, and economic growth: Latin
America in a global context ECLAC. 2011. PDF
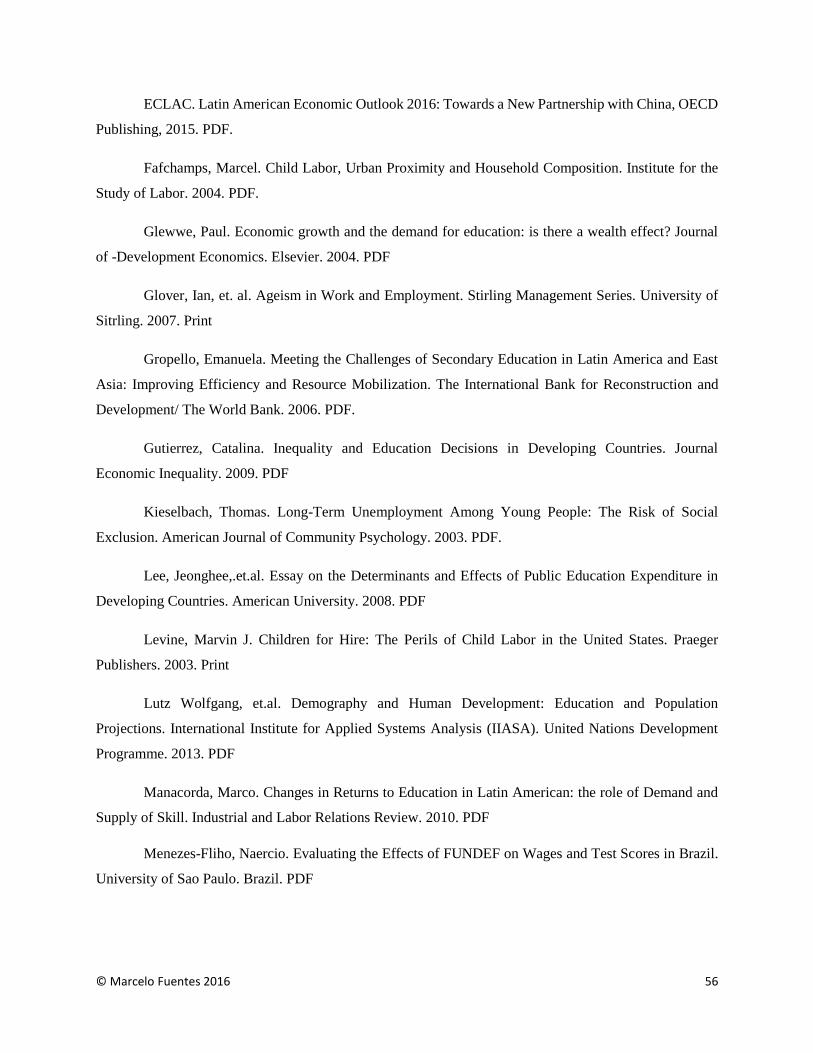
© Marcelo Fuentes 2016 56
ECLAC. Latin American Economic Outlook 2016: Towards a New Partnership with China, OECD
Publishing, 2015. PDF.
Fafchamps, Marcel. Child Labor, Urban Proximity and Household Composition. Institute for the
Study of Labor. 2004. PDF.
Glewwe, Paul. Economic growth and the demand for education: is there a wealth effect? Journal
of -Development Economics. Elsevier. 2004. PDF
Glover, Ian, et. al. Ageism in Work and Employment. Stirling Management Series. University of
Sitrling. 2007. Print
Gropello, Emanuela. Meeting the Challenges of Secondary Education in Latin America and East
Asia: Improving Efficiency and Resource Mobilization. The International Bank for Reconstruction and
Development/ The World Bank. 2006. PDF.
Gutierrez, Catalina. Inequality and Education Decisions in Developing Countries. Journal
Economic Inequality. 2009. PDF
Kieselbach, Thomas. Long-Term Unemployment Among Young People: The Risk of Social
Exclusion. American Journal of Community Psychology. 2003. PDF.
Lee, Jeonghee,.et.al. Essay on the Determinants and Effects of Public Education Expenditure in
Developing Countries. American University. 2008. PDF
Levine, Marvin J. Children for Hire: The Perils of Child Labor in the United States. Praeger
Publishers. 2003. Print
Lutz Wolfgang, et.al. Demography and Human Development: Education and Population
Projections. International Institute for Applied Systems Analysis (IIASA). United Nations Development
Programme. 2013. PDF
Manacorda, Marco. Changes in Returns to Education in Latin American: the role of Demand and
Supply of Skill. Industrial and Labor Relations Review. 2010. PDF
Menezes-Fliho, Naercio. Evaluating the Effects of FUNDEF on Wages and Test Scores in Brazil.
University of Sao Paulo. Brazil. PDF
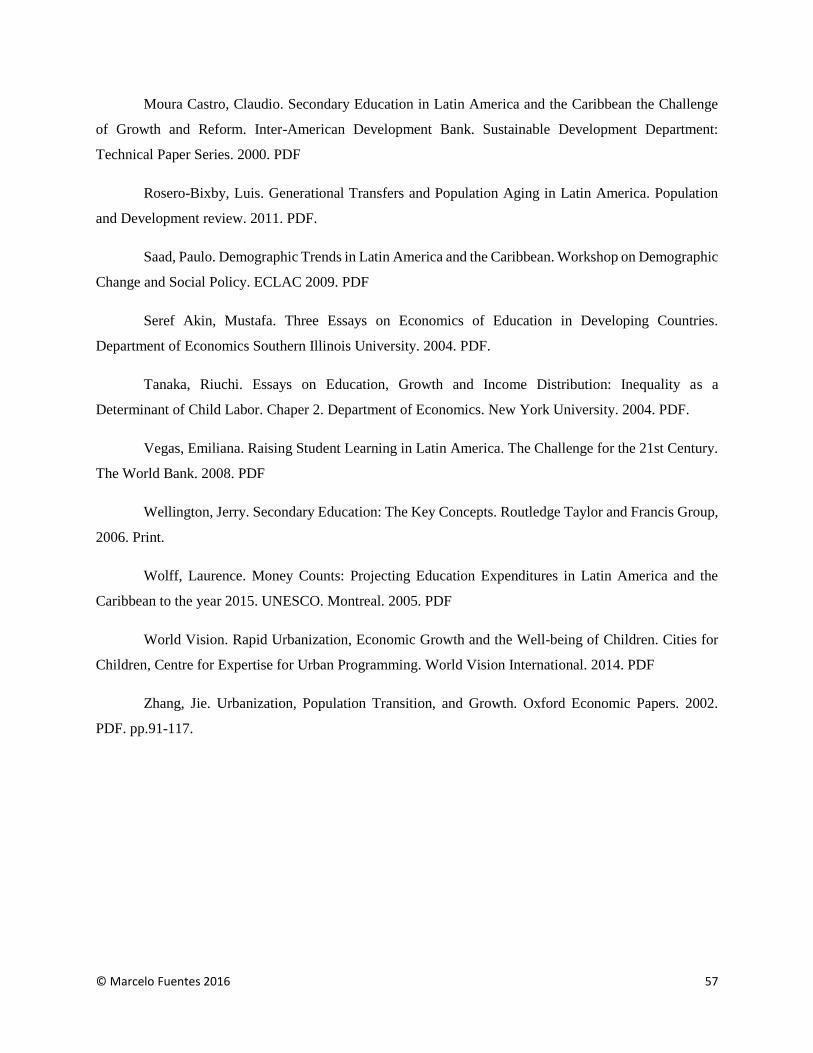
© Marcelo Fuentes 2016 57
Moura Castro, Claudio. Secondary Education in Latin America and the Caribbean the Challenge
of Growth and Reform. Inter-American Development Bank. Sustainable Development Department:
Technical Paper Series. 2000. PDF
Rosero-Bixby, Luis. Generational Transfers and Population Aging in Latin America. Population
and Development review. 2011. PDF.
Saad, Paulo. Demographic Trends in Latin America and the Caribbean. Workshop on Demographic
Change and Social Policy. ECLAC 2009. PDF
Seref Akin, Mustafa. Three Essays on Economics of Education in Developing Countries.
Department of Economics Southern Illinois University. 2004. PDF.
Tanaka, Riuchi. Essays on Education, Growth and Income Distribution: Inequality as a
Determinant of Child Labor. Chaper 2. Department of Economics. New York University. 2004. PDF.
Vegas, Emiliana. Raising Student Learning in Latin America. The Challenge for the 21st Century.
The World Bank. 2008. PDF
Wellington, Jerry. Secondary Education: The Key Concepts. Routledge Taylor and Francis Group,
2006. Print.
Wolff, Laurence. Money Counts: Projecting Education Expenditures in Latin America and the
Caribbean to the year 2015. UNESCO. Montreal. 2005. PDF
World Vision. Rapid Urbanization, Economic Growth and the Well-being of Children. Cities for
Children, Centre for Expertise for Urban Programming. World Vision International. 2014. PDF
Zhang, Jie. Urbanization, Population Transition, and Growth. Oxford Economic Papers. 2002.
PDF. pp.91-117.

© Marcelo Fuentes 2016 58
ANNEXES
Annex #1: Labor force composition broken down by years of education (Brazil National Statistics)
– Source IBGE
Annex #2: Proportion of women who held custody of children post-divorce in both Brazil and its
main regions. – Source IBGE
0%
20%
40%
60%
80%
100%
2001 2002 2003 2004 2005 2006 2007 2008 2009 2011
% o
f to
tal L
abo
r Fo
rce
Years
Labor Force broken down by years of schooling
1 yr or less 3 yrs or less 7 yrs or less
10 yrs or less (High School) 14 yrs or less (University) 15 yrs or more (Graduate)
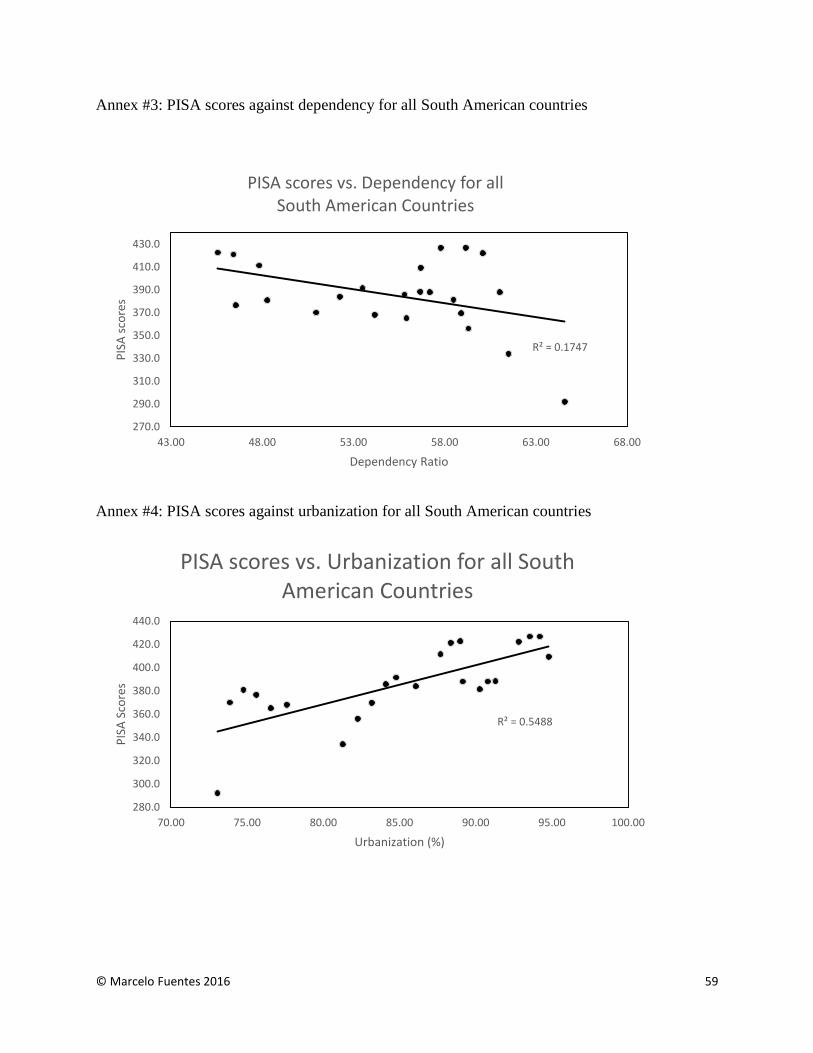
© Marcelo Fuentes 2016 59
Annex #3: PISA scores against dependency for all South American countries
Annex #4: PISA scores against urbanization for all South American countries
R² = 0.1747
270.0
290.0
310.0
330.0
350.0
370.0
390.0
410.0
430.0
43.00 48.00 53.00 58.00 63.00 68.00
PIS
A s
core
s
Dependency Ratio
PISA scores vs. Dependency for all South American Countries
R² = 0.5488
280.0
300.0
320.0
340.0
360.0
380.0
400.0
420.0
440.0
70.00 75.00 80.00 85.00 90.00 95.00 100.00
PIS
A S
core
s
Urbanization (%)
PISA scores vs. Urbanization for all South American Countries
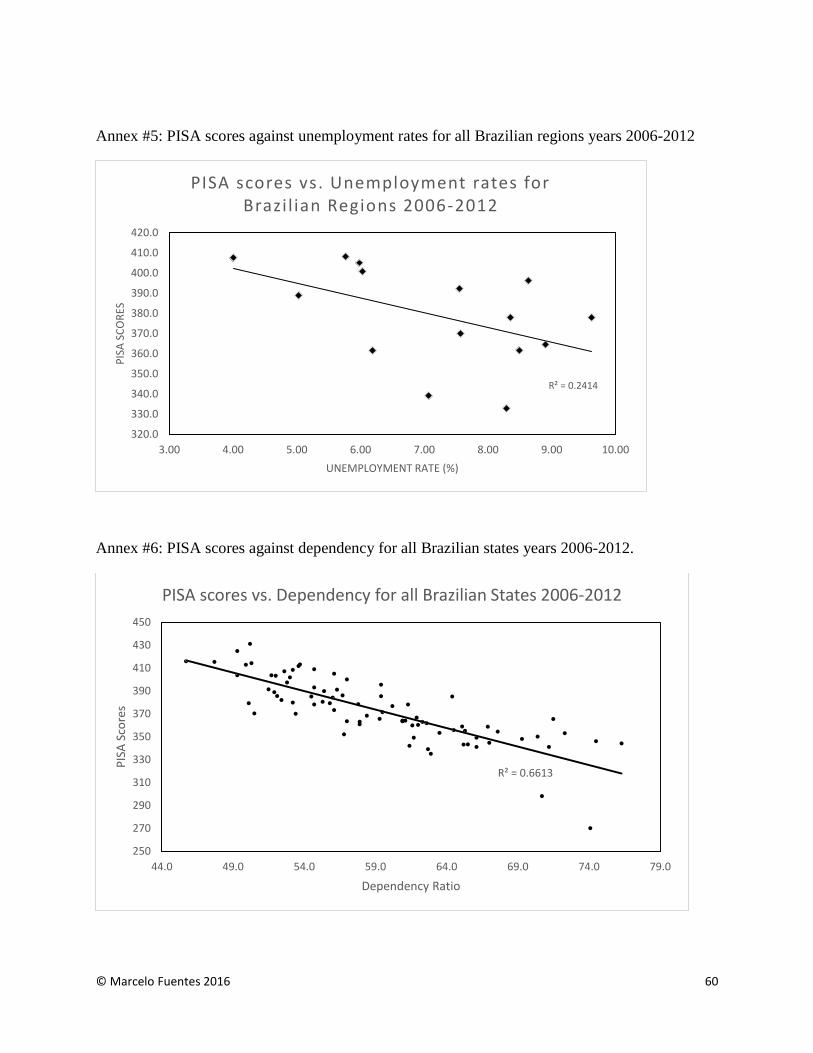
© Marcelo Fuentes 2016 60
Annex #5: PISA scores against unemployment rates for all Brazilian regions years 2006-2012
Annex #6: PISA scores against dependency for all Brazilian states years 2006-2012.
R² = 0.2414
320.0
330.0
340.0
350.0
360.0
370.0
380.0
390.0
400.0
410.0
420.0
3.00 4.00 5.00 6.00 7.00 8.00 9.00 10.00
PIS
A S
CO
RES
UNEMPLOYMENT RATE (%)
PISA scores vs. Unemployment rates for Brazi l ian Regions 2006-2012
R² = 0.6613
250
270
290
310
330
350
370
390
410
430
450
44.0 49.0 54.0 59.0 64.0 69.0 74.0 79.0
PIS
A S
core
s
Dependency Ratio
PISA scores vs. Dependency for all Brazilian States 2006-2012
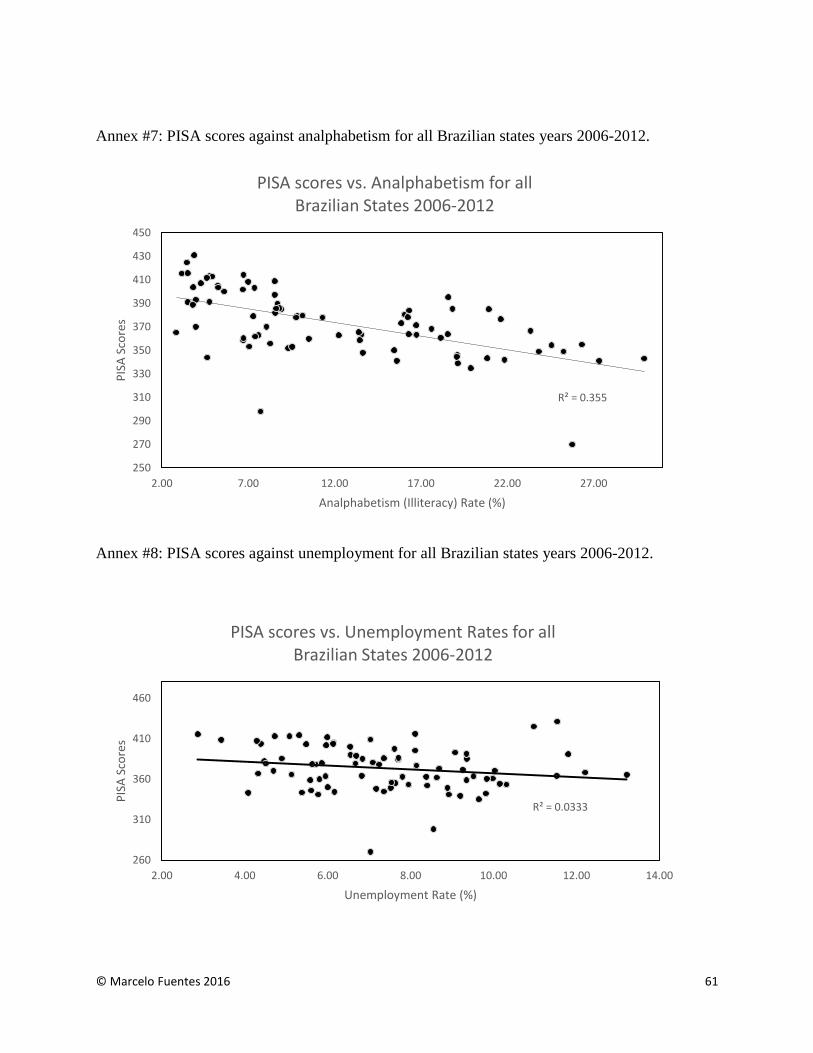
© Marcelo Fuentes 2016 61
Annex #7: PISA scores against analphabetism for all Brazilian states years 2006-2012.
Annex #8: PISA scores against unemployment for all Brazilian states years 2006-2012.
R² = 0.355
250
270
290
310
330
350
370
390
410
430
450
2.00 7.00 12.00 17.00 22.00 27.00
PIS
A S
core
s
Analphabetism (Illiteracy) Rate (%)
PISA scores vs. Analphabetism for all Brazilian States 2006-2012
R² = 0.0333
260
310
360
410
460
2.00 4.00 6.00 8.00 10.00 12.00 14.00
PIS
A S
core
s
Unemployment Rate (%)
PISA scores vs. Unemployment Rates for all Brazilian States 2006-2012
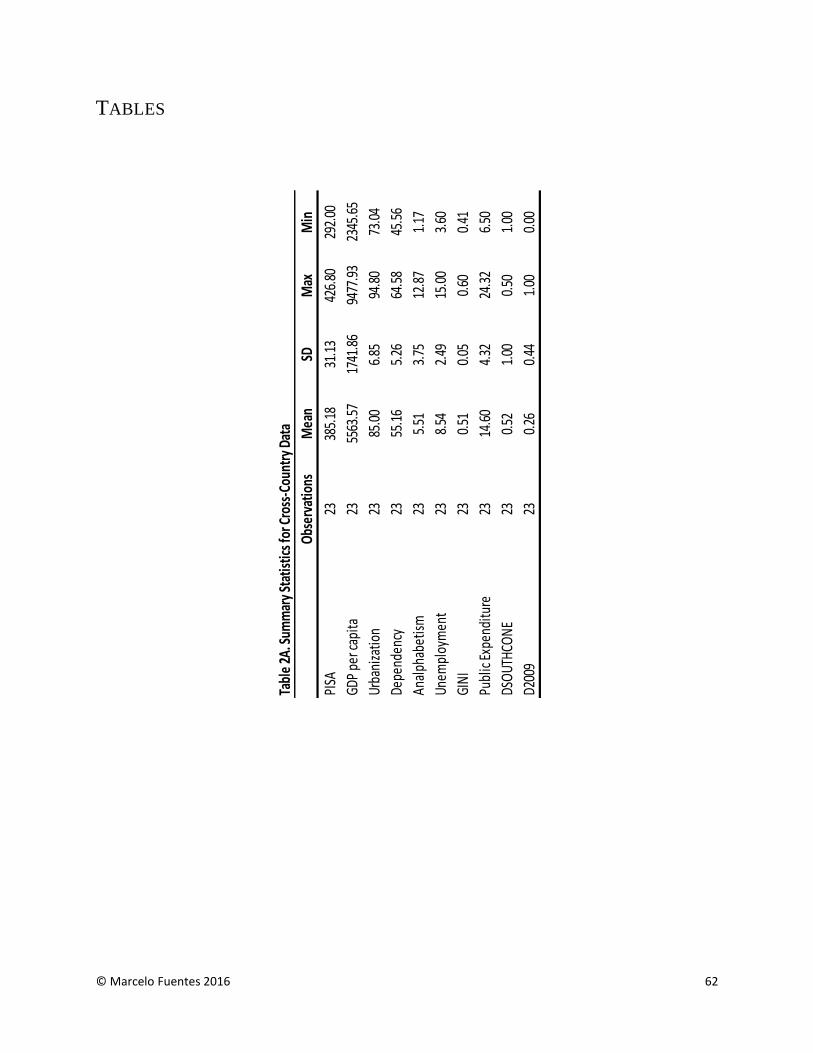
© Marcelo Fuentes 2016 62
TABLES
Tabl
e 2A
. Sum
mar
y St
atis
tics f
or C
ross
-Cou
ntry
Dat
a
Obs
erva
tions
Mea
nSD
Max
Min
PISA
2338
5.18
31.1
342
6.80
292.
00
GDP
per c
apita
2355
63.5
717
41.8
694
77.9
323
45.6
5
Urba
niza
tion
2385
.00
6.85
94.8
073
.04
Depe
nden
cy23
55.1
65.
2664
.58
45.5
6
Anal
phab
etis
m23
5.51
3.75
12.8
71.
17
Unem
ploy
men
t23
8.54
2.49
15.0
03.
60
GIN
I 23
0.51
0.05
0.60
0.41
Publ
ic E
xpen
ditu
re23
14.6
04.
3224
.32
6.50
DSO
UTHC
ON
E23
0.52
1.00
0.50
1.00
D200
923
0.26
0.44
1.00
0.00

© Marcelo Fuentes 2016 63
Tab
le 2
B. E
ffe
cts
of
Dif
fere
nt
Soci
oe
con
om
ic f
acto
rs o
n M
ath
em
atic
s P
ISA
sco
res
at t
he
Cro
ss-C
ou
ntr
y le
vel.
(1)
(2)
(3)
(4)
Log
(GD
P p
er
cap
ita)
-61.
039
-68.
472
-105
.215
-109
.301
(-2.
49)*
*(-
2.95
)**
(-4.
42)*
**(-
4.96
)***
Urb
aniz
atio
n7.
699
7.96
28.
704
8.86
1
(7.4
7)**
*(8
.03)
***
(7.2
5)**
*(7
.80)
***
De
pe
nd
en
cy-4
.371
-4.6
73-6
.999
-7.1
45
(-3.
53)*
**(-
3.92
)***
(-6.
72)*
**(-
7.28
)***
An
alp
hab
eti
sm R
ate
-5.3
75-5
.133
1.28
71.
295
(-1.
97)*
(-1.
90)*
(0.7
1)(0
.73)
Un
em
plo
yme
nt
Rat
e-0
.389
-0.4
380.
153
0.10
6
(-0.
33)
(-0.
37)
(0.1
1)(0
.08)
GIN
I Co
eff
icie
nt
(In
eq
ual
ity)
158.
681
155.
739
23.7
8824
.971
(1.5
5)(1
.53)
(0.2
1)(0
.23)
Pu
bli
c Ex
pe
nd
itu
re
-0.4
97-0
.298
0.21
90.
341
(-0.
87)
(-0.
56)
(0.3
4)(0
.58)
Co
ntr
ols
fo
r So
uth
Co
ne
?Ye
sYe
sN
oN
o
Co
ntr
ols
fo
r th
e R
ece
ssio
n?
Yes
No
Yes
No
Nu
mb
er
of
dif
fere
nt
Co
un
trie
s6
66
6
Nu
mb
er
of
Ob
serv
atio
ns
2323
2323
R-S
qu
are
d0.
9695
0.96
740.
9498
0.94
76
The
'So
uth
-Co
ne
' du
mm
y ac
cou
nts
fo
r A
rge
nti
na,
Ch
ile
& U
rugu
ay w
hic
h h
ave
sig
nif
icat
ly h
igh
er
leve
ls o
f w
eal
th a
nd
de
velo
pm
en
t
to t
he
re
st o
f th
e c
ou
ntr
ies
pre
sen
t in
th
is s
amp
le.
The
six
co
un
trie
s u
sed
fo
r th
is s
tud
y w
ere
(in
alp
hab
eti
cal o
rde
r): A
rge
nti
na,
Bra
zil,
Ch
ile
, Co
lom
bia
, Pe
ru &
Uru
guay
.
The
val
ue
s in
par
en
the
sis
are
th
e r
egr
ess
ion
's t
-sta
tist
ics
The
ast
eri
sks
ind
icat
e s
tati
stic
al s
ign
ific
ance
: **
*P<0
.01,
**
P<0
.05,
* P
<0.1
0
All
re
sult
s in
bo
ld a
re s
tati
stic
ally
sig
nif
ican
t.
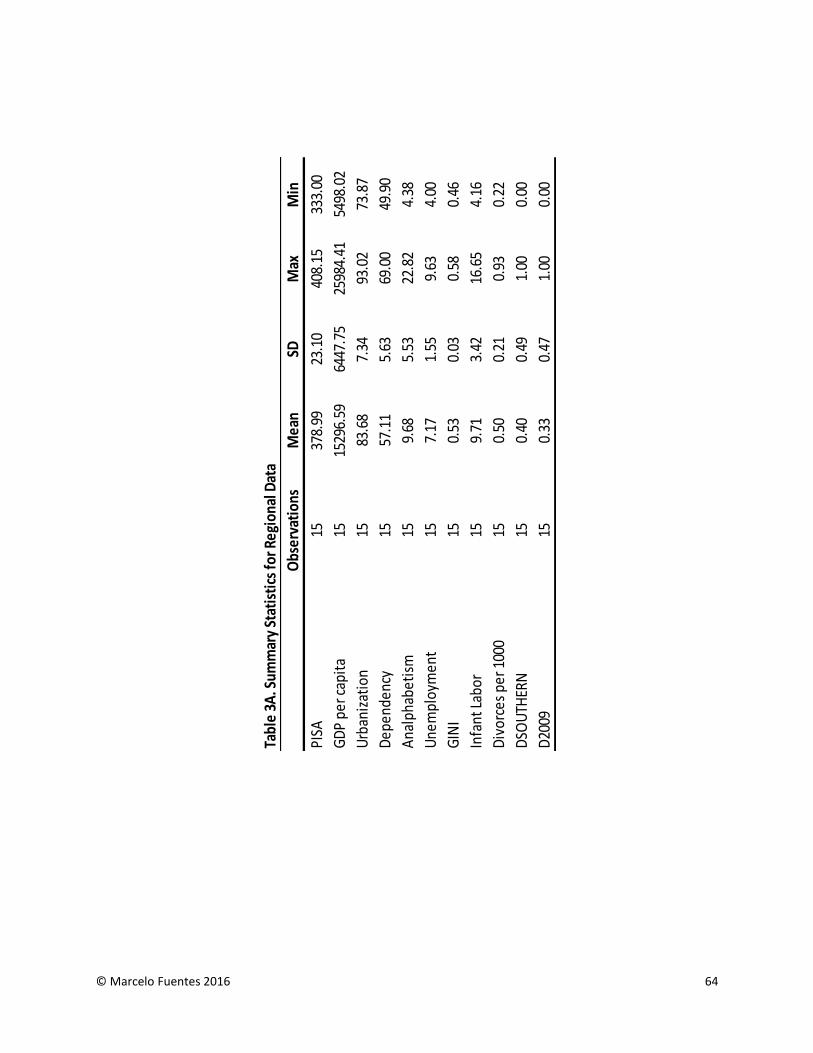
© Marcelo Fuentes 2016 64
Tabl
e 3A
. Sum
mar
y St
atis
tics
for R
egio
nal D
ata
Obs
erva
tion
sM
ean
SDM
axM
in
PISA
1537
8.99
23.1
040
8.15
333.
00
GD
P pe
r cap
ita
1515
296.
5964
47.7
525
984.
4154
98.0
2
Urb
aniz
atio
n15
83.6
87.
3493
.02
73.8
7
Dep
ende
ncy
1557
.11
5.63
69.0
049
.90
Ana
lpha
beti
sm15
9.68
5.53
22.8
24.
38
Une
mpl
oym
ent
157.
171.
559.
634.
00
GIN
I 15
0.53
0.03
0.58
0.46
Infa
nt L
abor
159.
713.
4216
.65
4.16
Div
orce
s pe
r 100
0 15
0.50
0.21
0.93
0.22
DSO
UTH
ERN
150.
400.
491.
000.
00
D20
0915
0.33
0.47
1.00
0.00
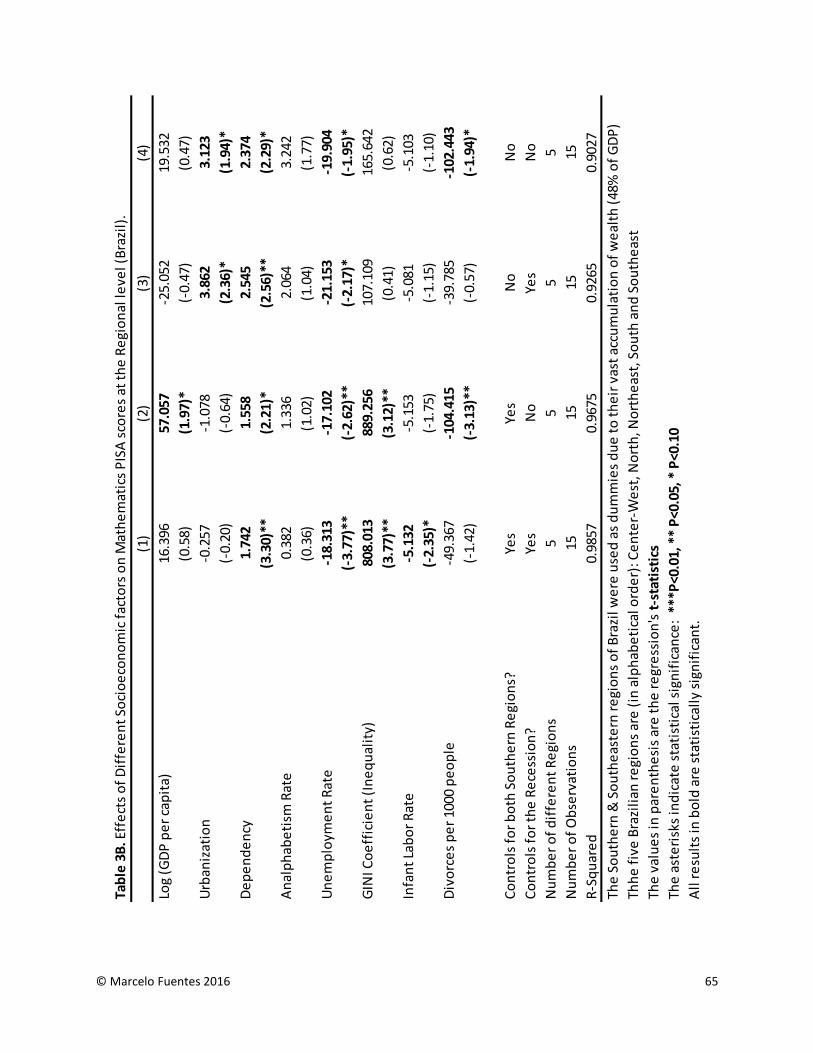
© Marcelo Fuentes 2016 65
Tab
le 3
B. E
ffe
cts
of
Dif
fere
nt
Soci
oe
con
om
ic f
acto
rs o
n M
ath
em
atic
s P
ISA
sco
res
at t
he
Re
gio
nal
leve
l (B
razi
l).
(1)
(2)
(3)
(4)
Log
(GD
P p
er
cap
ita)
16.3
9657
.057
-25.
052
19.5
32
(0.5
8)(1
.97)
*(-
0.47
)(0
.47)
Urb
aniz
atio
n-0
.257
-1.0
783.
862
3.12
3
(-0.
20)
(-0.
64)
(2.3
6)*
(1.9
4)*
De
pe
nd
en
cy1.
742
1.55
82.
545
2.37
4
(3.3
0)**
(2.2
1)*
(2.5
6)**
(2.2
9)*
An
alp
hab
eti
sm R
ate
0.38
21.
336
2.06
43.
242
(0.3
6)(1
.02)
(1.0
4)(1
.77)
Un
em
plo
yme
nt
Rat
e-1
8.31
3-1
7.10
2-2
1.15
3-1
9.90
4
(-3.
77)*
*(-
2.62
)**
(-2.
17)*
(-1.
95)*
GIN
I Co
eff
icie
nt
(In
eq
ual
ity)
808.
013
889.
256
107.
109
165.
642
(3.7
7)**
(3.1
2)**
(0.4
1)(0
.62)
Infa
nt
Lab
or
Rat
e-5
.132
-5.1
53-5
.081
-5.1
03
(-2.
35)*
(-1.
75)
(-1.
15)
(-1.
10)
Div
orc
es
pe
r 10
00 p
eo
ple
-49.
367
-104
.415
-39.
785
-102
.443
(-1.
42)
(-3.
13)*
*(-
0.57
)(-
1.94
)*
Co
ntr
ols
fo
r b
oth
So
uth
ern
Re
gio
ns?
Yes
Yes
No
No
Co
ntr
ols
fo
r th
e R
ece
ssio
n?
Yes
No
Yes
No
Nu
mb
er
of
dif
fere
nt
Re
gio
ns
55
55
Nu
mb
er
of
Ob
serv
atio
ns
1515
1515
R-S
qu
are
d0.
9857
0.96
750.
9265
0.90
27
The
So
uth
ern
& S
ou
the
aste
rn r
egi
on
s o
f B
razi
l we
re u
sed
as
du
mm
ies
du
e t
o t
he
ir v
ast
accu
mu
lati
on
of
we
alth
(48
% o
f G
DP
)
Thh
e f
ive
Bra
zili
an r
egi
on
s ar
e (
in a
lph
abe
tica
l ord
er)
: Ce
nte
r-W
est
, No
rth
, No
rth
eas
t, S
ou
th a
nd
So
uth
eas
t
The
val
ue
s in
par
en
the
sis
are
th
e r
egr
ess
ion
's t
-sta
tist
ics
The
ast
eri
sks
ind
icat
e s
tati
stic
al s
ign
ific
ance
: **
*P<0
.01,
**
P<0
.05,
* P
<0.1
0
All
re
sult
s in
bo
ld a
re s
tati
stic
ally
sig
nif
ican
t.
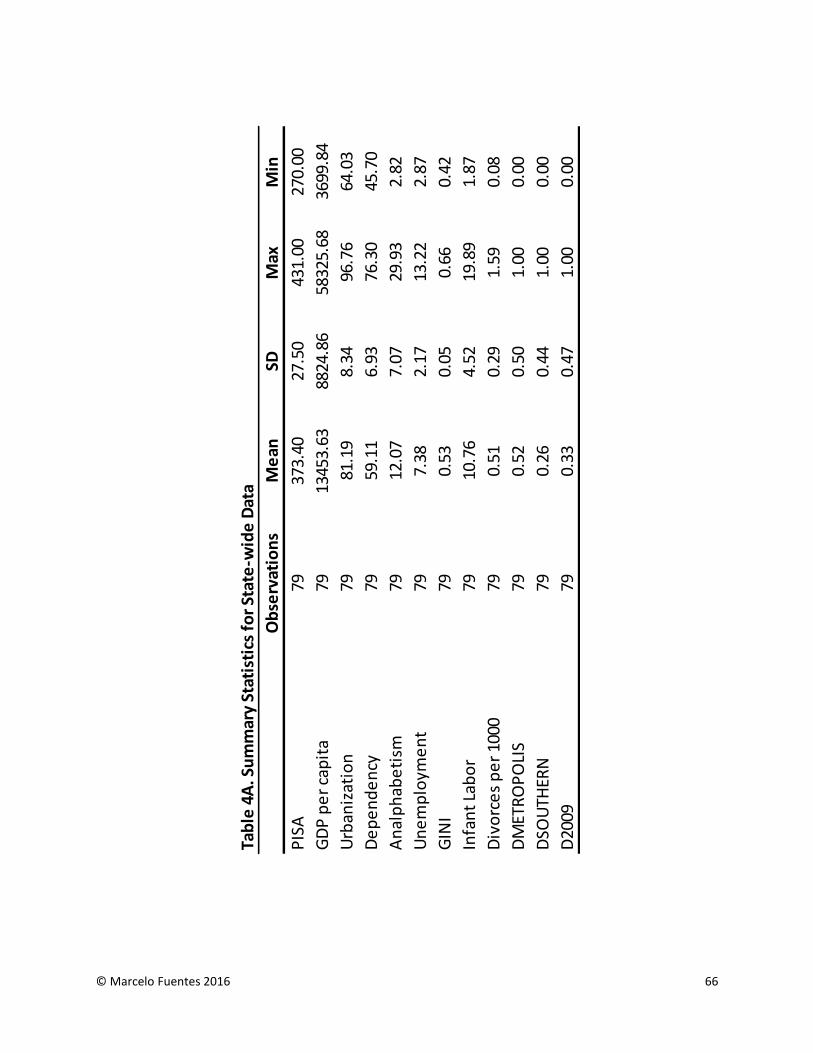
© Marcelo Fuentes 2016 66
Tab
le 4
A. S
um
mar
y St
atis
tics
fo
r St
ate
-wid
e D
ata
Ob
serv
atio
ns
Me
anSD
Max
Min
PIS
A79
373.
4027
.50
431.
0027
0.00
GD
P p
er
cap
ita
7913
453.
6388
24.8
658
325.
6836
99.8
4
Urb
aniz
atio
n79
81.1
98.
3496
.76
64.0
3
De
pe
nd
en
cy79
59.1
16.
9376
.30
45.7
0
An
alp
hab
eti
sm79
12.0
77.
0729
.93
2.82
Un
em
plo
yme
nt
797.
382.
1713
.22
2.87
GIN
I 79
0.53
0.05
0.66
0.42
Infa
nt
Lab
or
7910
.76
4.52
19.8
91.
87
Div
orc
es
pe
r 10
0079
0.51
0.29
1.59
0.08
DM
ETR
OP
OLI
S79
0.52
0.50
1.00
0.00
DSO
UTH
ERN
790.
260.
441.
000.
00
D20
0979
0.33
0.47
1.00
0.00
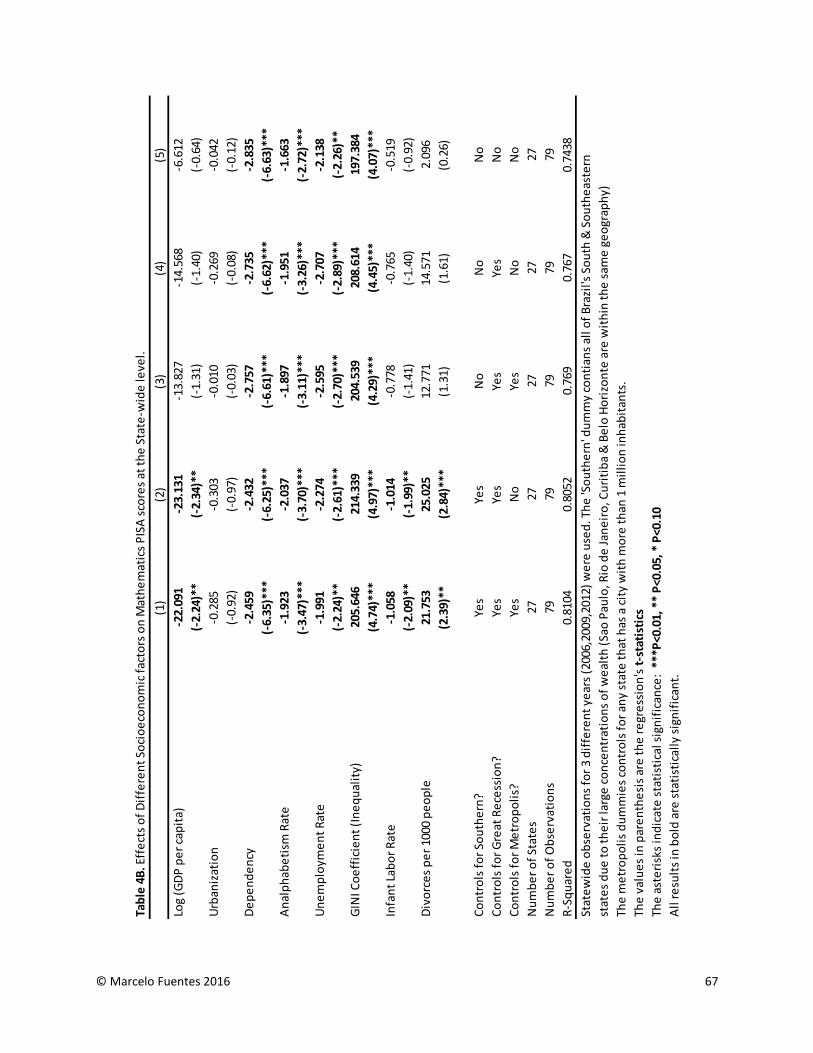
© Marcelo Fuentes 2016 67
Tab
le 4
B. E
ffe
cts
of
Dif
fere
nt
Soci
oe
con
om
ic f
acto
rs o
n M
ath
em
atic
s P
ISA
sco
res
at t
he
Sta
te-w
ide
leve
l.
(1)
(2)
(3)
(4)
(5)
Log
(GD
P p
er
cap
ita)
-22.
091
-23.
131
-13.
827
-14.
568
-6.6
12
(-2.
24)*
*(-
2.34
)**
(-1.
31)
(-1.
40)
(-0.
64)
Urb
aniz
atio
n-0
.285
-0.3
03-0
.010
-0.2
69-0
.042
(-0.
92)
(-0.
97)
(-0.
03)
(-0.
08)
(-0.
12)
De
pe
nd
en
cy-2
.459
-2.4
32-2
.757
-2.7
35-2
.835
(-6.
35)*
**(-
6.25
)***
(-6.
61)*
**(-
6.62
)***
(-6.
63)*
**
An
alp
hab
eti
sm R
ate
-1.9
23-2
.037
-1.8
97-1
.951
-1.6
63
(-3.
47)*
**(-
3.70
)***
(-3.
11)*
**(-
3.26
)***
(-2.
72)*
**
Un
em
plo
yme
nt
Rat
e-1
.991
-2.2
74-2
.595
-2.7
07-2
.138
(-2.
24)*
*(-
2.61
)***
(-2.
70)*
**(-
2.89
)***
(-2.
26)*
*
GIN
I Co
eff
icie
nt
(In
eq
ual
ity)
205.
646
214.
339
204.
539
208.
614
197.
384
(4.7
4)**
*(4
.97)
***
(4.2
9)**
*(4
.45)
***
(4.0
7)**
*
Infa
nt
Lab
or
Rat
e-1
.058
-1.0
14-0
.778
-0.7
65-0
.519
(-2.
09)*
*(-
1.99
)**
(-1.
41)
(-1.
40)
(-0.
92)
Div
orc
es
pe
r 10
00 p
eo
ple
21.7
5325
.025
12.7
7114
.571
2.09
6
(2.3
9)**
(2.8
4)**
*(1
.31)
(1.6
1)(0
.26)
Co
ntr
ols
fo
r So
uth
ern
?Ye
sYe
sN
oN
oN
o
Co
ntr
ols
fo
r G
reat
Re
cess
ion
?Ye
sYe
sYe
sYe
sN
o
Co
ntr
ols
fo
r M
etr
op
oli
s?
Yes
No
Yes
No
No
Nu
mb
er
of
Stat
es
2727
2727
27
Nu
mb
er
of
Ob
serv
atio
ns
7979
7979
79
R-S
qu
are
d0.
8104
0.80
520.
769
0.76
70.
7438
Stat
ew
ide
ob
serv
atio
ns
for
3 d
iffe
ren
t ye
ars
(200
6,20
09,2
012)
we
re u
sed
. Th
e 'S
ou
the
rn' d
um
my
con
tian
s al
l of
Bra
zil's
So
uth
& S
ou
the
aste
rn
stat
es
du
e t
o t
he
ir la
rge
co
nce
ntr
atio
ns
of
we
alth
(Sa
o P
aulo
, Rio
de
Jan
eir
o, C
uri
tib
a &
Be
lo H
ori
zon
te a
re w
ith
in t
he
sam
e g
eo
grap
hy)
The
me
tro
po
lis
du
mm
ies
con
tro
ls f
or
any
stat
e t
hat
has
a c
ity
wit
h m
ore
th
an 1
mil
lio
n in
hab
itan
ts.
The
val
ue
s in
par
en
the
sis
are
th
e r
egr
ess
ion
's t
-sta
tist
ics
The
ast
eri
sks
ind
icat
e s
tati
stic
al s
ign
ific
ance
: **
*P<0
.01,
**
P<0
.05,
* P
<0.1
0
All
re
sult
s in
bo
ld a
re s
tati
stic
ally
sig
nif
ican
t.