marble river wind farm supplemental ......2013 (see section 3.0 of this document); • it precludes...
TRANSCRIPT

MARBLE RIVER WIND FARM SUPPLEMENTAL ALTERNATIVES ANALYSIS
1.0 INTRODUCTION This Supplemental Alternatives Analysis represents an addition to the original
Alternatives Analysis located in Section 8 of the Marble River DEIS (submitted on March
30, 2006).
Alternatives to the proposed action that are described and evaluated in greater detail in
this analysis include: no action, alternative energy production technologies, alternative
turbine technologies, alternative location, alternative project size/magnitude, alternative
project design/layout and cumulative alternatives. These alternatives offer a reasonable
range and scope of development for comparative analysis and consideration. The no
action alternative represents the environmental conditions that would exist if current land
use and activities were to continue as is.
2.0 NO ACTION The no action alternative assumes that the Project would not be built. Under this
scenario, the Project area would remain as active agricultural land, forest land,
residential property and vacant land, and any Project-related adverse impacts would not
occur. Similarly, the Project’s positive environmental and economic benefits described in
Section 2.3 of the DEIS, Project Purpose, Public Needs and Benefits, would also not be
realized.
The Project as proposed will have a significant beneficial impact on air quality by
producing up to 218 MW of electricity without any emissions to the atmosphere. The
annual production of wind power by the Project will reduce CO2 emissions, which
contribute to global warming, by an amount equivalent to removing about 58,000 cars
from the road [calculated using US EPA Greenhouse Gas Calculator, 2001].
If the Project were not built, the positive environmental benefits associated with adding
this new renewable energy source to the New York bulk electric power system as
detailed in Table 1 below, will not occur:

Table 1. Estimated Emissions Reductions Resulting from the Project
Compound Emission Factor
(lbs/MW-hr) Total Annual Reductions (tons/year) 1
Nitrogen oxides (NOx) 1.363 416 Sulfur dioxide (SO2) 1.765 538 Carbon dioxide (CO2) 1,274 388,621 Particulate matter less than 10 microns in diameter (PM10)
0.041 13
Volatile organic compounds (VOCs)
0.035 11
Mercury 2 E-06 0.0006 (1.2 lbs/yr)
1 Assumes 550,000 MW-hrs of electrical power generated by Marble River during an average year. Source: Table 3.9.3.2-1 of DEIS (ESS Group & EDR, 2006).
Further, if this Project were not developed, potentially negative impacts from the lack of
economic development activities in the Project area or the development of other, less
desirable land uses could ensue, including:
1. Potential for continued economic stagnation in the local vicinity - As stated
in the DEIS, Appendix M, “Given the relatively low median incomes, slow growth
and limited base economy near the towns of Clinton and Ellenburg, the proposed
Marble River Project may yield net economic benefits, which could in turn, spur
demand for housing and increase property” (DeLacy, Page 19, Impacts of the
Marble River Wind Farm on Local Property Values, January 30th 2006).
Specific references of additional positive benefit include the following:
a. School (Northern Adirondack School district) - The NACS School
Board (meeting minutes of January 21st 2008), suggested that the
additional revenues generated by the PILOT program would provide the
funds needed to finance:
i) Additional employee benefits for teachers under the 403b
program
ii) New baseball fields and tracks
b. Towns - The Clinton and Ellenburg Town Supervisors (Michael Filion
and James Mcneil, respectively) have suggested that the proceeds of
the PILOT program and Host Community Agreements from the
Marble River Wind Farm will be integral to their plans to decrease

local taxes as a means to spur local economic development in
addition to improving available town facilities as suggested by town
participants at monthly board meetings. Suggested town facility
improvements included:
i) Building street lights in Merrill (Ellenburg)
ii) Building municipal athletic fields at the local VFW (Ellenburg)
iii) Improving Town Hall facilities including the addition of
computers, sound systems.
iv) Funding additions to a Town Library (Ellenburg)
v) Renovate and maintain a historic school site to use as a
Community gathering center (Ellenburg)
vi) Fund the demolition and clean-up of abandoned properties in
the hamlet of Ellenburg Depot.
vii) Fund the permitting and re-construction of a local dam
(Ellenburg)
viii) Upgrade highway department facilities and equipment to
appropriately cover the roads network (Clinton/Ellenburg)
ix) Build/upgrade local athletic facilities (Ice Rink/ Baseball field
(Clinton)
x) Build and maintain a town Library (Clinton)
xi) Fund the restoration of local cultural resources like the Church
and Clinton Mills historic area
c. Fire Districts - Ellenburg and Churubusco Fire Departments
suggested that the additional fire district revenues generated by the
Marble River Wind Farm would be helpful in supporting equipment
investment to enhance preventative and response measures.
2. Potential for development of Projects with more significant adverse impacts than the proposed Project - As there are significant economic pressures on
farmers in upstate New York, the trend is to convert open space to other uses,
such as manufacturing, housing development and similar intensive uses in order
to generate additional income. Though these practices may be permitted under
local zoning ordinances, these more intensive land uses replace agriculture,
eliminate open space, alter the character of the community and significantly
increase the burden and costs on communities for services such as schools,
roads, fire and emergency response, water and sewer, etc.
Given the minor long-term impacts of Project operation (which are discussed in
other sections of the DEIS/SDEIS/FEIS, see Sections 3.0 of the DEIS and
SDEIS) compared to the significant environmental and economic benefits that
the Project would generate, the no action alternative is not preferred. Specifically,
the no action alternative is not preferred because:
• It fails to meet the Project purpose, public needs and benefits (Section 2.3 of
the DEIS);
• It does not further the goal of the New York State Renewable Portfolio
Standard (RPS) of increasing the percentage of renewable electricity
purchased by New York consumers from 19 percent to at least 25 percent by
2013 (see Section 3.0 of this document);
• It precludes the specific Project-related benefits from occurring in the
community;
• There are potentially far more severe adverse impacts associated with the no
action alternative, as summarized above.
3.0 ALTERNATIVE ENERGY PRODUCTION TECHNOLGIES The purpose of the proposed Project is to create a wind-powered electrical generating
facility that will provide a significant source of renewable energy to the New York power
grid in order to:
• Meet regional energy needs in an efficient and environmentally sound manner
• Provide increased stability to the price volatility of fossil fuel electricity generation
in the region
• Realize the full potential of the wind resource under lease
• Promote the long term economic viability of agricultural areas of New York
State’s North County
• Assist New York State of meeting its Renewable Portfolio Standard for the
consumption of renewable energy in the State.
An important component of that purpose is to be compliant with the New York State
Public Service Commission (PSC) "Order Approving Renewable Portfolio Standard
Policy", issued on the 24th of September 2004. This Order puts in place policies and
economic incentives to help New York State meet the goal of having 25% of the

electricity consumed in the State come from renewables by the year 2013. The Order
anticipates that most of this increased supply of renewable energy (approximately two
thirds) will come from commercial scale wind farms such as proposed by the Applicant.
The Marble River Wind Farm will generate electricity by converting the energy in the
wind to electricity. Such a facility is clearly a qualifying facility for the Renewable
Portfolio Standard (RPS), and therefore eligible to bid to receive payment from
NYSERDA for up to 95% of the renewable energy attributes it produces. The following
section, which draws heavily on analysis performed by experts at the NYS Department
of Public Service (DPS) for the Generic Impact Statement performed for the RPS,
describes other technologies that comply with the RPS. These technologies are
reviewed for purposes of completeness. None are reasonable alternatives to the
selected technology because none would fulfill the Applicant’s purpose of constructing
and operating a wind energy generation facility. However, all could potentially comply
with the RPS.
3.1 Biomass Energy The term biomass includes a wide-variety of closed-loop and open-loop organic energy
resources. Closed-loop resources, which can be either woody (i.e., willow or hybrid
poplars) or herbaceous (i.e., switchgrass), are those that are grown exclusively for the
purpose of being consumed as an energy feedstock. Open-loop resources are typically
either woody residues produced as byproducts in the wood processing industry or clean,
non-treated, woody waste materials intercepted from the municipal solid waste stream.
A variety of technologies can be used to produce electricity from biomass. In some
cases, a particular biomass resource is more suitable for conversion to electricity using a
particular technology. Primary types of energy conversion technologies from biomass
are presented below:
• Customer-Sited Biomass Combined Heat and Power (CHP)
• Co-firing Biomass with Coal
• Gasification
• Direct-Fire
• Co-firing Gasified Biomass with Natural Gas or Coal
None of the Applicant’s leases authorize any of these activities on the subject parcels,
which constitute the Project area, nor are these activities specifically regulated by the
town zoning ordinance in the Project area. Nevertheless the opportunities to produce
electricity using the biomass technologies referenced above are discussed herein.

Customer-Sited Biomass Combined Heat and Power (CHP)
As implied by the title, this technology is typically employed at “customer”
facilities, generally wood processing plants (especially in the pulp and paper
industry) that have large electricity and steam needs and a captive supply of
biomass residues. Opportunities also exist in some food products manufacturing
facilities.
The typical scale of CHP technology is 1 – 30 MW. It is estimated by the DPS
that the market potential for new biomass CHP in New York is 18MW by 2009
and 40.5MW by 2013 spread over several mills.
Given the fact that the Applicant is not a facility owner or operator in the pulp and
paper or food industries, the small size of these facilities relative to the Project
and the targets of the RPS, and the difficulty in negotiating stand-by agreements
with the local utility, customer-sited biomass combined heat and power would not
be a reasonable alternative for the Applicant.
Co-firing Biomass with Coal
For companies that generate electricity from coal, it is possible to directly
displace a portion of the coal used in the combustion process with biomass. The
typical application for co-firing coal with biomass is in larger base-load electricity
generators. Biomass can be blended with coal on the coal-pile (mixed feed), or
injected through a separate biomass transfer system.
With 10.7 MW of active co-firing capacity at Greenidge Station in Yates County,
an additional (currently unused) 11 MW of co-firing capacity at two other plants in
Chenango and Steuben Counties and a 10 MW co-firing system at the Dunkirk
Station, in Chautauqua County, co-firing biomass with coal is a minor activity in
New York. This alternative is not open to the Applicant because the Applicant is
not an owner or operator of coal generation facilities.
Biomass Gasification
Biomass gasification is a thermal conversion technology that converts solid
biomass fuel into a combustible gas. Gasification applies air to the biomass
feedstock in a high temperature reactor to produce the product gas, which can
then be used to generate electricity from standard gas turbines or in a combined
cycle unit. Biomass gasifiers have the potential to be up to twice as efficient as
conventional boilers to generate electricity. A typical scale of biomass gasification
is from 5 MW to 40 MW.
However, biomass gasification is still considered an emerging technology with
only a few gasifiers in operation in the United States, and no biomass gasification
in New York State. Given that, biomass gasification is not considered to be a
reasonable, commercially available alternative technology.
Direct-Fire, Stand-Alone Wood-Fired Power Plants
The technology consists of combustion of wood fuel directly to produce power,
which is sold in the wholesale market. Although this technology is in widespread
use nationally, efficiency is typically low (17 to 24%) relative to most other types
of power plants. The typical scale of this technology is 1-50 MW.
Direct-fire wood-fired power plants produce solid waste and air emissions. The
ash requires disposal, either by being spread over land or in a landfill. If the wood
fuel is treated with compounds such as chromium, chlorine, or arsenic, the ash
produced may have a higher concentration of hazardous materials resulting in
greater environmental risks associated with disposal. The air emissions from
biomass in combustion technology will vary depending on the properties of the
wood, but will in all cases require emissions control technologies. Unless the
amount of biomass combusted is replaced by the applicable amount of biomass
growth (i.e., closed-loop), this technology results in increased CO2 emissions,
both at the generation facility and from collecting and transporting the biomass
and the solid waste. The available supply of suitable biomass fuels in any given
geographic area is also limited
New York currently has two operating direct-fire, stand-alone wood-fired power
plants in operation - an 18 MW plant in Chateaugay, Franklin County, and a 21
MW plant in Lyonsdale, Lewis County. Even though both facilities have been
operating for a number of years and would have been expected to have paid off
their financing, both facilities were able to demonstrate that they needed RPS
funds to continue economical operation. Since these facilities were constructed,
there has been a significant increase in the cost of key materials used in boiler
house and turbine construction (most recently due to the war in Iraq and
economic growth in China and India), leading to a more difficult competitive
environment.

In recognition that RPS objectives include (a) promoting a cleaner and healthier
environment, improved air quality and a reduction of greenhouse gases and (b) a
competitive green energy price, and given the potential for increased costs due
to the Regional Greenhouse Gas Initiative, generating renewable energy at
direct-fired, stand-alone wood/biomass power plants would not be a reasonable
alternative for the Applicant.
3.2 Biofuels In addition to the biomass generation technologies mentioned above, a variety of other
fuels - ethanol, methanol and biodiesel - can be made from biomass resources. Biofuels
are primarily used to fuel vehicles and, although they can fuel engines or fuel cells for
electricity generation, both biofuels and fuel cells are considered emerging technologies
and, as such, are not a reasonable viable alternative for the Applicant to use for
commercial scale electric power generation.
3.3 Biogas Energy Landfill Gas
Landfill gas (LFG) is generated when organic materials in municipal solid waste
(MSW) landfills naturally decompose by bacteria. The gas is approximately 50%
methane, the primary component of natural gas. The other 50% of the gas is
predominantly CO2, with small amounts of NOx, and trace levels of non-methane
organic compounds (NMOC). LFG generation typically begins after waste
disposal and can continue for 20 or 30 years after the landfill is closed. LFG can
be used for on-site electricity generation, a use widely practiced throughout the
United States with approximately 330 LFG facilities currently in operation.
Reciprocating engines are the most common technology used to generate
electricity from LFG. Engine models used at landfills range in size from
approximately 0.5 to 3 MW. The engines are generally used in projects with
capacities ranging from 0.8 to 6 MW (many with more than one engine).
Landfill gas-to-electricity projects have been in operation at large landfills in New
York for the past 20 years. There are approximately 15 in operation in the state,
with a total generating capacity of approximately 65 MW, ranging in size from 1
MW to 11.2 MW and averaging 4.33 MW. The U.S. EPA identifies New York as
having potential for 17 additional landfill gas to energy sites through 2013. The
potential sites are spread across the state and are not located on the Project
area. Landfill gas generation is not a reasonable alternative for the Applicant
both because it will not fulfill the Applicant’s purpose of generating electricity from
wind, and also because it cannot be applied at a scale even approaching the
scale of the Project. Further, the Applicant, a wind farm development company,
is less well positioned to develop these projects than local engineering or
packaging firms, landfill gas developers, engine manufacturers or, the landfill
owner operator itself.
Methane Digesters
A methane digester system, commonly referred to as an anaerobic digester, can
be used for manure waste management on farms, or to process methane waste
at wastewater treatment facilities. At farm locations, digesters promote the
decomposition of manure into methane gas. The manure is fed into an anaerobic
(without oxygen) tank where bacteria convert the organic matter into methane,
which is collected under a plastic dome or hard cover. The gas is piped into an
engine generator to generate electricity for farm use, with any excess sold into
the grid.
The DPS projected the potential level of development of manure digesters in
New York based on, among other things, the number of dairy farms and milk
cows in the state. It was estimated that approximately 44 MW of potential
generating capacity could be operating by 2013. The State University of New
York at Morrisville (SUNY) announced a manure digester project that would
produce approximately 1 MWh per cow per year. It is appropriate for large farms
to install manure digesters, initially with the support of organizations like
NYSERDA, for the purposes of controlling odors and pollution and to produce
electricity for on-site consumption. The technology is not, however, a reasonable
alternative generation technology for the Applicant, because of its small scale
and distributed nature. A single wind turbine can produce up to 8,000 times the
energy per year per acre used as a manure digester/dairy farm combination.,
3.4 Photovoltaics Photovoltaic (or PV) systems, commonly known as "solar cells," convert light energy
directly into electricity. Today's PV devices convert 7%-17% of light energy into electric
energy.
The largest drawback to solar power today is price, with electricity from PV systems
costing about 30 cents/kWh about 5 times the cost of electricity generated by a

commercial wind farm, which is roughly 6 cents/kWh (depending on the quality of the
wind resource). Another drawback to PVs is that they only generate electricity during
daylight, and are most efficient when the sun is shining. On a small scale, therefore,
energy storage systems are required.
• Residential - A typical residential PV system can average 3 kW installed
capacity, and take advantage of utility net metering. Net metering permits the
customer to spin their meter backwards when the solar electric system produces
more power than is consumed at the home, and to receive retail credit for this
power.
• Commercial / Industrial Sited Systems - These PV systems are designed to
maximize solar energy and capacity output. These systems, with an average
installed capacity of 200 kW, will generally be sized so that they produce power
"behind the meter" for the customer, and not export any power to the utility grid
since they are not eligible for retail net metering. Although the customer is not
exporting power to the grid, the electric and capacity benefits produced by these
systems reduce the customer load, and therefore, directly off-set demands on the
power grid.
• Building Integrated Photovoltaic Systems - These systems will typically
provide lower levels of solar output, due to their vertical orientation on building
facades. However, they can provide building material cost reductions (for glazing
or cladding materials) that can partially or wholly off-set the power production
penalty. To take advantage of this benefit, building integrated systems are
therefore most likely to be installed in new construction applications. These
systems are primarily sized to meet loads on the customer's side of the meter.
PV technologies remain a very small generation source in the current state energy mix
(generating considerably less than the output of the smallest wind farm in the state).
The market development and application of solar technologies will be greatly affected by
cost factors and the availability of sites. Solar technologies are best suited for generation
near points of electricity use, because solar will be much more competitive with retail
electricity rates of 15c/kWh than with wholesale rates of 6.5c/kWh. Deployable spaces
include roofs, facades, parking lots, and exclusion zones (i.e., along roadways). The
DPS estimates that New York's PV potential development is 18.7MW by 2013.

Finally, and similar to the circumstances discussed above, none of the Applicant’s
leases authorize any PVC technologies on the subject parcels, which constitute the
Project area nor are these activities specifically regulated by the town zoning ordinances
in the Project area. Further, upstate New York does not have a suitable solar resource
for commercial scale PV systems. Finally the Applicant, a commercial wind farm
developer, is not well suited to PV system development or operation.
3.5 Ocean Energy Generating technologies that derive electrical power from the world's oceans include
tidal energy, wave energy and ocean thermal energy conversion. Tidal energy takes the
highly predictable nature of the tides and converts its kinetic energy into electricity by
placing turbine equipment in off-shore areas. It is only practical at those sites where
energy is concentrated in the form of large tides and where the geography is suitable for
tidal plant construction. These conditions are not commonplace, but several locations in
Maine and Alaska have been identified as having the greatest potential in the United
States. Most of the efforts in this field are taking place in Europe. In 2003, the world's
first offshore tidal energy turbine was built in the United Kingdom. Many devices have
been invented to harness the waves' power, but few have been tested. Of those that
have, most have only been in artificial wave tanks.
Ocean thermal energy conversion converts the temperature difference between the
ocean's surface and at depth into electricity. This is done by using the warmer water to
heat a working fluid which evaporates at pressure and operates a turbine. Conditions
require a temperature difference of at least 36ºF, at a depth of around 1000 meters for
the process to work, meaning there is no real potential in and around New York.
Further, these technologies are still under development and are not expected to become
commercially available in the foreseeable future. This option is clearly not viable within
the specified Project area.
3.6 Conclusion To summarize, the Applicant’s purpose is to generate electricity from wind. Even if the
Applicant’s purpose were broader – to generate renewable energy from any technology
that could qualify under the New York State RPS – the alternative technologies open to
the Applicant to meet such broader purpose are limited, and none are reasonable
alternatives for the Applicant at the current time given the Applicant’s capabilities, the
lease limitations and local zoning restrictions. Further, the Applicant has no existing coal
facilities that can be co-fired with biomass that can be developed or expanded. The

Applicant is not a large dairy farmer, an engineering contractor, landfill developer or
landfill owner/operator. The ocean energy, biofuel and biogasifier fields are not well
developed and not necessarily suitable for power generation in New York. The
photovoltaic market in New York is tiny and is generally limited to residential and
commercial behind-the-meter applications
4.0 ALTERNATIVE TURBINE TECHNOLOGIES Several types of wind energy conversion technologies were evaluated for the Project.
However, for the application of utility scale electrical power generation, the technology
that has demonstrated itself as the most reliable and commercially viable is the 3-
bladed, upwind, horizontal axis, propeller-type wind turbine as shown in Figure 1
(turbines labeled (c) and (d)). Figure 1 and Table 2 compare various wind turbine
technologies on the basis of the relative scale and size of commercially used units.
Although larger versions of all models shown have been produced, the diagram
illustrates the average sizes of versions that have been implemented on a substantial
scale with hundreds of units installed. The Project contemplates the use of the most
successful class of wind turbines which are megawatt-class wind turbines. The choice of
this type of turbine also minimizes overall impacts, since there are fewer turbines, a
smaller overall Project footprint, less visual impact, and less potential for avian or bat
impacts due to a smaller total Rotor Swept Area and a lower RPM.
Source: Horizon Wind Energy, 2007.
C
D
A
(a) (b) (c)
B
(d)
Figure 1. Relative Scale and Size of Various Wind Turbine Technologies

Table 2. Comparison of Various Wind Turbines
Type Typical Generator Size
Typical Size
Typical Rotational Speed
a Darrieus Rotor 50-100 kW A - 100-150 ft. 50-70 RPM
b 2-bladed (downwind) 50-200 kW B - 150-200 ft. 60-90 RPM
c 3-bladed (upwind) 500-1,000 kW C - 240-300 ft. 28-30 RPM
d 3-bladed (upwind) 1,500-3,000 kW D - 300-475 ft. 9-25 RPM
Source: Horizon Wind Energy, 2007.
4.1 Vertical Axis Darrieus Wind Turbines The most widely used vertical axis wind turbine (VAWT) was that invented in the 1920s
by French engineer, D.G.M. Darrieus. It is called the Darrieus Wind Turbine or Darrieus
Rotor and commonly dubbed the “eggbeater.” Figure 1 illustrates both the eggbeater
(VAWT) and the propeller types (horizontal axis - HAWT) of wind turbines. The Project
will utilize the horizontal axis type of wind turbines. The Darrieus turbine was
experimented with and used in a number of wind power projects in the 1970s and 1980s
including projects in California. Figure 2 illustrates an example of a Darrieus turbine in
Washington State.
Despite years of diligent design,
experimentation and application, the Darrieus
turbine never reached the level of full
commercial maturity and success that
horizontal axis turbines have, due to inherent
design disadvantages. Over the years, the 3-
bladed horizontal axis wind turbine has
proven to be the most reliable, efficient, and
commercially viable wind power technology.
A few of the advantages of propeller type wind turbines over the eggbeaters are
discussed in further detail below.
4.2 Higher Wind Speeds Higher Above the Ground Darrieus rotors are generally designed with much of their swept area close to the ground
compared to HAWTs. Wind speed generally increases with the height above ground as
is the case on the Project area. HAWTs benefit from having higher wind speeds and
higher wind energy that can be extracted incident to their rotor plane.
Figure 2. Darrieus Wind Turbine

A wind assessment program has been performed by Marble River over the six year
period from 2002 to 2008. Based on this data, the wind shear characteristics at the
project site have been determined. Wind shear describes the amount by which wind
speed changes with an increase in height. The calculated wind shear indicates that,
because of it relatively low height, the Darrieus turbine or VAWTs would not be a viable
option at the Project area.
4.3 Cut-in Wind Speed VAWTs require a higher level of wind speed to actually start spinning as compared to
HAWTs. Older VAWT machines were generally “motored-up” by using the generator as
a motor for start-up. HAWTs do not require as much wind speed for start-up and most
have the advantage of variable pitch blades, which allow the turbine to simply change
blade pitch to start up. Modern HAWTs do not need to use the generator to motor-up the
rotor.
4.4 Variable Pitch Most all modern HAWTs have mechanisms which pitch the blades along their axis to
change the blade angle to catch the wind. Variable pitch allows the turbine to maximize
and control power output. VAWTs generally do not have variable pitching capability and
rely on stall regulation. This results in less efficient energy capture by VAWTs.
4.5 Avian Hazards – Guy Wires VAWTs are generally constructed with guy wires, which have been shown to be a
greater hazard to birds than turbines themselves, as they are much more difficult for
birds to see and avoid. The HAWTs contemplated for the Project use free-standing
tubular steel towers and do not require guy wires.
4.6 Turbine Footprint VAWTs are generally fitted with four sets of guy wires which span out from the top of the
central tower and are anchored in foundations as shown in Figure 2. Including the tower
base foundation, VAWTs require a total of five foundations all spread apart. The result is
that the overall footprint and disturbed area for a VAWT is larger than that required for a
comparably sized HAWT. HAWTs on free-standing towers use only one main foundation
and have a relatively small overall footprint in comparison.
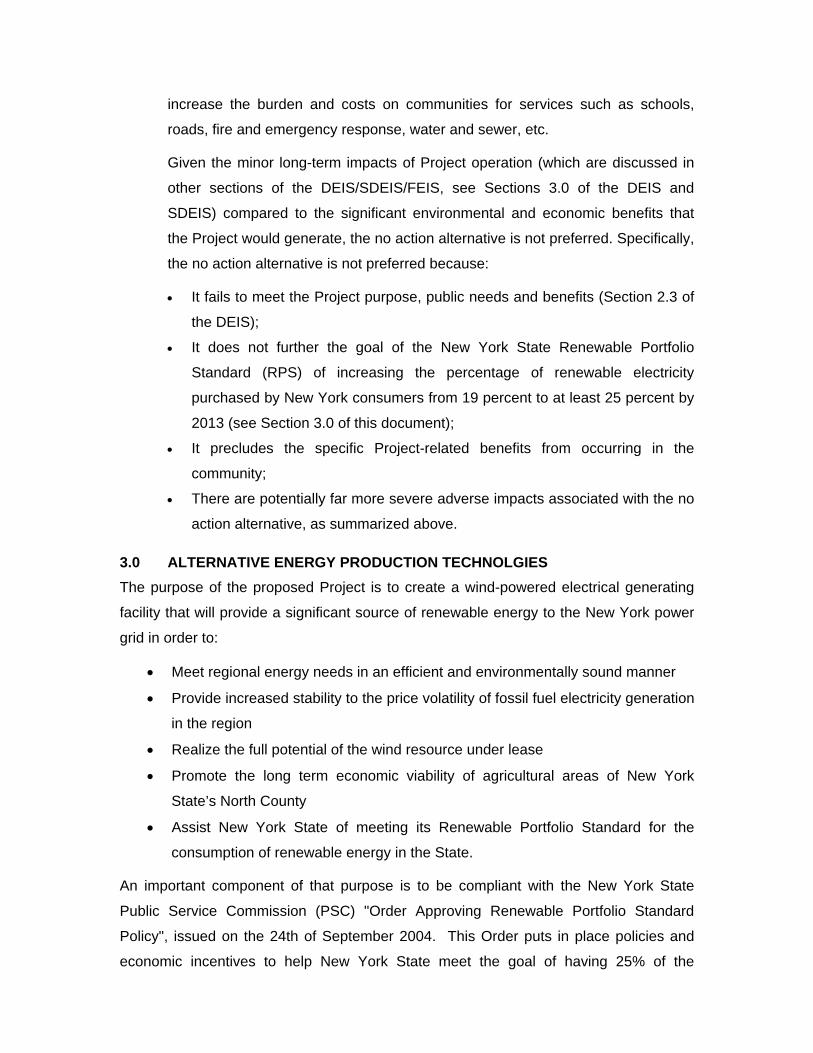
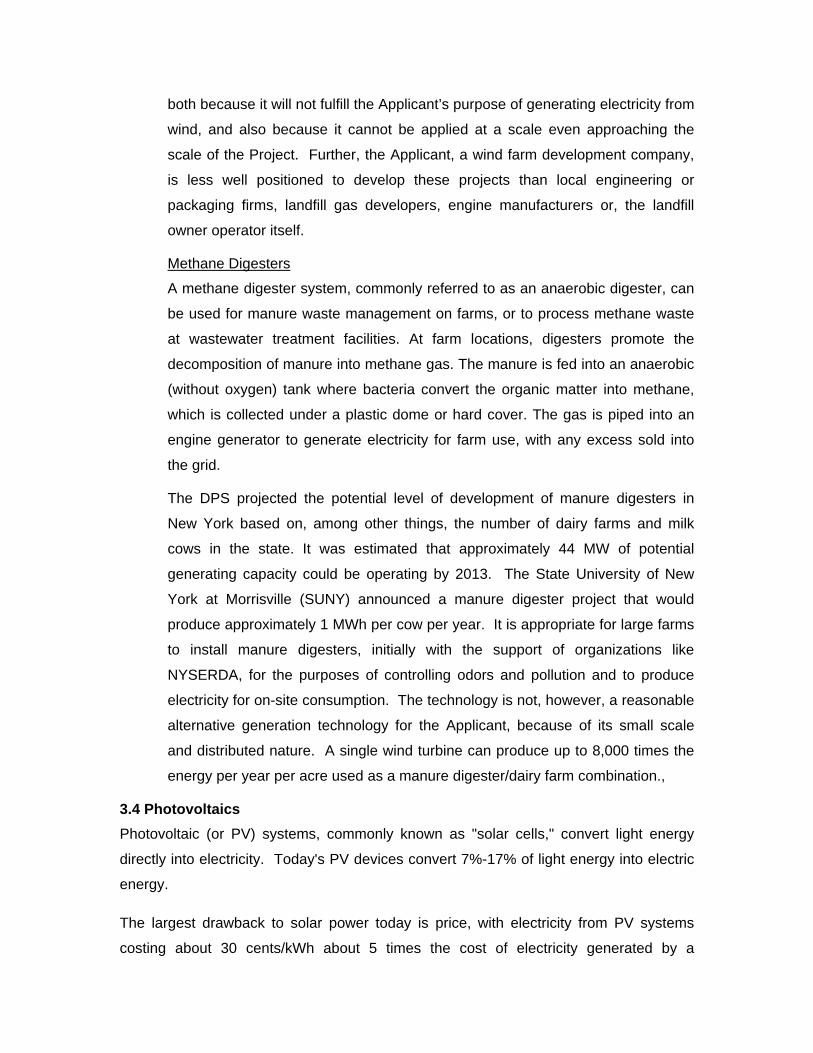
4.7 Fatigue Life Cycles Due to their design, VAWTs have higher fatigue cycles than HAWTs. As the rotor blades
rotate through one full revolution, they pass upwind, downwind and through two neutral
zones (directly upwind of the tower and directly downwind of the tower). In contrast, the
rotor blades on a HAWT do not pass through similar upwind/downwind neutral zones. As
a result, VAWTs are subjected to a far higher number of
fatigue load cycles compared to HAWTs which, past
operating history shows, result in far more frequent
mechanical failures and breakdowns on VAWTs.
For all of the reasons cited above, VAWT’s are not
considered a suitable alternative to the turbines
proposed on the Marble River Wind Farm Project.
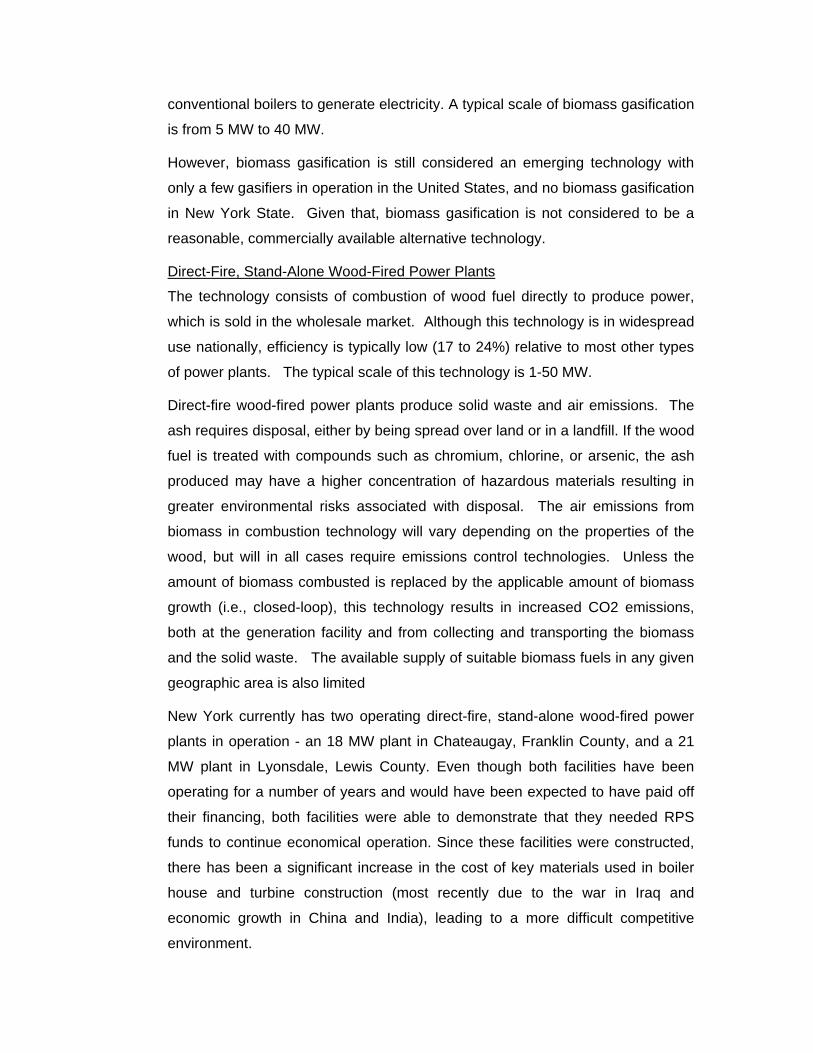
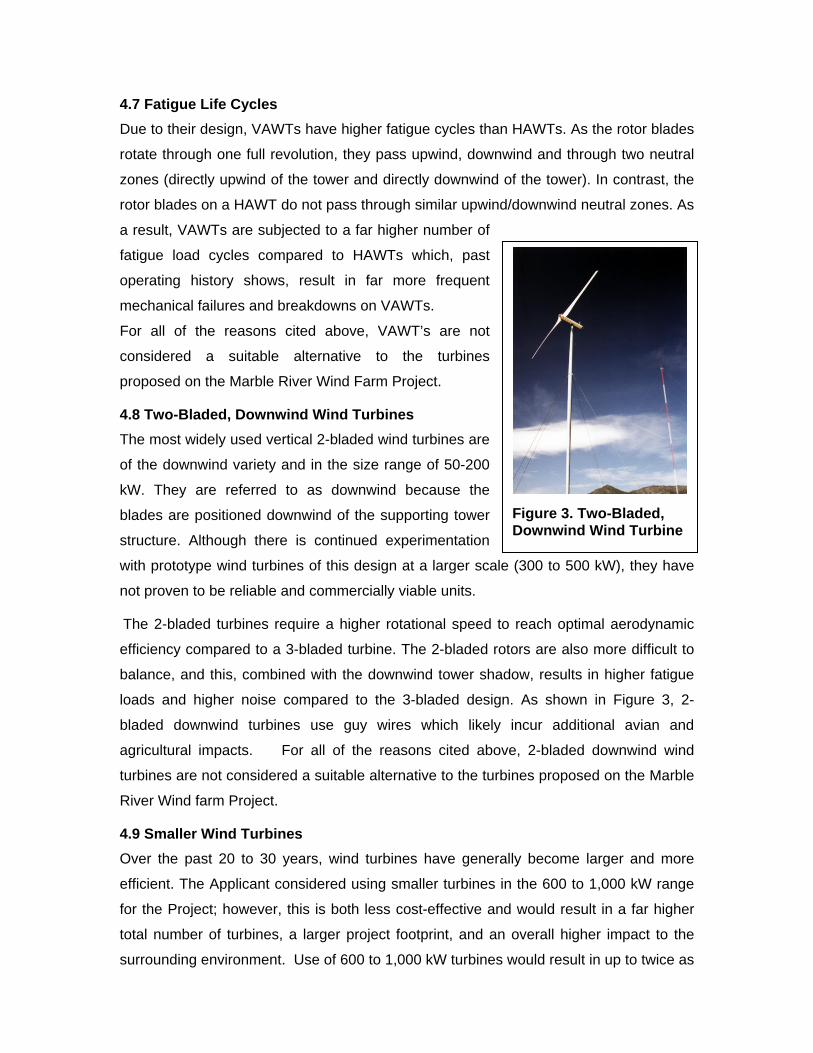
4.8 Two-Bladed, Downwind Wind Turbines The most widely used vertical 2-bladed wind turbines are
of the downwind variety and in the size range of 50-200
kW. They are referred to as downwind because the
blades are positioned downwind of the supporting tower
structure. Although there is continued experimentation
with prototype wind turbines of this design at a larger scale (300 to 500 kW), they have
not proven to be reliable and commercially viable units.
The 2-bladed turbines require a higher rotational speed to reach optimal aerodynamic
efficiency compared to a 3-bladed turbine. The 2-bladed rotors are also more difficult to
balance, and this, combined with the downwind tower shadow, results in higher fatigue
loads and higher noise compared to the 3-bladed design. As shown in Figure 3, 2-
bladed downwind turbines use guy wires which likely incur additional avian and
agricultural impacts. For all of the reasons cited above, 2-bladed downwind wind
turbines are not considered a suitable alternative to the turbines proposed on the Marble
River Wind farm Project.
4.9 Smaller Wind Turbines Over the past 20 to 30 years, wind turbines have generally become larger and more
efficient. The Applicant considered using smaller turbines in the 600 to 1,000 kW range
for the Project; however, this is both less cost-effective and would result in a far higher
total number of turbines, a larger project footprint, and an overall higher impact to the
surrounding environment. Use of 600 to 1,000 kW turbines would result in up to twice as
Figure 3. Two-Bladed, Downwind Wind Turbine

many total turbines and a greater total rotor swept area to produce the same amount of
energy. For example, the total height of the typical 660 kW turbine is about 73 percent of
the total height of the typical 1,500-kW turbine, while its total output is only 44 percent of
the output of the 1,500-kW turbine. As the growth trend of the wind energy industry has
continued, smaller machines have become less cost-efficient and less competitive. Use
of multi-megawatt class turbines result in lower energy prices than sub-megawatt-class
turbines.
Using more turbines to produce the same amount of energy also results in more turbine
foundations, which results in more land area being disturbed. Potential operational
impacts (e.g., noise, avian mortality) could also increase with a larger number of smaller
machines. In terms of visibility and visual impact, while smaller turbines might be
marginally less visible from a distance, the larger number of turbines necessary to
generate an equivalent amount of power would likely have a greater overall visual
impact (see discussion in the Project Visual Impact Assessment [VIA] and Supplemental
VIA [SVIA]; Appendix K of the DEIS and SDEIS). As indicated above, “small” turbines,
depending on the make, have features that have a greater impact on the local
environment (visually as well as ecologically) for substantially less amounts of renewable
energy output.
4.10 Alternative Multi-Megawatt Turbines The Applicant initially considered nine potential turbine models produced by five
manufacturers. Turbine sizes ranged from 1.5 MW with 77 meter rotor diameters to 3.0
MW and 100 meter rotor diameters.
The Applicant rejected the extreme ends of the spectrum (below 1.5 MW or above 3
MW), based largely on limited availability in the marketplace or unfavorable
pricing/economics in the current timeframe. Additional constraints exist in New York that
make the 1.5 MW to 2.3 MW scale of the turbine size spectrum the most beneficial to
project efficiency and quality. On the lower end of the spectrum (1 MW and below), the
following three specific concerns have led to the decision to avoid siting a smaller turbine
size at the Marble River site.
• Decrease in Land Owner Royalties – Each landowner in the Marble River
site will receive royalties (based on a percentage of energy generated) from
the operation of the turbine on their land. The landowners are, by and large,
dairy farmers who have come to look forward to, expect and depend on the
amount of revenue that can be generated from a multi-megawatt turbine. The

decreased in royalty (it would decrease by over 50%) from a smaller turbine
would represent a substantial economic hit to each participating farmer in the
Project and likely a re-consideration regarding the benefits of participating in
the Project.
• Long Term Maintenance – As noted in Figure 1, technological innovation in
the wind turbine industry has trended toward larger (and hence more
efficient) turbines since the 1970’s (e.g., whereas the average turbine size in
1995 was 600 kW, the average turbine size in 2007 is 1.6 MW). Accordingly,
turbine manufacturers attention is focused on contemporary technology
rather than yesterday’s technology. Similar to patterns observed in other
technology-based industries, turbine manufacturers will discontinue support
for less popular models, hence making operational maintenance more
expensive and less reliable for turbines below 1 MW.
• Potential Increased Avian Impact – Smaller turbines (less than 1 MW)
operate at higher rpm’s than the larger multi-megawatt range of turbine. The
body of data from existing post-construction studies of wind turbines ranging
in size from 660 kW to 3.0 MW suggest that for a site with an equivalent
number of turbines, the potential for negative avian impact decreases as the
average rpm of the turbine decreases (though the same body of data also
suggest that minimizing avian impact is more strongly correlated with
responsible siting practices than rpm considerations).
On the larger end of the spectrum (3 MW and beyond), one specific concern has led to
the decision to avoid siting larger turbines at the Marble River site. For larger turbine
models, the size of the components associated with currently available 3+ MW turbines
exceed the logistical constraints (road width, bridge height, etc.) that exist when
transporting these components to the site. For this reason, current applications of 3+
MW turbines are currently all offshore applications where road constraints like turning
radii, bridge heights and overhead wire heights don’t apply.
Given the limited land under lease and the constraints previously mentioned, a 1MW
turbine would have reduced the Project output by almost 50% without reducing the
access road or collection line length, and interconnection facilities and associated costs,
or making any significant difference to the footprint of the proposed layout. This would
reduce the Project’s return and concomitant environmental benefits, while maintaining

essentially the same Project costs. This would result in increased energy price in order
to accommodate these circumstances
Additionally, based on the expert opinion of the panel of three registered landscape
architects that evaluated the nature of the visual impact of the Project (as described in
the Methodology section of the VIA located in Appendix K of the DEIS and SDEIS), it
was determined that the visual characteristics of current multi-megawatt turbines,
specifically their narrow profile, slender blades and white color, work to limit potential
visual impact.
A further important constraint that must be considered when assessing the viability of
potential project alternatives is the current supply and demand equation that exists for
wind turbines. As suggested in a National Renewable Energy Lab paper titled "A
Preliminary Examination of the Supply and Demand Balance of Renewable Energy"
(dated October 2007 and authored by Blair Swezey, Jorn Abakken and Lori Bird), global
demand for renewable energy equipment is leading to supply shortages for wind
turbines. This means long lead times for wind turbines and high upfront costs to secure
wind turbines early enough within the development period to assure a projects ultimate
viability.
As a result, the approximate size of the turbines (in this case ~2MW) must be identified
very early in the development process to allow plans to be made to procure turbines in
time for construction. The consequence is that the approximate turbine size was locked
in early on in order to allow the NYISO and NYPA to study the impacts of a certain size
project on the reliability of the electric grid. The turbine size (~2MW) and the number of
turbine sites (109) dictates the size of the project studied, and a smaller turbine
alternative becomes less viable (smaller turbines would require more turbine sites to
have the same impact in the system studies).
5.0 ALTERNATIVE LOCATION At the outset we note that the Applicant is a private developer without the power of
eminent domain. It has a lease hold interest in the Project area, based on individual
leases which were negotiated with private landowners. Project sites are not fungible and
are put together as a result of extensive, and often competitive, negotiations with
multiple landowners. Each of the 87 participating landowners in the Project has invested
their personal time and energy to visit operating wind farms in the state and work with
legal council to negotiate a mutually beneficial lease with the Applicant. A majority of the
87 landowners within the Project actively farm the land within the Project area. The
steady revenues produced from harvesting the wind will be counted on as a reliable
source of alternative revenue and fundamental pillar supporting the long term economic
viability of each farm in the Project area.
The Applicant determined to negotiate for control of the proposed site (a process that
has taken over 5 years) as opposed to other possible sites located in the same region
and market as the site for the Marble River Wind Farm for three unique reasons:
• Superior Wind Resource – The proposed Marble River Wind Farm has been
identified by AWS Truewind in a NYSERDA funded study as including two of
the top 10 wind energy sites in New York State, and is thus considered ideal for
development of clean renewable energy in compliance with the NYS
Renewable Portfolio Standard (RPS). It is important to note that to shift the
current Project area either a half mile west or east would result in decreases of
wind duration, extent and velocity, and an overall decrease in ultimate
productivity by a factor of up to 10% (and a corresponding price increase).
Wind farm projects must maximize productivity to effectively compete in the
New York State electricity market and, ultimately, efficiently fulfill the New York
State Renewable Portfolio Standard by supplying energy-related benefits (e.g.
Renewable Energy Certificates [RECs]) at the lowest possible price to the
state’s ratepayers.
• Transmission – The presence of available 230 kV transmission lines within
the Project area (New York Power Authority Willis-Plattsburgh 230kV line) is
critical in developing a wind farm that is able to reliably deliver inexpensive
electricity to the New York power grid. Existing on-site transmission facilities
avoid the cost and environmental impact associated with the construction of
additional transmission lines to facilitate connection to the power grid.
• Land Owner/Community Acceptance – The complex nature of wind projects
requires community acceptance both from the local governing bodies as well
as individual landowners. The towns of Ellenburg and Clinton, with the support
of 136 participating land parcel owners, have made wind energy a town priority
by passing comprehensive wind energy zoning ordinances in November 2005.
The local dairy farming community has also enthusiastically welcomed and
supported the development of the Marble River Wind Farm. The potential
alternative revenue source for local farmers will provide many participating
small farmers the opportunity to remain competitive as farming entities, thereby
assisting with the maintenance of their long-standing way of life and preserving
the rural character of the community.
Few other areas in the state of New York have as strong and reliable wind as the
Churubusco Plateau and the Applicant does not have control of other sites in this region
or market. This, in combination with the lack of Forest Preserve lands, the sparse
population, and the dominant agricultural land use make the towns of Clinton and
Ellenburg uniquely suitable for development of a large-scale wind power project. The
current Project boundary within the towns of Clinton and Ellenburg, the northern tip of
the Churubusco plateau, is sited so as to maximize the productivity of the proposed wind
farm by using the most energetic (windy) sites along with the land where wind turbines
are most compatible and would have the least impact. As mentioned above, areas to the
immediate west and east have reduced wind velocities (See Wind Resource Map
attached in Figure 4. Areas to the south are not considered viable due to their location
within the Adirondack Park, and areas to the North are not viable due to the fact that
they lie within Canada, which does not provide for access to the New York State Power
grid. Thus, relocating the Marble River Wind Farm elsewhere within the towns of Clinton
or Ellenburg would both reduce its economic viability and potentially increase its
environmental impacts.
6.0 ALTERNATIVE PROJECT SCALE AND MAGNITUDE Project components of alternative size and number were considered. A project of
significantly more, or fewer, turbines would pose challenges to the technical or economic
feasibility of the Project. If the proposed number of turbines were significantly reduced,
the economic feasibility of the Project would be jeopardized and the maximum benefit of
the available wind resource would not be realized.
The Applicant seriously considered a smaller Project. Horizon Wind Energy originally
planned a smaller Project of 75, 1.65 MW turbines within the towns of Clinton and
Ellenburg. While a smaller project does result in fewer temporary and operational
impacts, the economic benefits to the towns also decrease proportionately. Further,
there were multiple companies proposing projects within the towns of Clinton and
Ellenburg. The cumulative impacts of the smaller projects proposed by Horizon Wind
Energy and NY Windpower, respectively, were greater than the potential impacts of a
single, jointly developed site. One reason for this is that a jointly developed site allows
for flexibility and economies of scale. A joint development allows for a single substation,

switchyard, O&M facility and a single underground collection system, thus decreasing
the permanent impact of the proposed Project. Most importantly, the flexibility gained by
joining forces has allowed the Applicant the ability to develop a project in a manner that
minimizes environmental impacts while maintaining economic viability. Finally, the
Marble River Wind Farm’s proposed 109 wind turbines are significantly less than the
cumulative number of turbines that would have been proposed in the two smaller
projects (i.e. two smaller projects were originally proposed to be 50 turbines and 75
turbines, respectively – for a total of 125 turbines – 16 more than the current proposal).
In addition to a smaller design, the Applicant initially considered a larger development
consisting of 190 turbine sites, approximately 70 miles of access road, and
approximately 103 miles of underground collection system (electrical). Reasons for
abandoning this alternative and reducing the size of the proposed development are
provided below.
Marble River, LLC is doing business in a wholesale electric market that is highly
competitive and extremely price-sensitive. Commercial wind farms produce two
products: a) the commodity electric energy, and b) RECs that convey the “environmental
attributes” that are generated along with each unit of electricity produced from renewable
sources. The power produced is sold directly to the power grid through an hourly
auction, essentially guaranteeing that the lowest price always wins the auction (and thus
assuring New York rate-payers the most competitive electricity rates). The emphasis of
this “merchant” market place is on low cost. Thus, for a wind power project to be
economically viable and maintain its financial commitments designated within the PILOT
and Host community agreements, it must be able to sell its electricity at the lowest
possible rates in the merchant market place. The high fixed costs of developing and
constructing a wind farm dictate that a larger project will always be the more cost
competitive.
Alternatively, a larger project would result in location of wind turbine towers in areas that
are less windy, and would also force installation of more turbines in areas with larger or
more abundant sensitive resources (like wetlands). Further, the Applicant has concluded
that the transmission line on which the Applicant will interconnect has limited capacity.
Additional upgrades to the line would decrease the viability of a larger project.
Economic and policy reasons taken into consideration when considering a smaller
project alternative included the following:

• NYS Renewable Portfolio Standard Fulfillment – As detailed in Section 3.0
of this document, the plan to fulfill the New York States RPS has been driven
by the NYS DPS. Aside from the ultimate goal of 25% renewable energy by
2013, the plan published by NYSERDA sets annual clean energy
procurement goals for each year leading into 2013, as Table 3 illustrates:
Source: New York State Renewable Portfolio Standard – Performance Report period ending March
2007, http://www.nyserda.org/rps/2006RPSPerformanceReport.pdf
As Table 4 suggests, the economically competitive, clean energy available for
procurement by NYSERDA has fallen short of the targets set by NYSERDA to
fulfill the RPS policy in 2006, 2007 and 2008.
One major factor driving the Applicant’s decision against the smaller project size
alternative was this demonstrated need for additional supply of clean energy to
meet RPS goals.
Table 3. RPS Energy Targets (in Megawatt hours)
Table 4. Main Tier Targets and Results (000s MWh)
Source: New York State Renewable Portfolio Standard – Performance Report period ending
March 2007, http://www.nyserda.org/rps/2006RPSPerformanceReport.pdf
• Local Municipal and Landowner Benefit – Throughout the SEQR
process the landowners and municipalities have had the opportunity to
review the layout and provide input into the Applicant’s design plans.
Throughout this process one consistent message from landowners and
municipalities was that they would prefer a Project alternative that
generated the greatest potential for additional revenue. Of the 87
participating landowners in the Project (67 of which are landowners in
Clinton which is equivalent to 30% of the 201 Clinton households [2000
Census]) have similarly voiced a preference against the smaller
alternative. In particular, the local municipality of Ellenburg suggested the
smaller alternatives were not their preferred option because those options
would fall short of fulfilling their fiscal goal of generating revenue
equivalent to the respective town budgets.
• Lesser Economic Viability of Small Project Alternative – New York
State’s de-regulated electricity market emphasizes the use of competition
amongst electricity generating utilities to assure that New York State
ratepayers are receiving the lowest rates available. As an independent
power producer in New York State, the Applicant must generate a
competitively priced product in order to be able to sell it into the grid. Like
most competitive businesses, wind farms have fixed costs and variable
costs. A substation would be considered a fixed cost, because no matter
what the size of the project, a substation must still exist, whereas each
additional wind turbine would be considered a variable cost, because
each additional turbine provides additional revenue to pay for itself. As
fixed costs increase, a competitive business must increase its potential
revenues to dilute the higher costs and still compete effectively. The high
fixed costs associated with the proposed Marble River Wind Farm
(including system upgrade costs of $4.66 million for the New York Power
Authority and substantial up-front expenses associated with obtaining
local, state and federal permits for the Project) suggest that the economic
hurdle to be competitive on this Project is higher than it might in a
situation where system upgrades, interconnect facilities and permitting
costs were more modest. When considering alternatives to the proposed
Project, this relationship between fixed costs and variable costs
suggested that a smaller alternative would be less likely to competitively
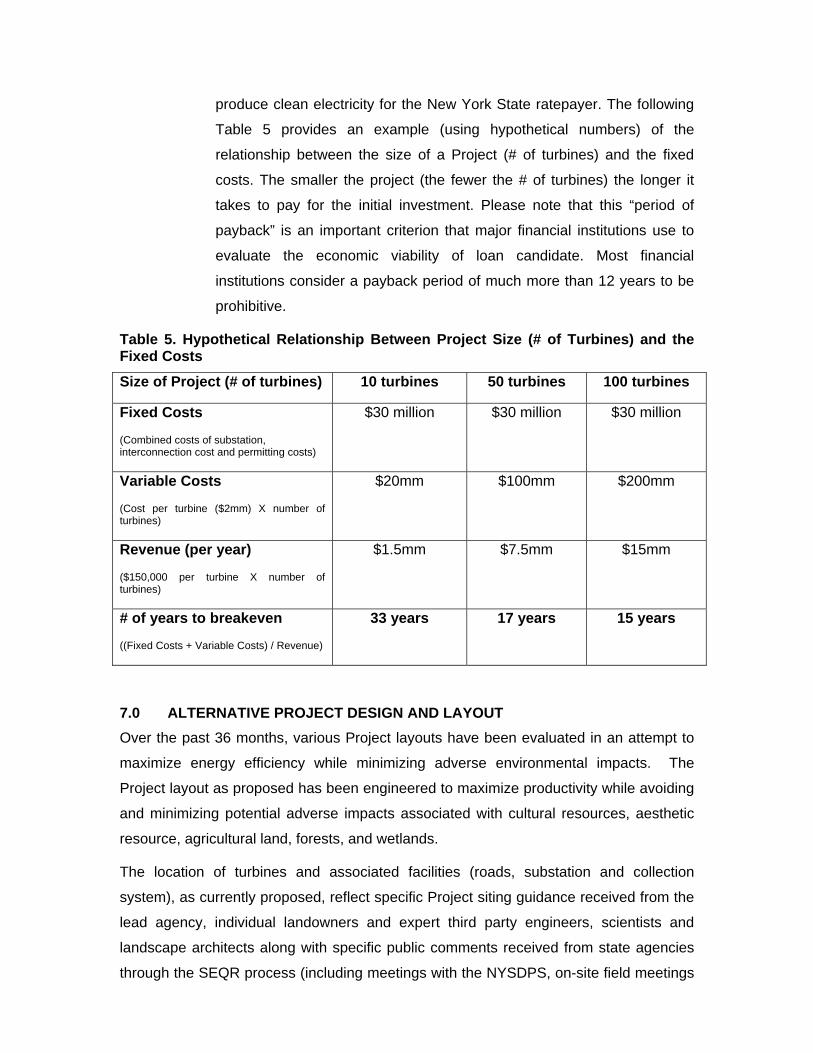
produce clean electricity for the New York State ratepayer. The following
Table 5 provides an example (using hypothetical numbers) of the
relationship between the size of a Project (# of turbines) and the fixed
costs. The smaller the project (the fewer the # of turbines) the longer it
takes to pay for the initial investment. Please note that this “period of
payback” is an important criterion that major financial institutions use to
evaluate the economic viability of loan candidate. Most financial
institutions consider a payback period of much more than 12 years to be
prohibitive.
Table 5. Hypothetical Relationship Between Project Size (# of Turbines) and the Fixed Costs
Size of Project (# of turbines) 10 turbines 50 turbines 100 turbines
Fixed Costs
(Combined costs of substation, interconnection cost and permitting costs)
$30 million $30 million $30 million
Variable Costs
(Cost per turbine ($2mm) X number of turbines)
$20mm $100mm $200mm
Revenue (per year)
($150,000 per turbine X number of turbines)
$1.5mm $7.5mm $15mm
# of years to breakeven
((Fixed Costs + Variable Costs) / Revenue)
33 years 17 years 15 years
7.0 ALTERNATIVE PROJECT DESIGN AND LAYOUT Over the past 36 months, various Project layouts have been evaluated in an attempt to
maximize energy efficiency while minimizing adverse environmental impacts. The
Project layout as proposed has been engineered to maximize productivity while avoiding
and minimizing potential adverse impacts associated with cultural resources, aesthetic
resource, agricultural land, forests, and wetlands.
The location of turbines and associated facilities (roads, substation and collection
system), as currently proposed, reflect specific Project siting guidance received from the
lead agency, individual landowners and expert third party engineers, scientists and
landscape architects along with specific public comments received from state agencies
through the SEQR process (including meetings with the NYSDPS, on-site field meetings

with the NYSDEC, planning meetings with NYSOPRHP and on-site walkovers with the
NYSDAM).
Over the course of the past 36 months, the Applicant has implemented multiple impact
avoidance and minimization measures, as suggested in the various studies completed
for the Marble River DEIS and SDEIS, to minimize the total environmental adverse
impact.
Special priority was given to avoiding and minimizing potential adverse impact to
wetland, cultural resources, and visual resources, as described below.
7.1 Wetland Resource Avoidance and Minimization Methodology The practice of avoiding impacts to aquatic resources was implemented in the initial
stages of the Project. Efforts included desktop review of mapped wetlands during the
initial siting phase, preliminary field investigations and three major Project layout
modifications. The first layout modification effort was conducted during the summer and
fall of 2005 and the second was conducted during the summer of 2006, after completion
of the DEIS and three wetland delineation reports. The overall objective of these efforts
was to eliminate impacts by relocating Project facilities, and determining the optimal
location of the 109 wind turbines to achieve the least environmentally damaging,
practicable alternative.
Avoidance: The following approach to large scale wetland avoidance was undertaken by
the Applicant:
• Objective - Avoid wetland impact by identifying areas of significant wetland
impact and suggesting alternative locations for Project facilities.
• Methodology - Each avoidance step was made as a result of a field team
(made up of GPS operators, expert wetland biologist and a developer’s
representative) walking the proposed facilities, assessing potential wetland
impact, and evaluating alternative solutions.
• Examples of Avoidance - Table 6 provides a list of the 339 field
delineated wetlands that based on the review of the potential impacts and
relocations where completely avoided to minimize wetland impacts. Many
of the major avoidance measures included:
Turbine deletions, including associated access road deletions.
Re-location of turbines.
Major access road relocations.
Relocation of underground collection corridors.
Minimization: Refers to the small scale adjustments which were made within the Project
layout in order to reduce impacts to resource areas. Once the Project avoided all
possible field delineated wetlands, the Project team set out to micro-site the Project
facilities to minimize the unavoidable wetland impacts. The field efforts consisted of a
three year process utilizing the following approach:
• Objective - To minimize wetland impacts by making minor adjustments to
Project facilities after reviewing each wetland impact and identifying
possible means to avoid permanent impacts and minimize temporary
impacts.
• Methodology - Each minimization adjustment was made as a result of a
field team (made up of a civil engineer, expert wetland biologist, GPS
operator and a developer’s representative) visiting each delineated area
deemed to have a potential wetland impact and to propose and evaluate
the viability of alternative solutions.
• Examples of Minimization - Table 6 provides a detail of the 339
wetlands that would be affected by a Project improvement, and a
justification for how the Project minimized the impact to the wetland.
Since April 2007, Marble River, LLC decreased the potential permanent
and temporary wetland impacts by 4.36 acres and 4.61 acres,
respectively. Details of these impact reductions by wetland are provided
in Table 6.
7.2 Results of the Avoidance and Minimization Measures Implemented The initial design and layout of the Marble River Wind Farm proposed the development
of 190 turbine sites, approximately 70 miles of access road, and approximately 103
miles of underground collection system (electrical). Appendix GG of the Supplemental
Joint Wetlands Permit Application (Oversized Wetland Avoidance and Minimization Map)
provides details regarding the previous layouts compared to the currently proposed
layout and provides a comprehensive presentation of the efforts that have been
progressed by the Applicant. Avoidance and minimization efforts resulted in the
following:

1) Seventy four (74) of the 190 turbines sites (40%), along with the associated
roadways and collectors, were eliminated for the following reasons.
• Wetland Impact (46 turbine sites) – Given the prevalence of wetlands
at the site, many proposed turbines sites affected substantial wetland
acreage, would not have complied with the 404 (b)(1) Guidelines,
and/or would not have represented the least environmentally
damaging practicable alternative. Fourteen of these 46 turbines (3a,
161a, 204, 63a, 201, 202a, 203, 208, 209, 148a, 84a, 28a, 15a, 207)
were subsequently added to the layout as new turbine sites.
• Excessive Access Road Length (19 turbine sites) – Many of the most
productive turbine sites lay well out of reach of any public or private
roads. In 19 of these cases the Applicant deemed that the cost and
impact of building access roads outweighed the benefit of the
respective turbines.
• Wind Productivity (9 turbine sites) – Each wind turbine produces a
“wake effect” that has the potential to negatively interfere with the
productivity of other turbine sites. In some cases this required
elimination of a proposed turbine. The Applicant moved nine turbine
areas as a result of this analysis.
2) The size of each proposed turbine was increased from 1.6 MW to 2.0 MW per
turbine. The change allowed the Project to maximize potential output while
decreasing the number of required turbine sites, decreasing associated
access road impacts, and decreasing utility line impacts.
3) Approximately 25 miles of proposed access roads were adjusted to coincide
with existing/abandoned farm and logging roads, reducing impacts from 70
miles to approximately 45 miles (a reduction of 40%).
4) A single overhead collection line, running the length of the Project, was
incorporated into the Project design to eliminate temporary wetland impacts
associated with multiple underground collection line trenches.
5) Within the survey area (refer to final wetland delineation report in Appendix A
of the FEIS) there are approximately 141 acres of USACE jurisdictional
wetlands, of which only 8.84 acres would be permanently filled, and 64.63

acres would be temporarily disturbed. This represents only 6 percent of the
on-site being filled.
7.3 Routing of the Overhead Collection System – Alternative Analysis The Applicant retained the services of TRC, a recognized expert in the electrical and
environmental engineering field, to perform a study of the options for the collection line
between the northeast of the Project and the substation. In coordination with Rob Simms
(an expert electrical engineer with AES) the options considered included (a) a 230kV
line, which was discarded due to the extended permitting schedule and the expense of
the higher voltage line, (b) a 115kV line, which was discarded due to the environmental
and financial costs of installing an additional substation in the northeast of the Project
and an additional transformer at the substation and (c) a 34.5 kV line. The latter was
chosen because it has less impact and lower cost then the other options.
The current routing of the proposed 34.5 kV overhead collection system has been
selected over three alternative routes for four specific reasons; 1) minimization of
impacts to wetlands (including forested impacts), 2) existing and potential land control,
3) reduction of visual impacts, and 4) cost. Data regarding these aforementioned factors
for the existing and alternative overhead electric collection line routes is provided in
Table 7. Potential temporary wetland impacts of each alternate route are provided in
Table 8. Appendix FF of the Supplemental Joint Wetlands Permit Application (Oversized
Overhead Electric Collection Line Alternative Analysis Map) illustrates wetland impacts
associated with the existing and alternate overhead collection line routes. Details
regarding the selected and alternate routes follow.
• Current Proposed Overhead Collection Route: The existing route starts at Wind Turbine Generator (WTG) 155 in the northeast
portion of the Project, and proceeds down Soucia Road until it reached Clinton
Mills Road. The route travels southwest towards State Route 189, where it
continues to travel southwest crossing over Gagnier Road, before ultimately
reaching the Project substation. This route was chosen because it would affect
the least amount of wetlands (33.83 acres). The Applicant was able to utilize the
existing route by purchasing a 200 acre parcel in the middle of the line and by
signing leases and options with all the remaining landowners.
The existing route has leases and options signed with all the landowners, and it
is the least costly option of the four options. This is the only route for which the
Applicant has secured land control.
• Alternate Route A: (Lagree Work Around) The alternative Route A starts at WTG 155 in the northeast portion of the Project.
The route proceeds down Soucia Road, following the existing route until it
reaches La Francis Road. The route would then travel down La Francis road for
¾ of a mile, where it would travel west to until rejoining the existing route to the
substation. This route was proposed because of the possible non-participation of
one landowner and the need to work around this landowner to make the Project
constructible. This route would be the second best option of the four, since it
impacts the second least amount of wetlands (34.66 acres). However, this
alternate route would traverse high quality wetlands and would increase the
overall line length of the collection system by one-half mile.
• Alternative Route B: (Clinton Mills Road) The alternative Clinton Mills Road route (Route B) starts at WTG 155 and follows
the existing route until it reaches Clinton Mills Road. The route would then
proceed westward down Clinton Mills Road, until it reaches Route 189, where it
would travel south to Gagnier Road, and then west to Patnode Road. It would
then proceed south on Patnode to the Project substation. This route is not
feasible because it would have to traverse the hamlet of Churubusco. This route
would have visual impacts to six historic properties, including the Immaculate
Heart of Mary Church and associated cemetery. This route would also affect the
most wetlands (46.17 acres), and would require additional approval by the towns
of Clinton and Ellenburg and 22 landowners. This alternative would also result in
an increase of over of four miles to the overhead collection line and would add a
significant cost burden to the Project. Finally, as noted above, the Applicant
does not have land control along this Route.
• Alternative Route C: (La Francis Road) The alternative La Francis Road route (Route C) starts at WTG 155 and follows
the existing route until it reaches Clinton Mills Road, where it would travel west to
La Francis Road. The route would then proceed south on La Francis Road, until
it reached Route 11, where it would travel north to Gagnier Road, and then follow
the remaining Route B alternative. This route would affect the second highest
amount of wetlands (36.67 acres) and would require the inclusion of 22 additional
land parcels, the owners of which have not signed any agreements with the
Applicant.

7.4 Wetland Resource and Resource Avoidance and Minimization Conclusion As a result of the process described above, approximately 250 detailed layout
adjustments of varying scale were implemented to avoid and minimize potential impacts
to state and federal jurisdictional wetlands within the Marble River Wind Farm Project
area.
As a result of this process, none of the wind turbines (turbine towers or tower pads) are
located within a field delineated wetland.
Given the large concentration of wetland resources within the Project area, the proposed
layout is considered the best possible alternative due to its ability to avoid and minimize
undue adverse impact to wetland resources to the fullest extent practicable.
See Table 6 of this Alternatives Analysis for a detailed breakout of avoidance and
minimization measures taken since April 3rd 2006.
7.5 Cultural Resource Avoidance and Minimization The Applicant contracted with John Milner Associates (JMA), a recognized expert in the
field, to conduct cultural and resource investigations and surveys in accordance with
Office of Parks Recreation and Historic Preservation (OPRHP) policy. Each study scope
was produced after receiving input and approval from the OPRHP. Specific studies
included the following:
• Phase 1A Cultural Resources Survey - This study was conducted in
accordance with the New York Archaeological Council’s Standards for Cultural
Resources Investigations and the Curation of Archaeological Collections (1994).
JMA’s report entitled Phase IA Cultural Resources Survey: Marble River Wind
Farm, towns of Clinton and Ellenburg, Clinton County, New York is included in
Appendix J of the DEIS
• Phase 1B Archeological Field Survey - This study was conducted in
accordance with the Guidelines for Wind Farm Development Cultural Resources
Survey Work issued by the State Historic Preservation Office (SHPO) in January
2006 and further discussed at the Project meeting with OPRHP staff on January
17, 2006.
• Phase 1B Historic and Architectural Survey - This study was conducted in
accordance with the Guidelines for Wind Farm Development Cultural Resources

Survey Work issued by the SHPO in January 2006 and further discussed at the
Project meeting with the OPRHP staff on January 17, 2006.
• Phase 1B Archeological Survey Addendum and Phase 1B-2 Archeological Investigations of the Clinton Mills Historic Site - This study was necessitated
by changes in Project layout that occurred subsequent to the original Phase 1B
fieldwork.
While the professional conclusions of the JMA surveys suggested little in the way of
significant adverse impact to historic or prehistoric cultural resources, the surveys
identified three potentially significant areas that the originally proposed Project layout
(DEIS, April 2006) might adversely impact. Please note, the SHPO concurred with the
findings and avoidance recommendations in their review of the Phase 1B Survey Report
(please see FEIS Appendix N, Agency Correspondence dated July 17th 2007.)
Subsequently, the Applicant proposed layout alternatives to assure avoidance of all
potential adverse impact to cultural and historic sites located within the Project area.
Specific layout and Project design alternatives suggested were as follows:
• The Merchia Road Site 1. JMA Suggested Avoidance Measure - JMA recommended that the
proposed access road be relocated further east to avoid foundation
remains within 30 feet of the originally proposed access road
2. Marble River Wind Farm Avoidance Measure Implemented – Marble
River re-designed alternative Project facility locations in the vicinity of
the site to ensure that the documented resource was not impacted
during construction or operation of the Project. This included the
relocation of the proposed access road 50 feet to the east of the
originally proposed location
• The Ogdensburgh & Lake Champlain Railroad 1. JMA Suggested Avoidance Measure – Avoid permanent demolition or
obstruction of the railroad route and provisions to restore and maintain
the condition of the railroad route so it continues to be a readily
apparent landscape feature

2. Marble River Avoidance Measure Implemented – Marble River re-
routed the proposed overhead 34.5 kV collection line to avoid running
parallel to the existing railroad route.
• Clinton Mills Historic Site 1. JMA Suggested Avoidance Measure – After completing a
supplemental Phase 1B of the Clinton Mills Historic site, JMA
recommended that the Project components in this area (access road
and underground collection line) be re-located to avoid disturbing the
documented features at the site.
2. Marble River Avoidance Measure Implemented – Marble River
relocated proposed Project facilities to the south and east to avoid
disturbing the existing archeological features.
7.6 Cultural and Historical Resource Avoidance and Minimization Conclusion As a result of the comprehensive studies undertaken by JMA (specialists in the field) in
conjunction with guidance and review from OPRHP, the Applicant was able to implement
specific layout alternatives to avoid adverse impact to all documented cultural resources
located within the Area of Potential Effect.
The proposed layout represents the best available design because it avoids impacting
documented cultural resources.
7.7 Visual Resource Avoidance and Minimization The Applicant contracted with Environmental Design & Research (EDR) to provide an
expert assessment of the potential visual impact of the proposed Project. EDR is a
recognized leader in the fields of landscape architecture, planning and environmental
services, with lengthy experience in evaluating the visual impact of wind projects
throughout the Northeast (including the Maple Ridge, Cape Wind and Fenner Wind Farm
projects).
Over the past 36 months EDR conducted two comprehensive visual impact analyses of
the Marble River Project (located in Appendix K of the DEIS and SDEIS, respectively).
As part of each Visual Impact Assessment (VIA), EDR assembled an in-house panel of
three registered landscape architects, and evaluated the visibility and visual impact of
the Project based on visual simulations from representative/sensitive viewpoints
throughout the visual study area (defined as a 5-mile radius around the perimeter
turbines). Utilizing 11 x 17-inch digital color prints of existing conditions photographs and

visual simulations from each the selected viewpoints (along with digital animations of the
simulations from two viewpoints) the rating panel members evaluated the simulations,
assigning each quantitative visual contrast ratings on a scale of 1 (completely
compatible) to 5 (strong contrast). Each panel member’s ratings were averaged to get an
overall score for each viewpoint, and these scores were then compiled to obtain a
composite impact score for each viewpoint.
Results of the VIA prepared for the original Project layout (DEIS, April 2006) were re-
evaluated as part of a supplemental VIA (SVIA) for a substantially revised Project layout
(SDEIS, July 2007). Whereas the VIA evaluated the visual impact of the original layout,
the SVIA evaluated a layout where 14 of the original wind turbines had been deleted and
14 new wind turbine locations were proposed. For each of the 10 viewpoints evaluated
in the VIA, the original photo simulations were remodeled based on the currently
proposed turbine model and layout. The panel was then asked to compare the revised
simulations with those prepared for the VIA to see if Project changes altered their
previous conclusions.
Results: As stated in the SVIA (p. 32) “individual contrast ratings for the revised simulations for
the original viewpoints (Viewpoints 3, 8, 15, 34, 38, 74, 81, 165, 170, and 179) were
generally very similar to those reported in the original VIA”. In addition, review of the
rating panel results indicated that changes in Project layout did not significantly change
the basis for scoring in these viewpoints, the number of turbines in a view, by itself, was
not the prime determinant of visual impact. As stated in the SVIA, (p. 34), “As indicated
by the rating panel’s overall reaction to the revised simulations, turbine relocation did not
significantly alter the visual impact of the project as a whole”.
Subsequent to completion of the SVIA, EDR prepared an additional simulation to further
evaluate the potential effect of the number of visible turbines on perceived impact. This
simulation is a revised version of the SVIA simulation from the fire tower on Lyon
Mountain (Viewpoint 196). In the revised simulation, only the approved Noble Clinton
and Ellenburg Wind Park projects are shown. This simulation was compared to the
cumulative simulation included in the SVIA that shows these projects along with the
proposed Marble River Wind Farm (see Figure 5). As this figure illustrates, deleting the
entire 109 turbine Project from this view does not significantly alter visual
impact/landscape character of the view from this location with the Noble projects in
place.
7.8 Visual Resource Avoidance and Minimization Conclusion The visual impact assessments conducted by EDR support several conclusions
pertaining to the visual impact of alternated Project layout and size:
• Visual impact is not directly correlated with the number of turbines in the view
(i.e. there were many cases where the rating panel indicated that visual
impact was the same or greater in viewpoints where fewer turbines were
visible).
• Visual impact is directly correlated with proximity to a turbine (i.e. in cases
where a notable decrease in visual impact was documented in the SVIA, this
was primarily attributable to the removal of a turbine in the immediate
foreground rather than a decrease in number of visible turbines).
• Land use context affects the perceived contrast and visual impact of wind
turbines more than the number or arrangement of visible turbines in the view.
• In views where significant numbers of turbines are already visible (e.g., Lyon
Mountain), reduction in the size of the proposed Project will not significantly
alter the overall visual impact.
These conclusions suggest that a smaller project (in the same location) would not
necessarily equate to a decrease in visual impact. The location of the turbines and their
compatibility with surrounding landscape features is much more important. The panel
found that the turbines generally fit in a rural agricultural setting. In addition, as noted in
the original VIA (DEIS Appendix K, p. 25), “several studies have concluded that people
tend to prefer fewer larger turbines to a greater number of smaller ones (Thayer and
Freeman, 1987; van de Wardt and Staats, 1988)”. For these reasons, the proposed
layout of the Marble River Wind Farm represents the best available alternative because
it maximizes potential community benefits while minimizing adverse visual impact.
The following conclusions also justify the Applicant’s suggestion that the current layout is
the best available alternative to fulfill the Project purpose and public need.
• Given the current existence of the Noble Clinton and Ellenburg Wind Parks
within the visual study area, the Marble River Wind Farm will not, in and of
itself, significantly alter the visual character of the town’s of Clinton and
Ellenburg. (Please see cumulative simulations in the SVIA, Appendix K of the
SDEIS July 2006)

• The vegetation viewshed analysis included in the SVIA indicates that only
31% of the 5-mile radius study area, and 5% of the area between 5 and 10
miles from the Project (excluding Canada) will have potential views of the
Marble River turbines
• Based on the vegetation viewshed analysis in the SVIA, and review of
simulations by JMA, actual impact on historic sites in the Project area is likely
to be limited because views to or from the structures themselves typically are
at least partially screened by foreground structures or trees (SVIA
Conclusions, SDEIS, July 2007).

Table 6. Comparison of 4/03/2007 Layout and Existing Layout Wetland Impacts
-------Permanent Disturbance------- -------Temporary Disturbance------- Wetland ID April 2007
Layout Existing Layout
Net Change
April 2007 Layout
Existing Layout
Net Change
Total Net Change
------------------------------------------------------Acres------------------------------------------------------ AR1-A 0.0478 0.0468 -0.001 0.0207 0.0271 -0.006 -0.007AR3-A 0.0330 0.0330 0.000 0.0648 0.0648 0.000 0.000AR3-B 0.0016 0.0016 0.000 0.0041 0.0041 0.000 0.000AR4-A N/J N/J N/J N/J N/J N/J N/JAR5-A N/J N/J N/J N/J N/J N/J N/JAR6A 0.0284 0.0377 0.009 0.0086 0.0035 0.005 0.014AR11-B 0.0187 0.0187 0.000 0.0036 0.0036 0.000 0.000AR16-B/C 0.0183 0.0183 0.000 0.0399 0.0404 0.000 0.000AR18-A,OH1201-A 0.2912 0.0012 -0.290 2.1811 2.0572 0.124 -0.166AR22-A 0.0124 0.0125 0.000 0.0163 0.0164 0.000 0.000AR23-B 0.0000 0.0000 0.000 0.0005 0.0005 0.000 0.000AR25-A 0.0000 0.0000 0.000 0.0257 0.0242 0.001 0.001AR26-A/B 0.0168 0.0753 0.059 0.1316 0.0310 0.101 0.159AR33-A 0.0000 0.0000 0.000 0.0001 0.0014 -0.001 -0.001AR35-A 0.0418 0.0418 0.000 0.0453 0.0453 0.000 0.000AR36-A 0.0000 0.0000 0.000 0.0104 0.0104 0.000 0.000AR37-A N/J N/J N/J N/J N/J N/J N/JAR38-A N/J N/J N/J N/J N/J N/J N/JAR39-A N/J N/J N/J N/J N/J N/J N/JAR40-A N/J N/J N/J N/J N/J N/J N/JAR41-A 0.1027 0.1454 0.043 0.2256 0.1378 0.088 0.130AR45-A/B, AR131 0.0003 0.0003 0.000 0.1006 0.1006 0.000 0.000AR46-A 0.0009 0.0009 0.000 0.0008 0.0008 0.000 0.000AR54-A/B 0.0024 0.0024 0.000 0.4870 0.4909 -0.004 -0.004AR55-A 0.0001 0.0001 0.000 0.3980 0.3805 0.018 0.018AR56-A 0.0419 0.0388 -0.003 0.2556 0.3579 -0.102 -0.105AR57-A/B 0.0489 0.0458 -0.003 0.5715 0.6203 -0.049 -0.052AR58-A 0.0389 0.0389 0.000 0.5728 0.5728 0.000 0.000AR58-B 0.1215 0.1215 0.000 0.4537 0.4537 0.000 0.000AR59-A 0.0384 0.0383 0.000 0.3005 0.3619 -0.061 -0.062AR60-A 0.0087 0.0001 -0.009 0.0514 0.1341 -0.083 -0.091AR61-A 0.0037 0.0037 0.000 0.0010 0.0010 0.000 0.000AR62-A 0.0738 0.0738 0.000 0.4565 0.4565 0.000 0.000AR62-B 0.0378 0.0378 0.000 0.1392 0.1392 0.000 0.000AR63-A 0.0004 0.0004 0.000 0.0235 0.0235 0.000 0.000AR64-A/B 0.0318 0.0318 0.000 0.0704 0.0714 -0.001 -0.001AR65-A 0.0269 0.0269 0.000 0.0375 0.0311 0.006 0.006AR65-B 0.0390 0.0390 0.000 0.0226 0.0226 0.000 0.000AR68-A 0.0000 0.0000 0.000 0.0000 0.0000 0.000 0.000AR70-A 0.0098 0.0098 0.000 0.0352 0.0352 0.000 0.000AR71-A 0.0101 0.0101 0.000 0.0256 0.0256 0.000 0.000AR72-A 0.0263 0.0263 0.000 0.0596 0.0596 0.000 0.000AR79A 0.0385 0.0385 0.000 0.1375 0.1375 0.000 0.000AR79B 0.0048 0.0048 0.000 0.1844 0.1843 0.000 0.000

-------Permanent Disturbance------- -------Temporary Disturbance------- Wetland ID April 2007
Layout Existing Layout
Net Change
April 2007 Layout
Existing Layout
Net Change
Total Net Change
------------------------------------------------------Acres------------------------------------------------------ AR79C 0.0000 0.0008 0.001 0.0067 0.0075 -0.001 0.000AR80/81-A 0.0328 0.0328 0.000 0.0000 0.0000 0.000 0.000AR81-A 0.0426 0.0426 0.000 0.0000 0.0000 0.000 0.000AR102-A 0.0514 0.0514 0.000 0.0252 0.0252 0.000 0.000AR103-A/B 0.0130 0.0161 0.003 0.2040 0.1552 0.049 0.052AR105-A 0.0000 0.0000 0.000 0.0688 0.0689 0.000 0.000AR111-A/B 0.0591 0.0591 0.000 0.0555 0.0555 0.000 0.000AR114-A/B 0.0242 0.0225 -0.002 0.0386 0.0386 0.000 -0.002AR115-A/B/C 0.3291 0.3291 0.000 0.8050 0.7728 0.032 0.032AR117-A 0.0000 0.0000 0.000 0.0042 0.0042 0.000 0.000AR118-A 0.0426 0.0398 -0.003 0.0126 0.0156 -0.003 -0.006AR118-B 0.0016 0.0016 0.000 0.0482 0.0483 0.000 0.000AR120-Y 0.0044 0.0044 0.000 0.0089 0.0089 0.000 0.000AR124-A 0.0083 0.0083 0.000 0.0147 0.0146 0.000 0.000AR125-A 0.0135 0.0135 0.000 0.0025 0.0025 0.000 0.000AR200-A 0.0000 0.0000 0.000 0.0265 0.0266 0.000 0.000AR201-A 0.0014 0.0014 0.000 0.2614 0.2726 -0.011 -0.011AR202-A 0.0830 0.0829 0.000 0.1705 0.1704 0.000 0.000AR203-A/B 0.0314 0.0313 0.000 0.6934 0.6928 0.001 0.001AR204-A 0.0095 0.0095 0.000 0.0185 0.0185 0.000 0.000AR205-A 0.0240 0.0240 0.000 0.0103 0.0499 -0.040 -0.040AR205-B 0.0293 0.0293 0.000 0.0092 0.1000 -0.091 -0.091AR206-A 0.0286 0.0287 0.000 0.0323 0.0328 -0.001 0.000AR206-B 0.0055 0.0055 0.000 0.0471 0.0471 0.000 0.000AR207-A 0.0002 0.0002 0.000 0.0038 0.0038 0.000 0.000AR208-A 0.0200 0.0200 0.000 0.1342 0.1342 0.000 0.000AR208-B 0.0000 0.0000 0.000 0.0583 0.0583 0.000 0.000AR210-C 0.0004 0.0000 0.000 0.0000 0.0122 -0.012 -0.013AR210-D 0.0000 0.0000 0.000 0.0011 0.0011 0.000 0.000AR212-A 0.0001 0.0004 0.000 0.0014 0.0029 -0.001 -0.001AR213-A 0.0000 0.0000 0.000 0.0117 0.0117 0.000 0.000AR213-B 0.0000 0.0000 0.000 0.0084 0.0084 0.000 0.000AR213-C 0.0165 0.0165 0.000 0.0029 0.0029 0.000 0.000AR214-A 0.0139 0.0138 0.000 0.0092 0.0091 0.000 0.000AR218-B 0.0100 0.0116 0.002 0.0076 0.0045 0.003 0.005AR360-A 0.0877 0.0877 0.000 0.0440 0.0440 0.000 0.000AR367-A 0.0345 0.0346 0.000 0.0400 0.0400 0.000 0.000AR370-A 0.0000 0.0000 0.000 0.3482 0.3481 0.000 0.000AR502-A 0.0000 0.0000 0.000 0.3428 0.3428 0.000 0.000AR506, OH1206 0.3819 0.0463 -0.336 2.6265 2.2908 0.336 0.000AR507-A 0.0278 0.0003 -0.027 0.3321 0.3187 0.013 -0.014AR508-A/B 0.0340 0.0340 0.000 0.0161 0.0161 0.000 0.000AR509-A/B 0.3765 0.1841 -0.192 1.1556 0.9629 0.193 0.000AR513-A/B 0.0900 0.0900 0.000 0.1331 0.1332 0.000 0.000AR521-A/B 0.0615 0.0615 0.000 0.0308 0.0308 0.000 0.000AR522-A 0.0189 0.0189 0.000 0.0270 0.0270 0.000 0.000

-------Permanent Disturbance------- -------Temporary Disturbance------- Wetland ID April 2007
Layout Existing Layout
Net Change
April 2007 Layout
Existing Layout
Net Change
Total Net Change
------------------------------------------------------Acres------------------------------------------------------ AR523-A 0.0099 0.0099 0.000 0.0122 0.0122 0.000 0.000AR524-A 0.0076 0.0076 0.000 0.0668 0.0669 0.000 0.000AR524-B 0.0062 0.0062 0.000 0.0580 0.0580 0.000 0.000AR524-D 0.0127 0.0127 0.000 0.0168 0.0168 0.000 0.000AR525-A 0.0000 0.0000 0.000 0.0340 0.0340 0.000 0.000AR526-A/B 0.0205 0.0175 -0.003 0.0279 0.0285 -0.001 -0.004AR530-A/B 0.0478 0.0478 0.000 0.0246 0.0247 0.000 0.000AR531-A 0.0000 0.0000 0.000 0.0119 0.0187 -0.007 -0.007AR534-A 0.0004 0.0004 0.000 0.0043 0.0043 0.000 0.000AR534-B 0.0070 0.0070 0.000 0.0102 0.0102 0.000 0.000AR538-A 0.0221 0.0221 0.000 0.0237 0.0237 0.000 0.000AR599-A1 0.0006 0.0005 0.000 0.0022 0.0041 -0.002 -0.002AR599-A2 0.0000 0.0000 0.000 0.0002 0.0002 0.000 0.000AR599-B2 0.0001 0.0001 0.000 0.0011 0.0011 0.000 0.000AR601-A 0.0000 0.0000 0.000 0.0000 0.0141 -0.014 -0.014AR602-A 0.0004 0.0004 0.000 0.0037 0.0617 -0.058 -0.058AR602-B 0.0069 0.0069 0.000 0.0000 0.1725 -0.172 -0.173AR603-A 0.0218 0.0218 0.000 0.0000 0.3804 -0.380 -0.380AR603-B 0.0486 0.0480 -0.001 0.0000 0.4490 -0.449 -0.450AR604-A 0.0000 0.0000 0.000 0.0000 0.0768 -0.077 -0.077AR604-B 0.0026 0.0026 0.000 0.0000 0.1355 -0.136 -0.136AR605-A 0.0041 0.0041 0.000 0.0000 0.1445 -0.145 -0.144AR605-B 0.0000 0.0000 0.000 0.0000 0.2547 -0.255 -0.255AR606-A/C 0.0256 0.0256 0.000 0.0000 0.6965 -0.696 -0.696AR606-B 0.0626 0.0618 -0.001 0.0000 0.5761 -0.576 -0.577AR607-A 0.0010 0.0010 0.000 0.0000 0.1370 -0.137 -0.137AR607-B 0.0000 0.0000 0.000 0.0000 0.1633 -0.163 -0.163AR608-A 0.1965 0.0086 -0.188 0.0000 0.0000 0.000 -0.188AR609-A 0.0028 0.0028 0.000 0.0000 0.3503 -0.350 -0.350AR609-B 0.0172 0.0170 0.000 0.0000 0.4031 -0.403 -0.403AR610-A 0.0165 0.0165 0.000 0.0000 0.3319 -0.332 -0.332AR610-B 0.0105 0.0102 0.000 0.0000 0.7434 -0.743 -0.744AR611-A/B/C/D/E 0.3109 0.3390 0.028 0.4340 0.8358 -0.402 -0.374AR611-B 0.0075 0.0069 -0.001 0.1903 1.1468 -0.956 -0.957AR615-A 0.0010 0.0250 0.024 0.0663 0.1555 -0.089 -0.065AR615-B 0.0287 0.0279 -0.001 0.2568 0.8705 -0.614 -0.614AR617-A 0.0000 0.0000 0.000 0.0093 0.0093 0.000 0.000AR618-A 0.0000 0.0000 0.000 0.0811 0.0811 0.000 0.000AR618-B 0.0770 0.0770 0.000 0.2523 0.2538 -0.001 -0.001AR618-C 0.0000 0.0000 0.000 0.0661 0.0661 0.000 0.000AR619-A 0.0009 0.0009 0.000 0.0556 0.0555 0.000 0.000AR619-B 0.0552 0.0552 0.000 0.0591 0.0591 0.000 0.000AR622-A/B/C 0.0459 0.0459 0.000 0.0685 0.0685 0.000 0.000AR625-A 0.0295 0.0295 0.000 0.0809 0.0809 0.000 0.000AR625-B 0.0081 0.0081 0.000 0.0620 0.0619 0.000 0.000AR630-A/B 0.0764 0.0764 0.000 0.1506 0.1533 -0.003 -0.003

-------Permanent Disturbance------- -------Temporary Disturbance------- Wetland ID April 2007
Layout Existing Layout
Net Change
April 2007 Layout
Existing Layout
Net Change
Total Net Change
------------------------------------------------------Acres------------------------------------------------------ AR701-A/B 0.0000 0.0000 0.000 0.0957 0.1060 -0.010 -0.010AR702-A 0.0000 0.0000 0.000 0.0071 0.0071 0.000 0.000AR703-A 0.0308 0.0318 0.001 0.3344 0.3512 -0.017 -0.016AR709-A/B 0.0009 0.0009 0.000 0.0007 0.0007 0.000 0.000AR710-A 0.0000 0.0000 0.000 0.0150 0.0151 0.000 0.000AR711-B 0.0000 0.0000 0.000 0.0100 0.0099 0.000 0.000AR713-B 0.0000 0.0000 0.000 0.1208 0.1208 0.000 0.000AR719-A/B/C 0.5410 0.5411 0.000 0.7394 0.7534 -0.014 -0.014AR724-A 0.0810 0.0000 -0.081 0.4891 1.1407 -0.652 -0.733AR725-A/B/C 0.0489 0.0488 0.000 0.0571 0.0565 0.001 0.000AR725-D 0.0332 0.0344 0.001 0.0513 0.0527 -0.001 0.000AR737-A 0.0291 0.0291 0.000 0.0175 0.0175 0.000 0.000AR802-A 0.0000 0.0000 0.000 0.1681 0.1681 0.000 0.000AR803-A/B/C 0.0697 0.0626 -0.007 0.3486 0.5888 -0.240 -0.247AR804-A 0.0000 0.0000 0.000 0.0023 0.0023 0.000 0.000AR805-A/B 0.0254 0.0254 0.000 0.0599 0.0599 0.000 0.000AR807-A 0.0000 0.0000 0.000 0.0083 0.0083 0.000 0.000AR808-A 0.0000 0.0000 0.000 0.0015 0.0015 0.000 0.000AR809-A 0.0000 0.0000 0.000 0.0266 0.0272 -0.001 -0.001AR816-A 0.0241 0.0241 0.000 0.0088 0.0088 0.000 0.000AR825-A/B 0.3125 0.1121 -0.200 1.6374 1.5680 0.069 -0.131AR828-A 0.0061 0.0061 0.000 0.0039 0.0039 0.000 0.000AR852-A/B 0.0509 0.0834 0.033 0.3612 0.1941 0.167 0.200AR902-A 0.0000 0.0000 0.000 0.0000 0.0000 0.000 0.000AR904-A 0.0008 0.0008 0.000 0.0244 0.2014 -0.177 -0.177AR906-A 0.0000 0.0000 0.000 0.0192 0.0192 0.000 0.000AR907-A 0.0022 0.0022 0.000 0.0079 0.0079 0.000 0.000AR909-A N/J N/J N/J N/J N/J N/J N/JAR917-A 0.0000 0.0000 0.000 0.0270 0.0000 0.027 0.027AR917-C 0.0000 0.0000 0.000 0.0327 0.0131 0.020 0.020AR925-A/B/C, IC 0.0000 0.0000 0.000 0.0391 0.0391 0.000 0.000AR926-A/B 1.1473 0.0063 -1.141 9.8701 8.5596 1.310 0.169AR927-A/B 0.0000 0.0000 0.000 0.0035 0.0035 0.000 0.000AR939-A 0.0000 0.0000 0.000 0.0035 0.0035 0.000 0.000AR939-B 0.0071 0.0069 0.000 0.0292 0.0295 0.000 -0.001AR939-C 0.0000 0.0000 0.000 0.0055 0.0055 0.000 0.000AR939-D 0.0000 0.0000 0.000 0.0013 0.0013 0.000 0.000AR940-A/B 0.0661 0.0661 0.000 0.0672 0.0673 0.000 0.000AR941,IC942 0.0255 0.0253 0.000 0.7226 1.1554 -0.433 -0.433AR945-A 0.0019 0.0019 0.000 0.0061 0.0061 0.000 0.000AR947-A 0.0000 0.0000 0.000 0.0004 0.0004 0.000 0.000AR949-A 0.0000 0.0000 0.000 0.0533 0.0534 0.000 0.000AR950-A 0.0009 0.0009 0.000 0.0133 0.0134 0.000 0.000AR951-A 0.0000 0.0000 0.000 0.0226 0.0226 0.000 0.000AR952-A N/J N/J N/J N/J N/J N/J N/JAR954-A N/J N/J N/J N/J N/J N/J N/J

-------Permanent Disturbance------- -------Temporary Disturbance------- Wetland ID April 2007
Layout Existing Layout
Net Change
April 2007 Layout
Existing Layout
Net Change
Total Net Change
------------------------------------------------------Acres------------------------------------------------------ AR958-A,IC962 0.2569 0.2569 0.000 0.8750 0.9386 -0.064 -0.064AR964-A 0.0000 0.0000 0.000 0.0108 0.0108 0.000 0.000AR967-A/B 0.0195 0.0194 0.000 0.1880 0.1880 0.000 0.000AR967-D 0.0299 0.0307 0.001 0.0852 0.0979 -0.013 -0.012AR967-E 0.0561 0.0524 -0.004 0.1469 0.1546 -0.008 -0.011AR968-A 0.0000 0.0000 0.000 0.0427 0.0492 -0.007 -0.007AR986-B 0.0424 0.0424 0.000 0.0283 0.0283 0.000 0.000AR1008-A 0.0000 0.0000 0.000 0.0071 0.0071 0.000 0.000AR1009-A 0.0503 0.0000 -0.050 0.2901 0.2390 0.051 0.001AR1017-A N/J N/J N/J N/J N/J N/J N/JAR/IC1021-A/B 0.2180 0.2164 -0.002 0.4520 0.4321 0.020 0.018AR1026-A 0.0431 0.0431 0.000 0.0184 0.0184 0.000 0.000AR1027-A/B 0.0784 0.0784 0.000 0.0943 0.0943 0.000 0.000AR1028-A/B 0.1482 0.1482 0.000 0.2063 0.2059 0.000 0.000AR1029-A/B 0.0780 0.0779 0.000 0.1238 0.1238 0.000 0.000AR1030-A/B 0.0521 0.0521 0.000 0.0891 0.0891 0.000 0.000AR1031-A 0.0000 0.0000 0.000 0.0219 0.0219 0.000 0.000AR1032-A 0.0643 0.0643 0.000 0.0641 0.0641 0.000 0.000AR1033-A/B 0.0473 0.0473 0.000 0.0299 0.0299 0.000 0.000AR1034-A 0.0000 0.0000 0.000 0.0001 0.0001 0.000 0.000AR1035-A 0.0000 0.0000 0.000 0.0063 0.0064 0.000 0.000AR1036-A 0.0000 0.0000 0.000 0.0006 0.0006 0.000 0.000AR1037-A/D/C 0.3524 0.3519 0.000 0.5350 0.5141 0.021 0.020AR1042-A 0.0645 0.0645 0.000 0.0723 0.0724 0.000 0.000AR1044-A/B 0.2332 0.2332 0.000 0.2505 0.2505 0.000 0.000AR1105-A 0.0000 0.0000 0.000 0.0611 0.0381 0.023 0.023AR1105-B 0.0000 0.0000 0.000 0.0151 0.0151 0.000 0.000AR1105-C 0.0000 0.0000 0.000 0.0252 0.0253 0.000 0.000AR1107-A 0.0082 0.0000 -0.008 0.0000 0.0085 -0.009 -0.017AR1108-A 0.0000 0.0659 0.066 0.1818 0.0000 0.182 0.248AR1305-A 0.0096 0.0000 -0.010 0.0000 0.0745 -0.074 -0.084AR1307-A 0.1444 0.1443 0.000 0.0010 0.0010 0.000 0.000AR1312-A 0.0075 0.0075 0.000 0.0978 0.0978 0.000 0.000CV1173-A 0.0033 0.0033 0.000 0.0165 0.0165 0.000 0.000CV1400-A 0.0000 0.0000 0.000 0.0109 0.0000 0.011 0.011CV1400-C 0.0000 0.0000 0.000 0.0283 0.0000 0.028 0.028CW715-B, IC1022 0.2009 0.2009 0.000 0.8226 0.8227 0.000 0.000CW829-A 0.1607 0.1607 0.000 0.1265 0.1266 0.000 0.000CWIC705-A/B 0.0901 0.0901 0.000 0.0781 0.0781 0.000 0.000CWIC722-A 0.0024 0.0024 0.000 0.0031 0.0031 0.000 0.000IC360-A 0.0000 0.0577 0.058 0.2384 0.2470 -0.009 0.049IC361-A 0.0000 0.0586 0.059 0.0702 0.0187 0.052 0.110IC363-A 0.0000 0.0027 0.003 0.0082 0.0000 0.008 0.011IC364-A 0.0000 0.0000 0.000 0.2536 0.2536 0.000 0.000IC364-A/B 0.0000 0.0000 0.000 0.1887 0.0000 0.189 0.189IC365-A 0.0000 0.0000 0.000 0.0588 0.0588 0.000 0.000
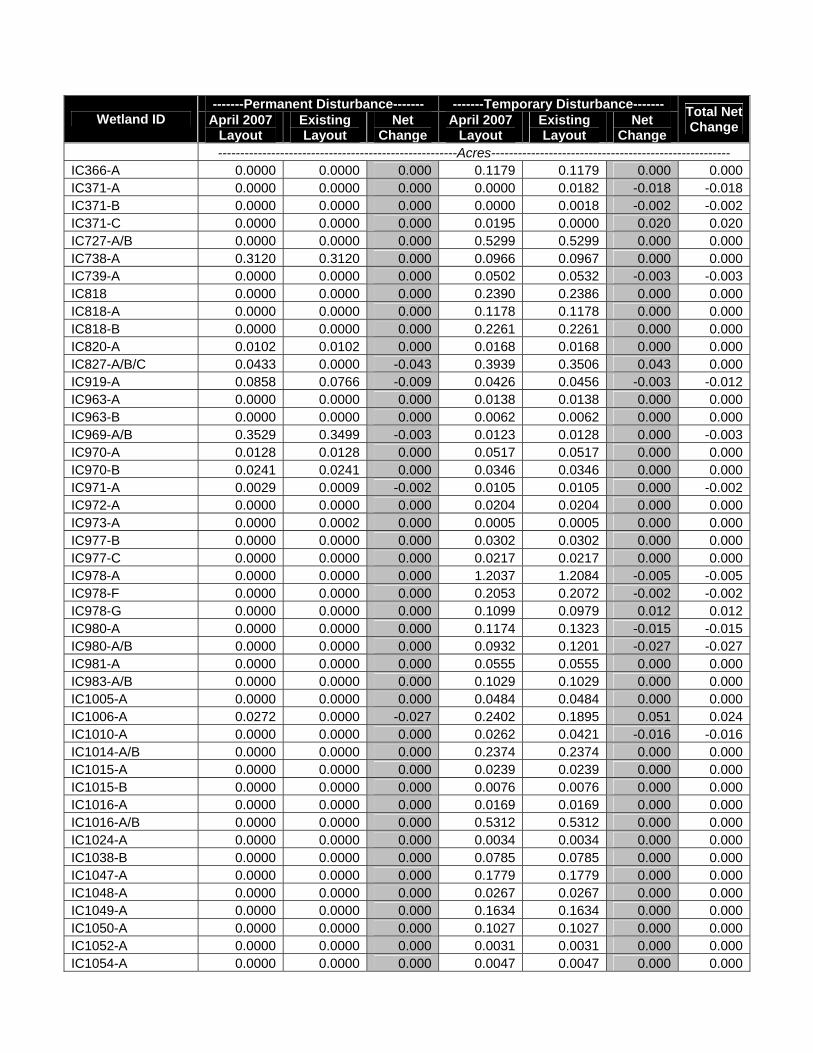
-------Permanent Disturbance------- -------Temporary Disturbance------- Wetland ID April 2007
Layout Existing Layout
Net Change
April 2007 Layout
Existing Layout
Net Change
Total Net Change
------------------------------------------------------Acres------------------------------------------------------ IC366-A 0.0000 0.0000 0.000 0.1179 0.1179 0.000 0.000IC371-A 0.0000 0.0000 0.000 0.0000 0.0182 -0.018 -0.018IC371-B 0.0000 0.0000 0.000 0.0000 0.0018 -0.002 -0.002IC371-C 0.0000 0.0000 0.000 0.0195 0.0000 0.020 0.020IC727-A/B 0.0000 0.0000 0.000 0.5299 0.5299 0.000 0.000IC738-A 0.3120 0.3120 0.000 0.0966 0.0967 0.000 0.000IC739-A 0.0000 0.0000 0.000 0.0502 0.0532 -0.003 -0.003IC818 0.0000 0.0000 0.000 0.2390 0.2386 0.000 0.000IC818-A 0.0000 0.0000 0.000 0.1178 0.1178 0.000 0.000IC818-B 0.0000 0.0000 0.000 0.2261 0.2261 0.000 0.000IC820-A 0.0102 0.0102 0.000 0.0168 0.0168 0.000 0.000IC827-A/B/C 0.0433 0.0000 -0.043 0.3939 0.3506 0.043 0.000IC919-A 0.0858 0.0766 -0.009 0.0426 0.0456 -0.003 -0.012IC963-A 0.0000 0.0000 0.000 0.0138 0.0138 0.000 0.000IC963-B 0.0000 0.0000 0.000 0.0062 0.0062 0.000 0.000IC969-A/B 0.3529 0.3499 -0.003 0.0123 0.0128 0.000 -0.003IC970-A 0.0128 0.0128 0.000 0.0517 0.0517 0.000 0.000IC970-B 0.0241 0.0241 0.000 0.0346 0.0346 0.000 0.000IC971-A 0.0029 0.0009 -0.002 0.0105 0.0105 0.000 -0.002IC972-A 0.0000 0.0000 0.000 0.0204 0.0204 0.000 0.000IC973-A 0.0000 0.0002 0.000 0.0005 0.0005 0.000 0.000IC977-B 0.0000 0.0000 0.000 0.0302 0.0302 0.000 0.000IC977-C 0.0000 0.0000 0.000 0.0217 0.0217 0.000 0.000IC978-A 0.0000 0.0000 0.000 1.2037 1.2084 -0.005 -0.005IC978-F 0.0000 0.0000 0.000 0.2053 0.2072 -0.002 -0.002IC978-G 0.0000 0.0000 0.000 0.1099 0.0979 0.012 0.012IC980-A 0.0000 0.0000 0.000 0.1174 0.1323 -0.015 -0.015IC980-A/B 0.0000 0.0000 0.000 0.0932 0.1201 -0.027 -0.027IC981-A 0.0000 0.0000 0.000 0.0555 0.0555 0.000 0.000IC983-A/B 0.0000 0.0000 0.000 0.1029 0.1029 0.000 0.000IC1005-A 0.0000 0.0000 0.000 0.0484 0.0484 0.000 0.000IC1006-A 0.0272 0.0000 -0.027 0.2402 0.1895 0.051 0.024IC1010-A 0.0000 0.0000 0.000 0.0262 0.0421 -0.016 -0.016IC1014-A/B 0.0000 0.0000 0.000 0.2374 0.2374 0.000 0.000IC1015-A 0.0000 0.0000 0.000 0.0239 0.0239 0.000 0.000IC1015-B 0.0000 0.0000 0.000 0.0076 0.0076 0.000 0.000IC1016-A 0.0000 0.0000 0.000 0.0169 0.0169 0.000 0.000IC1016-A/B 0.0000 0.0000 0.000 0.5312 0.5312 0.000 0.000IC1024-A 0.0000 0.0000 0.000 0.0034 0.0034 0.000 0.000IC1038-B 0.0000 0.0000 0.000 0.0785 0.0785 0.000 0.000IC1047-A 0.0000 0.0000 0.000 0.1779 0.1779 0.000 0.000IC1048-A 0.0000 0.0000 0.000 0.0267 0.0267 0.000 0.000IC1049-A 0.0000 0.0000 0.000 0.1634 0.1634 0.000 0.000IC1050-A 0.0000 0.0000 0.000 0.1027 0.1027 0.000 0.000IC1052-A 0.0000 0.0000 0.000 0.0031 0.0031 0.000 0.000IC1054-A 0.0000 0.0000 0.000 0.0047 0.0047 0.000 0.000

-------Permanent Disturbance------- -------Temporary Disturbance------- Wetland ID April 2007
Layout Existing Layout
Net Change
April 2007 Layout
Existing Layout
Net Change
Total Net Change
------------------------------------------------------Acres------------------------------------------------------ IC1154-A 0.0000 0.0000 0.000 0.0037 0.0037 0.000 0.000IC1156-A/B 0.0000 0.0000 0.000 0.0901 0.0874 0.003 0.003IC1300-B 0.0000 0.0000 0.000 0.0707 0.0707 0.000 0.000IC1311-A 0.0000 0.0000 0.000 0.0002 0.0002 0.000 0.000IC1920-A 0.0000 0.0000 0.000 0.0000 0.4313 -0.431 -0.431MET1003-A/B/C 0.0000 0.0000 0.000 0.0047 0.0000 0.005 0.005MET1544-A 0.0000 0.0000 0.000 0.0087 0.0000 0.009 0.009MET1544-B 0.0000 0.0000 0.000 0.0045 0.0000 0.005 0.005MET1548-A 0.0000 0.0000 0.000 0.0249 0.0000 0.025 0.025MET1548-B 0.0000 0.0000 0.000 0.0019 0.0000 0.002 0.002MET1549-A 0.0000 0.0000 0.000 0.0235 0.0000 0.024 0.024MET1551-A 0.0000 0.0000 0.000 0.0692 0.0000 0.069 0.069MIT1560-A 0.0000 0.0040 0.004 0.0379 0.0000 0.038 0.042OH1110-A,IC1123 0.0174 0.0000 -0.017 0.0807 0.0633 0.017 0.000OH1110-B 0.0000 0.0000 0.000 0.0163 0.0163 0.000 0.000OH1111-A/B 0.1328 0.0003 -0.133 0.8063 0.6738 0.133 0.000OH1113-A/B 0.0260 0.0000 -0.026 0.1216 0.0956 0.026 0.000OH1114-A 0.0000 0.0000 0.000 0.0271 0.0271 0.000 0.000OH1115-A 0.0000 0.0000 0.000 0.1039 0.1039 0.000 0.000OH1116-A 0.0000 0.0000 0.000 0.2546 0.2546 0.000 0.000OH1117-A 0.0000 0.0000 0.000 0.0658 0.0658 0.000 0.000OH1117-B 0.0000 0.0000 0.000 0.1855 0.1855 0.000 0.000OH1118-A/B 0.1096 0.0003 -0.109 0.5418 0.4287 0.113 0.004OH1119-A 0.0000 0.0000 0.000 0.2441 0.2441 0.000 0.000OH1120-A/B/C/D 1.2861 0.0032 -1.283 8.6700 7.3855 1.285 0.002OH1200-A 0.0958 0.0009 -0.095 0.8886 0.7937 0.095 0.000OH1204-A 0.0000 0.0000 0.000 0.0295 0.0295 0.000 0.000OH1326-A 0.0000 0.0000 0.000 0.0087 0.0087 0.000 0.000OH1327-A 0.0015 0.0000 -0.001 0.0086 0.0072 0.001 0.000OH1328-A/B/C 0.0473 0.0000 -0.047 0.2683 0.2209 0.047 0.000OH1329-A/B/C/D 0.0465 0.0003 -0.046 0.0000 0.1994 -0.199 -0.246OH1330-A/B 0.0383 0.0002 -0.038 0.3720 0.3338 0.038 0.000OH1350-A/B 0.0728 0.0000 -0.073 0.4297 0.3569 0.073 0.000OH1352-A 0.0000 0.0000 0.000 0.0420 0.0420 0.000 0.000OH1353-A 0.1231 0.0000 -0.123 0.7311 0.6079 0.123 0.000OH1354-A 0.0000 0.0000 0.000 0.0311 0.0311 0.000 0.000OH1355-A 0.0000 0.0000 0.000 0.0001 0.0001 0.000 0.000OH1357-A 0.0000 0.0000 0.000 0.0291 0.0291 0.000 0.000OH1401-A 0.0244 0.0000 -0.024 0.0000 0.0870 -0.087 -0.111RW1163-A 0.0000 0.0000 0.000 0.0000 0.0022 -0.002 -0.002RW1163-B 0.0000 0.0000 0.000 0.0000 0.0006 -0.001 -0.001SA821-A 0.0791 0.0000 -0.079 0.5020 0.3660 0.136 0.057WET AG. FIELD 0.0057 0.0057 0.000 0.0391 0.0391 0.000 0.000WTG1A, AR905 0.0000 0.0000 0.000 0.0454 0.0452 0.000 0.000WTG2A-A 0.0000 0.0000 0.000 0.0012 0.0012 0.000 0.000WTG5A-A 0.0419 0.0419 0.000 0.0405 0.0405 0.000 0.000
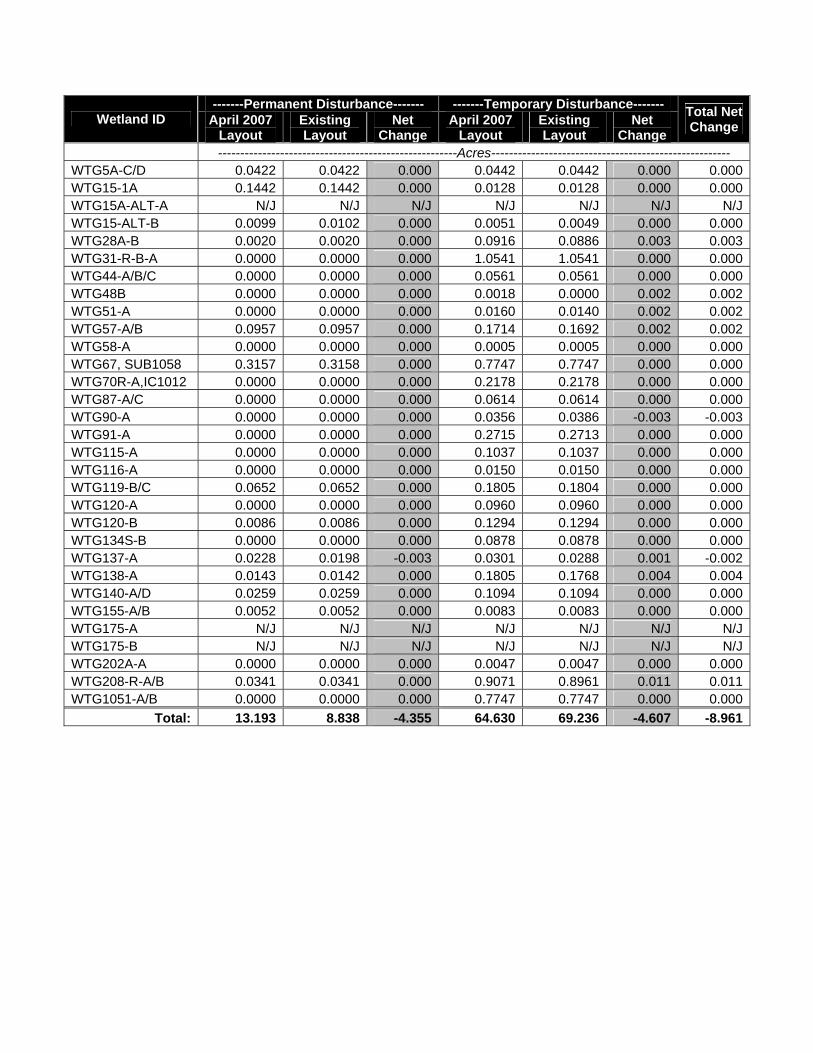
-------Permanent Disturbance------- -------Temporary Disturbance------- Wetland ID April 2007
Layout Existing Layout
Net Change
April 2007 Layout
Existing Layout
Net Change
Total Net Change
------------------------------------------------------Acres------------------------------------------------------ WTG5A-C/D 0.0422 0.0422 0.000 0.0442 0.0442 0.000 0.000WTG15-1A 0.1442 0.1442 0.000 0.0128 0.0128 0.000 0.000WTG15A-ALT-A N/J N/J N/J N/J N/J N/J N/JWTG15-ALT-B 0.0099 0.0102 0.000 0.0051 0.0049 0.000 0.000WTG28A-B 0.0020 0.0020 0.000 0.0916 0.0886 0.003 0.003WTG31-R-B-A 0.0000 0.0000 0.000 1.0541 1.0541 0.000 0.000WTG44-A/B/C 0.0000 0.0000 0.000 0.0561 0.0561 0.000 0.000WTG48B 0.0000 0.0000 0.000 0.0018 0.0000 0.002 0.002WTG51-A 0.0000 0.0000 0.000 0.0160 0.0140 0.002 0.002WTG57-A/B 0.0957 0.0957 0.000 0.1714 0.1692 0.002 0.002WTG58-A 0.0000 0.0000 0.000 0.0005 0.0005 0.000 0.000WTG67, SUB1058 0.3157 0.3158 0.000 0.7747 0.7747 0.000 0.000WTG70R-A,IC1012 0.0000 0.0000 0.000 0.2178 0.2178 0.000 0.000WTG87-A/C 0.0000 0.0000 0.000 0.0614 0.0614 0.000 0.000WTG90-A 0.0000 0.0000 0.000 0.0356 0.0386 -0.003 -0.003WTG91-A 0.0000 0.0000 0.000 0.2715 0.2713 0.000 0.000WTG115-A 0.0000 0.0000 0.000 0.1037 0.1037 0.000 0.000WTG116-A 0.0000 0.0000 0.000 0.0150 0.0150 0.000 0.000WTG119-B/C 0.0652 0.0652 0.000 0.1805 0.1804 0.000 0.000WTG120-A 0.0000 0.0000 0.000 0.0960 0.0960 0.000 0.000WTG120-B 0.0086 0.0086 0.000 0.1294 0.1294 0.000 0.000WTG134S-B 0.0000 0.0000 0.000 0.0878 0.0878 0.000 0.000WTG137-A 0.0228 0.0198 -0.003 0.0301 0.0288 0.001 -0.002WTG138-A 0.0143 0.0142 0.000 0.1805 0.1768 0.004 0.004WTG140-A/D 0.0259 0.0259 0.000 0.1094 0.1094 0.000 0.000WTG155-A/B 0.0052 0.0052 0.000 0.0083 0.0083 0.000 0.000WTG175-A N/J N/J N/J N/J N/J N/J N/JWTG175-B N/J N/J N/J N/J N/J N/J N/JWTG202A-A 0.0000 0.0000 0.000 0.0047 0.0047 0.000 0.000WTG208-R-A/B 0.0341 0.0341 0.000 0.9071 0.8961 0.011 0.011WTG1051-A/B 0.0000 0.0000 0.000 0.7747 0.7747 0.000 0.000
Total: 13.193 8.838 -4.355 64.630 69.236 -4.607 -8.961

Table 7. Wetland Impact Analysis
Overhead Alternatives Analysis Marble River Wind Farm
Clinton County, NY
Existing Route
Alternate Route A (Lagree
Work-around)
Alternate Route B (Clinton
Mills Road)
Alternate Route C
(La Francis Road)
Wetland ID
---------------------------------Acres---------------------------------
Field Delineated Wetlands
AR18-A,OH1201-A 1.6847 1.6847 AR19-A 0.0474 AR20-A 0.5235 AR23-B 0.0333 0.0333 AR25-A 0.4010 0.4010 AR54-A/B 0.4774 0.4774 0.4774 0.4774 AR55-A 0.3728 0.3728 0.3728 0.3728 AR56-A 0.3012 0.3012 0.3012 0.3012 AR57-A/B 0.5877 0.5877 0.5877 0.5877 AR58-A 0.5587 0.5587 0.5587 0.5587 AR58-B 0.3728 0.3728 0.3728 0.3728 AR59-A 0.3018 0.3018 0.3018 0.3018 AR60-A 0.0542 0.0542 0.0542 0.0542 AR61-A 0.0048 0.0048 0.0048 0.0048 AR62-A 0.4940 0.4940 0.4940 0.4940 AR62-B 0.1506 0.1506 0.1506 0.1506 AR63-A 0.0239 0.0239 0.0239 0.0239 AR64-A/B 0.0977 0.0977 0.0977 0.0977 AR65-A 0.0636 0.0636 0.0636 0.0636 AR65-B 0.0584 0.0584 0.0584 0.0584 AR200-A 0.0221 0.0221 0.0221 0.0221 AR201-A 0.2496 0.2496 0.2496 0.2496 AR202-A 0.2213 0.2213 0.2213 0.2213 AR203-A/B 0.6915 0.6915 0.6915 0.6915 AR204-A 0.0235 0.0235 0.0235 0.0235 AR205-A 0.0565 0.0565 0.0565 0.0565 AR205-B 0.1630 0.1630 0.1630 0.1630 AR206-A 0.0445 0.0445 0.0445 0.0445 AR206-B 0.0526 0.0526 0.0526 0.0526 AR207-A 0.0004 0.0004 0.0004 0.0004 AR208-A 0.1419 0.1419 0.1419 0.1419 AR208-B 0.0333 0.0333 0.0333 0.0333 AR502-A 0.7884 0.7890 AR505-A/B 0.3719 0.3721 AR506, OH1206 2.3709 2.3709 AR507-A 0.3005 0.3005 AR509-A/B 1.0588 1.0588 AR802-A 0.0985 0.0985 AR803-A/B/C 0.4755 0.4755 1.9561 1.9552

Overhead Alternatives Analysis Marble River Wind Farm
Clinton County, NY
Existing Route
Alternate Route A (Lagree
Work-around)
Alternate Route B (Clinton
Mills Road)
Alternate Route C
(La Francis Road)
Wetland ID
---------------------------------Acres--------------------------------- AR825-A/B 0.9711 0.9711 AR926-A/B 7.3969 7.3969 AR1009-A 0.2153 0.2153 AR1105-A 0.0064 0.0064 AR1105-B 0.7157 0.7157 AR1106-A 0.0853 0.0853 AR1305-A 0.4797 0.4796 IC360-A 1.0924 1.0932 IC362-A 0.0392 0.0393 IC363-A 0.0482 0.0482 IC1005-A 0.0001 0.0001 IC1006-A 0.1203 0.1203 IC1010-A 0.0008 0.0008 IC1038-A 3.8013 IC1038-B 0.2515 IC364-A 0.7219 IC827-A/B/C 0.2657 0.2657 IC978-B 0.4204 MIT1560-A 0.0272 0.0272 0.0272 0.0272 OH1110-A,IC1123 0.0654 2.0036 OH1110-B 0.0129 OH1111-A/B 0.7409 OH1113-A/B 0.1114 OH1114-A 0.0146 OH1115-A 0.0770 OH1116-A 0.2343 OH1117-A 0.0531 OH1117-B 0.1502 OH1118-A/B 0.5092 OH1119-A 0.2479 OH1120-A/B/C/D 7.9502 OH1200-A 0.6133 0.6133 0.5874 OH1204-A 0.0218 0.0218 OH1326-A 0.0041 0.0041 OH1327-A 0.0086 0.0086 OH1328-A/B/C 0.2556 0.2556 OH1329-A/B/C/D 0.2451 0.1101 OH1330-A/B 0.2654 0.2654 OH1350-A/B 0.4040 0.4040 OH1352-A 0.0375 0.0375 OH1353-A 0.6848 0.6848 OH1354-A 0.0269 0.0269 OH1501-A 0.0165

Overhead Alternatives Analysis Marble River Wind Farm
Clinton County, NY
Existing Route
Alternate Route A (Lagree
Work-around)
Alternate Route B (Clinton
Mills Road)
Alternate Route C
(La Francis Road)
Wetland ID
---------------------------------Acres--------------------------------- OH1502-B 0.0561 OH1504A 0.2175 OH1505-A/B 0.6809 OH1506-A 0.0150 0.0680 OH1509-A 0.0053 OH1510-A 0.0278 0.4458 OH1512-A 0.0322 OH1512-B 0.0740 OH1513-A/B 0.3339 OH1514-A/B/C 0.2817 OH1515-A 0.0281 OH1516-A 0.0075 OH1520-A/B 1.1039 0.1062 OH1522/26/27/31 5.0343 OH1525-A 0.1455 OH1529-A/B 0.6808 OH1530/34/40/41 2.3935 OH1357-A 0.0228 0.0228 SA821-A 0.4670 0.4670
Desktop Delineated Wetlands
DD2000-A 5.8040 5.8050 DD2001-A 0.3276 0.3277 DD2002-A 0.1019 0.1019 DD2003-A 0.9843 0.9843 DD2004-A 3.3019 0.8650 DD2005-A 0.3196 DD2006-A 0.3704 DD2007-A 0.1351 DD2008-A 3.8141 DD2009-A 3.1852 DD2010-A 0.1035 DD2011-A 0.1139 DD2012-A 0.2792 DD2013-A 0.2740 DD2014-A 0.1016 DD2015-A 0.5590 DD2016-A 0.3325 DD2017-A 0.3704 DD2018-A 1.4191 DD2019-A 0.2108 0.2108 DD2020-A 0.1622 0.1622 DD2021-A 0.3054 0.3054
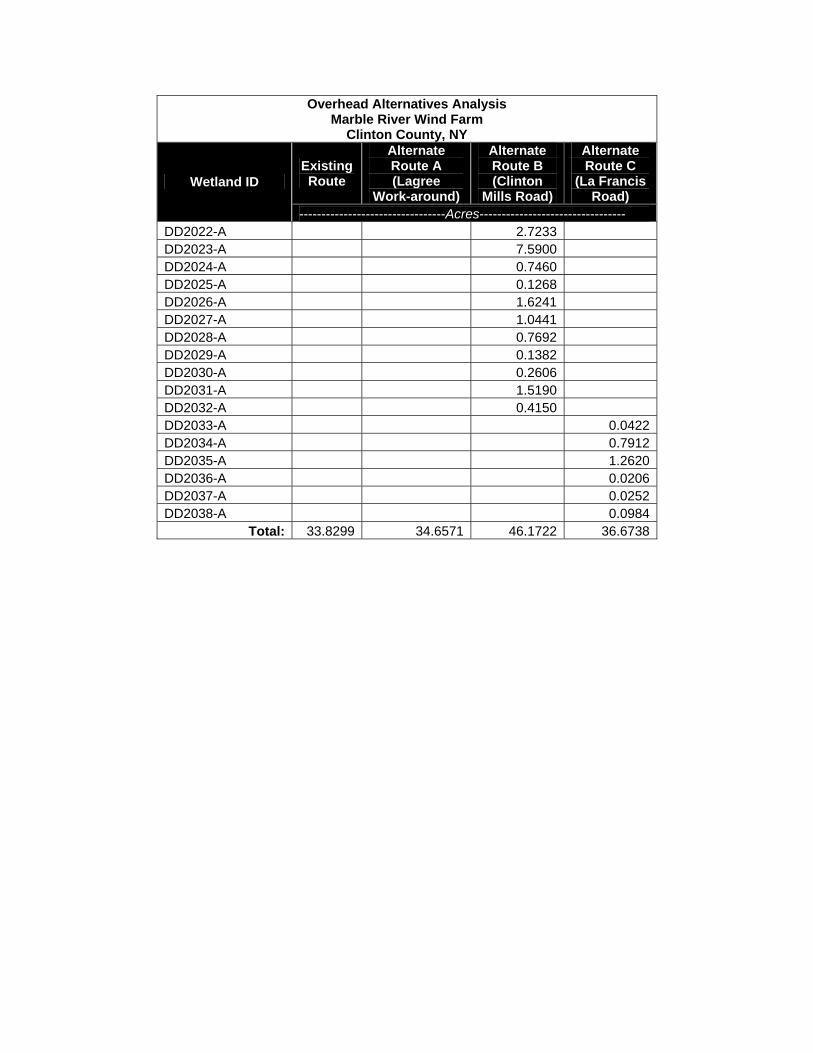
Overhead Alternatives Analysis Marble River Wind Farm
Clinton County, NY
Existing Route
Alternate Route A (Lagree
Work-around)
Alternate Route B (Clinton
Mills Road)
Alternate Route C
(La Francis Road)
Wetland ID
---------------------------------Acres--------------------------------- DD2022-A 2.7233 DD2023-A 7.5900 DD2024-A 0.7460 DD2025-A 0.1268 DD2026-A 1.6241 DD2027-A 1.0441 DD2028-A 0.7692 DD2029-A 0.1382 DD2030-A 0.2606 DD2031-A 1.5190 DD2032-A 0.4150 DD2033-A 0.0422 DD2034-A 0.7912 DD2035-A 1.2620 DD2036-A 0.0206 DD2037-A 0.0252 DD2038-A 0.0984
Total: 33.8299 34.6571 46.1722 36.6738
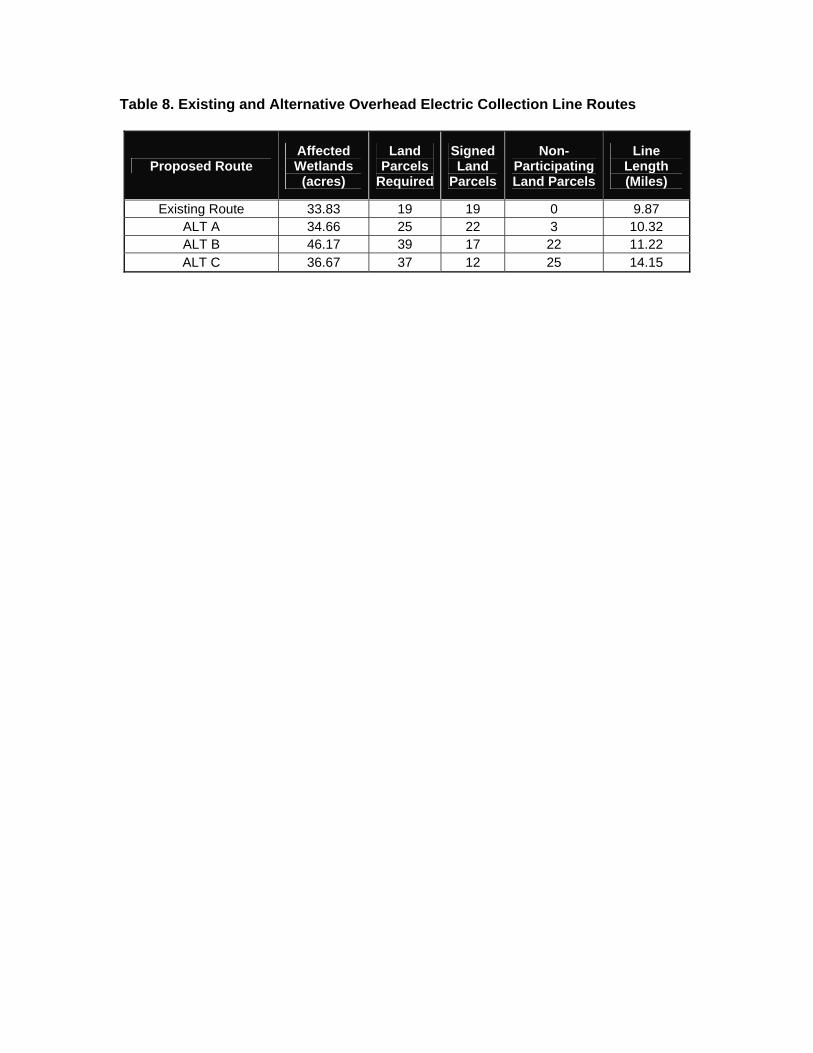
Table 8. Existing and Alternative Overhead Electric Collection Line Routes
Proposed Route Affected Wetlands
(acres)
Land Parcels
Required
Signed Land
Parcels
Non-Participating Land Parcels
Line Length (Miles)
Existing Route 33.83 19 19 0 9.87 ALT A 34.66 25 22 3 10.32 ALT B 46.17 39 17 22 11.22 ALT C 36.67 37 12 25 14.15

Figure 4. Wind Resources Map Marble River Wind Power Project Final Environmental Impact Statement Clinton and Ellenburg, New York

Flat Rock Wind Power Project
Simulation - Proposed Marble River Wind Farm and Noble Wind Parks
Figure 5: Viewpoint 196View from Lyon Mountain Fire Tower, looking north
Marble River Wind Farm
Towns of Clinton and Ellenburg Clinton County, New York
Simulation - Noble Wind Parks
January 2008
Prepared By: