maps for community organizing toolkit - amazon web … · maps for community organizing 6 how do...
TRANSCRIPT

Maps for Community Organizing
A COMMUNITY RESEARCH LAB TOOLKIT October 2012
a program of

MAPS FOR COMMUNITY ORGANIZING 1
About Us
ADVANCEMENT PROJECT Advancement Project (Hwww.advancementprojectca.orgH) is a public policy change organization rooted in the civil rights movemeWe engineer large-scale systems change to remedy inequality, expand opportunity and open paths to upward mobility. Our goal is that members of all communitiehave the safety, opportunity and health they need tthrive. Advancement Project’s Programs include: Educational Equity, Equity in Public Funds, Healt
nt.
s o
hy City, nd Urban Peace Institute.
EALTHY CITY
a H
rch Lab
nd Community Based Participatory Action Research.
Healthy City (www.healthycity.org) is an information + action resource that unites community voices, rigorous research and innovative technologies to solve the root causes of social inequity. We transform how people access and use information about their communities. As a program of Healthy City, the Community Reseapartners with community-based organizations to develop, implement, and disseminate data/ mapping projects, tools, and workshops that promote community knowledge a
Acknowledgements
ACKNOWLEDGEMENTS This toolkit was made possible through our work with Advancement Project’s Urban Peace Institute and such organizations as Community Coalition and Instituto de Educación Popular del Sur de California (IDEPSCA). Healthy City, through the Community Research Lab, developed this toolkit with funding from First 5 Los Angeles. This and other toolkits can be accessed through the Healthy City website at www.healthycity.org/toolbox. CONTENT Authors: Janice C. Burns, M.A. and Deanna Cooke, Ph.D. Editors: Caroline Rivas, M.S.W. and Amy Sausser DESIGN Rosten Woo and Colleen Corcoran / bycommittee.net For more information, visit www.advancementprojectca.org or contact us at (213) 989-1300. Copyright Oct. 2012 Advancement Project – Healthy City All rights reserved. Use and reproduction of these materials in any format should be credited to Advancement Project- Healthy City Community Research Lab. Materials are not to be used or sold for commercial purposes or profit.
MAPS FOR COMMUNITY ORGANIZING 2
About the Toolbox
Healthy City supports communities in identifying, organizing, and sharing its collective voice with decision makers at the local and state levels. Through the Community Research Lab, we share best practices and methods for Community-Based Organizations (CBOs) interested in supporting their strategies with research that combines community knowledge with Healthy City technology. Toward this aim, we have developed the Community Research Lab Toolbox. The toolbox presents research concepts, methods, and tools through topical guides and toolkits such as Community Research, Participatory Asset Mapping, and a Short Guide to CBPAR (all of which can be accessed at www.healthycity.org/toolbox). It is based on best practices from our work with CBOs and a unique approach to the Community Based Participatory Action Research (CBPAR) framework, which promotes research that:
1. Starts with issues and strategies then produces analysis that informs action
2. Uses mapping technology to engage organizations in the research process
3. Is both community-based and place-based, often focusing on a geographic place such as a neighborhood
The toolbox’s CBPAR framework explicitly focuses on community-based organizations that bring together community members to visualize and actualize research and its outcomes. This includes non-profit organizations that operate in specific, local communities and are staffed by, work with, represent, assist, and/or advocate on behalf of residents of those communities on issues that affect their quality of life. These organizations have worked to gain trust among community members and have brought together a spectrum of people with varying ideas and perspectives that unite around a particular set of concerns relevant to a large portion of the community. Though it may have utility for other groups, it supports these organizations whose work directly engages community members in creating change.
About this Toolkit
How can this toolkit be used? + As an instructional toolkit for using maps in a participatory way that builds community capacity for research and supports the community organizing strategy. Community-Based Organizations can use the concepts, methods, and online tools provided to turn research into news that can be shared within and outside of their community. + As a workbook for workshops on using maps to conduct community analysis with community members. It can be used to help plan and facilitate a workshop on how to use these tools in a participatory way, to not only engage community members in doing research, but in developing action steps and strategies from the research as well. + As a resource and information guide for conducting research within the CBPAR framework.
What will you find in this toolkit? + Key research concepts and methods + Additional Tools You Can Use, with in-depth guides for applying the concepts and methods + Glossary terms in BOLD + Notes like the one below to write down any thoughts or ideas you have as you read
HOW CAN THIS TOOLKIT BE USEFUL IN YOUR SPECIFIC WORK OR PROJECTS? _______________________________________
_______________________________________
_______________________________________
_______________________________________
_______________________________________

MAPS FOR COMMUNITY ORGANIZING 3
This page left intentionally blank.

Contents
I. Maps for community organizing 5 II. How do maps benefit community organizing? 6 III. How can community organizers use maps in a participatory way? 7
a. Community Analysis 9 b. Community-Engaged Mapping 9 c. Example: Maps for organizing in the King Park community 10
IV. Conclusion 11 V. Glossary 12
VI. Additional Tools You Can Use 13 a. Appendix A- Maps 101: What do you often see on a map? 14 b. Appendix B- Tips for creating maps to tell your community’s story: Map Design 16 c. Appendix C- Tips for creating maps to tell your community’s story: Creating Maps
with HealthyCity.org 17 d. Appendix D- Tips for creating maps to tell your community’s story: Analysis
Worksheet 20 e. Appendix E- Ethics in Community Based Participatory Action Research 21 f. Appendix F- Exercise: No to Measure X! 22
VII. References Cited 25
MAPS FOR COMMUNITY ORGANIZING 4

MAPS FOR COMMUNITY ORGANIZING 5
Maps for community organizing
An organizer is situated somewhere in the physical world. Her terrain can be a block in an urban center of a neighborhood, on Soto Street in East Los Angeles or the Lower Ninth Ward in New Orleans, in the recovery room at the Brigham and Women’s Hospital in Boston or in the foundry at the Ford River Rouge plant outside Detroit.i Community organizing often happens in a specific place, like a neighborhood, rich with history, experiences, stories, and people that call that place home. Community organizers seek social justice, equity and advancement for people in the places they live because often “where [they] live determines how [they] live.”1 In order to create positive change in these places, which often suffer the greatest burden of social inequity, an organizer’s toolbox is filled with skills, strategies, and passion for engaging with communities. Community Based Participatory Action Research (CBPAR) is one such strategy. Organizers utilize CBPAR to facilitate engagement, education, strategizing, and dialogue among community members and decision-makers. Because place and community is such a key part of organizing, organizers can use maps as one tool in their CBPAR strategy to build community power. By integrating maps with CBPAR, organizers can engage communities to:
• Identify community conditions • Examine root causes of community
inequities • Strengthen community led action
By increasing community capacity for research, organizers can better equip communities with knowledge and power to initiate change. This
toolkit presents ways that organizers have used maps in a participatory way by drawing upon examples of Healthy City’s work with community based organizations. In our experience, community analysis and Community-Engaged Mapping are practical research tools for organizers to apply in their work with communities. These two methods particularly support an interactive and visual dialogue with community members. The toolkit provides instructions for how organizers can use these methods to put research into the hands of the community, particularly using the HHealthyCity.orgH online mapping tool.
MAPS FOR COMMUNITY ORGANIZING 6
How do maps benefit community organizing?
As a place-based tool for a place-based strategy, maps present one way to display and discuss community research and analysis by visually representing data by geography or location and linking it to community conditions and issues.ii By integrating maps with a CBPAR strategy, organizers can build the community’s capacity to clearly illustrate issues to influence decision-makers and support their needs for change. As Jamecca Marshall of Advancement Project’s Urban Peace Institute explains “the map allows people to speak the same language. Maps help community to talk to [the public sector] and similarly the [public sector] to speak more like the community. Community members are more empowered and able to hold their own… and take on the role of the decision maker” (personal interview, May 2012). Organizers can use maps to help position community members on equal footing with decision-makers, backing their community knowledge with the power of recognized administrative data.
Organizers can also use maps to document the experiences and perspectives of people who live in the same neighborhood. As Guadalupe Garcia, Lead Organizer at Instituto de Educación Popular del Sur de California (IDEPSCA), explains “[creating] your own map with your own resources and own information... is helpful for organizations who are working in a specific area, need data, and need to find resources” (personal interview, May 2012). Community generated maps help organizers facilitate a conversation with community members to provide knowledge, collectively “dig in” to the data, and ultimately lead to strategic conversations on how to resolve community identified issues. When community members participate in the research through creating and analyzing maps of their community and experiences, you gain better information and community ownership for your strategy.iii This can help lift up community expertise and create a common ground that unites community members around issues that affect the whole community.
Maps serve to visually make the point about inequity and provide [organizations] with ammunition when they go to decision makers; when the parent or community member tells their story, [the] anecdotal data [is] backed by quantitative data.
Alberto Retana, Executive Vice President of Community Coalition

MAPS FOR COMMUNITY ORGANIZING 7
How can community organizers use maps in a participatory way?
Organizers often use information gathering and research as opportunities for education, learning, and capacity building with community members. You can insert maps into this process to help guide community members to think strategically about data, understand the power it has in helping them speak the language of decision-makers, and connect it to specific community strategies. When uses in a participatory research process, maps can provide community members with a picture of the issues and a means to express their voice and build overall buy-in to take action on new issues in new areas. To begin this process of using maps in a participatory research process consider the points in the box on the right, as well as the table on the following page.
The following list offer several steps to using maps in research with community members:
1. Ask community members what issues most affect them and what questions they can identify from these issues for research.
2. Work with them to identify the key information and data that would be relevant and meaningful to display in a map that makes their case.
3. Create maps of key demographic data
such as the number of youth and families, racial and ethnic breakdown, poverty, or educational attainment level that can help identify the issues and geographic areas to target your strategy.
4. Create maps of the community’s
experiences. 5. Analyze these maps with community
members.

Taken from our Research Plan for Action, this table can be used to initiate the process of using maps in a participatory way with your community members.
Topic Description
Research question(s): What specific research question(s) stem from your issue? (Feel free to provide a range of possible questions here)
Data Collection: What information/data do you need to answer these questions?
Access to Secondary Resources: Which of this data can you get from secondary sources? Which secondary sources?
Access to Primary Resources: Which of this data can you get from primary sources? From who specifically?
Information Design: How can you turn your data into visual information/visualize it?
Analysis: What answers do the data and visualizations provide to your research question?
Product/Presentation: How will you present your analysis/findings? What final products will you produce (e.g. reports, community profiles, etc.)?
Once you have developed or discussed these questions map design with your community, use the steps outlined in Appendix C to use HealthyCity.org to create your maps.
MAPS FOR COMMUNITY ORGANIZING 8

MAPS FOR COMMUNITY ORGANIZING 9
Community-Engaged Mapping Maps for Community Analysis
Through the course of a campaign or initiative, organizers may rely upon data from mainstream sources to inform and advocate for change (such as the U.S. Bureau of the Census), as well as investigate conditions “on the ground” by directly collecting data from or with community members (such as interviews, surveys, or focus groups). Organizers can use community analysis and Community-Engaged Mapping as two participatory ways to generate maps with community members to examine community conditions and inequities and strengthen your community led initiative and action. Community analysis involves identifying sources and collecting key information about the community (particularly from mainstream or administrative sources) such as physical geography, population demographic data, community services, or other resources.1 Organizers have particularly used community analysis in the initial stage of planning a campaign or initiative. For instance, the map below shows how organizers can use maps to highlight the relationship between social, economic, health, or other conditions and the particular place it occurs, like the relationship between safety and the physical environment of a neighborhood. How does this map describe what’s happening in this community, in a way that demonstrates community conditions and the need for change? This map can help show the inequity in the availability of grocery stores to liquor stores in South Los Angeles.
Community-Engaged Mapping is a group mapping exercise designed to answer specific research questions and gather neighborhood-level primary data from community members (who live, work, or attend school in the area), for the purpose of developing place-based plans, policies, and interventions. A Community-Engaged Mapping exercise can document community knowledge, expertise, and experience, while also visually demonstrating inequity in a way that other forms of research cannot. You can use this exercise with community members to map community strengths and begin conversations about root causes that relate to place, location, and the environmental and physical design of the community (to plan and implement a doing Community-Engaged Mapping exercise, you can see the Participatory Asset Mapping toolkit).iv For example, the map above displays information collected from community members.

MAPS FOR COMMUNITY ORGANIZING 10
Example: Maps for organizing in the King Park community
Community Coalition for Substance Abuse Treatment and Prevention, or CoCo, has used these methods with their community members to identify “what and where” inequities exist in their communities and strategize actions to take to dismantle them. As one of the most active and effective grassroots organizing groups in California, CoCo thrives on community engagement that builds strong community leaders, campaigns, and capacity. They have used maps not only to demonstrate inequity, but to engage community members in specific South Los Angeles neighborhoods to unify them around community values, issues, and action. In planning their strategy in the King Park community, Community Coalition and community members did community analysis that included reviewing maps of key community demographics and mapping out assets and deficits. This helped community members identify resources available in the area and opportunities to create assets from deficits. They then worked with Healthy City to facilitate several Community-Engaged Mapping events, leveraging place-based strategies and interventions such as Crime Prevention through Environmental Design (CPTED). CPTED advances the notion that “the proper design and effective use of the built environment can lead to a reduction in the fear of crime and incidence of crime, and to an improvement in the quality of life,.”1 In this type of Community-Engaged Mapping, facilitators guided community
members through identifying community conditions and potential causes. Specifically, community members created a picture of crime and safety in the community, by placing points on the map where they felt unsafe and discussing reasons why they felt unsafe there, as shown in the picture below. For example, community members felt that the lack of sufficient lighting in the evening and lack of well-maintained grounds and equipment made crime and threat a common experience at a local park, Martin Luther King, Jr. Park. Through their own investigation, CoCo identified a specific area within South Los Angeles that they were interested in targeting to address crime issues. However to build capacity and target their change efforts, they needed the community’s expertise on how and where the issue most impacts the community. A Community-Engaged Mapping activity, coupled with analysis and strategizing, helped organizers ask residents to identify where crime is occurring, what types of crimes are occurring, and indicate how much crime impacts their daily activities. CoCo also worked with the community to identify resources and assets that support community well-being. Over the past two years, CoCo and its resident leaders have applied their community analysis and Community-Engaged Mapping results to effectively advocate for improvements and renovation of King Park. By leveraging community knowledge and solutions, CoCo was able to partner with community members and local officials to make the environmental changes needed to make the park a safe place to go in the community. They worked with the city government to renovate playground equipment and changed the park’s bathroom design to remove mold and discourage the use of the facilities for illegal drug use. King Park also received investment to create a Summer Night Lights program, keeping the park open late during summer hours to improve community safety and enhance violence prevention efforts. Residents report that these changes have led to an increased feeling of community safety, a sense of empowerment, community cohesion, and increased levels of civic engagement to ensure improvements in the community continue.

MAPS FOR COMMUNITY ORGANIZING 11
Conclusion
CoCo’s experience demonstrates just one example of organizers using maps in a participatory way to create change in their community. Whether you are working with youth to map photos and videos of community resources like HRaices CulturaH in CoachelValley or map meaningful and relevant demographic data like HChild Leader Project
la
H inRiverside, organizers across many communities use maps to involve community members in doing community analysis, identifying inequities, and documenting community knowledge. Together, equipped with knowledge, organizers and community members can mobilize for action.
Now that you have a better understanding of how organizers can use maps in a participatory way, the following tools and references in the Additional Tools You Can Use section provide instructions for using maps to engage community members to create maps that document community expertise, identify community inequity, and strengthen community-led action. You can rely on your facilitation skills, experiences, and best practices (such as laying ground rules, icebreakers, group decision making processes, etc.) to apply these tools in an interactive way that empowers and considers the comfort levels of the community members (for any needed tips on facilitation, see the HParticipatory Asset Mapping ToolkitH). Thestools offer ways that you can practice using maps in a participatory way, so that community members can analyze their experiences, back-up their knowledge, and connect community analysis to action.
e
Using Appendix A- Maps 101: What will you often see on a map?, you can guide community members through maps basics and how to “read” and understand a map and create a map that others can understand as well. You can then use Appendix B- Tips for Creating Maps to Tell Your Community’s Story: Map Design to discuss the issues, research questions, and information needed for the maps and how you will present and use them to plan strategy. You can use Appendix C- Tips for Creating Maps to Tell Your Community’s Story: Creating Maps with HealthyCity.org to work with the community members to create maps that can portray and visualize these issues with little explanation. Appendix E: Ethics in Community Based Participatory Action Research outlines basic principles to guide you in making sure that community members, and the community overall, benefit from the research experience. Finally, Appendix F- Exercise: No to Measure X! offers an example activity that you can use with your community to learn and apply all of these tools.
MAPS FOR COMMUNITY ORGANIZING 12
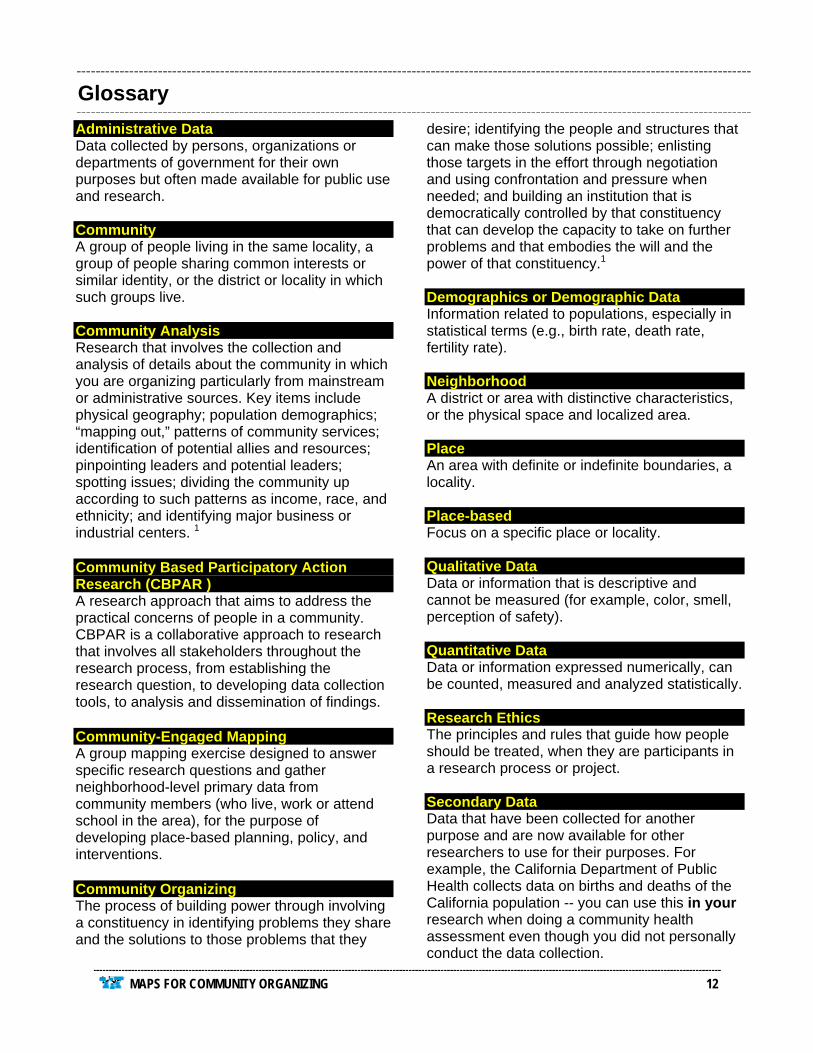
Glossary
Administrative Data Data collected by persons, organizations or departments of government for their own purposes but often made available for public use and research. Community A group of people living in the same locality, a group of people sharing common interests or similar identity, or the district or locality in which such groups live. Community Analysis Research that involves the collection and analysis of details about the community in which you are organizing particularly from mainstream or administrative sources. Key items include physical geography; population demographics; “mapping out,” patterns of community services; identification of potential allies and resources; pinpointing leaders and potential leaders; spotting issues; dividing the community up according to such patterns as income, race, and ethnicity; and identifying major business or industrial centers. 1 Community Based Participatory Action Research (CBPAR ) A research approach that aims to address the practical concerns of people in a community. CBPAR is a collaborative approach to research that involves all stakeholders throughout the research process, from establishing the research question, to developing data collection tools, to analysis and dissemination of findings. Community-Engaged Mapping A group mapping exercise designed to answer specific research questions and gather neighborhood-level primary data from community members (who live, work or attend school in the area), for the purpose of developing place-based planning, policy, and interventions. Community Organizing The process of building power through involving a constituency in identifying problems they share and the solutions to those problems that they
desire; identifying the people and structures that can make those solutions possible; enlisting those targets in the effort through negotiation and using confrontation and pressure when needed; and building an institution that is democratically controlled by that constituency that can develop the capacity to take on further problems and that embodies the will and the power of that constituency.1 Demographics or Demographic Data Information related to populations, especially in statistical terms (e.g., birth rate, death rate, fertility rate). Neighborhood A district or area with distinctive characteristics, or the physical space and localized area. Place An area with definite or indefinite boundaries, a locality. Place-based Focus on a specific place or locality. Qualitative Data Data or information that is descriptive and cannot be measured (for example, color, smell, perception of safety). Quantitative Data Data or information expressed numerically, can be counted, measured and analyzed statistically. Research Ethics The principles and rules that guide how people should be treated, when they are participants in a research process or project. Secondary Data Data that have been collected for another purpose and are now available for other researchers to use for their purposes. For example, the California Department of Public Health collects data on births and deaths of the California population -- you can use this in your research when doing a community health assessment even though you did not personally conduct the data collection.

MAPS FOR COMMUNITY ORGANIZING 13
MAPS FOR COMMUNITY ORGANIZING 13
Additional Tools You Can Use
The following tools provide further instructions and resources for using maps for community organizing:
APPENDIX A- MAPS 101: WHAT DO YOU OFTEN SEE ON A MAP?
APPENDIX B- TIPS FOR CREATING MAPS TO TELL YOUR STORY: MAP
DESIGN
APPENDIX C- TIPS FOR CREATING MAPS TO TELL YOUR STORY: CREATING MAPS WITH HEALTHYCITY.ORG
APPENDIX D- TIPS FOR CREATING MAPS TO TELL YOUR STORY: ANALYSIS WORKSHEET
APPENDIX E- ETHICS IN COMMUNITY BASED PARTICIPATORY ACTION
RESEARCH
APPENDIX F- EXERCISE: NO TO MEASURE X!

MAPS FOR COMMUNITY ORGANIZING 14
MAPS 101: WHAT DO YOU OFTEN SEE ON A MAP? While some community members may be familiar with maps, others may find them hard to understand, especially when used for research or displaying community data. Use the following example to discuss how to “read” and understand maps used in research and how to include specific elements that will help others understand the maps you create. Descriptive Text: Can include the title, source information (who created the map, the origin of the data, the title of the information and year the data was collected), or a couple of brief sentences that highlight key information, statistics, and patterns from your map. What information does the descriptive text on this map provide?
____________________________________________________________________________
____________________________________________________________________________
Legend: Provides the information needed to read the map, including the data displayed. What information does the legend above provide about the map?
____________________________________________________________________________
____________________________________________________________________________
Inset Map: Usually a map of the next largest geography from your focus area. Your focus area is usually highlighted here as a part of this larger geography. An inset map allows you to compare the data in your focus area to the data in the larger area. What information does the inset map above provide? How does the East Los Angeles area that the main map highlights compare with the City of Los Angeles area in the inset map?
INSET MAP
Title
PHYSICAL FEATURES& LABELS
GEOGRAPHIES
GRAPHICS
LEGEND
NORTH ARROW & SCALE BAR
SOURCE INFORMATION
APPENDIX A

____________________________________________________________________________
____________________________________________________________________________ Scale Bar and North arrow: Provides the scale and orientation of the map, respectively. This is particularly useful when you add data to the map, to discuss where certain patterns appear or the distance of these patterns. For example, what part of the area above has the most highway interchanges, northern, southern, eastern, or western? ____________________________________________________________________________
____________________________________________________________________________
Geographies: Non-physical shapes defined by boundaries such as city limits or census tracts. What are the geographies shown in the map above? Hint: they’re dark blue.
____________________________________________________________________________
____________________________________________________________________________
Physical Features: Elements that define the physical landscape and identify the physical location of the area such streets, highways, natural terrain. What physical features do you see in the map above?
____________________________________________________________________________
____________________________________________________________________________
Labels: Text that identifies the geographies or physical features on your map. What labels do you see on the map above?
____________________________________________________________________________
____________________________________________________________________________
Graphics: Any other images, such as logos or pictures, that are relevant to your map. What graphics do you see on this map? What other graphics could be added to this map to make this map better?
____________________________________________________________________________
____________________________________________________________________________
MAPS FOR COMMUNITY ORGANIZING 15
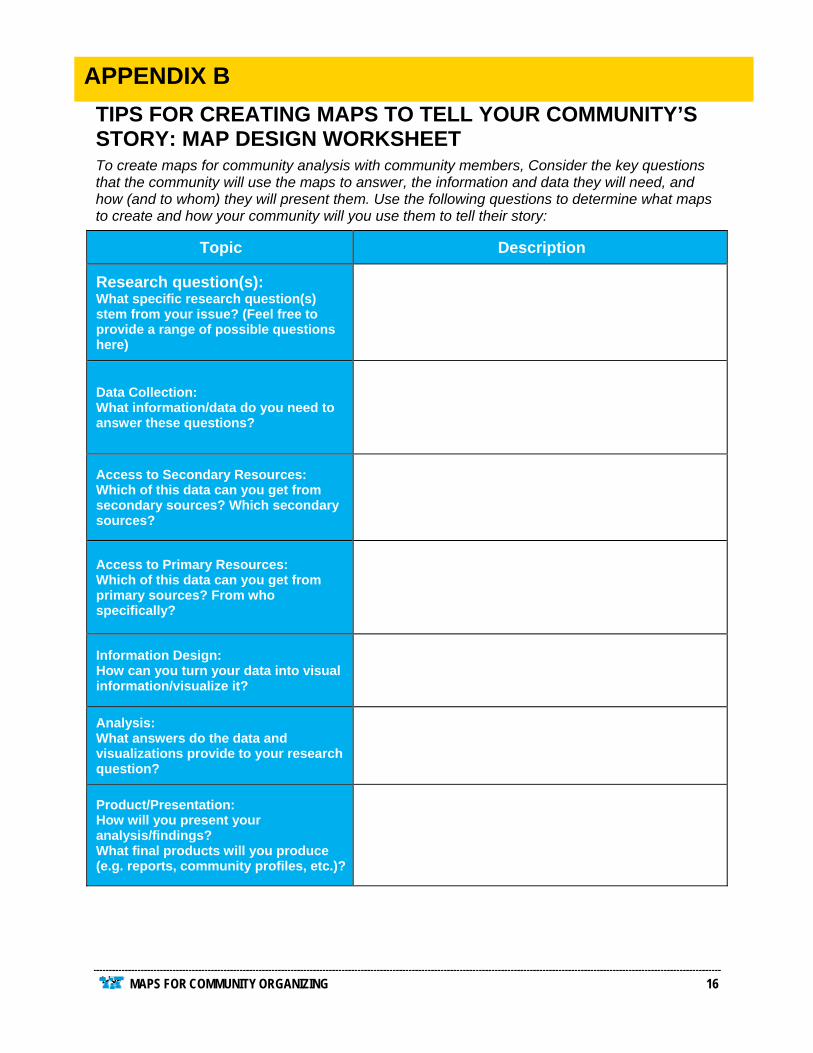
TIPS FOR CREATING MAPS TO TELL YOUR COMMUNITY’S STORY: MAP DESIGN WORKSHEET
To create maps for community analysis with community members, Consider the key questions that the community will use the maps to answer, the information and data they will need, and how (and to whom) they will present them. Use the following questions to determine what maps to create and how your community will you use them to tell their story:
Topic Description
Research question(s): What specific research question(s) stem from your issue? (Feel free to provide a range of possible questions here)
Data Collection: What information/data do you need to answer these questions?
Access to Secondary Resources: Which of this data can you get from secondary sources? Which secondary sources?
Access to Primary Resources: Which of this data can you get from primary sources? From who specifically?
Information Design: How can you turn your data into visual information/visualize it?
Analysis: What answers do the data and visualizations provide to your research question?
Product/Presentation: How will you present your analysis/findings? What final products will you produce (e.g. reports, community profiles, etc.)?
APPENDIX B
MAPS FOR COMMUNITY ORGANIZING 16

MAPS FOR COMMUNITY ORGANIZING 17
TIPS FOR CREATING MAPS TO TELL YOUR COMMUNITY’S STORY: CREATING MAPS WITH HEALTHYCITY.ORG
APPENDIX C
Once you have identified the issues, research questions, or information you need (see Appendix B), you can guide community members through using HealthyCity.org for community analysis and community-engaged mapping. HealthyCity.org provides free, online tools and data (for the state of California) that you can use to create maps that document community expertise, identify community inequity, and strengthen community-led action. Below are three examples, with steps that you can follow to create maps on the website and to analyze them.
1. Resources - Community Analysis of Store Availability.
As part of a potential media and advocacy campaign, this map was created to show the inequity in the availability of grocery stores to liquor stores in South Los Angeles.
Create this map (and others like it) This map displays point data, or data that has a specific address or x/y coordinate. You can create a map of this and other services and point data on HealthyCity.org website.* Here’s how: On HealthyCity.org, click the Maps Tab: a. Click “Change” next to Geography. Select a Geography. Click “Submit.” b. Click the +- buttons next to Services and Points to begin to add point data to the map. c. Once the Add Data box opens, select the data of your choice. These steps are: Select a “Category” Select a “Sub-Category” Select a “Year, Source” Select a “Specific Category.” You can also find the points that you add on a Wikimap here, by selecting “Category” and “Wikimaps.” d. Click “Add to List.” e. Click Submit. *You can find Grocery Stores and Alcohol Outlets under the Neighborhood and Community category.

2. Demographics - Community Analysis of Poverty. In 2007, twenty-eight percent (28%) of families in the Baldwin Village Gang Reduction and Youth
Development Zone were living in poverty (about 1/3 of all families in the area). The map below displays this information.
Create this map (and others like it) The map above is an example of a thematic map, or data that is aggregated to boundaries such as census block groups, tracts, ZIP codes, cities, etc. It displays the percent of families in poverty in block groups in the area shown. You can create a map of this and other demographic, health, economic, or housing data on HealthyCity.org. ** Here’s how: On HealthyCity.org, click the Maps Tab:
a. Click “Change” next to Geography. Select a Geography. Click “Submit.” b. Click the +- buttons next to Demographic Data, Economic Data, Health & Safety Data, or
Housing Data to begin to add thematic data to the map. c. Once the Add Data box opens, select the data of your choice. These steps are: Select a
“Category” Select a “Sub-Category” Select a “Year, Source” Select a “Specific Characteristic (Choose only one).”
d. Click Submit. **You can find Families in Poverty data under Economic Data.
MAPS FOR COMMUNITY ORGANIZING 18

3. Community Experiences - Community-Engaged Asset Mapping. As part of a community-engaged mapping event,** high school youth used colored stickers to map the
different places that they went and considered assets.
Create this map (and others like it) This maps displays information collected from community members. You can create a map that you and others can add data to, directly on HealthyCity.org. Here’s how: First, create a “Wikimap.” On HealthyCity.org, click the Account Tab: a) Click Wikimaps in the left column. Then click Create a Wikimap. b) Type in the title of your map (you can use your research or survey question as the title). c) Select a “Focus Area” that best represents your community. d) “Tell your audience about the information you are collecting” or why you are collecting it. e) “Name the categories you want people to map.”Type in any different categories for the types
of places that you are collecting. For instance, if you are collecting information about different types of food outlets, your categories may be grocery stores, fast food restaurants, etc.). Select a color for each category.
f) “What information do you want people to add to each point?”Describe the type of information you will collect about each place. For instance, for food outlets, you may want the Name of the place and the Types of food it provides as the information you will add about each place.
g) “How do you want participants to add information on the map?” Select how you want to add places to the map, by adding points, lines, shapes, or addresses (you can select more than 1 method).
h) “Advanced options” are available if you want to provide additional context or change the labels on your map. For example, you could translate the map text, buttons, and instructions into Spanish.
i) Finally, click Submit. Once you have created your Wikimap, use the “Add points” link to add data.
Add points to the Wikimap. j) Use the “Add points” link to view and add information to your map. k) Click on any icon at the upper left hand corner of the map, such as “Add a point” or “Add an
address.” l) A window will appear that allows you add information about this point. You can also add
photos and video. m) Click Submit.**For in-depth instructions on using wikimaps for Community-Engaged Mapping, refer to our
Participatory Asset Mapping Toolkit at http://www.healthycity.org/toolbox.
MAPS FOR COMMUNITY ORGANIZING 19

TIPS FOR CREATING MAPS TO TELL YOUR COMMUNITY’S STORY: ANALYSIS WORKSHEET What basic information does your map provide? ______________________________________________________________________
______________________________________________________________________
______________________________________________________________________ Are there any clear patterns? Is the data evenly distributed or concentrated in one (or more) specific area? Why do you think these patterns occur (considering other data or knowledge of the area)?
______________________________________________________________________
______________________________________________________________________
______________________________________________________________________ How does this map help address your research question?
______________________________________________________________________
______________________________________________________________________
______________________________________________________________________ Overall, what story does the map tell? What’s happening in your community? How does it confirm anything you already know or introduce anything you did not know?
______________________________________________________________________
______________________________________________________________________
______________________________________________________________________ Based on this information, what action needs to happen and what can you do about it? How will this map guide your strategy? What information does the map not provide that you would need to investigate further?
______________________________________________________________________
______________________________________________________________________
______________________________________________________________________
APPENDIX D
MAPS FOR COMMUNITY ORGANIZING 20
MAPS FOR COMMUNITY ORGANIZING 21
APPENDIX E
ETHICS IN COMMUNITY BASED PARTICIPATORY ACTION RESEARCH
Research Ethics are the principles and rules that guide how people should be treated, when they are participants in a research process or project. It might be difficult to anticipate all of the research ethics that may arise during, but it is important to be sensitive to the people involved in your research. Here are some ethics to consider:
Accessibility of findings Are the findings presented in an accessible and meaningful way for community members?
Benefits to the Participants How will you ensure that the participants in the community are not harmed during the research and gain as much benefit as possible through their participation?
Community Voice Who is the community? Who represents the community? Who speaks for the community? Do participants come from only some of the areas you are working in? Do they represent only some of the social identities in the community overall? Are there institutional, organizational or other social dynamics that privilege some voices over others? Will some portions of the community benefit more than others as a result?
Credit How are the results represented? Whose voice(s) are heard and represented? Who receives credit for the work conducted?
Data ownership How will you responsibly make the data available to the different community and other stakeholders?
Division of labor How does ‘equity’ in the process translate into divisions of labor on the project/process? Is the work divided equitably among partners?
Justice Do all members of the community have equal
opportunity to participate in the research? Are there some participants who are unfairly impacted by the research? (Ex. The U.S. Public Health Service Syphilis Study at Tuskegee included only poor African American men, who were not treated for the disease even when a cure was found; the study was also conducted without the benefit of their informed consent. For details about this study, visit http://www.cdc.gov/tuskegee/index.html).
Privacy Will it do any harm to the community or individuals to report the findings? How can you protect privacy in the data collection and sharing process? Did you get adequate permission from participants? Do they understand and agree with the way you plan to use the data?
Representation of local communities Does the presentation (or presenter) of findings in any way reinforce negative social stereotypes in presenting communities? Be mindful and transparent about how representative the findings may or may not be of the community based on participation.
Respect How do you maintain respect for a person’s ability to engage/not engage in the research without coercion?
Rigor of research and fidelity to findings Are the findings being presented accurately? Are they presented with any bias or in a way to make people hear what they want to hear?
If you are conducting research involving community members and this research will be published, you may want to consider an ethical review board. For more information on this topic, see the University of Southern California’s Office for the Protection of Research Subjects brochure “Is Your Project Human Subjects Research?” at www.usc.edu/admin/provost/oprs/training/brochures.html.

EXERCISE: NO TO MEASURE X!
Topic Description
Research question(s): What specific research question(s) stem from your issue? (Feel free to provide a range of possible questions here)
Where do most homeowners in the City of Compton live? Which of these areas have the highest numbers of registered voters? Where should we target outreach?
Data Collection: What information/data do you need to answer these questions?
We would need data on homeowners and registered voters..
Access to Secondary Resources: Which of this data can you get from secondary sources? Which secondary sources?
One place we know we can get information from homeowners is from the Census. We can also find this
information as well as voter information on the Healthy City website.
Access to Primary Resources: Which of this data can you get from primary sources? From who specifically?
Map should be clear and easy to understand and explain. We should use colors and data ranges that would make our
areas of interest stand out (and easy to explain).
Information Design: How can you turn your data into visual information/visualize it?
We need a visual that clear and easy to understand and explain. Therefore, we will create a map to clearly show
where most homeowners and registered voters live, and use different colors to make our areas of interest stand out.
Analysis: What answers do the data and visualizations provide to your research question?
See the analysis further below
Product/Presentation: How will you present your analysis/ findings? What final products will you produce (e.g. reports, Power Point etc.)?
Will present this in a presentation to the coalition providing small copies and creating a large poster of the map.
You can use this example exercise to practice all of the steps outlined in Appendices A-C with your community. You can start by developing a map design that will help you identify where most homeowners live. See Appendix B for more detailed information about map design. You work with a coalition of residents in the city of Compton. Most of your coalition members are retired homeowners who have lived in the city for many years. Measure X on the upcoming local ballot proposes to benefit the community but will significantly increase water costs for many of your members, most of them elderly or
retired homeowners who will greatly impacted by the higher fee. The coalition members want to raise voter awareness about the measure through door knocking and calls to the other retired homeowners who may be most affected by this measure. You can start by developing a map design that will help you identify where most homeowners live. See Appendix B for more detailed information about map design. Here’s an example of a map design created for this exercise:
APPENDIX F
MAPS FOR COMMUNITY ORGANIZING 22

MAPS FOR COMMUNITY ORGANIZING 23
Once we created a basic map, we customized it to best convey the message to our audience and help target our outreach. We added and compared registered voter data and customized the display of the map to highlight the areas to target (below). We changed the “data ranges” so we can see the areas that have 50% or more homeowners. We changed the colors to show the highest percent of homeowners in a dark color that stands out from the color that represents the lowest percent. Here is our final map.
Once you have developed or discussed the map design with your community, use the steps outlined in Appendix C to start creating a map for this exercise on HHealthyCity.org.H Once you have several maps, you can use them to discuss and develop a collective analysis, identify causes, and develop steps to take action on the information. The questions above offer a starting point for the conversation but you canadd or use others to guide the discussion.
Based on the above map design, we created a map on HealthyCity.org that displays data for registered voters and homeowners in the community (See Appendix C, Example 2 for help on how to do this).

MAPS FOR COMMUNITY ORGANIZING 24
We then used this map to answer the analysis questions below to identify causes, and develop steps to take action on the information.
What basic information does your map provide? It shows the percent of owner occupied housing units, which we know to represent
homeowners, and the percent of registered voters (2008) in the community.
Are there any clear patterns? Is the data evenly distributed or concentrated in one (or more) specific area? Why do you think these patterns occur (considering other data or knowledge of the area)?
It looks like most of the homeowners and registered voters live in the western part of the city.
Though the map does not tell us the percent of those homeowners who are registered to vote,
this pattern lets us know that there is a good chance that the homeowners in that area are also
registered to vote. We will have to go to that area and talk to the residents to find out. It also
looks like the city is made up of mostly homeowners overall, so there is a good chance that
most of the people in our community will be affected by Measure X.
How does this map help address your research question?
It helps us identify the area where we should target our door knocking and outreach, which are
the communities in the western area of the city.
Overall, what story does the map tell? What’s happening in your community? How does it confirm anything you already know or introduce anything you did not know? It tells us where most of the owner occupied units are located in the city, or where many
homeowners live. We now have a better idea of where we should target our outreach.
Based on this information, what action needs to happen and what can you do about it? How will this map guide your strategy? What information does the map not provide that you would need to investigate further?
Our community leaders will go and talk to the community members who live in those areas. It
may also be good to figure out how this measure will affect renters in our community and create
a plan to outreach to them as well.

MAPS FOR COMMUNITY ORGANIZING 25
References
i. Mann, Eric. (2011). Playbook for Progressives: 16 Qualities of an Effective Organizer. Boston: Beacon Press.
ii. Bell, Judith & Rubin, Victor. (2007). Why
Place Matters: Building a Movement for Healthy Communities. PolicyLink. Retrieved from Hhttp://www.policylink.org/site/apps/nlnet/content2.aspx?c=lkIXLbMNJrE&b=5136581&ct=6997411H.
iii. Collette, Will. (1984) “Research for
Organizing,” in Roots to Power edited by Lee Staples. New York: Praeger. 142-51.
iv. Advancement Project-Healthy City (2011).
Community-Engaged Mapping.
v. Collette, Will. (1984) “Research for Organizing,” in Roots to Power edited by Lee Staples. New York: Praeger. 142-51.
vi. Participatory Asset Mapping toolkit.
Retrieved from Hhttp://www.healthycity.org/toolboxH.
vii. Crowe, Timothy D. (2000). Crime Prevention
Through Environmental Design: Applications of Architectural Design and Space Management Concepts. 2nd ed. Oxford: Butterworth/Heinemann, 2000.
viii. Collette, Will. (1984) “Research for
Organizing,” in Roots to Power edited by Lee Staples. New York: Praeger. 142-51.
ix. Beckwith, David & Lopez, Christina. (1997).
Community Organizing: People Power from the Grassroots. Center for Community Change. Retrieved from http://comm-org.wisc.edu/papers97/beckwith.htm#whatisco.

MAPS FOR COMMUNITY ORGANIZING 26
Advancement Project – Healthy City Advancement Project – Healthy City
MAPS FOR COMMUNITY ORGANIZING 26
1910 West Sunset Blvd., Suite 500 Los Angeles, CA 90026 (213) 989-1300 www.advancementprojectca.org www.healthycity.org