mapping wilderness character in olympic national … wilderness character in olympic national park...
TRANSCRIPT
1
Mapping Wilderness Character
in Olympic National Park
Final Report
James Tricker, Peter Landres, Jennifer Chenoweth, Roger Hoffman, Ruth Scott
July 2013
2
Mapping Wilderness Character in Olympic National Park
Principle contact:
Peter Landres
Ecologist, Aldo Leopold Wilderness Research Institute, 790 East Beckwith, Missoula, MT
59801
Phone: 406 542 4189, Fax: 406 542 4196, Email: [email protected]
Project team
James Tricker (Aldo Leopold Research Wilderness Research Institute) GIS Analyst
Peter Landres (Aldo Leopold Research Wilderness Research Institute) Ecologist
Roger Hoffman (OLYM) GIS Analyst
Jennifer Chenoweth (OLYM) Wilderness Planner
Bryan Bell (OLYM) Wilderness Information Center Supervisor
Louise Johnson (OLYM) Chief of Natural Resources
Kristin Kirschner (OLYM) Visitor and Resource Protection Ranger
Kim Kwarsick (OLYM) Archeologist
Project team advisors
Dave Conca (OLYM) Chief of Cultural Resources
Jeff Doryland (OLYM) Facilities Management
Sanny Lustig (OLYM) Visitor and Resource Protection Ranger
Greg Marsh (OLYM) Interpretation
Ruth Scott (OLYM) Wilderness Specialist
Teri Tucker (OLYM) Environmental Protection Specialist
3
EXECUTIVE SUMMARY
The recent development of an interagency strategy to monitor wilderness character allows on-
the-ground managers and decision-makers to assess whether stewardship actions for an
individual wilderness are fulfilling the mandate to “preserve wilderness character.” By using
credible data that are consistently collected, one can assess how wilderness character changes
over time and evaluate how stewardship actions affect trends in wilderness character. As most of
these data depict spatial features in wilderness, a GIS-based approach was developed to identify
the state of wilderness character for the Olympic Wilderness in Olympic National Park (OLYM).
A set of indicators and measures were identified by OLYM staff to capture the impacts to the
five qualities of wilderness character. These measures were derived from a variety of spatial
datasets and were formatted onto a common relative scale. Each measure was “weighted” by
OLYM staff to reflect its importance in relation to other measures. Maps were generated for each
of the five qualities of wilderness character, which were added together to produce the
wilderness character map for OLYM.
The wilderness character map delineates the range in quality of wilderness character in the
Olympic Wilderness. A histogram of the map reveals that the majority of wilderness character in
OLYM is of high quality. The map will serve as a baseline for wilderness character quality in
OLYM, in which future reruns of the map with updated datasets will allow for identifying areas
where wilderness character is changing over time. In addition, the map is intended to be used by
OLYM staff to evaluate the spatial impacts of the different planning alternatives during the
development of the OLYM Wilderness Stewardship Plan.
4
ACKNOWLEDGEMENTS
Special thanks to Karen Gustin (former OLYM Superintendent) for encouraging and supporting
this project, and to Todd Suess (OLYM Deputy Superintendent and Acting Superintendent) for
continuing the support needed to complete this project. The passion and commitment of park
staff to wilderness stewardship at OLYM made it the ideal location to conduct this study.
We also greatly appreciate the willingness of the following people to share their time and
expertise to help develop the wilderness character map: M. Barna (NPS Air Resources Division),
J. Vaughan (Washington State University), D. Mennitt and K. Fristrup (NPS Natural Sounds and
Night Skies Division), K. Sherrill (NPS I&M Program), K. Hutten (University of Washington),
S. Carver and J. Washtell (University of Leeds), C. Copass (OLYM Botanist and Pacific West
Region Vegetation Mapping Coordinator), B. Baccus (OLYM Physical Scientist), L. Lack
(OLYM Trails Foreman), B. Hertel (OLYM Trails), M. Tetreau (OLYM Wilderness Resources,
Data Manager), B. Micha (OLYM Wilderness Resources), T. Rankin (OLYM Fire/Fuels
Management), P. Happe (OLYM Wildlife Biologist), S. Gremel (Pacific West Region Wildlife
Biologist – Northern Spotted Owls).
5
CONTENTS
EXECUTIVE SUMMARY ............................................................................................................ 3
ACKNOWLEDGEMENTS ............................................................................................................ 4
LIST OF FIGURES ........................................................................................................................ 7
LIST OF TABLES .......................................................................................................................... 9
INTRODUCTION ........................................................................................................................ 10
OVERVIEW OF WILDERNESS CHARACTER MAP DEVELOPMENT ............................... 14
METHODS ................................................................................................................................... 16
Natural Quality .......................................................................................................................... 18
Indicators and measures ........................................................................................................ 18
Data sources, processing and cautions .................................................................................. 19
Weighting .............................................................................................................................. 23
Maps ...................................................................................................................................... 24
Untrammeled Quality ................................................................................................................ 27
Indicators and measures ......................................................................................................... 27
Data sources, processing and cautions .................................................................................. 28
Weighting .............................................................................................................................. 29
Maps ...................................................................................................................................... 30
Undeveloped Quality................................................................................................................. 33
Indicators and measures ........................................................................................................ 33
Data sources, processing and cautions .................................................................................. 33
Weighting .............................................................................................................................. 35
Maps ...................................................................................................................................... 36
Solitude or Primitive and Unconfined Quality .......................................................................... 39
Indicators and measures ......................................................................................................... 39
Travel time and viewshed modeling ...................................................................................... 40
Travel time ......................................................................................................................... 40
Viewshed............................................................................................................................ 43
Data sources, processing and cautions .................................................................................. 47
Weighting .............................................................................................................................. 51
Maps ...................................................................................................................................... 53
Other Features of Value ............................................................................................................ 57
6
Indicators and measures ......................................................................................................... 57
Data sources, processing and cautions .................................................................................. 57
Weighting .............................................................................................................................. 58
Maps ...................................................................................................................................... 58
THE WILDERNESS CHARACTER MAP ................................................................................. 61
Improvements ............................................................................................................................ 64
Final Concerns about Mapping Wilderness Character .............................................................. 65
REFERENCES ............................................................................................................................. 66
APPENDIX A - Travel impedance for land cover classes ........................................................... 68
7
FIGURES
Figure 1. Olympic National Park ................................................................................................. 11
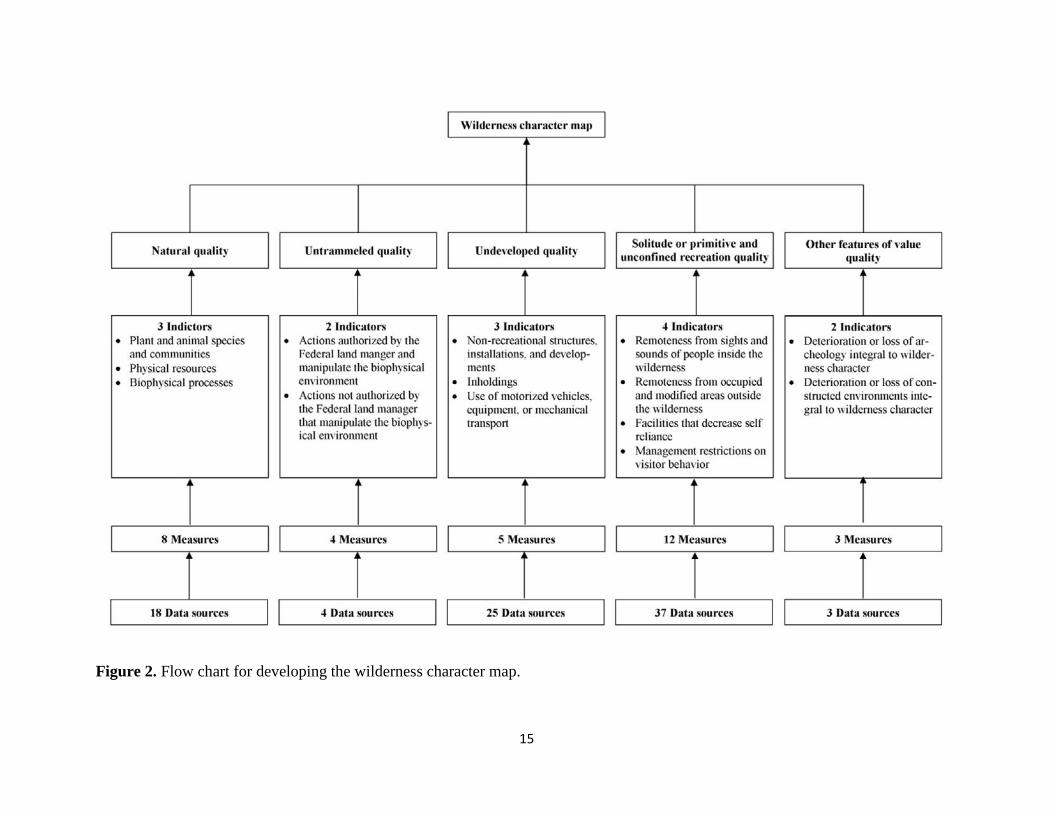
Figure 2. Flow chart for developing the wilderness character map ............................................. 15
Figure 3. Ozone in OLYM ........................................................................................................... 22
Figure 4. Indicator maps for (A) plant and animal species and communities, (B) physical
resources, and (C) biophysical processes .............................................................................. 25
Figure 5. Natural quality of wilderness character ........................................................................ 26
Figure 6. Indicator maps for (A) authorized actions and (B) unauthorized actions. .................... 31
Figure 7. Untrammeled quality of wilderness character .............................................................. 32
Figure 8. Indicator maps for (A) non-recreational structures, installations, and developments; (B)
inholdings; and (C) use of motor vehicles, motorized equipment, or mechanical transport 37
Figure 9. Undeveloped quality of wilderness character. .............................................................. 38
Figure 10. Travel time model ....................................................................................................... 42
Figure 11. Viewshed impacts in OLYM. ..................................................................................... 47
Figure 12. OLYM soundscape map. ............................................................................................ 49
Figure 13. Indicator maps for (A) remoteness from sights and sounds of people inside the
wilderness, (B) remoteness from occupied and modified areas outside the wilderness, (C)
facilities that decrease self-reliant recreation, and (D) management restrictions on visitor
behavior ................................................................................................................................. 54
Figure 14. Combined indicator maps for (A) opportunities for solitude inside wilderness, and
(B) opportunities for primitive and unconfined recreation inside wilderness. ...................... 55
Figure 15. Solitude or primitive and unconfined quality of wilderness character. ...................... 56
Figure 16. Indicator maps for (A) deterioration or loss of archeology integral to wilderness
character, and (B) Deterioration or loss of constructed environments integral to wilderness
character.. ............................................................................................................................... 59

8
Figure 17. Other features of value quality of wilderness character. ............................................ 60
Figure 18. Map of wilderness character in OLYM ...................................................................... 62
Figure 19. Map of wilderness character in OLYM reclassed into ten equal categories .............. 63
Figure 20. Histogram of the wilderness character map values. ................................................... 64
9
LIST OF TABLES
Table 1. Natural quality datasets. ................................................................................................. 19
Table 2. Indicators and measures for the natural quality with weights and rationale. ................. 24
Table 3. Untrammeled quality datasets. ....................................................................................... 28
Table 4. Indicators and measures for the untrammeled quality with weights and rationale. ....... 30
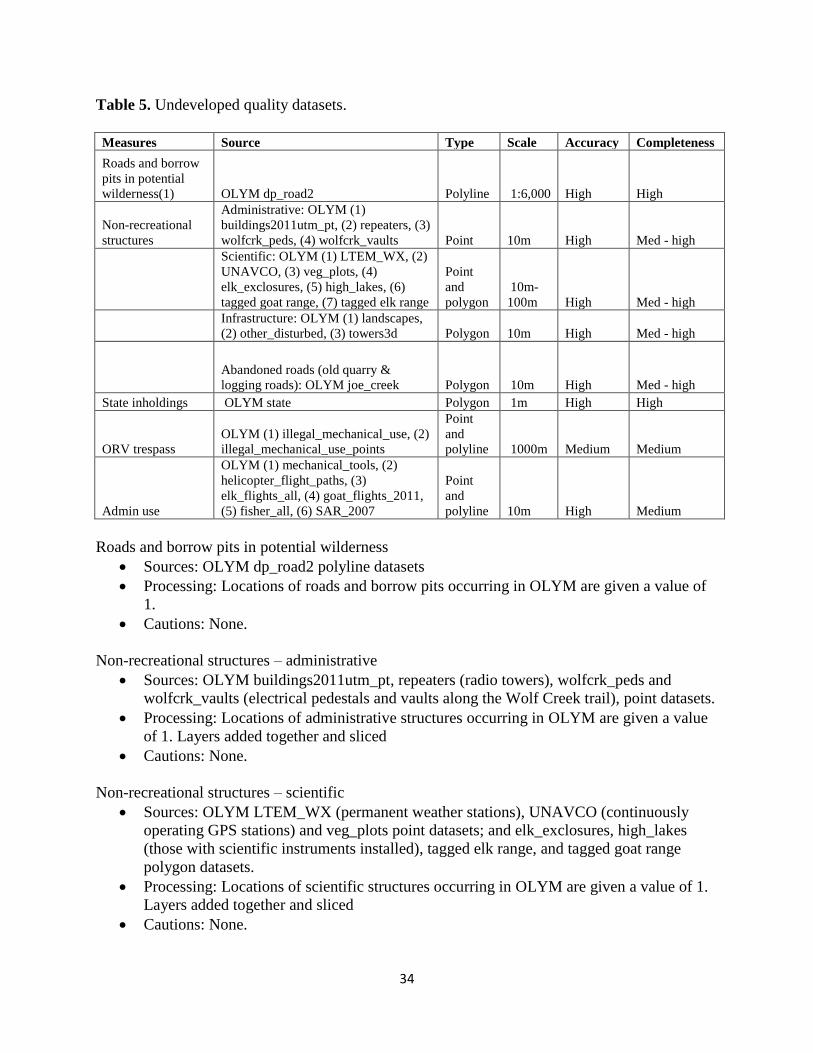
Table 5. Undeveloped quality datasets. ........................................................................................ 34
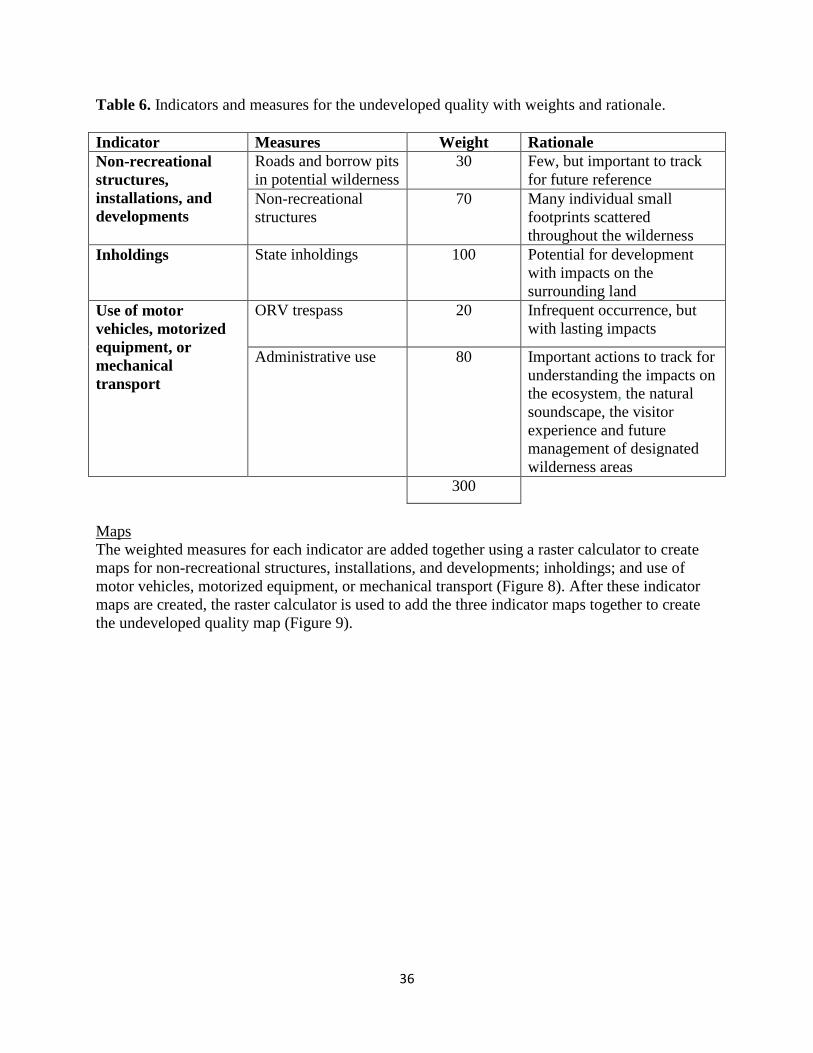
Table 6. Indicators and measures for the undeveloped quality with weights and rationale. ........ 36
Table 7. Naismith’s Rule expressed in the Vertical Relative Moving Angle field. ..................... 43
Table 8. Human features impacting viewshed. ............................................................................ 44
Table 9. Solitude and primitive and unconfined quality datasets. ............................................... 48
Table 10. Indicators and measures for the solitude and primitive and unconfined recreation
quality with weights and rationale. ........................................................................................ 52
Table 11. Other features of value quality datasets. ...................................................................... 57
Table 12. Indicators and measures for the other features of value quality with weights and
rationale ................................................................................................................................. 58
10
INTRODUCTION
The 1964 Wilderness Act (Public Law 88-577) established the National Wilderness Preservation
System “for the protection of these areas, the preservation of their wilderness character” (Section
2a). In congressional testimony clarifying the intent of wilderness designation, Zahniser (1962)
said, “The purpose of the Wilderness Act is to preserve the wilderness character of the areas to
be included in the wilderness system, not to establish any particular use,” and legal scholars
(Rohlf and Honnold 1988, McCloskey 1999) subsequently confirmed that preserving wilderness
character is the Act’s primary legal mandate. Further, the policies of all four agencies that
manage wilderness state that they are to preserve wilderness character in all areas designated as
wilderness. For the purpose of wilderness stewardship, a tangible definition of wilderness
character was developed (Landres et al. 2005, Landres et al. 2008).
As described in these publications, wilderness character is an inherent part of an entire
wilderness and varies across a landscape just as landscape features vary from one place to the
next. Wilderness attributes have been previously mapped at a variety of different scales: globally
(Sanderson et al. 2002), continentally (Carver 2010), nationally (Aplet et al. 2000), and locally
(Carver et al. 2008), depicting how these attributes vary across the wilderness continuum from
least to most wild. In the United States, however, a spatially explicit description of wilderness
character for all land falling within a designated wilderness area had not been previously
attempted.
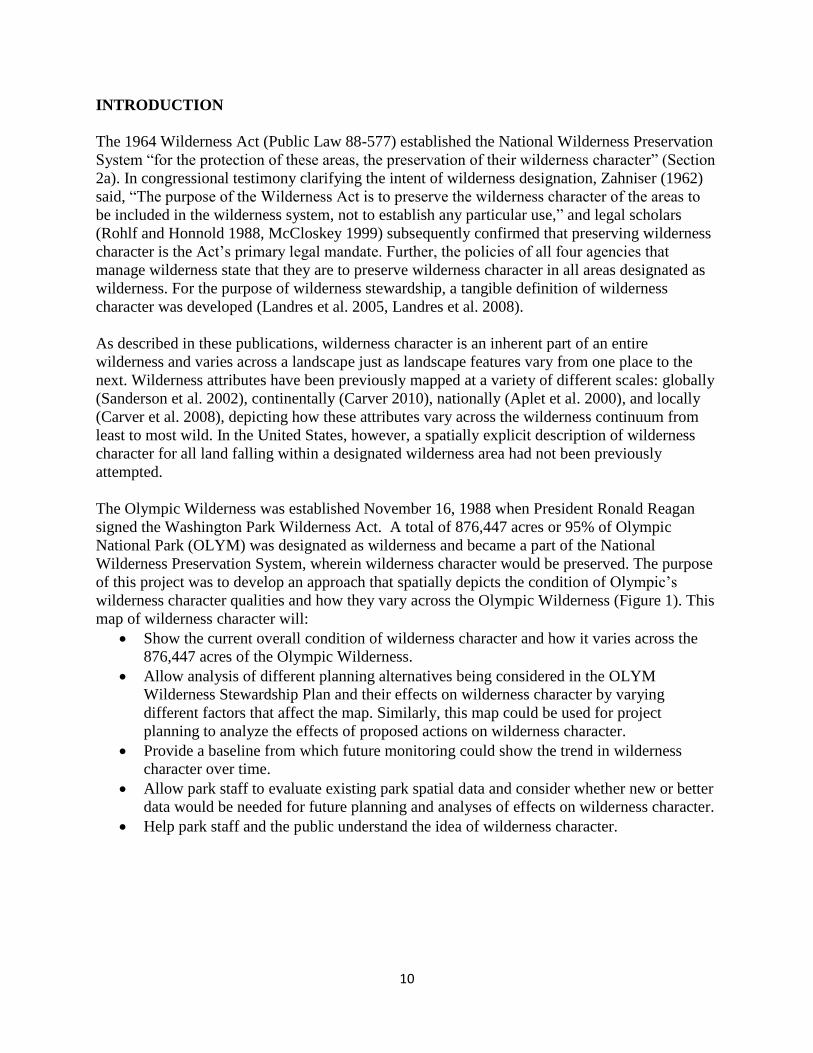
The Olympic Wilderness was established November 16, 1988 when President Ronald Reagan
signed the Washington Park Wilderness Act. A total of 876,447 acres or 95% of Olympic
National Park (OLYM) was designated as wilderness and became a part of the National
Wilderness Preservation System, wherein wilderness character would be preserved. The purpose
of this project was to develop an approach that spatially depicts the condition of Olympic’s
wilderness character qualities and how they vary across the Olympic Wilderness (Figure 1). This
map of wilderness character will:
Show the current overall condition of wilderness character and how it varies across the
876,447 acres of the Olympic Wilderness.
Allow analysis of different planning alternatives being considered in the OLYM
Wilderness Stewardship Plan and their effects on wilderness character by varying
different factors that affect the map. Similarly, this map could be used for project
planning to analyze the effects of proposed actions on wilderness character.
Provide a baseline from which future monitoring could show the trend in wilderness
character over time.
Allow park staff to evaluate existing park spatial data and consider whether new or better
data would be needed for future planning and analyses of effects on wilderness character.
Help park staff and the public understand the idea of wilderness character.
11
Figure 1. Olympic National Park.
12
In addition to the five primary benefits described above, other potential benefits of the
wilderness character map include identifying specific areas where actions could be taken inside
the wilderness to improve wilderness character, or areas where actions should not be taken
because they would degrade wilderness character. The map would also help identify specific
areas outside the wilderness where actions taken there might pose a substantial risk of degrading
wilderness character inside wilderness.
There are a number of concerns and cautions about producing the wilderness character map.
Specific cautions are described under each of the measures. Major cautions about this overall
effort include:
Creating sacrifice zones - the map may facilitate inappropriate creation of “sacrifice
zones” within the wilderness, directly contravening Congressional and agency mandates
to preserve wilderness character across an entire wilderness. For example, if the map
shows that some areas are “better” or of “higher quality” than others, the tendency may
be to focus efforts on preserving wilderness character only in these specific areas while
allowing wilderness character to degrade in “lower quality” areas. By showing the
current condition of wilderness character and how it varies across the entire wilderness,
the intent of the map is to help staff maintain high quality areas while raising the quality
of wilderness character in other areas.
Comparing the condition of wilderness character between wildernesses - the map may
facilitate inappropriate comparison of wilderness character among different wildernesses,
as this approach is being repeated for other wilderness areas. The maps will show the
current status or trend of wilderness character in different colors, and it will be easy for
users to compare the quantity of a given color among different wildernesses. Comparing
these maps among different wildernesses, however, is neither valid nor appropriate
because each map is built with data from the unique context of a particular wilderness.
Assuming that the resulting maps accurately and precisely describe wilderness character
- the variety of map products can be misconstrued as an accurate and precise description
of wilderness character. These maps are instead only an estimate of selected aspects of
wilderness character for which spatial data were available for this particular wilderness.
Map products are therefore a representation of wilderness character. In addition, these
maps do not portray in any way the symbolic, intangible, spiritual, or experiential values
of wilderness character. In short, while these maps are useful for the purposes described
in this report, they do not describe the complexity, richness, or depth of wilderness
character.
Comparing wilderness character map products over time may be difficult – the map is a
product of the spatial datasets that are available the time the map is created. Future
datasets may be more effective in representing impacts to wilderness character but the
resulting map products may not then be comparable to the current map. In addition, the
rationale for assigning degradation values to measures may change over time. The
rationale used in making decisions for the current map is based on the working group’s
experience and understanding of a specific impact. This experience and understanding
will change over time, especially because of staff turnover, potentially affecting the
rationale used in making these decisions.
13
A team approach was used to develop the wilderness character map for the Olympic Wilderness,
tapping the experience and knowledge of the staff that work at the park. Together, this team has
approximately 92 person-years of on-the-ground experience in the Olympic Wilderness. The
team conducted two face-to-face meetings and had several phone and email conversations in
developing the map products described in this report. All decisions about developing the map
were made by team consensus.
This report provides an in-depth discussion of how the wilderness character map was developed.
It is divided into three major sections:
Overview of developing the wilderness character map – describes the conceptual
foundation for how the map was developed.
Methods – describes the measures used to represent the degradation of wilderness
character, along with the data sources utilized, data processing, rationale for weighting,
and cautions when interpreting results.
The wilderness character map – discusses some of the patterns revealed in the wilderness
character map, approaches to improving map development, and final concerns about the
overall process.
14
OVERVIEW OF WILDERNESS CHARACTER MAP DEVELOPMENT
Our objective is to develop a GIS-based approach to spatially depict the quality of wilderness
character in the Olympic Wilderness1. The interagency strategy for monitoring wilderness
character, as described in Keeping it Wild (Landres et al. 2008), is used as the basis for
developing this approach. This document identifies four qualities of wilderness character that
apply uniquely to every wilderness: natural, untrammeled, undeveloped, and opportunities for
solitude or a primitive and unconfined type of recreation, as well as a set of indicators2 and
measures3 to evaluate their condition. In addition to these four qualities, a fifth quality is used,
called other features of value, based on the last clause of Section 2(c) in the 1964 Wilderness
Act, that a wilderness “may also contain ecological, geological, or other features of scientific,
educational, scenic or historical value.” (Landres et al. 2012)
Spatial datasets, which are obtained from a variety of sources, are processed into measures, i.e.
raw data is converted into a standardized project-specific format, and assigned and weighted
under an appropriate indicator. The indicators for each quality are combined together to produce
a map for the condition of that quality, and the five maps, one for each quality, are in turn
combined to create an overall map of the current condition of wilderness character in OLYM
(Figure 2).
A total of 80 datasets4 are used for delineating wilderness character in OLYM and comprise
local, regional, and national spatial data at varying scales, accuracy, and completeness (as is
often the case with geospatial datasets). This variation may reduce the integrity of the map
products, however, initial dataset quality is identified and recorded, and as improved data
become available these can replace older data. This procedure builds in flexibility and
adaptability to differences for data quality and availability.
The datasets from the various sources are processed, converted to raster grids5, and standardized
6
into measures. These represent features, conditions, and actions that degrade the quality of
wilderness character. Maps of the OLYM wilderness begin from a baseline condition of optimal
wilderness character and measures record where each quality has been degraded. For example,
the exotic species measure records (under the plant and animal species and communities
indicator) where the natural quality has been degraded. Each measure is formatted to depict the
spatial extent of degradation on a standardized scale. Creating a standardized range of values for
all measures allows them to be evaluated together on a common relative scale (Carver et al.
2008). For example, the soundscape and air quality maps are each depicted using different units
of measure (decibel vs. parts per billion), and so cannot be directly compared without
1 The analysis was run for the entire park, and the non-wilderness areas where clipped out of the final results.
2 Indicators are distinct and important elements within each quality of wilderness character, which have measurable
attributes that can be the focus of wilderness character monitoring efforts. 3 Measures are a specific tangible aspect of an indicator that can be measured to gain insight into the status of the
indicator, and assess trends over time. 4 This total is smaller than the sum of the data sources in Figure 2 because some datasets are used to map wilderness
character for more than one quality. 5 Raster data type consists of rows and columns of cells, with each cell storing a single value.
6 Standardization of measures is achieved using a linear rescaling of the input values (slicing) onto a 0-255 scale on
an equal interval basis
15
Figure 2. Flow chart for developing the wilderness character map.
16
standardization. Higher values of standardized measures represent “degraded” conditions and
lower values represent “optimal” conditions (or in as good a condition as can be expected).
Lastly, the standardized values of certain measures were adjusted based on OLYM staff input in
order to acknowledge additional factors influencing the particular measure – these exceptions
are described in the methods section.
The resolution of measures are set at 30 m, albeit some datasets such as air quality and
soundscape have a significantly lower native resolution. Although using a 30 x 30 m pixel size
may be deemed too coarse for many features in OLYM (e.g. trails, campsites), the sheer size of
the OLYM wilderness means that choosing a lower resolution would make these features
impossible to see when viewing the wilderness character maps in their entirety.
A hierarchical framework of wilderness character qualities, indicators and measures taken from
Keeping it Wild (Landres et al. 2008), is used to sort each measure under its appropriate
wilderness character quality. For example, under the natural quality of wilderness character,
exotic species informs the measure “abundance, distribution and, or number of invasive non-
indigenous species” of the “plant and animal species communities” indicator. The natural quality
also includes “physical resources” and “biophysical processes” indicators and related measures.
The values of the measures under each indicator are weighted using a weighting regime
determined by the OLYM staff. These weights reflect the importance of a measure in relation to
the others under a particular indicator. The weighted measures are added together to produce the
value of the indicator. The values for all the indicators are then added together under their
respective qualities to produce five maps showing the condition of each quality of wilderness
character. These five maps are then added together to produce a single map of wilderness
character for OLYM.
A number of cautions are presented for each measure in the methods section, which are
necessary for creating and interpreting the wilderness character maps. These cautions describe
and qualify the decisions made when formatting the datasets into measures and explain the
calibration of the parameters for the travel time and viewshed models.
17
METHODS
The five qualities of wilderness character are mapped using a combination of available datasets
and the latest GIS-based techniques. The maps are produced for all lands within the Olympic
National Park boundary with additional buffer zones extending beyond the park boundaries to 15
and 30 km respectively for running the travel time and viewshed models. These buffer zones are
necessary to account for edge effects7 from visible human features and points of access
immediately outside the park. The data sources, notes on processing, and associated cautions are
described for all the measures that inform the five wilderness qualities. Notes for relevant
technical GIS terms and processes are included as footnotes.
Selecting measures was an iterative, group decision-making process that began by first
identifying possible measures, then reviewing these for relevance to the indicator, and
determining data availability and data quality. In general, only measures that were relevant and
data that were available and of sufficient quality were included. However, some measures that
were important in OLYM had insufficient or non-existent data. OLYM staff acknowledged these
“missing” measures under each applicable indicator, and as data improves or becomes available,
the wilderness character map can be rerun to include these data.
A number of basic processing tasks are performed for datasets in ArcGIS before they can be used
as measures to create the wilderness character map. Values are assigned to the vector8 datasets to
represent their spatial impact in OLYM. These vectors are then converted to grids at 30 m
resolution, whereby their extent is represented by the above values and the rest of the park, not
represented by any vector datasets, is reclassed as 0. Some of the vector datasets may have a
range of values depending on the data they represent. For example, the measure “trails” has a
value of 1 for way trails, a value of 2 for primitive trails and a value of 3 for foot trails,
secondary trails, all-purpose trails and nature trails (to represent their respective impact on the
solitude and primitive and unconfined recreation quality), and the rest of the park is classed as 0.
The raster datasets retain their native resolution and are clipped at the park boundary. All the
grids are stretched to a standardized range of values and these measures are then projected in
ArcGIS using the NAD 1983 UTM Zone 10N coordinate system. Unless stated otherwise, all
point data, such as camp areas, were assumed to affect only the location of where those points
occur.
Each measure is “weighted” (or assigned a percentage) out of a total of 100 for each indicator to
reflect its importance in relation to other measures. For example, under the management
restrictions indicator, only a small percentage of wilderness visitors will use pack animals
(horses, mules, llamas, etc.). Therefore, the pack animal restrictions measure is assigned a weight
that is lower than the other two restrictions that may to review the map outputs, modifying the
weighting scheme as needed, and then rerunning and reviewing the maps until results are
satisfactory. Weights were also provided for “missing” measures should they become available
in the future. These weights, and their impact to existing measures weights, are indicated in
7 A problem created during spatial analysis, when patterns of interaction or interdependency across borders of the
bounded region are ignored or distorted (ESRI 2013). 8 Vector data type uses points and lines to represent features. Polygons are represented by boundaries.
18
brackets. All maps are displayed using the “minimum – maximum” stretch method9 unless
otherwise stated. The color ramp depicts areas of intact, high quality wilderness character as
green and degraded or deteriorated areas of wilderness character as brown.
Natural Quality
The natural quality defines wilderness as containing ecological systems that are substantially free
from the effects of modern civilization. This quality is degraded by the intended or unintended
effects of modern people on the ecological systems inside the wilderness since it was designated
(Landres et al. 2008).
Indicators and measures
Measures were selected for each of the three indicators recommended in Keeping it Wild
(Landres et al. 2008). The following indicators, with their measures and relevance to the natural
quality, were used:
Indicator: Plant and animal species and communities
Exotic species – this is a direct measure of the degradation of the natural quality because
the presence of these species is not natural to OLYM. Exotic species often displace native
species, damage native habitats, and or introduce diseases that would otherwise not occur
resulting in change to the natural environment.
Loss of habitat from trampling – this is a direct measure of the degradation of the natural
quality because presence of human caused bare ground contributes to loss of native
plants, compacted soil, erosion, exposed roots and introduction of non-native plants
resulting in a change to the natural environment. Presence of human caused trampling in
tidal areas contributes to loss of key intertidal species resulting in degradation to the
natural environment.
Loss of range for iconic species – this is a direct measure of the degradation of the natural
quality because loss of these native iconic species indicates changes in the natural system.
Vacant habitat of extirpated species – this is a direct measure of the degradation of the
natural quality because loss of these species affects the balance of the natural system.
Indicator: Physical resources
Air quality – this is a direct measure of the degradation of the natural quality because
polluted air has damaging effects on plants and animals thriving in the natural
environment.
Water quality – this is a direct measure of the degradation of the natural quality because
polluted water has damaging effects on plants and animals thriving in the natural
environment.
Indicator: Biophysical processes
Glacial retreat – this is a direct measure of the degradation of the natural quality because
loss of glaciers contributes to loss of water sources.
9 The stretch method defines the type of histogram stretching that will be applied to raster datasets to enhance their
appearance. The minimum – maximum stretch applies a linear stretch on the output minimum and output maximum
pixel values, which are used as endpoints for the histogram (ESRI Inc. 2008).
19
Boundary connectivity – this is a direct measure of the degradation of the natural quality
because of fragmentation or loss of connectivity between the wilderness and its
surrounding habitat.
Data sources, processing and cautions
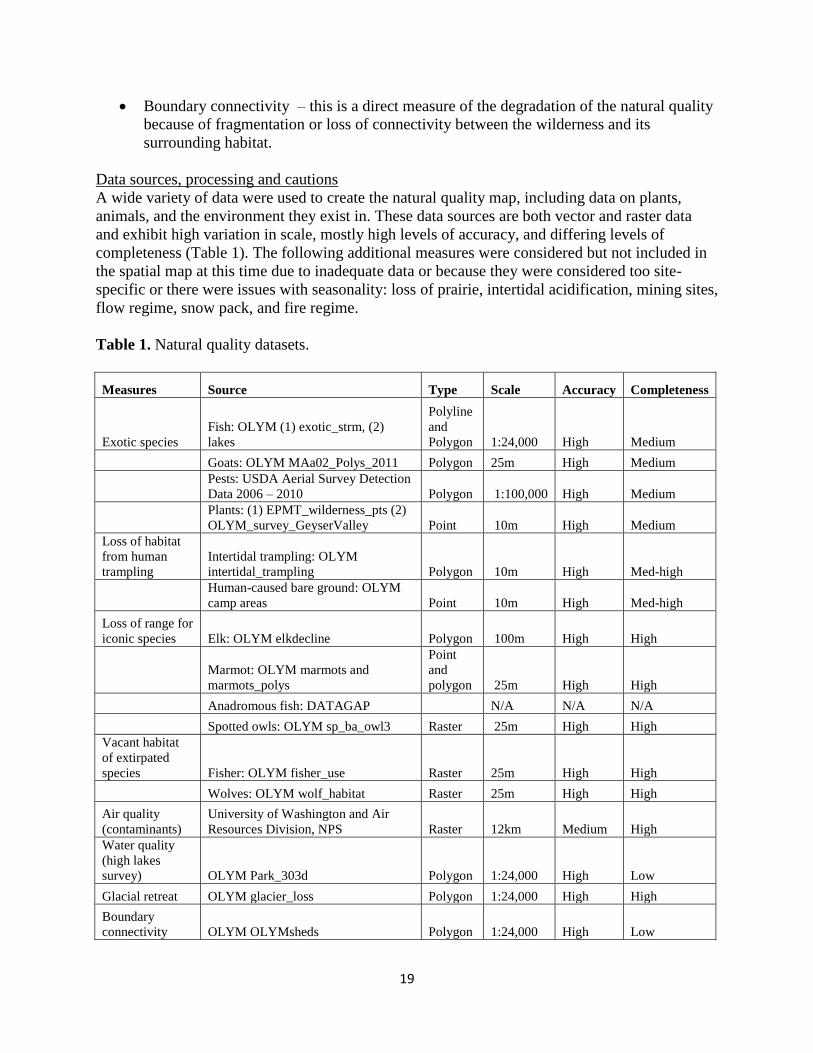
A wide variety of data were used to create the natural quality map, including data on plants,
animals, and the environment they exist in. These data sources are both vector and raster data
and exhibit high variation in scale, mostly high levels of accuracy, and differing levels of
completeness (Table 1). The following additional measures were considered but not included in
the spatial map at this time due to inadequate data or because they were considered too site-
specific or there were issues with seasonality: loss of prairie, intertidal acidification, mining sites,
flow regime, snow pack, and fire regime.
Table 1. Natural quality datasets.
Measures Source Type Scale Accuracy Completeness
Exotic species
Fish: OLYM (1) exotic_strm, (2)
lakes
Polyline
and
Polygon 1:24,000 High Medium
Goats: OLYM MAa02_Polys_2011 Polygon 25m High Medium
Pests: USDA Aerial Survey Detection
Data 2006 – 2010 Polygon 1:100,000 High Medium
Plants: (1) EPMT_wilderness_pts (2)
OLYM_survey_GeyserValley Point 10m High Medium
Loss of habitat
from human
trampling
Intertidal trampling: OLYM
intertidal_trampling Polygon 10m High Med-high
Human-caused bare ground: OLYM
camp areas Point 10m High Med-high
Loss of range for
iconic species Elk: OLYM elkdecline Polygon 100m High High
Marmot: OLYM marmots and
marmots_polys
Point
and
polygon 25m High High
Anadromous fish: DATAGAP
N/A N/A N/A
Spotted owls: OLYM sp_ba_owl3 Raster 25m High High
Vacant habitat
of extirpated
species Fisher: OLYM fisher_use Raster 25m High High
Wolves: OLYM wolf_habitat Raster 25m High High
Air quality
(contaminants)
University of Washington and Air
Resources Division, NPS Raster 12km Medium High
Water quality
(high lakes
survey) OLYM Park_303d Polygon 1:24,000 High Low
Glacial retreat OLYM glacier_loss Polygon 1:24,000 High High
Boundary
connectivity OLYM OLYMsheds Polygon 1:24,000 High Low
20
Exotic species – fish
Sources: Exotic streams polyline dataset created by Roger Hoffman, OLYM GIS
specialist, and OLYM lakes polygon dataset.
Processing: Queried OLYM lakes dataset for presence of exotic fish. Locations of rivers
and lakes with exotic fish are given a value of 1.
Cautions: Without surveying all the rivers in OLYM, it is difficult to know exactly which
rivers have exotics in them.
Exotic species – mountain goats
Sources: MAa02_Polys_2011 polygon dataset
Processing: The locations of goats in OLYM are ranked by density. The following values
are assigned in relation to the density ranking: Low = 1, Medium = 2, High = 3.
Cautions: None.
Exotic species – pests
Sources: USDA Aerial Survey Detection Data. Used 2006 – 2010 datasets to capture full
extent of pests in OLYM.
Processing: Queried datasets for all records of Balsam wooly adelgid. Created a simple
metric of severity. For branch infestation, values were assigned to the existing metric:
Low = 1, Medium = 2, High = 3. The severity of bole infestation is recorded as number
of trees killed per acre. The following ranges were used to assign values: 0 – 0.779 (Low)
= 1, 0.779 – 1.579 (Medium) = 2, 1.579 + (High) = 3. Then converted the shapefiles to
rasters and combined them using the MAX10
function.
Cautions: The survey methods for these datasets are prone to some subjectivity – see
aerial survey detection methods for more details.
Exotic species - plants
Sources: EPMT_wilderness_pts, OLYM_survey_GeyserValley
Processing: Queried EPMT database for presence of exotics. Locations for all exotic
plants occurring in OLYM are given a value of 1.
Cautions: Most exotic plant species are known to occur outside the wilderness boundary.
These areas are controlled to prevent exotic species from penetrating into the wilderness.
Other than a number of former homesteads, there are few known locations where exotic
species thrive within the wilderness. The park has not conducted a comprehensive
parkwide survey to locate all areas containing exotic plants.
Exotic species layers added together and sliced to 0-255
Loss of habitat from human trampling – intertidal trampling
Sources: OLYM polygon dataset
Processing: Locations of intertidal trampling occurring in OLYM are given a value of 1.
Cautions: None.
10
Uses multiple input rasters to determine the maximum on a cell-by-cell basis (ESRI Inc. 2008)
21
Loss of habitat from trampling – human-caused bare ground
Sources: OLYM Campareas point dataset
Processing: Used ‘SQ_FT_TL’ attribute, which records amount of bare ground per camp
site in square feet.
Cautions: There are many social trails that haven’t been captured - these should be
considered a DATAGAP.
Loss of habitat from trampling layers added together and sliced to 0-255
Loss of range for iconic species – Roosevelt elk
Sources: OLYM elk decline
Processing: Locations of elk decline occurring in OLYM are given a value of 1.
Cautions: None.
Loss of range for iconic species – Olympic marmot
Sources: OLYM marmots and marmots_polys
Processing: Joined marmots and marmots_polys datasets together using “Unit_Num’
field. Queried all complete surveys for abandoned sites. Locations of abandoned sites in
OLYM were given a value of 1.
Cautions: None.
Loss of range for iconic species – anadromous fish
Sources: DATAGAP - finding and assembling all available data on the historic ranges of
salmonids and current barriers to salmonids for the park was beyond the scope of this
project. This information could be used to show the reduction in range for salmon stocks
if it were available. Such an analysis would provide a valuable input to the natural
quality.
Processing: None.
Cautions: None.
Loss of range for iconic species – Northern spotted owls
Sources: OLYM sp_ba_owl3 raster dataset. This grid represents lost habitat in low
country from competing with barred owls on a scale of 1-5
Processing: Inverted grid.
Cautions: This dataset is a model of habitat occupancy and could be improved with better
distribution data.
Loss of range for iconic species layers added together and sliced to 0-255
Vacant habitat of extirpated species – fisher
Sources: OLYM fisher_use raster dataset. This grid has a range of values from 0 (no
restoration) – 14 (complete restoration).
Processing: Inverted the grid and removed NoData values. Because the status of fisher
reintroduction ranges from excellent to satisfactory, it was decided not to stretch the
values to 0-255. Instead, all standardized values higher than 54 were reclassed back to 54.
22
Cautions: Park staff expects this data to change with more information, as this project is
still in process.
Vacant habitat for extirpated species – wolves
Sources: OLYM wolves habitat raster dataset
Processing: Locations of extirpated wolves in OLYM were given a value of 1.
Cautions: None.
Vacant habitat species layers added together and sliced to 0-255
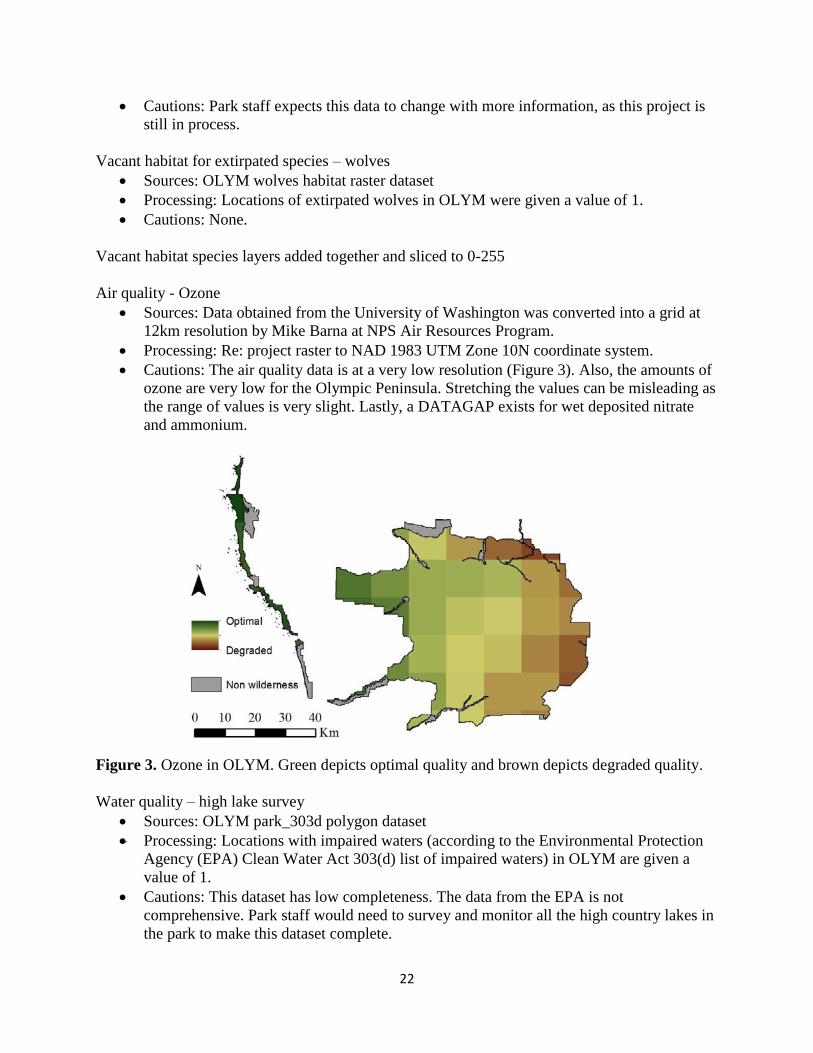
Air quality - Ozone
Sources: Data obtained from the University of Washington was converted into a grid at
12km resolution by Mike Barna at NPS Air Resources Program.
Processing: Re: project raster to NAD 1983 UTM Zone 10N coordinate system.
Cautions: The air quality data is at a very low resolution (Figure 3). Also, the amounts of
ozone are very low for the Olympic Peninsula. Stretching the values can be misleading as
the range of values is very slight. Lastly, a DATAGAP exists for wet deposited nitrate
and ammonium.
Figure 3. Ozone in OLYM. Green depicts optimal quality and brown depicts degraded quality.
Water quality – high lake survey
Sources: OLYM park_303d polygon dataset
Processing: Locations with impaired waters (according to the Environmental Protection
Agency (EPA) Clean Water Act 303(d) list of impaired waters) in OLYM are given a
value of 1.
Cautions: This dataset has low completeness. The data from the EPA is not
comprehensive. Park staff would need to survey and monitor all the high country lakes in
the park to make this dataset complete.
23
Glacial retreat
Sources: OLYM glacier loss polygon dataset . Depicts glacier loss from 1987 to 2009.
Processing: Locations of glacier loss occurring in OLYM are given a value of 1.
Cautions: Not all glacial retreat can be attributed to anthropogenic causes.
Boundary connectivity
Sources: OLYM watersheds polygon dataset. The flow of nutrients is disrupted in
drainages with dammed rivers.
Processing: Queried out drainages which have dams on rivers. The locations of these
drainages are given a value of one. This measure is divided by 4 to account for 3 missing
datasets – see Cautions.
Cautions: This measure is missing three additional inputs that would be important factors,
but would be time-consuming data to collect. The following are inputs that could be used
in the future to complete this measure: 1. Percentage of clear cuts within each watershed;
2. Number of roads and stream crossing within each watershed; and 3. Total number of
miles of roads per watershed.
Weighting
The first page of the methods section describes the underlying principle for using a weighting
system. A rationale is provided for the assigned weight of each measure (Table 2). The
“weighted” measures under each indicator total 100. In the future, should the data improve or
become available, existing and new measures can be added to a rerun of the wilderness character
map.
24
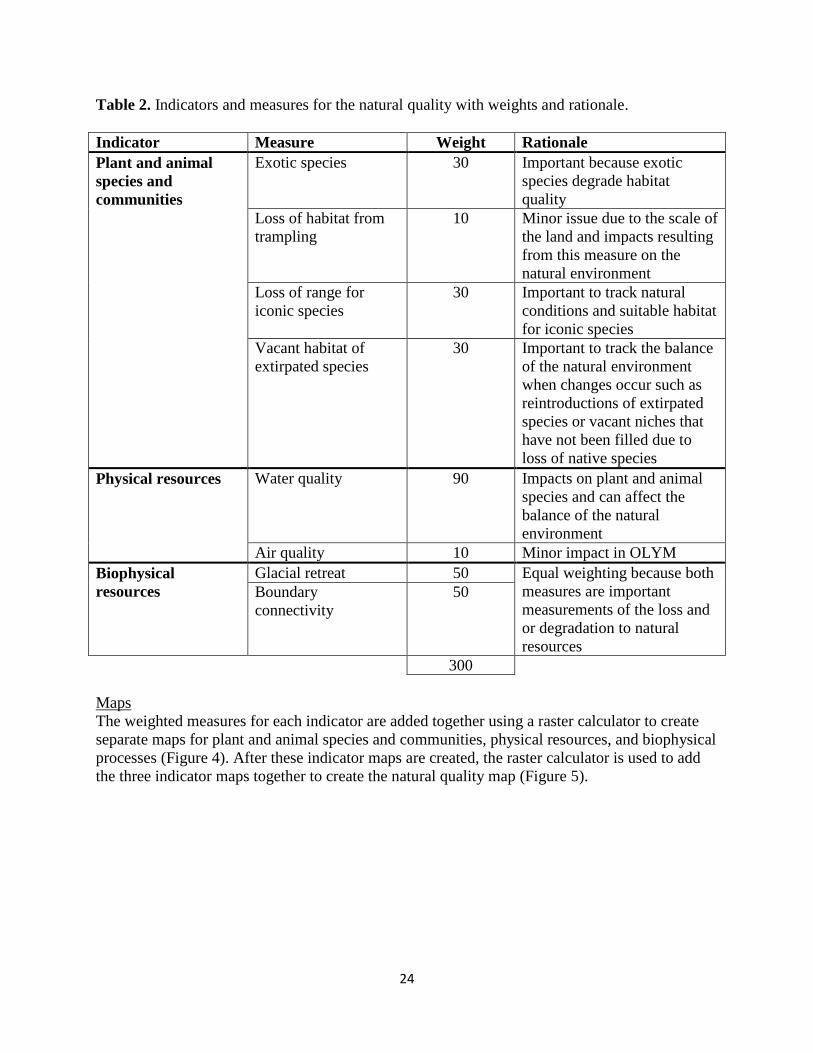
Table 2. Indicators and measures for the natural quality with weights and rationale.
Indicator Measure Weight Rationale
Plant and animal
species and
communities
Exotic species 30 Important because exotic
species degrade habitat
quality
Loss of habitat from
trampling
10 Minor issue due to the scale of
the land and impacts resulting
from this measure on the
natural environment
Loss of range for
iconic species
30 Important to track natural
conditions and suitable habitat
for iconic species
Vacant habitat of
extirpated species
30 Important to track the balance
of the natural environment
when changes occur such as
reintroductions of extirpated
species or vacant niches that
have not been filled due to
loss of native species
Physical resources Water quality 90 Impacts on plant and animal
species and can affect the
balance of the natural
environment
Air quality 10 Minor impact in OLYM
Biophysical
resources
Glacial retreat 50 Equal weighting because both
measures are important
measurements of the loss and
or degradation to natural
resources
Boundary
connectivity
50
300
Maps
The weighted measures for each indicator are added together using a raster calculator to create
separate maps for plant and animal species and communities, physical resources, and biophysical
processes (Figure 4). After these indicator maps are created, the raster calculator is used to add
the three indicator maps together to create the natural quality map (Figure 5).
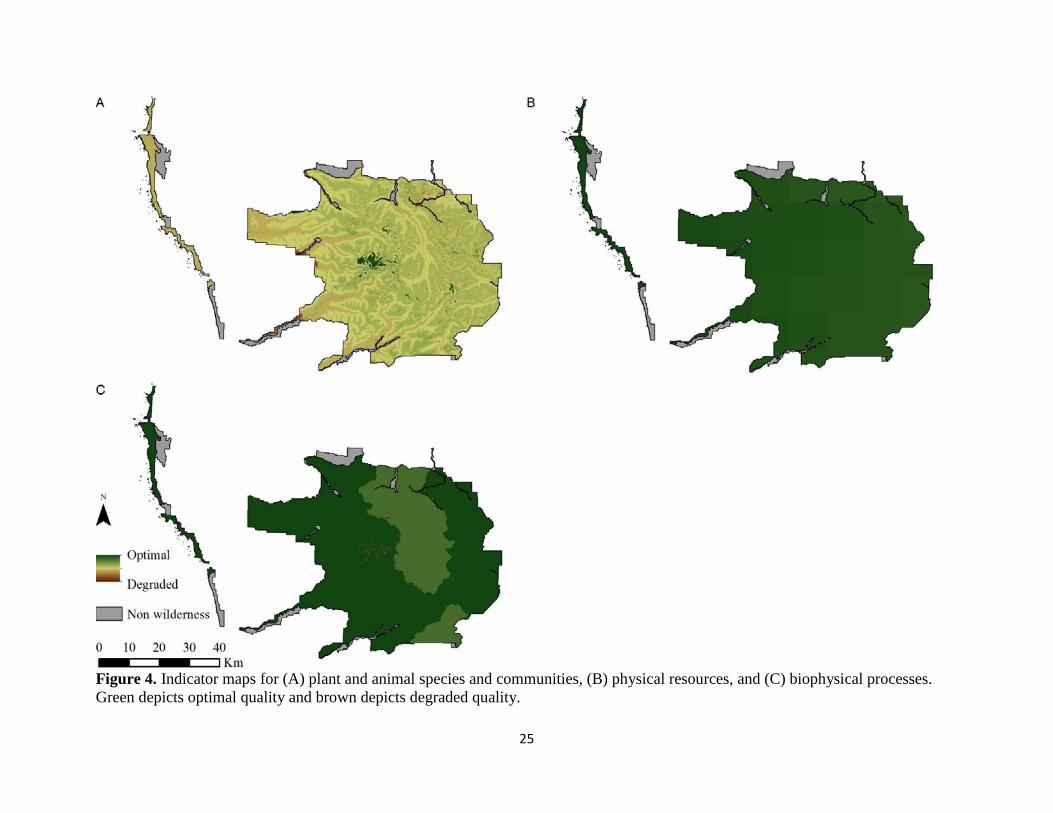
25
Figure 4. Indicator maps for (A) plant and animal species and communities, (B) physical resources, and (C) biophysical processes.
Green depicts optimal quality and brown depicts degraded quality.
26
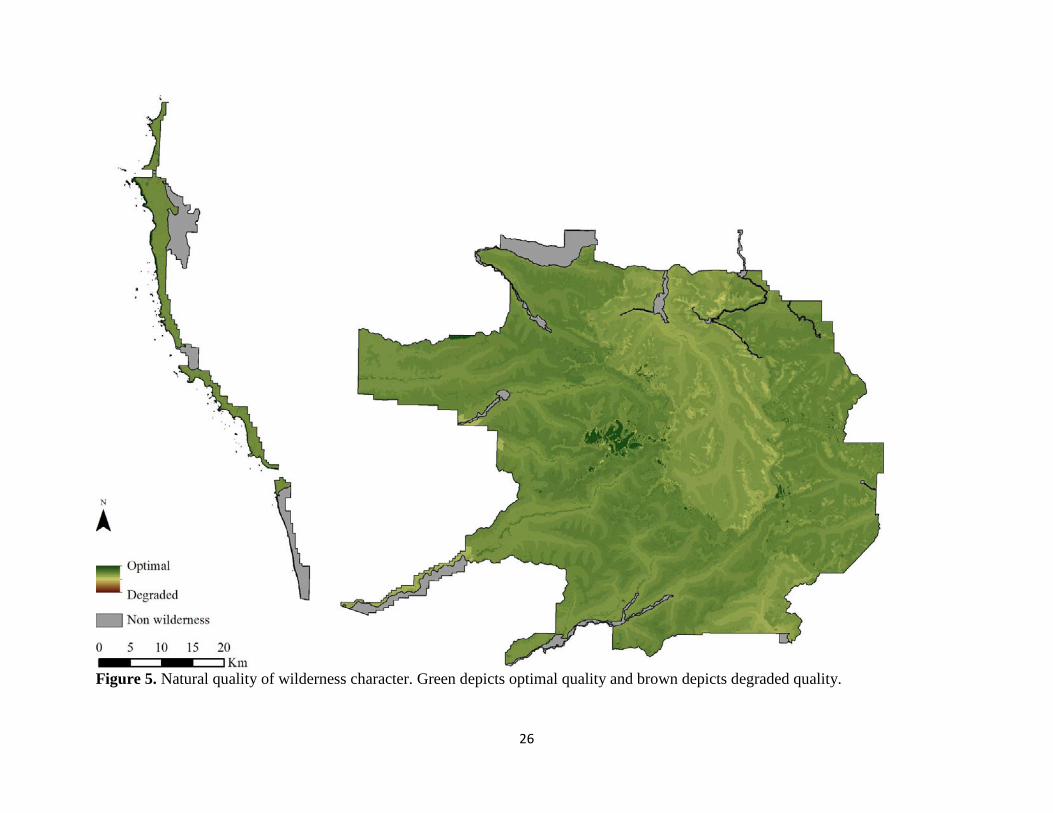
Figure 5. Natural quality of wilderness character. Green depicts optimal quality and brown depicts degraded quality.
27
Untrammeled Quality
The untrammeled quality defines wilderness as essentially unhindered and free from modern
human control or manipulation. The untrammeled quality is degraded by actions that
intentionally manipulate or control ecological systems, whereas the natural quality is degraded
by the intentional and unintentional effects from actions taken inside wilderness, as well as from
external forces on these systems (Landres et al. 2008).
There are important temporal questions to consider when developing a map of this quality. When
possible OLYM staff decided that the baseline for including management actions would go back
5 years from the present time, 2012. When this was not possible, the most recent complete
dataset were used. For example, the park needed to go as far back as 10 years to obtain complete
data for much of the camping and trails information. This captures the spatial dimension of
actions that occurred in the past, however, the protocol in Keeping It Wild only counts actions
during the year in which they occur. Other parks may choose to follow this protocol or devise a
more appropriate method for counting management actions.
Indicators and measures
Measures were selected for each of the two indicators recommended in Keeping It Wild. The
following indicators, with their measures and relevance to the untrammeled quality, were used:
Indicator: Actions authorized by the Federal land manager that manipulate the biophysical
environment
Exotic species removals – this is a direct measure of the degradation of the untrammeled
quality because removing exotic species is a deliberate manipulation of the park's flora
and fauna.
Mechanical fuels treatments, prescribed fires – removing potential fuel loads and
intentional burning is a deliberate manipulation of the landscape degrading the
untrammeled quality.
Fire suppression zones – fire suppression is a deliberate manipulation to the natural
process, degrading the untrammeled quality.
Animal collaring/ marking/ implanting/ hazing – the act of capturing and
collaring/marking/implanting animals impacts the untrammeled quality.
Wildlife transportation, reintroduction – the methods and act of transplanting fish and
reintroducing mammals into the ecosystem degrades the untrammeled quality.
Rehabilitation (terrestrial) – manipulating the landscape degrades the untrammeled
quality.
Indicator: Actions not authorized by the Federal land manager that manipulate the biophysical
environment
Illegal taking (forest products and wildlife) – intentional taking of park resources
degrades the untrammeled quality.
28
Data sources, processing and cautions
The untrammeled quality map is composed of four measures (Table 3). Four additional
measures: fire suppression zones and poaching incidents, animal
collaring/marking/implanting/hazing, wildlife transportation and reintroduction, and other
agencies fisheries were identified but not included due to a lack of relevant data or data
sensitivity.
Table 3. Untrammeled quality datasets.
Measures Source Type Scale Accuracy Completeness
Exotic species
removals Fish: DATAGAP N/A N/A N/A N/A
Plants: EPMT_wilderness_pts Point 10m High High
Mechanical fuels
treatments,
prescribed fires Mechanical_tools Point 1:100,000 Medium High
Fire suppression
zones DATAGAP N/A N/A N/A N/A
Animal
collaring/marking/i
mplanting/hazing DATAGAP N/A N/A N/A N/A
Wildlife
transportation,
reintroduction Fish: DATAGAP N/A N/A N/A N/A
Mammals: DATAGAP N/A N/A N/A N/A
Rehab (Terrestrial) Reveg_areas Polygon 10m High High
Illegal taking
(forest products
and wildlife) Poaching_incidents_ Point 100m Low Low
Exotic species removal – fish
Sources: No significant removals during period.
Processing: None.
Cautions: None.
Exotic species removals – plants
Sources: EPMT_wilderness_pts point dataset.
Processing: Queried dataset for all removals. Locations of exotic plant removals
occurring in OLYM are given a value of 1.
Cautions: None.
Mechanical fuels treatments, prescribed fires
Sources: OLYM Mechanical_tools point dataset.
Processing: Queried dataset for all instances of trammels. The locations of mechanical
fuel treatments occurring in OLYM are given a value of 1.
Cautions: None.
29
Fire suppression zones
Sources: DATAGAP - there is very little data for this measure and any fires suppressed
in the last five years did not have much effect on the natural cycles.
Processing: None.
Cautions: None.
Animal collaring/marking/implanting/hazing
Sources: DATAGAP due to data sensitivity.
Processing: None.
Cautions: None.
Wildlife transportation, reintroduction - fish
Sources: No significant transplants during this period.
Processing: None.
Cautions: None.
Wildlife transportation, reintroduction – mammals
Sources: No significant transplants during this period.
Processing: None.
Cautions: None.
Rehabilitation (terrestrial)
Sources: OLYM Reveg_areas polygon dataset.
Processing: Locations of revegetation occurring in OLYM are given a value of 1.
Cautions: None.
Illegal taking (forest products and wildlife)
Sources: OLYM poaching_incidents point dataset.
Processing: Locations of all poaching incidents occurring in OLYM are given a value of
1.
Cautions: Dataset has both low accuracy and completeness.
Weighting
The first page of the methods section describes the underlying principle for using a weighting
system. A rationale is provided for the weight of each measure (Table 4). The first set of weights
equals 100 for those measures with data currently available. A second set is provided in brackets
for all measures, those with and without data. In the future, should the datagaps be filled with
improved or newly available data, these previously excluded measures can be added to a rerun of
the wilderness character map.
30
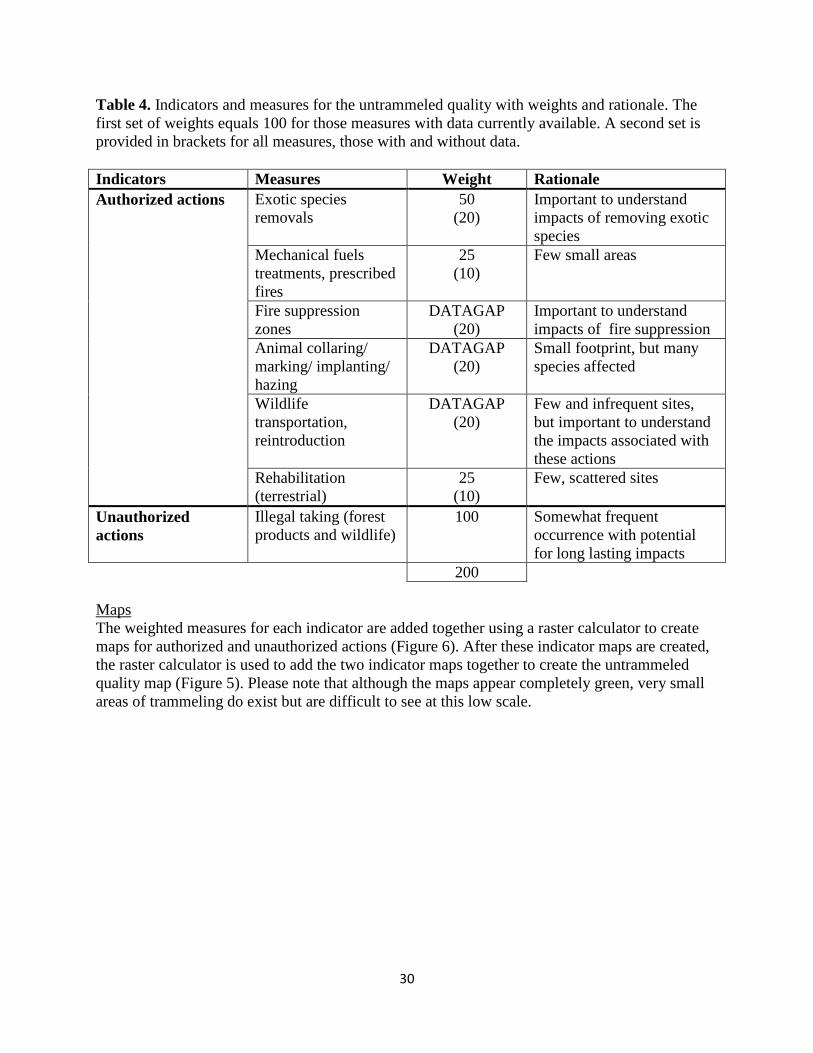
Table 4. Indicators and measures for the untrammeled quality with weights and rationale. The
first set of weights equals 100 for those measures with data currently available. A second set is
provided in brackets for all measures, those with and without data.
Indicators Measures Weight Rationale
Authorized actions Exotic species
removals
50
(20)
Important to understand
impacts of removing exotic
species
Mechanical fuels
treatments, prescribed
fires
25
(10)
Few small areas
Fire suppression
zones
DATAGAP
(20)
Important to understand
impacts of fire suppression
Animal collaring/
marking/ implanting/
hazing
DATAGAP
(20)
Small footprint, but many
species affected
Wildlife
transportation,
reintroduction
DATAGAP
(20)
Few and infrequent sites,
but important to understand
the impacts associated with
these actions
Rehabilitation
(terrestrial)
25
(10)
Few, scattered sites
Unauthorized
actions
Illegal taking (forest
products and wildlife)
100
Somewhat frequent
occurrence with potential
for long lasting impacts
200
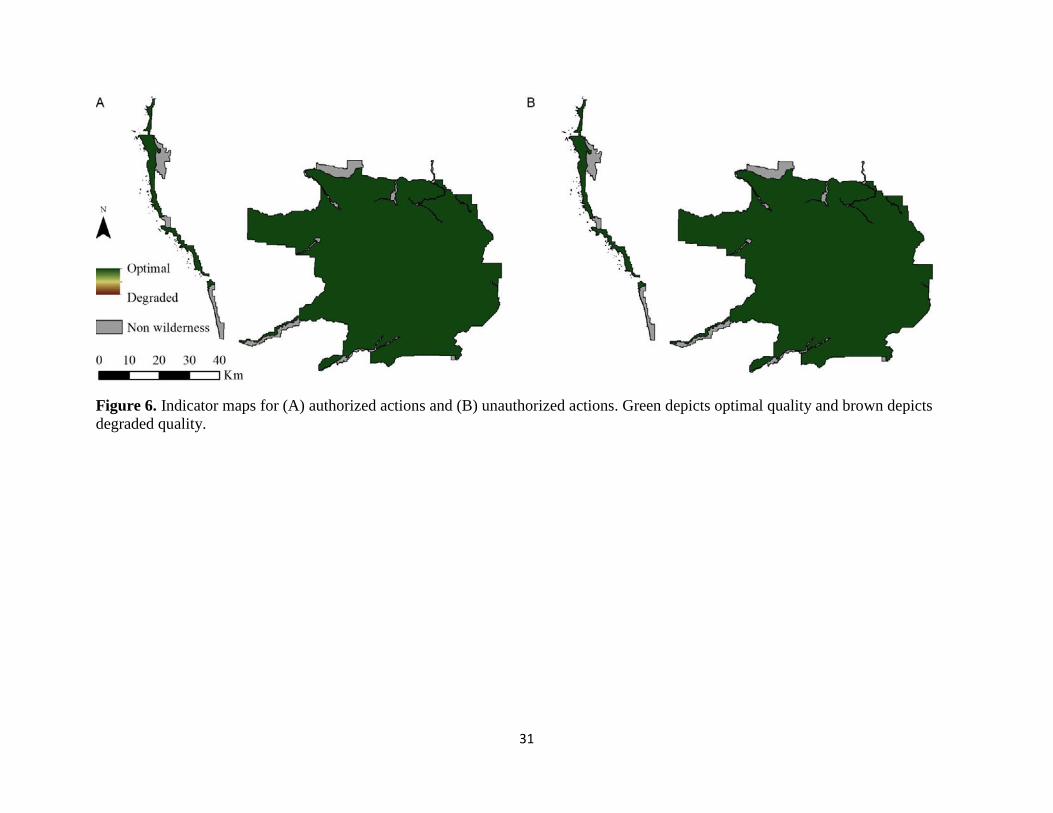
Maps
The weighted measures for each indicator are added together using a raster calculator to create
maps for authorized and unauthorized actions (Figure 6). After these indicator maps are created,
the raster calculator is used to add the two indicator maps together to create the untrammeled
quality map (Figure 5). Please note that although the maps appear completely green, very small
areas of trammeling do exist but are difficult to see at this low scale.
31
Figure 6. Indicator maps for (A) authorized actions and (B) unauthorized actions. Green depicts optimal quality and brown depicts
degraded quality.
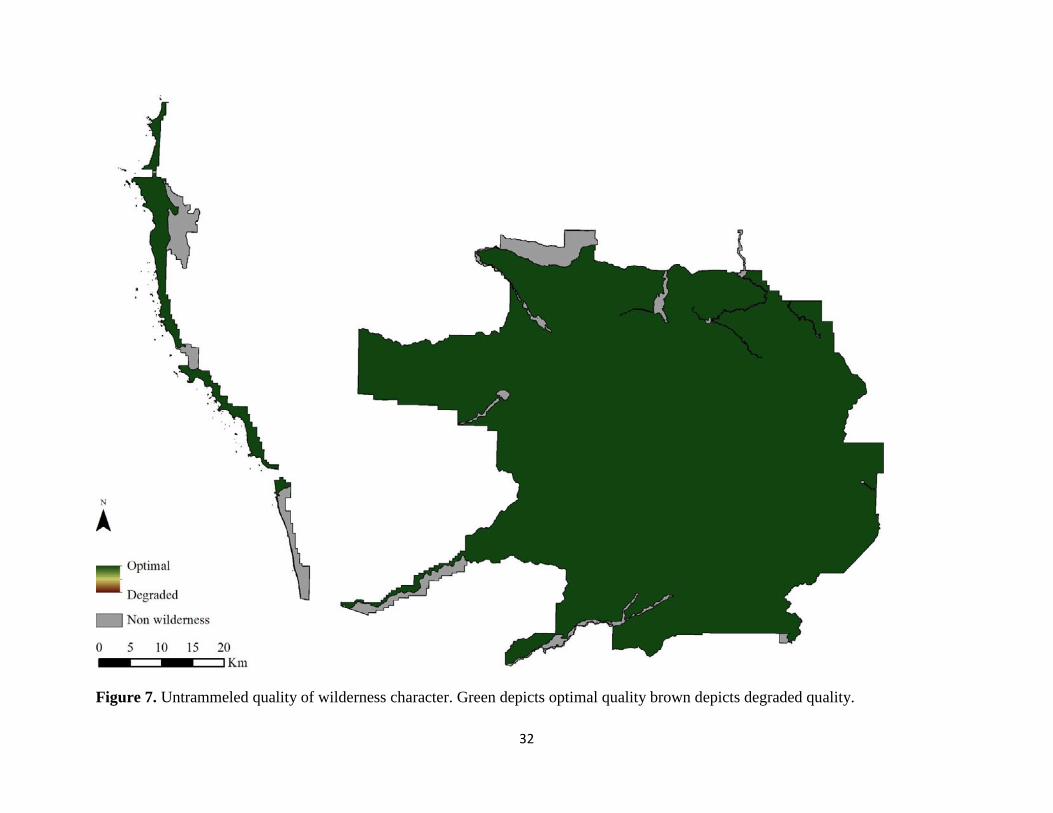
32
Figure 7. Untrammeled quality of wilderness character. Green depicts optimal quality brown depicts degraded quality.
33
Undeveloped Quality
The undeveloped quality defines wilderness as an area without permanent improvements or
modern human occupation. This quality is degraded by the presence of non-recreational
structures and installations, habitations, and by the use of motor vehicles, motorized equipment,
or mechanical transport, because these increase people’s ability to occupy or modify the
environment (Landres et al. 2008a).
Indicators and measures
Measures were selected for each of the three indicators recommended in Keeping It Wild. The
following indicators, with their measures and relevance to the undeveloped quality, were used:
Indicator: Non-recreational structures, installations, and developments
Roads and borrow pits in potential wilderness – roads and borrow pits are a sign of
modern human occupation, the presence of these structures degrades the undeveloped
quality.
Non-recreational structures and installations – old roads, temporary and permanent
structures and scientific installations in wilderness are a sign of modern human
occupation which degrades the undeveloped quality.
Indicator: Inholdings, lands not owned or that contain mineral rights not wholly owned by the
NPS. Such lands have the potential to be developed by non-NPS interests, which would degrade
the undeveloped quality, although the location and magnitude of such impacts are hard to
pinpoint because future development is speculative.
Inholdings (state) – state lands have the potential to be developed by non-NPS interests
which would degrade the undeveloped quality.
Indicator: Use of motor vehicles, motorized equipment, or mechanical transport
ORV trespass – unauthorized motorized vehicle trespass and use of motorized vehicles
degrades the undeveloped quality. These uses are often unknown activities that the park
has little control over.
Administrative uses – administrative use of motorized vehicles, motorized equipment and
mechanical transport (including aircraft) degrades the undeveloped quality. These are
actions permitted by the park - the park makes decisions about allowing or not allowing
these types of uses.
Data sources, processing and cautions
The undeveloped quality datasets are all vector data, of high scale, and generally of moderate to
high accuracy and completeness (Table 5).
34
Table 5. Undeveloped quality datasets.
Measures Source Type Scale Accuracy Completeness
Roads and borrow
pits in potential
wilderness(1) OLYM dp_road2 Polyline 1:6,000 High High
Non-recreational
structures
Administrative: OLYM (1)
buildings2011utm_pt, (2) repeaters, (3)
wolfcrk_peds, (4) wolfcrk_vaults Point 10m High Med - high
Scientific: OLYM (1) LTEM_WX, (2)
UNAVCO, (3) veg_plots, (4)
elk_exclosures, (5) high_lakes, (6)
tagged goat range, (7) tagged elk range
Point
and
polygon
10m-
100m High Med - high
Infrastructure: OLYM (1) landscapes,
(2) other_disturbed, (3) towers3d Polygon 10m High Med - high
Abandoned roads (old quarry &
logging roads): OLYM joe_creek Polygon 10m High Med - high
State inholdings OLYM state Polygon 1m High High
ORV trespass
OLYM (1) illegal_mechanical_use, (2)
illegal_mechanical_use_points
Point
and
polyline 1000m Medium Medium
Admin use
OLYM (1) mechanical_tools, (2)
helicopter_flight_paths, (3)
elk_flights_all, (4) goat_flights_2011,
(5) fisher_all, (6) SAR_2007
Point
and
polyline 10m High Medium
Roads and borrow pits in potential wilderness
Sources: OLYM dp_road2 polyline datasets
Processing: Locations of roads and borrow pits occurring in OLYM are given a value of
1.
Cautions: None.
Non-recreational structures – administrative
Sources: OLYM buildings2011utm_pt, repeaters (radio towers), wolfcrk_peds and
wolfcrk_vaults (electrical pedestals and vaults along the Wolf Creek trail), point datasets.
Processing: Locations of administrative structures occurring in OLYM are given a value
of 1. Layers added together and sliced
Cautions: None.
Non-recreational structures – scientific
Sources: OLYM LTEM_WX (permanent weather stations), UNAVCO (continuously
operating GPS stations) and veg_plots point datasets; and elk_exclosures, high_lakes
(those with scientific instruments installed), tagged elk range, and tagged goat range
polygon datasets.
Processing: Locations of scientific structures occurring in OLYM are given a value of 1.
Layers added together and sliced
Cautions: None.
35
Non-recreational structures – Infrastructure
Sources: OLYM landscapes and other_disturbed polygon datasets and towers3d point
dataset.
Processing: Locations of infrastructure occurring in OLYM are given a value of 1. Layers
added together and sliced
Cautions: None.
Non-recreational structures – abandoned roads
Sources: OLYM joe_creek polygon dataset
Processing: Locations of abandoned roads in OLYM are given a value of 1.
Cautions: None.
Non-recreational structures together and sliced to 0-255
Inholdings
Sources: OLYM state polygon dataset
Processing: Locations of state inholdings in OLYM are given a value of 1.
Cautions: None.
ORV trespass
Sources: OLYM illegal_mechanical_use polyline and illegal_mechanical_use_points
points dataset
Processing: Locations of illegal mechanical use in OLYM are given a value of 1. Layers
added together and sliced
Cautions: None.
Administrative uses
Sources: OLYM mechanical_tools point dataset; and helicopter_flight_paths,
elk_flights_all, goat_flights_2011, fisher_all, and SAR_2007 polyline dataset.
Processing: Locations of administrative use in OLYM are given a value of 1. For wildlife
surveys, the processed rasters were added together using weights (helicopter surveys
80%/fixed wing surveys 20%) to emphasize the greater noise impacts of the helicopter
surveys. Layers added together and sliced.
Cautions: SAR dataset is largely incomplete (only uses the SAR_2007 data).
Weighting
The first page of the methods section describes the underlying principle for using a weighting
system. A rationale is provided for the weight of each measure (Table 6). The “weighted”
measures under each indicator total 100.
36
Table 6. Indicators and measures for the undeveloped quality with weights and rationale.
Indicator Measures Weight Rationale
Non-recreational
structures,
installations, and
developments
Roads and borrow pits
in potential wilderness
30 Few, but important to track
for future reference
Non-recreational
structures
70 Many individual small
footprints scattered
throughout the wilderness
Inholdings State inholdings 100 Potential for development
with impacts on the
surrounding land
Use of motor
vehicles, motorized
equipment, or
mechanical
transport
ORV trespass 20 Infrequent occurrence, but
with lasting impacts
Administrative use 80 Important actions to track for
understanding the impacts on
the ecosystem, the natural
soundscape, the visitor
experience and future
management of designated
wilderness areas
300
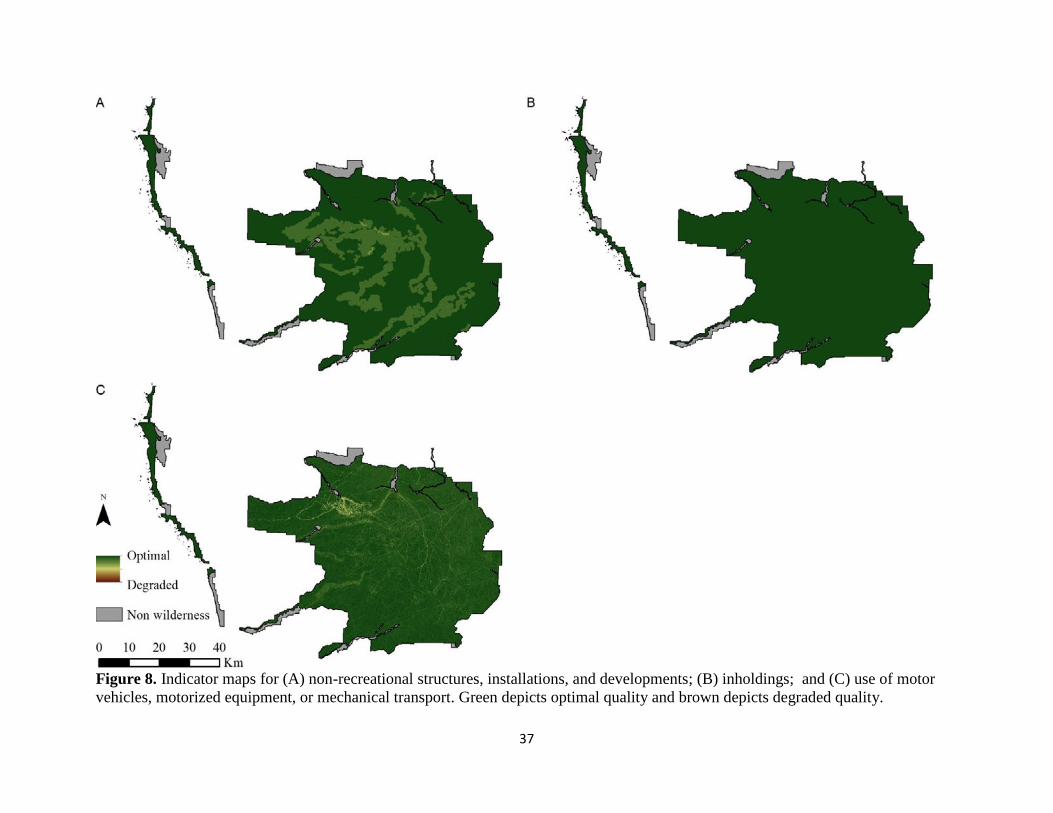
Maps
The weighted measures for each indicator are added together using a raster calculator to create
maps for non-recreational structures, installations, and developments; inholdings; and use of
motor vehicles, motorized equipment, or mechanical transport (Figure 8). After these indicator
maps are created, the raster calculator is used to add the three indicator maps together to create
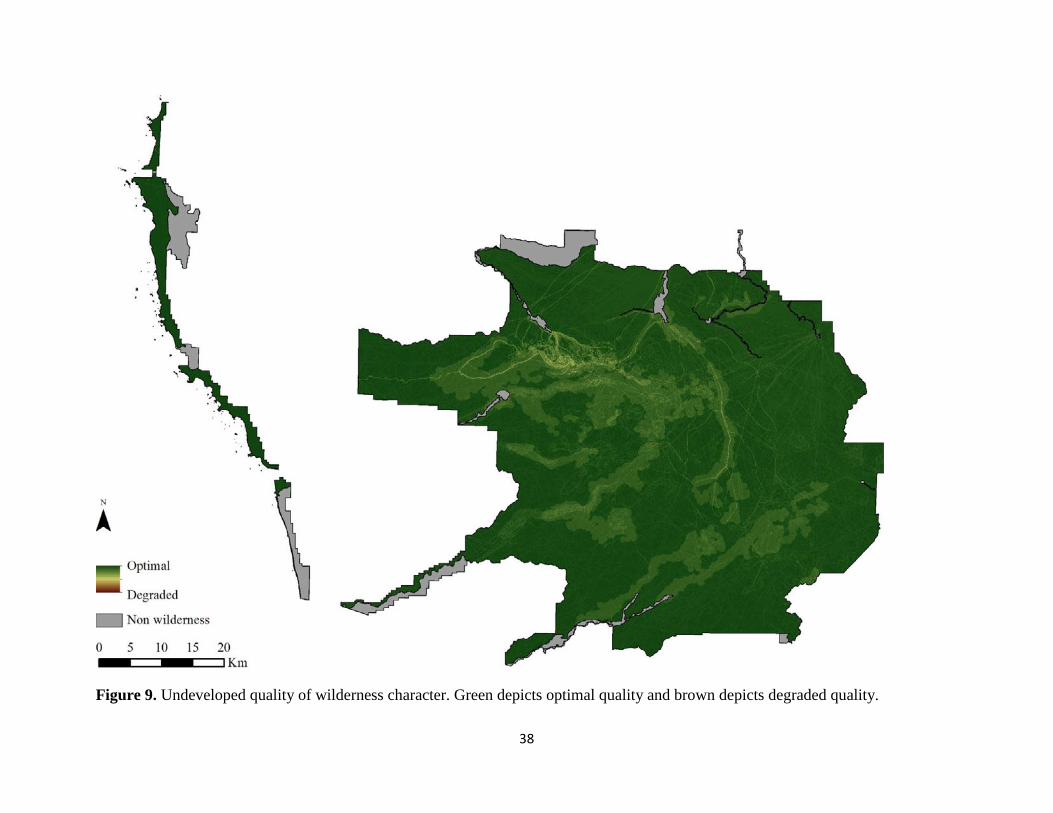
the undeveloped quality map (Figure 9).
37
Figure 8. Indicator maps for (A) non-recreational structures, installations, and developments; (B) inholdings; and (C) use of motor
vehicles, motorized equipment, or mechanical transport. Green depicts optimal quality and brown depicts degraded quality.
38
Figure 9. Undeveloped quality of wilderness character. Green depicts optimal quality and brown depicts degraded quality.
39
Solitude or Primitive and Unconfined Quality
The solitude or primitive and unconfined quality defines wilderness as containing outstanding
opportunities to experience solitude, remoteness, and primitive recreation free from the
constraints of modern society. This quality is degraded by settings that reduce these
opportunities, such as visitor encounters, signs of modern civilization, recreation facilities, and
management restriction on visitor behavior (Landres et al. 2008a).
Indicators and measures
Measures were selected for each of the four indicators recommended in Keeping It Wild. The
following indicators, with their measures and relevance to the solitude or primitive and
unconfined quality, were used:
Indicator: Remoteness from sights and sounds of people inside the wilderness
Travel time model – calculates the time it takes a person of average fitness to travel
across the landscape from various access points (paved roads), taking into account cost
surfaces11
(elevation and land cover) and barrier features (steep ground and water).
Viewshed model – calculates the line-of-sight impacts (using distance decay) of modern
human features both inside and outside the wilderness.
Trail encounters – a measure of human presence influencing the feeling of remoteness
which degrades the opportunity for solitude.
Year round visitor overnight use patterns – same measure as day use (trail encounters) -
however, overnight use patterns were weighted more because overnight users have higher
expectations of solitude in wilderness.
Human waste (designated camp areas without privies) – a measure of human presence
degrading the opportunity for solitude and primitive and unconfined recreation.
Indicator: Remoteness from occupied and modified areas outside the wilderness
Soundscape – measurement of human presence outside the wilderness degrading the
opportunity for solitude.
Nightsky – not enough data - but if data is found this would be a measure of the visual
loss of astronomical features - this loss degrades opportunities for remoteness, solitude,
and primitive recreation.
Air quality (particulates impacting visibility) – this would be a measure of air particulates
contributing to a loss of visual distant features of the landscape - impacts to visibility
degrades the opportunity for solitude and primitive recreation.
Indicator: Facilities that decrease self-reliant recreation
Trails – developed and maintained trails concentrate visitor use degrading the opportunity
for solitude.
Camp areas – the presence of designated camp areas concentrates visitor use degrading
the opportunity for solitude.
11
Cost surfaces are used in surface modeling to establish the impedance for crossing each individual cell in a grid.
40
Wireless coverage – this is non-NPS commercial use facility that was included because
of the proximity of this park to the greater Seattle area - hikers using cell phones in the
wilderness degrades the opportunity for solitude and decreases self-reliance.
Indicator: Management restrictions on visitor behavior
Access restrictions (group size, quota areas) – agency restrictions that inhibit free choice
and limit group size degrades the opportunity for unconfined recreation.
Use restrictions (designated camp sites/areas, food storage requirements, campfire
restrictions, blue bags, fishing and shellfish restrictions) – agency restrictions that modify
visitor behavior degrades the opportunity for unconfined recreation.
Pack animal restrictions – agency restrictions that dictate what type of pack animals are
allowed and where they can go degrades the opportunity for primitive and unconfined
recreation.
Travel time and viewshed modeling
Two models are employed to depict remoteness from the sights and sounds of people in
wilderness. The travel time model is used to delineate areas of OLYM that may be considered
more remote than others due to the considerable time and distance required to reach these places.
The viewshed model is used to delineate the line of sight impacts of modern human features
existing inside and outside wilderness. Both models use a variety of data at a higher resolution of
30 m for more precise analysis. This analysis is extended into a buffer zone 15 km outside the
wilderness boundary for the travel time model and up to 30 km for the viewshed model to allow
for edge effects occurring outside the park. These models analyze a variety of inputs, including
road networks, land cover, and all modern human developments occurring in and around the
park.
Travel time
Travel time is modeled in OLYM based on a GIS implementation of Naismith’s Rule12
, with
Langmuir’s correction13
. Terrain and land cover information are used to delineate the relative
time necessary to walk into a roadless area from the nearest point of legal motorized access
taking into account the effects of distance, relative slope, ground cover, and barrier features such
as very steep ground. The travel time (or “remoteness”) model, developed by Carver and Fritz
(1999), assumes a person can walk at a speed of 5 km/hr over flat terrain and adds a time penalty
of 30 minutes for every 300 m of ascent and 10 minutes for every 300 m of descent for slopes
greater than 12 degrees. When descending slopes between 5 and 12 degrees, a time bonus of 10
minutes is subtracted for every 300 m of descent. Slopes between 0 and 5 degrees are assumed to
be flat. Ancillary data layers are used to modify walking speeds according to ground cover (e.g.,
Naismith’s 5 km per hour on the map can be reduced to 1 km per hour or less when walking
12
Naismith’s Rule is a simple formula that helps to plan a hiking expedition by calculating how long it will take to
walk the route, including ascents. Devised by Scottish mountaineer, William Naismith, the basic rule states:
“Allow…an hour for every three miles on the map, with an additional hour for every 2,000 feet of ascent” (1892:
136). 13
Langmuir’s correction acknowledges the need to descend slowly in steep terrain as it is necessary to take shorter
steps, or reduce slope angle and extend path length by zig-zagging.
41
through dense vegetation). They also include barrier features that force a detour as “null”
values14
.
Sources: Calculating travel time based on Naismith’s rule requires a range of data
including a detailed terrain model, land cover data, and information on the location of
barrier features, roads, and other access features. The USGS 10 m Digital Elevation
Model (DEM), resampled to 30 m, provides terrain elevation data, the combined OLYM
species and USGS National GAP Land Cover data provide land cover data, and a number
of road datasets from OLYM, US Forest Service, and Washington Department of Natural
Resources are used to create the road classes. Additionally, OLYM dirt road, trail and
river datasets are used to supplement the land cover layer.
Processing: A macro program implementing the PATHDISTANCE function in ArcGIS
is used to model Naismith’s rule. This estimates walking speeds based on relative
horizontal and vertical moving angles across the terrain surface together with appropriate
cost or weight factors incurred by crossing different land cover types and the effects of
barrier features. The model is applied using the following conditions:
1. Source grid: This is the road network that provides vehicular access to the park.
2. Cost surface: Impedance values are assigned to the various land cover classes
when traveling off trail in OLYM (impedance are factors that inhibit travel). The
majority of forested areas and shrubland are estimated at 1 km/hr. Meadows,
heather and areas with permanent snow are estimated at 3 km/hr. Any developed
areas are assigned speeds of 5 km/hr (for a full list of land cover impendence
values that represent off-trail travel, see Appendix A). Additional features not
found in the land cover data are used to amend the base cost surface for a more
accurate depiction of the cost surface. Trails are overlaid onto the cost surface at
5km/hr, due to their low resistance to movement. Rivers are generally a time
consuming obstacle in OYLM and are programmed to take 15 minutes to cross.
3. Barriers to movement: These include the Dosewallips River (excluding two
known fording areas), all lakes and any areas where slope angles exceed 40
degrees.
The standardized travel time measure has been inverted to reflect high degradation of
solitude values near access points, and lower degradation further away from these
features (Figure 10).
Cautions: Naismiths’s Rule and the model used to implement it here assumes the person
“travelling the landscape” is a fit and healthy individual and does not make allowances
for load carried, weather conditions, or navigational skills. The model does, however,
take barrier features and conditions underfoot into account. Steep slopes are considered
impassable on foot and are included as barrier features by coding these as NoData (null
values) in the model inputs. This forces the model to seek a solution that involves
walking around the obstacle. The model also uses a cost or friction surface that controls
walking speed according to the land cover or conditions underfoot. A slow speed of 1
km/hr (0.278 m/s) is assumed for most land cover types in the park, but some areas are
14
NoData or null values in a raster grid contain no data and so are disregarded in most calculations unless the model
explicitly references these. NoData values are useful in building access models in that they can be used to describe
the location of barrier features that cannot be crossed.
42
easier to travel in, falling within a range of 3 – 5 km/hr (1.112 - 1.389 m/s). The angle at
which terrain is crossed (i.e., the horizontal and vertical relative moving angles15
) is used
to determine the relative slope and height lost/gained. These values are input into the
model using a simple lookup table as shown in Table 7. The paved road network, both
within and outside the OLYM boundary, is used as the access points from which to
calculate remoteness of non-road areas. The road network outside OLYM is included in
the analysis to avoid any possible edge effects in the travel time calculation.
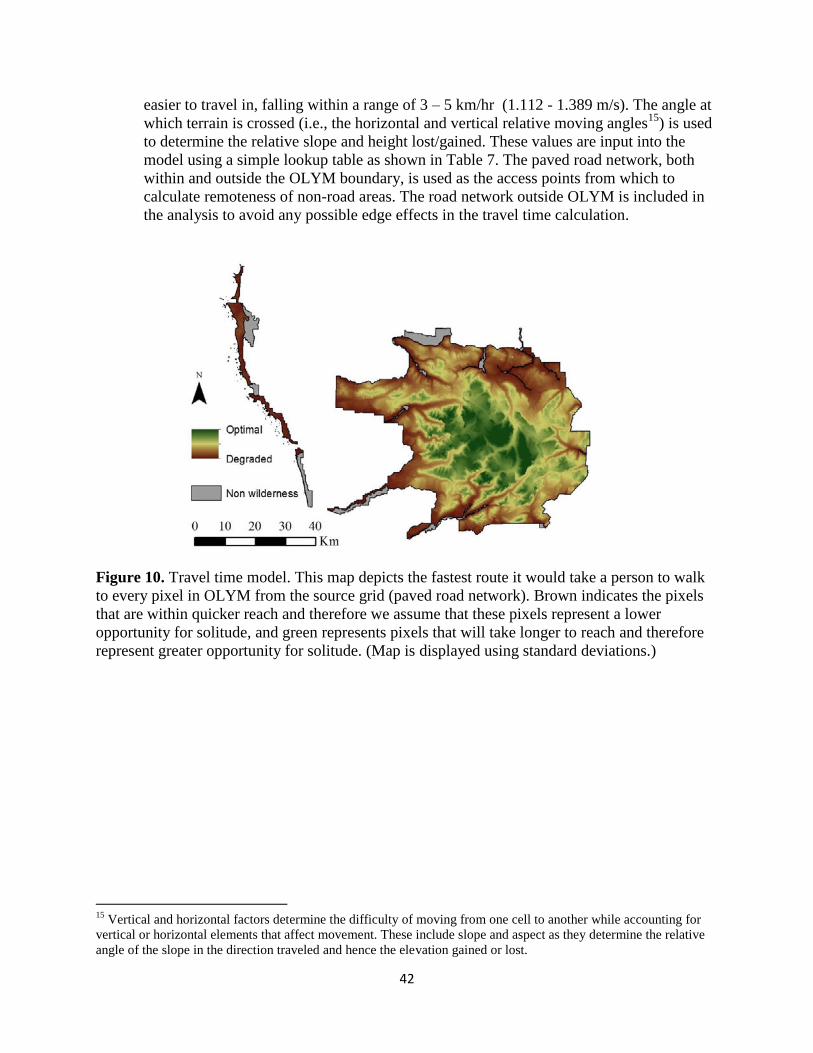
Figure 10. Travel time model. This map depicts the fastest route it would take a person to walk
to every pixel in OLYM from the source grid (paved road network). Brown indicates the pixels
that are within quicker reach and therefore we assume that these pixels represent a lower
opportunity for solitude, and green represents pixels that will take longer to reach and therefore
represent greater opportunity for solitude. (Map is displayed using standard deviations.)
15
Vertical and horizontal factors determine the difficulty of moving from one cell to another while accounting for
vertical or horizontal elements that affect movement. These include slope and aspect as they determine the relative
angle of the slope in the direction traveled and hence the elevation gained or lost.
43
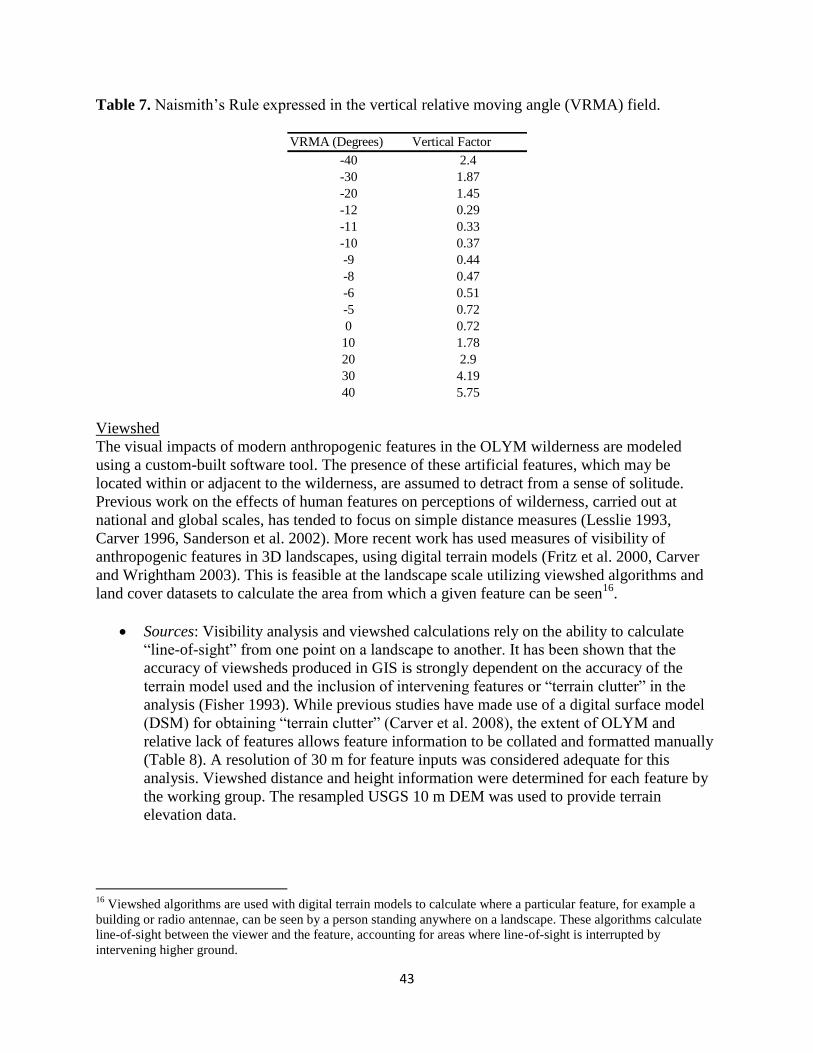
Table 7. Naismith’s Rule expressed in the vertical relative moving angle (VRMA) field.
VRMA (Degrees) Vertical Factor
-40 2.4
-30 1.87
-20 1.45
-12 0.29
-11 0.33
-10 0.37
-9 0.44
-8 0.47
-6 0.51
-5 0.72
0 0.72
10 1.78
20 2.9
30 4.19
40 5.75
Viewshed
The visual impacts of modern anthropogenic features in the OLYM wilderness are modeled
using a custom-built software tool. The presence of these artificial features, which may be
located within or adjacent to the wilderness, are assumed to detract from a sense of solitude.
Previous work on the effects of human features on perceptions of wilderness, carried out at
national and global scales, has tended to focus on simple distance measures (Lesslie 1993,
Carver 1996, Sanderson et al. 2002). More recent work has used measures of visibility of
anthropogenic features in 3D landscapes, using digital terrain models (Fritz et al. 2000, Carver
and Wrightham 2003). This is feasible at the landscape scale utilizing viewshed algorithms and
land cover datasets to calculate the area from which a given feature can be seen16
.
Sources: Visibility analysis and viewshed calculations rely on the ability to calculate
“line-of-sight” from one point on a landscape to another. It has been shown that the
accuracy of viewsheds produced in GIS is strongly dependent on the accuracy of the
terrain model used and the inclusion of intervening features or “terrain clutter” in the
analysis (Fisher 1993). While previous studies have made use of a digital surface model
(DSM) for obtaining “terrain clutter” (Carver et al. 2008), the extent of OLYM and
relative lack of features allows feature information to be collated and formatted manually
(Table 8). A resolution of 30 m for feature inputs was considered adequate for this
analysis. Viewshed distance and height information were determined for each feature by
the working group. The resampled USGS 10 m DEM was used to provide terrain
elevation data.
16
Viewshed algorithms are used with digital terrain models to calculate where a particular feature, for example a
building or radio antennae, can be seen by a person standing anywhere on a landscape. These algorithms calculate
line-of-sight between the viewer and the feature, accounting for areas where line-of-sight is interrupted by
intervening higher ground.
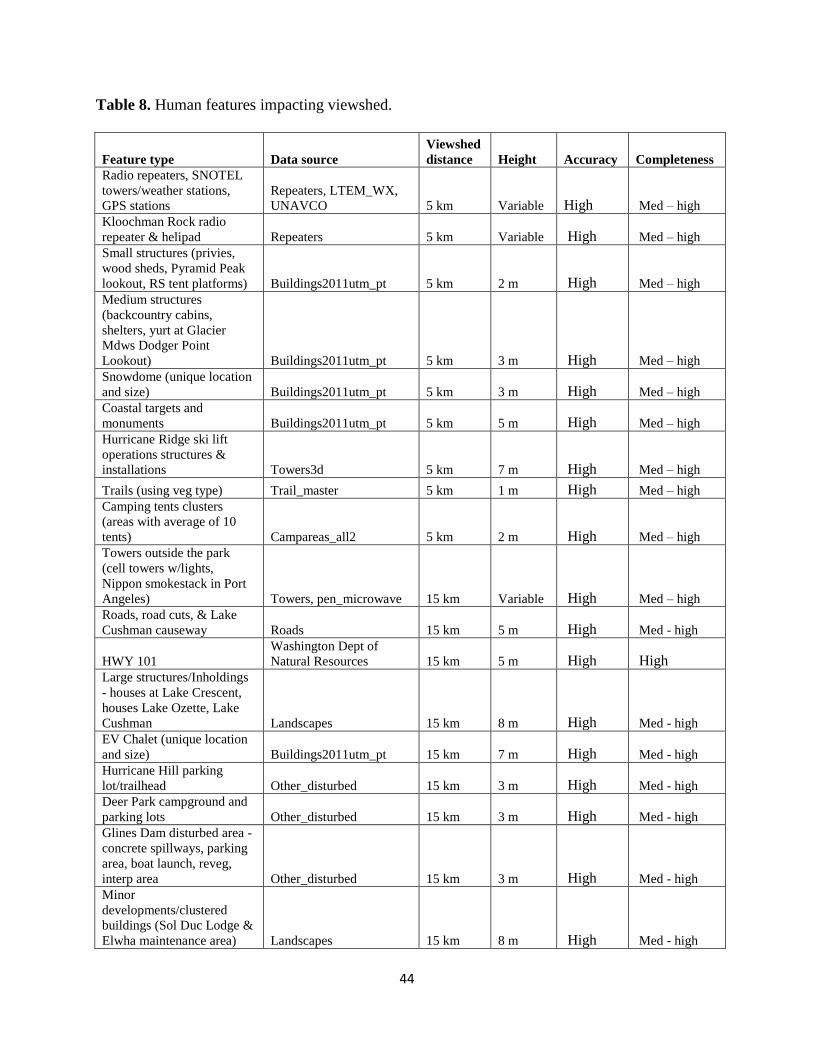
44
Table 8. Human features impacting viewshed.
Feature type Data source
Viewshed
distance Height Accuracy Completeness
Radio repeaters, SNOTEL
towers/weather stations,
GPS stations
Repeaters, LTEM_WX,
UNAVCO 5 km Variable High Med – high
Kloochman Rock radio
repeater & helipad Repeaters 5 km Variable High Med – high
Small structures (privies,
wood sheds, Pyramid Peak
lookout, RS tent platforms) Buildings2011utm_pt 5 km 2 m High Med – high
Medium structures
(backcountry cabins,
shelters, yurt at Glacier
Mdws Dodger Point
Lookout) Buildings2011utm_pt 5 km 3 m High Med – high
Snowdome (unique location
and size) Buildings2011utm_pt 5 km 3 m High Med – high
Coastal targets and
monuments Buildings2011utm_pt 5 km 5 m High Med – high
Hurricane Ridge ski lift
operations structures &
installations Towers3d 5 km 7 m High Med – high
Trails (using veg type) Trail_master 5 km 1 m High Med – high
Camping tents clusters
(areas with average of 10
tents) Campareas_all2 5 km 2 m High Med – high
Towers outside the park
(cell towers w/lights,
Nippon smokestack in Port
Angeles) Towers, pen_microwave 15 km Variable High Med – high
Roads, road cuts, & Lake
Cushman causeway Roads 15 km 5 m High Med - high
HWY 101
Washington Dept of
Natural Resources 15 km 5 m High High
Large structures/Inholdings
- houses at Lake Crescent,
houses Lake Ozette, Lake
Cushman Landscapes 15 km 8 m High Med - high
EV Chalet (unique location
and size) Buildings2011utm_pt 15 km 7 m High Med - high
Hurricane Hill parking
lot/trailhead Other_disturbed 15 km 3 m High Med - high
Deer Park campground and
parking lots Other_disturbed 15 km 3 m High Med - high
Glines Dam disturbed area -
concrete spillways, parking
area, boat launch, reveg,
interp area Other_disturbed 15 km 3 m High Med - high
Minor
developments/clustered
buildings (Sol Duc Lodge &
Elwha maintenance area) Landscapes 15 km 8 m High Med - high
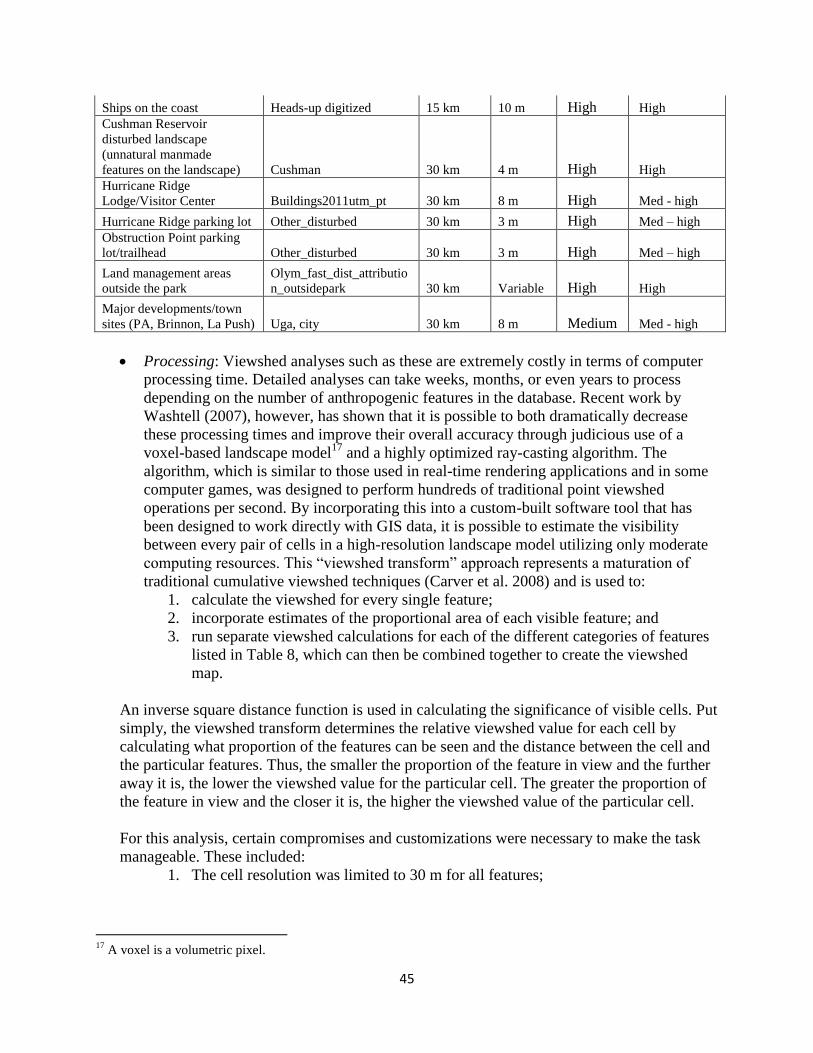
45
Ships on the coast Heads-up digitized 15 km 10 m High High
Cushman Reservoir
disturbed landscape
(unnatural manmade
features on the landscape) Cushman 30 km 4 m High High
Hurricane Ridge
Lodge/Visitor Center Buildings2011utm_pt 30 km 8 m High Med - high
Hurricane Ridge parking lot Other_disturbed 30 km 3 m High Med – high
Obstruction Point parking
lot/trailhead Other_disturbed 30 km 3 m High Med – high
Land management areas
outside the park
Olym_fast_dist_attributio
n_outsidepark 30 km Variable High High
Major developments/town
sites (PA, Brinnon, La Push) Uga, city 30 km 8 m Medium Med - high
Processing: Viewshed analyses such as these are extremely costly in terms of computer
processing time. Detailed analyses can take weeks, months, or even years to process
depending on the number of anthropogenic features in the database. Recent work by
Washtell (2007), however, has shown that it is possible to both dramatically decrease
these processing times and improve their overall accuracy through judicious use of a
voxel-based landscape model17
and a highly optimized ray-casting algorithm. The
algorithm, which is similar to those used in real-time rendering applications and in some
computer games, was designed to perform hundreds of traditional point viewshed
operations per second. By incorporating this into a custom-built software tool that has
been designed to work directly with GIS data, it is possible to estimate the visibility
between every pair of cells in a high-resolution landscape model utilizing only moderate
computing resources. This “viewshed transform” approach represents a maturation of
traditional cumulative viewshed techniques (Carver et al. 2008) and is used to:
1. calculate the viewshed for every single feature;
2. incorporate estimates of the proportional area of each visible feature; and
3. run separate viewshed calculations for each of the different categories of features
listed in Table 8, which can then be combined together to create the viewshed
map.
An inverse square distance function is used in calculating the significance of visible cells. Put
simply, the viewshed transform determines the relative viewshed value for each cell by
calculating what proportion of the features can be seen and the distance between the cell and
the particular features. Thus, the smaller the proportion of the feature in view and the further
away it is, the lower the viewshed value for the particular cell. The greater the proportion of
the feature in view and the closer it is, the higher the viewshed value of the particular cell.
For this analysis, certain compromises and customizations were necessary to make the task
manageable. These included:
1. The cell resolution was limited to 30 m for all features;
17
A voxel is a volumetric pixel.
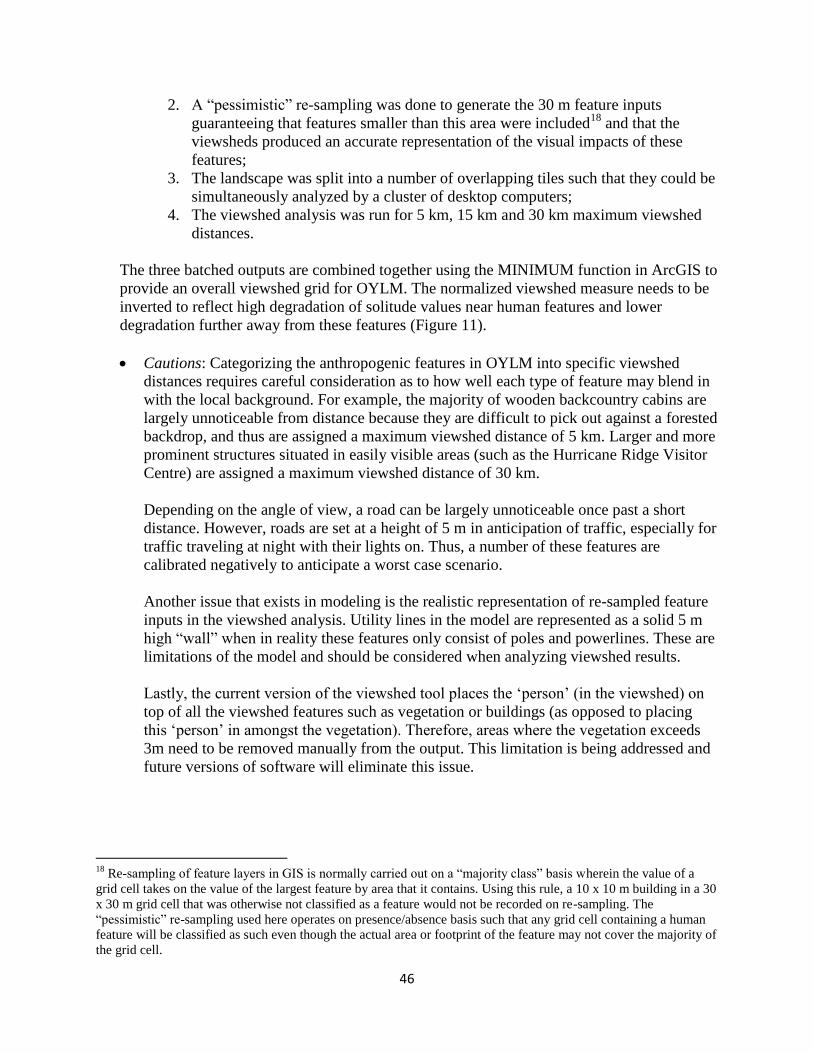
46
2. A “pessimistic” re-sampling was done to generate the 30 m feature inputs
guaranteeing that features smaller than this area were included18
and that the
viewsheds produced an accurate representation of the visual impacts of these
features;
3. The landscape was split into a number of overlapping tiles such that they could be
simultaneously analyzed by a cluster of desktop computers;
4. The viewshed analysis was run for 5 km, 15 km and 30 km maximum viewshed
distances.
The three batched outputs are combined together using the MINIMUM function in ArcGIS to
provide an overall viewshed grid for OYLM. The normalized viewshed measure needs to be
inverted to reflect high degradation of solitude values near human features and lower
degradation further away from these features (Figure 11).
Cautions: Categorizing the anthropogenic features in OYLM into specific viewshed
distances requires careful consideration as to how well each type of feature may blend in
with the local background. For example, the majority of wooden backcountry cabins are
largely unnoticeable from distance because they are difficult to pick out against a forested
backdrop, and thus are assigned a maximum viewshed distance of 5 km. Larger and more
prominent structures situated in easily visible areas (such as the Hurricane Ridge Visitor
Centre) are assigned a maximum viewshed distance of 30 km.
Depending on the angle of view, a road can be largely unnoticeable once past a short
distance. However, roads are set at a height of 5 m in anticipation of traffic, especially for
traffic traveling at night with their lights on. Thus, a number of these features are
calibrated negatively to anticipate a worst case scenario.
Another issue that exists in modeling is the realistic representation of re-sampled feature
inputs in the viewshed analysis. Utility lines in the model are represented as a solid 5 m
high “wall” when in reality these features only consist of poles and powerlines. These are
limitations of the model and should be considered when analyzing viewshed results.
Lastly, the current version of the viewshed tool places the ‘person’ (in the viewshed) on
top of all the viewshed features such as vegetation or buildings (as opposed to placing
this ‘person’ in amongst the vegetation). Therefore, areas where the vegetation exceeds
3m need to be removed manually from the output. This limitation is being addressed and
future versions of software will eliminate this issue.
18
Re-sampling of feature layers in GIS is normally carried out on a “majority class” basis wherein the value of a
grid cell takes on the value of the largest feature by area that it contains. Using this rule, a 10 x 10 m building in a 30
x 30 m grid cell that was otherwise not classified as a feature would not be recorded on re-sampling. The
“pessimistic” re-sampling used here operates on presence/absence basis such that any grid cell containing a human
feature will be classified as such even though the actual area or footprint of the feature may not cover the majority of
the grid cell.
47
Figure 11. Viewshed impacts in OLYM. Green depicts optimal quality viewshed and brown
depicts degraded quality viewshed.
Data sources, processing and cautions
A wide variety of data sources are used for the solitude or primitive and unconfined type of
recreation map (Table 9), which encompass a range of different scales, variability in accuracy
and completeness, and both vector and raster data. Two additional measures: visibility and night
sky were identified but not included due to a lack of relevant data.
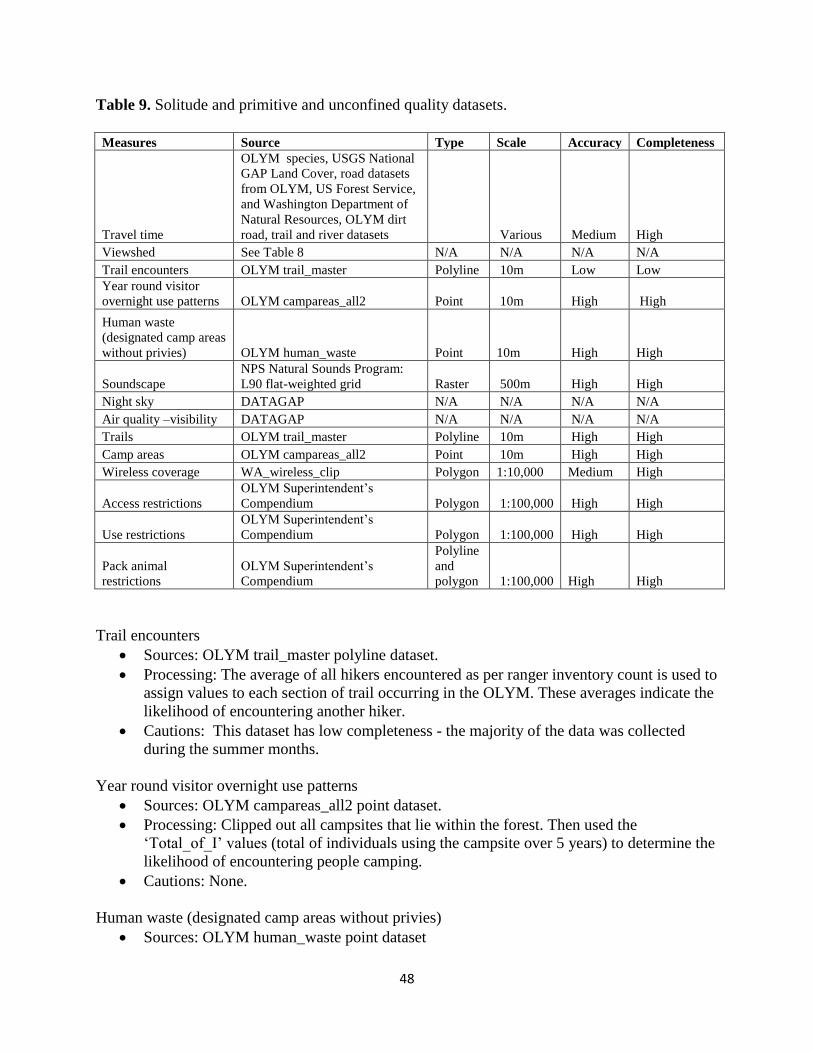
48
Table 9. Solitude and primitive and unconfined quality datasets.
Measures Source Type Scale Accuracy Completeness
Travel time
OLYM species, USGS National
GAP Land Cover, road datasets
from OLYM, US Forest Service,
and Washington Department of
Natural Resources, OLYM dirt
road, trail and river datasets Various Medium High
Viewshed See Table 8 N/A N/A N/A N/A
Trail encounters OLYM trail_master Polyline 10m Low Low
Year round visitor
overnight use patterns OLYM campareas_all2 Point 10m High High
Human waste
(designated camp areas
without privies) OLYM human_waste Point 10m High High
Soundscape
NPS Natural Sounds Program:
L90 flat-weighted grid Raster 500m High High
Night sky DATAGAP N/A N/A N/A N/A
Air quality –visibility DATAGAP N/A N/A N/A N/A
Trails OLYM trail_master Polyline 10m High High
Camp areas OLYM campareas_all2 Point 10m High High
Wireless coverage WA_wireless_clip Polygon 1:10,000 Medium High
Access restrictions
OLYM Superintendent’s
Compendium Polygon 1:100,000 High High
Use restrictions
OLYM Superintendent’s
Compendium Polygon 1:100,000 High High
Pack animal
restrictions
OLYM Superintendent’s
Compendium
Polyline
and
polygon 1:100,000 High High
Trail encounters
Sources: OLYM trail_master polyline dataset.
Processing: The average of all hikers encountered as per ranger inventory count is used to
assign values to each section of trail occurring in the OLYM. These averages indicate the
likelihood of encountering another hiker.
Cautions: This dataset has low completeness - the majority of the data was collected
during the summer months.
Year round visitor overnight use patterns
Sources: OLYM campareas_all2 point dataset.
Processing: Clipped out all campsites that lie within the forest. Then used the
‘Total_of_I’ values (total of individuals using the campsite over 5 years) to determine the
likelihood of encountering people camping.
Cautions: None.
Human waste (designated camp areas without privies)
Sources: OLYM human_waste point dataset
49
Processing: The total number of human waste recorded around campsites in OLYM
without privies is used to represent this measure.
Cautions: None.
Soundscape
Sources: Raster dataset provided by the NPS Natural Sounds Program. A L90 increase
over natural noise grid depicting anthropogenic noise (which captures existing noise
minus natural noise) is used (Figure 12).
Processing: Re: project raster to NAD 1983 UTM Zone 10N coordinate system.
Cautions: The soundscape output is currently limited to 500 m resolution. However, 30 m
resolution grids will be available in the near future.
Figure 12. OLYM soundscape map.
Night sky
Sources: This data does not currently exist for OLYM.
Processing: None.
Cautions: None.
Air quality
Sources: This data does not currently exist for OLYM.
Processing: None.
Cautions: None.
Trails
Sources: OLYM trail_master polyline dataset
Processing: The locations of trails occurring in OLYM are given values based on their
classification. Way trails = 1; primitive trails = 2; and foot trails, secondary trails, all-
purpose trails and nature trails = 3.
50
Cautions: None.
Camp areas
Sources: OLYM campareas_all2 point dataset.
Processing: The locations of campsites occurring in OLYM are given values based on an
OLYM created self-reliance matrix. The following classes explain the scoring system for
different types of campsites: 0 = the most primitive campsite and thus requires the
greatest degree of self-reliance - there is no defined campsite and no facilities; 1 to 3 = an
obvious campsite with a “measureable area” and nothing else; 4 to 8 = in addition to a
campsite with a “measureable area” there is typically one other facility or structure in
addition to a sign or signs; e.g. there may be a toilet facility or a bear wire or a shelter,
but usually only one or maybe two of these types of structures; 9 or greater = campsites
that have the whole suite of facilities, namely signs, toilet, food storage, and possibly a
shelter as well. Thus the degree of self-reliance required is greatly reduced.
Cautions: None.
Wireless coverage
Sources: WA_wireless_clip polygon dataset
Processing: Locations with cell service in OLYM are given a value of 1.
Cautions: None.
Access restrictions
Sources: OLYM created polygon datasets using the Superintendent’s Compendium.
Processing: Locations with the following restrictions in OLYM are given a value of 1:
areas subject to group size limits, quota areas (how many people can camp in an area per
night), no camping within a quarter mile of the following areas unless in a designated
campsite: Hoh Lake, Elk Lake in the Hoh district, Glacier Meadows Ranger Station, Lake
Crescent, Olympic Hot Springs, Grand Lake, Moose Lake, Gladys Lake, Lake
Constance, Upper Lena Lake, Flapjack Lakes/Gladys Divide. Royal Lake, CB Flats, and
Hoh Lake to Bogachiel Peak; no camping (unless in a designated campsite) in the Queets
corridor downstream from the trailhead to the park boundary and all areas on the coastal
strip south of the Hoh Indian Reservation; no camping within 1 mile of a trailhead (unless
in a designated campsite).
Cautions: None.
Use restrictions
Sources: OLYM created polygon datasets using the Superintendent’s Compendium.
Processing: Locations in OLYM with the following use restrictions are given a value of
1: food storage requirements, campfire restrictions, blue bag requirements, and no-
sledding zones.
Cautions: Fishing restrictions were excluded from this measure as the number of zones
and complexity of regulations make it difficult to develop a value system to represent
these restrictions spatially.
Pack animal restrictions
Sources: OLYM created polygon datasets using the Superintendent’s Compendium.
51
Processing: Locations with pack animal restrictions occurring in OLYM are given a value
of 1.
Cautions: Pack animal restrictions are weighted lower than access and use restrictions
because they will only affect a small number of wilderness visitors.
Weighting
The first page of the methods section describes the underlying principle for using a weighting
system. A rationale is provided for the weight of each measure (Table 10). The “weighted”
measures under each indicator total 100. Although data for visibility and night sky are
unavailable, these “missing” measures are still assigned weights. In the future, should the data
improve or become available, these measures can be added to a rerun of the wilderness character
map. The revised weights for indicators with missing data are recorded in brackets in Table 10.
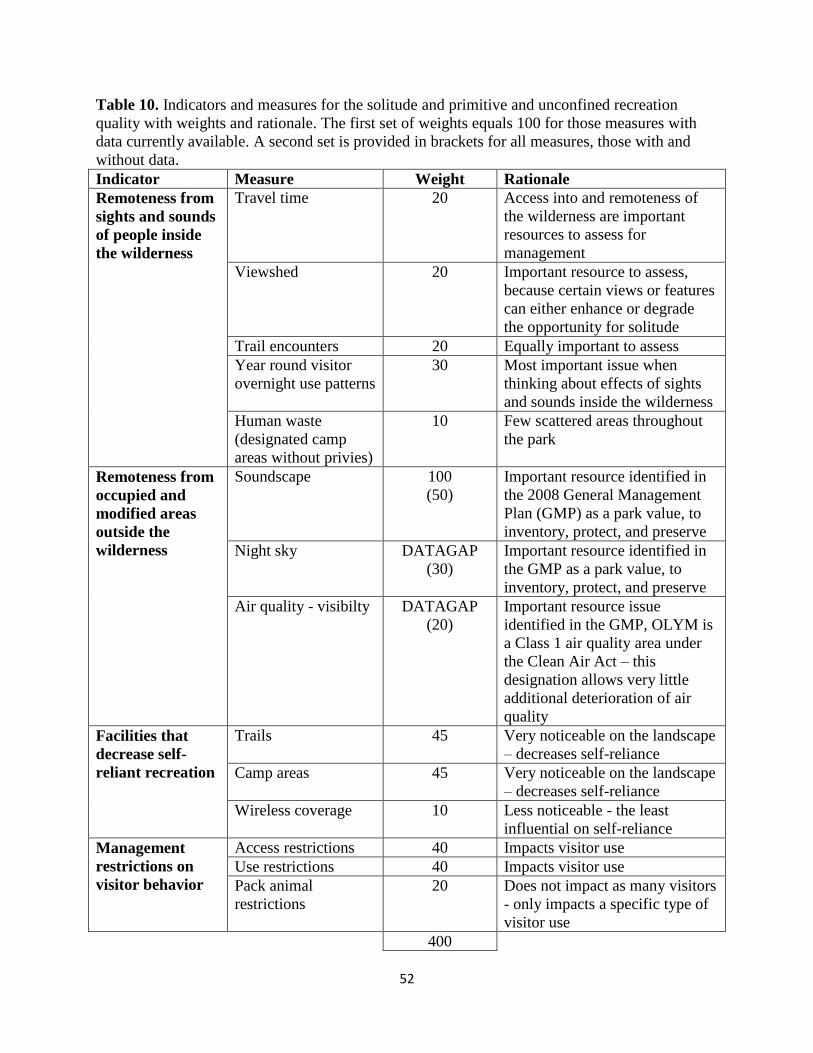
52
Table 10. Indicators and measures for the solitude and primitive and unconfined recreation
quality with weights and rationale. The first set of weights equals 100 for those measures with
data currently available. A second set is provided in brackets for all measures, those with and
without data.
Indicator Measure Weight Rationale
Remoteness from
sights and sounds
of people inside
the wilderness
Travel time 20 Access into and remoteness of
the wilderness are important
resources to assess for
management
Viewshed 20 Important resource to assess,
because certain views or features
can either enhance or degrade
the opportunity for solitude
Trail encounters 20 Equally important to assess
Year round visitor
overnight use patterns
30 Most important issue when
thinking about effects of sights
and sounds inside the wilderness
Human waste
(designated camp
areas without privies)
10 Few scattered areas throughout
the park
Remoteness from
occupied and
modified areas
outside the
wilderness
Soundscape 100
(50)
Important resource identified in
the 2008 General Management
Plan (GMP) as a park value, to
inventory, protect, and preserve
Night sky DATAGAP
(30)
Important resource identified in
the GMP as a park value, to
inventory, protect, and preserve
Air quality - visibilty DATAGAP
(20)
Important resource issue
identified in the GMP, OLYM is
a Class 1 air quality area under
the Clean Air Act – this
designation allows very little
additional deterioration of air
quality
Facilities that
decrease self-
reliant recreation
Trails 45 Very noticeable on the landscape
– decreases self-reliance
Camp areas 45 Very noticeable on the landscape
– decreases self-reliance
Wireless coverage 10 Less noticeable - the least
influential on self-reliance
Management
restrictions on
visitor behavior
Access restrictions 40 Impacts visitor use
Use restrictions 40 Impacts visitor use
Pack animal
restrictions
20 Does not impact as many visitors
- only impacts a specific type of
visitor use
400

53
Maps
The weighted measures for each indicator are added together using a raster calculator to create
separate maps for remoteness from sights and sounds of people inside the wilderness, remoteness
from occupied and modified areas outside the wilderness, facilities that decrease self-reliant
recreation, and management restrictions on visitor behavior (Figure 13). The first two indicators
are added together to depict opportunities for solitude inside wilderness and the latter two
indicators are added together to depict opportunities for primitive and unconfined recreation
inside wilderness (Figure 14). Finally, the raster calculator is used to add the four indicator maps
together to create the solitude or primitive and unconfined quality map (Figure 15).
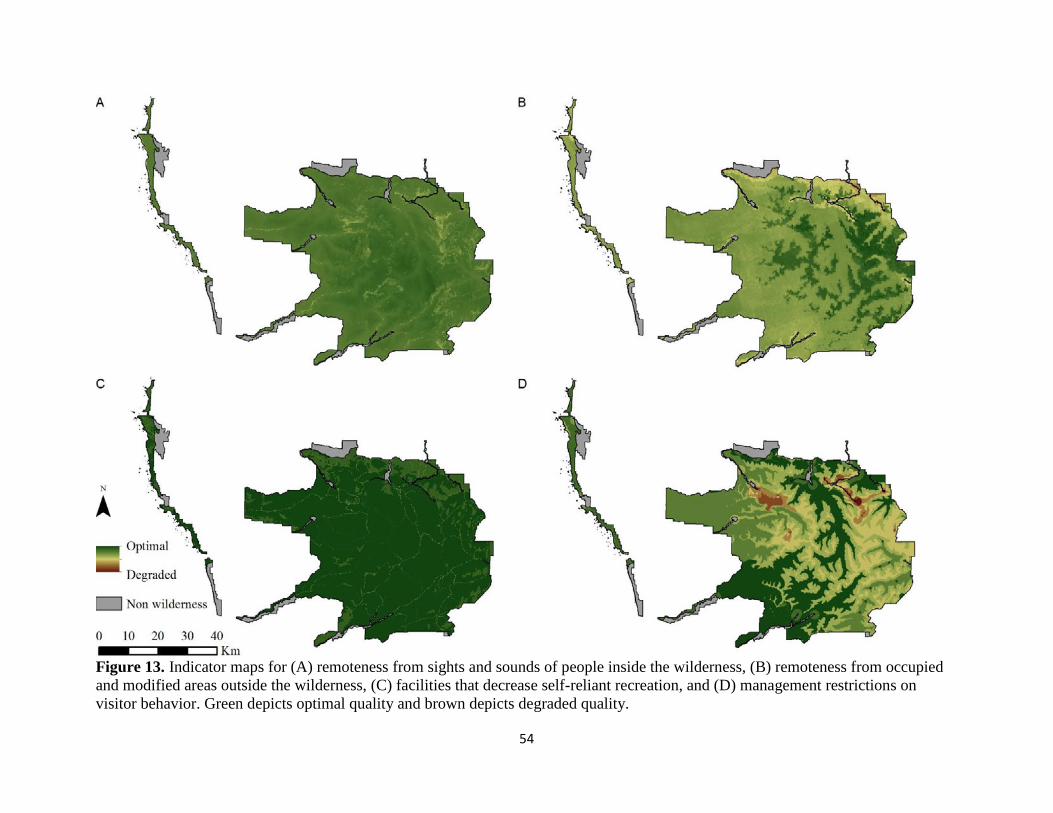
54
Figure 13. Indicator maps for (A) remoteness from sights and sounds of people inside the wilderness, (B) remoteness from occupied
and modified areas outside the wilderness, (C) facilities that decrease self-reliant recreation, and (D) management restrictions on
visitor behavior. Green depicts optimal quality and brown depicts degraded quality.
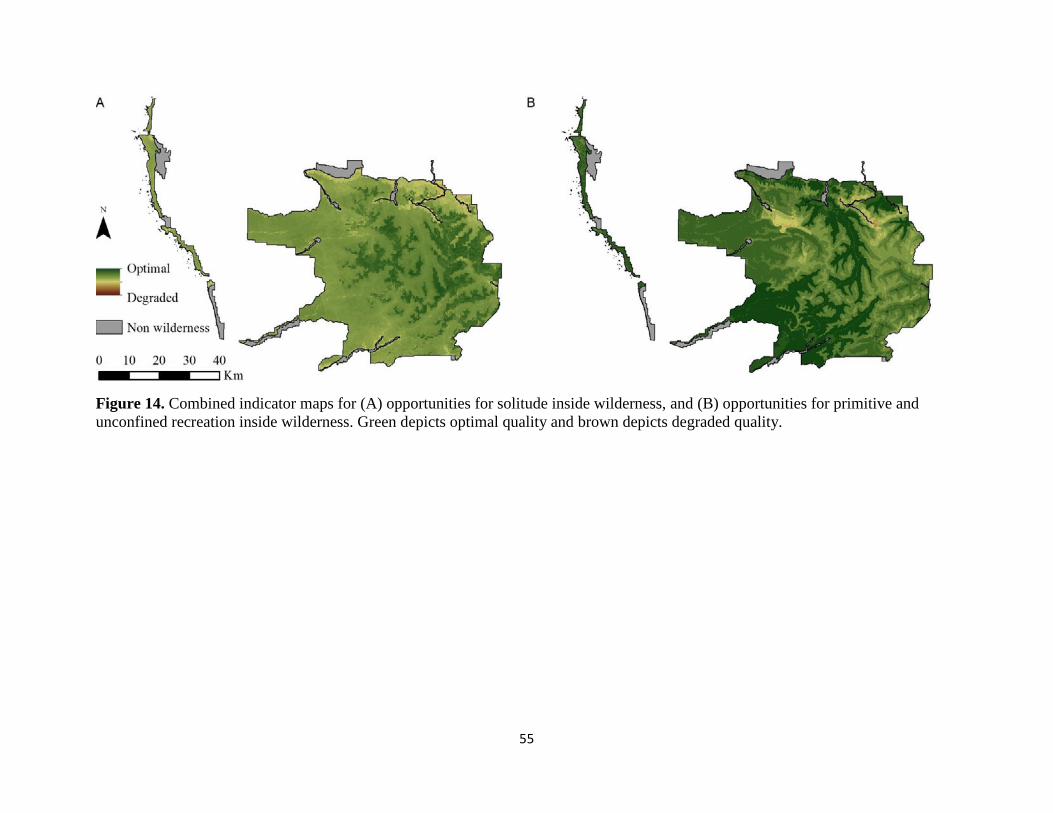
55
Figure 14. Combined indicator maps for (A) opportunities for solitude inside wilderness, and (B) opportunities for primitive and
unconfined recreation inside wilderness. Green depicts optimal quality and brown depicts degraded quality.
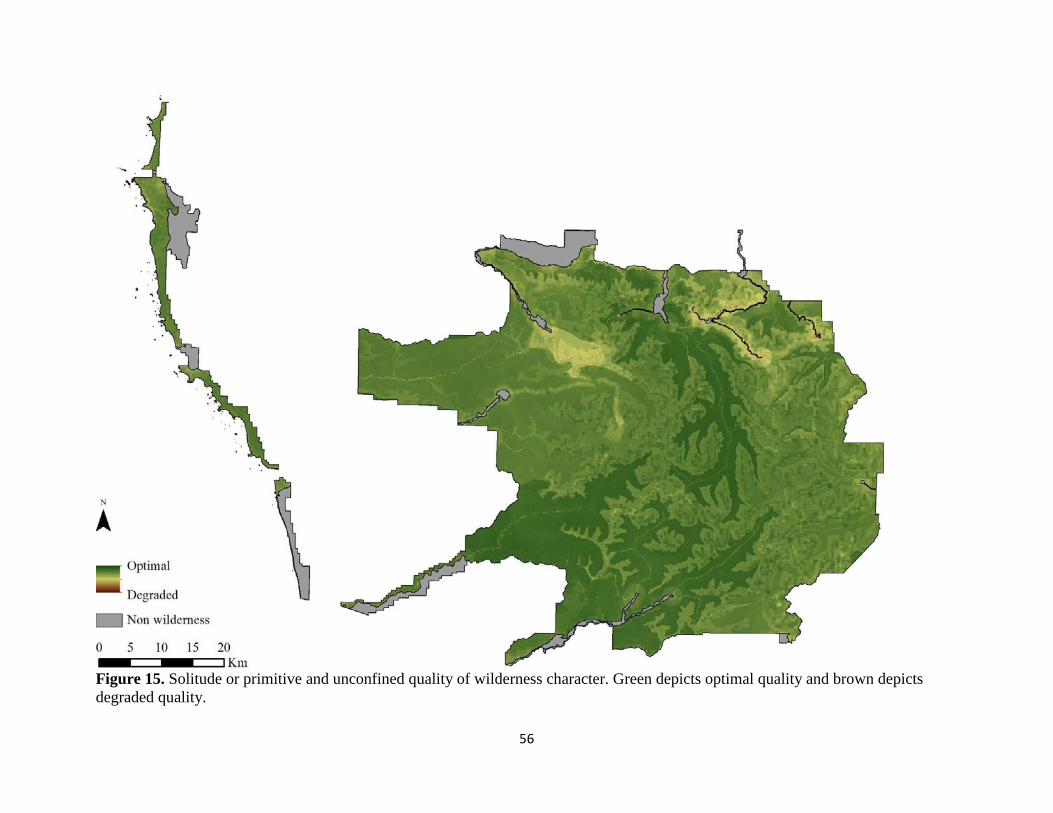
56
Figure 15. Solitude or primitive and unconfined quality of wilderness character. Green depicts optimal quality and brown depicts
degraded quality.
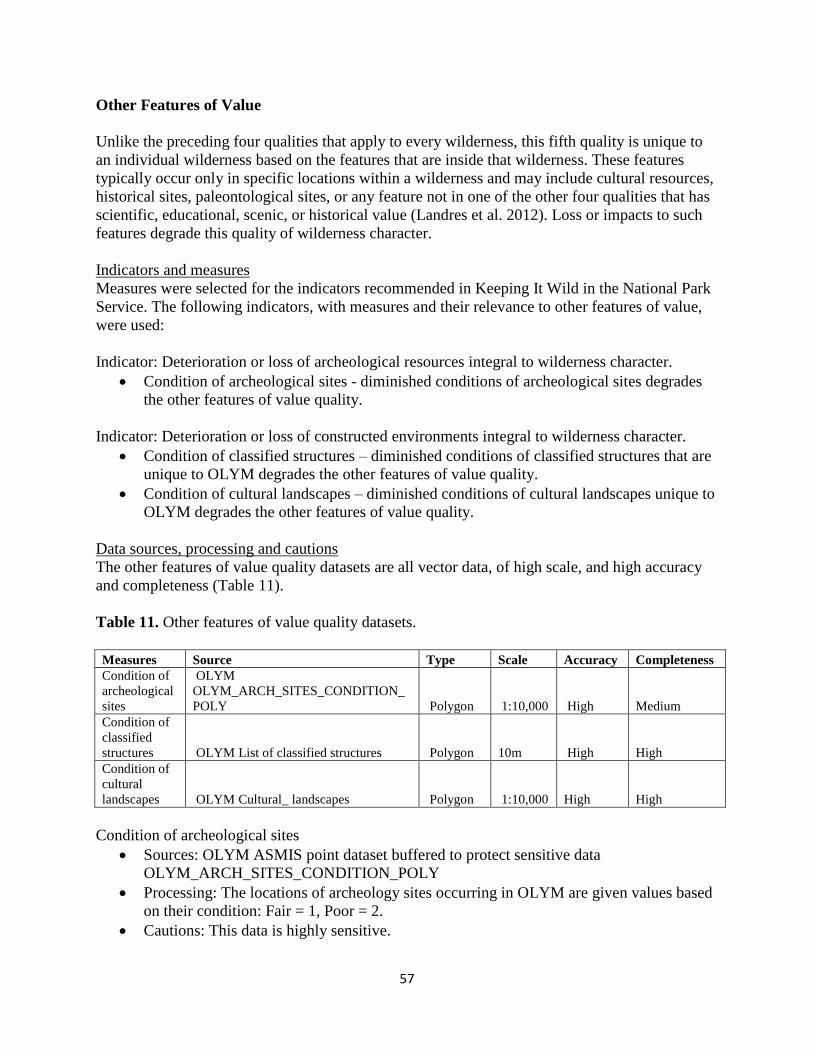
57
Other Features of Value
Unlike the preceding four qualities that apply to every wilderness, this fifth quality is unique to
an individual wilderness based on the features that are inside that wilderness. These features
typically occur only in specific locations within a wilderness and may include cultural resources,
historical sites, paleontological sites, or any feature not in one of the other four qualities that has
scientific, educational, scenic, or historical value (Landres et al. 2012). Loss or impacts to such
features degrade this quality of wilderness character.
Indicators and measures
Measures were selected for the indicators recommended in Keeping It Wild in the National Park
Service. The following indicators, with measures and their relevance to other features of value,
were used:
Indicator: Deterioration or loss of archeological resources integral to wilderness character.
Condition of archeological sites - diminished conditions of archeological sites degrades
the other features of value quality.
Indicator: Deterioration or loss of constructed environments integral to wilderness character.
Condition of classified structures – diminished conditions of classified structures that are
unique to OLYM degrades the other features of value quality.
Condition of cultural landscapes – diminished conditions of cultural landscapes unique to
OLYM degrades the other features of value quality.
Data sources, processing and cautions
The other features of value quality datasets are all vector data, of high scale, and high accuracy
and completeness (Table 11).
Table 11. Other features of value quality datasets.
Measures Source Type Scale Accuracy Completeness
Condition of
archeological
sites
OLYM
OLYM_ARCH_SITES_CONDITION_
POLY Polygon 1:10,000 High Medium
Condition of
classified
structures OLYM List of classified structures Polygon 10m High High
Condition of
cultural
landscapes OLYM Cultural_ landscapes Polygon 1:10,000 High High
Condition of archeological sites
Sources: OLYM ASMIS point dataset buffered to protect sensitive data
OLYM_ARCH_SITES_CONDITION_POLY
Processing: The locations of archeology sites occurring in OLYM are given values based
on their condition: Fair = 1, Poor = 2.
Cautions: This data is highly sensitive.
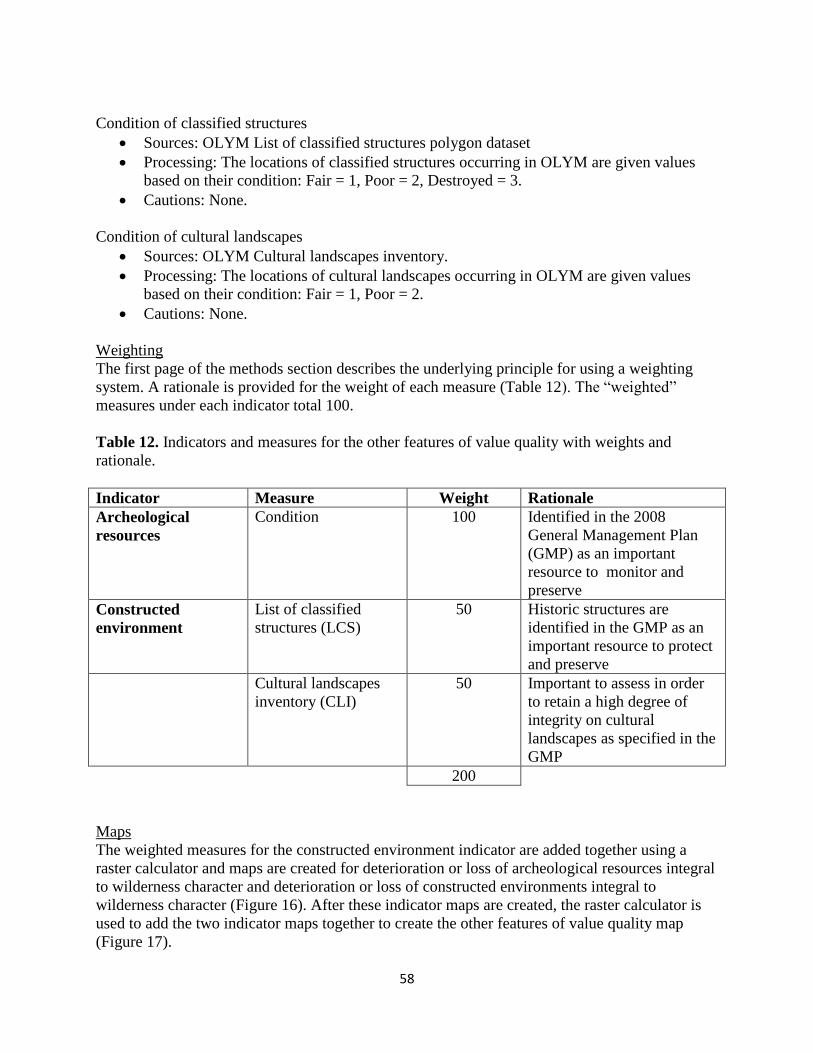
58
Condition of classified structures
Sources: OLYM List of classified structures polygon dataset
Processing: The locations of classified structures occurring in OLYM are given values
based on their condition: Fair = 1, Poor = 2, Destroyed = 3.
Cautions: None.
Condition of cultural landscapes
Sources: OLYM Cultural landscapes inventory.
Processing: The locations of cultural landscapes occurring in OLYM are given values
based on their condition: Fair = 1, Poor = 2.
Cautions: None.
Weighting
The first page of the methods section describes the underlying principle for using a weighting
system. A rationale is provided for the weight of each measure (Table 12). The “weighted”
measures under each indicator total 100.
Table 12. Indicators and measures for the other features of value quality with weights and
rationale.
Indicator Measure Weight Rationale
Archeological
resources
Condition 100 Identified in the 2008
General Management Plan
(GMP) as an important
resource to monitor and
preserve
Constructed
environment
List of classified
structures (LCS)
50 Historic structures are
identified in the GMP as an
important resource to protect
and preserve
Cultural landscapes
inventory (CLI)
50 Important to assess in order
to retain a high degree of
integrity on cultural
landscapes as specified in the
GMP
200
Maps
The weighted measures for the constructed environment indicator are added together using a
raster calculator and maps are created for deterioration or loss of archeological resources integral
to wilderness character and deterioration or loss of constructed environments integral to
wilderness character (Figure 16). After these indicator maps are created, the raster calculator is
used to add the two indicator maps together to create the other features of value quality map
(Figure 17).

59
Figure 16. Indicator maps for (A) deterioration or loss of archeology integral to wilderness character, and (B) Deterioration or loss of
constructed environments integral to wilderness character. Green depicts optimal quality and brown depicts degraded quality.

60
Figure 17. Other features of value quality of wilderness character. Green depicts optimal quality and brown depicts degraded quality.
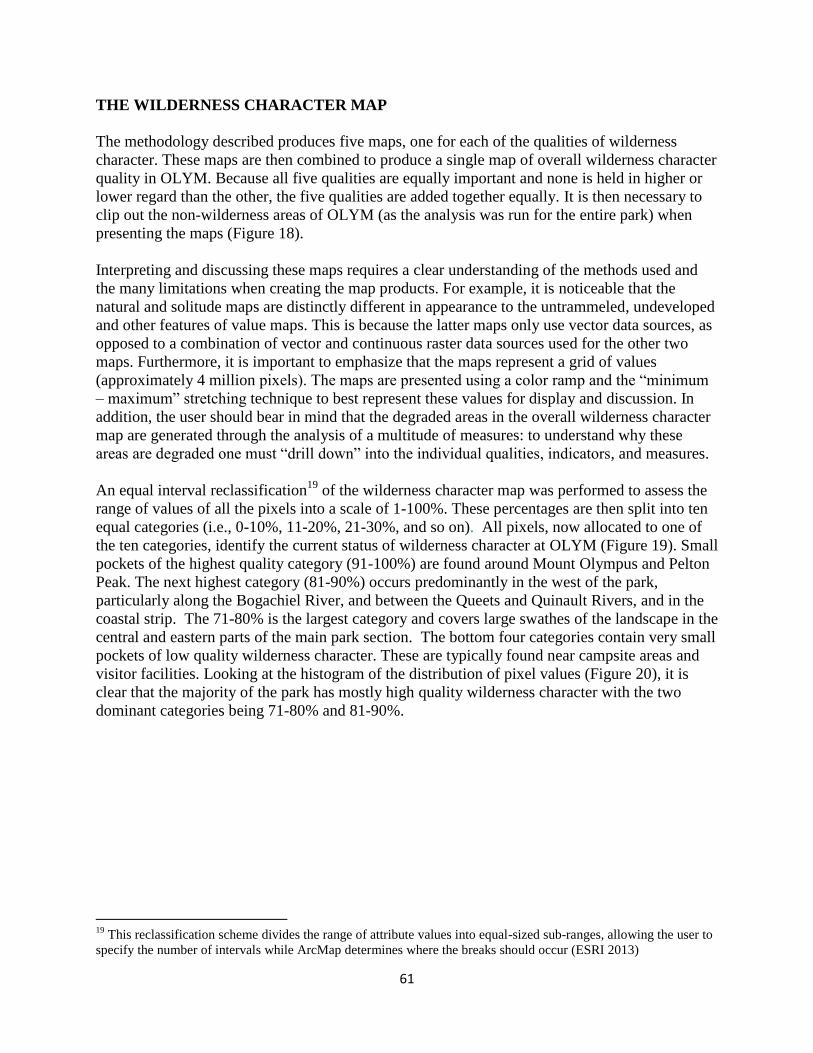
61
THE WILDERNESS CHARACTER MAP
The methodology described produces five maps, one for each of the qualities of wilderness
character. These maps are then combined to produce a single map of overall wilderness character
quality in OLYM. Because all five qualities are equally important and none is held in higher or
lower regard than the other, the five qualities are added together equally. It is then necessary to
clip out the non-wilderness areas of OLYM (as the analysis was run for the entire park) when
presenting the maps (Figure 18).
Interpreting and discussing these maps requires a clear understanding of the methods used and
the many limitations when creating the map products. For example, it is noticeable that the
natural and solitude maps are distinctly different in appearance to the untrammeled, undeveloped
and other features of value maps. This is because the latter maps only use vector data sources, as
opposed to a combination of vector and continuous raster data sources used for the other two
maps. Furthermore, it is important to emphasize that the maps represent a grid of values
(approximately 4 million pixels). The maps are presented using a color ramp and the “minimum
– maximum” stretching technique to best represent these values for display and discussion. In
addition, the user should bear in mind that the degraded areas in the overall wilderness character
map are generated through the analysis of a multitude of measures: to understand why these
areas are degraded one must “drill down” into the individual qualities, indicators, and measures.
An equal interval reclassification19
of the wilderness character map was performed to assess the
range of values of all the pixels into a scale of 1-100%. These percentages are then split into ten
equal categories (i.e., 0-10%, 11-20%, 21-30%, and so on). All pixels, now allocated to one of
the ten categories, identify the current status of wilderness character at OLYM (Figure 19). Small
pockets of the highest quality category (91-100%) are found around Mount Olympus and Pelton
Peak. The next highest category (81-90%) occurs predominantly in the west of the park,
particularly along the Bogachiel River, and between the Queets and Quinault Rivers, and in the
coastal strip. The 71-80% is the largest category and covers large swathes of the landscape in the
central and eastern parts of the main park section. The bottom four categories contain very small
pockets of low quality wilderness character. These are typically found near campsite areas and
visitor facilities. Looking at the histogram of the distribution of pixel values (Figure 20), it is
clear that the majority of the park has mostly high quality wilderness character with the two
dominant categories being 71-80% and 81-90%.
19
This reclassification scheme divides the range of attribute values into equal-sized sub-ranges, allowing the user to
specify the number of intervals while ArcMap determines where the breaks should occur (ESRI 2013)
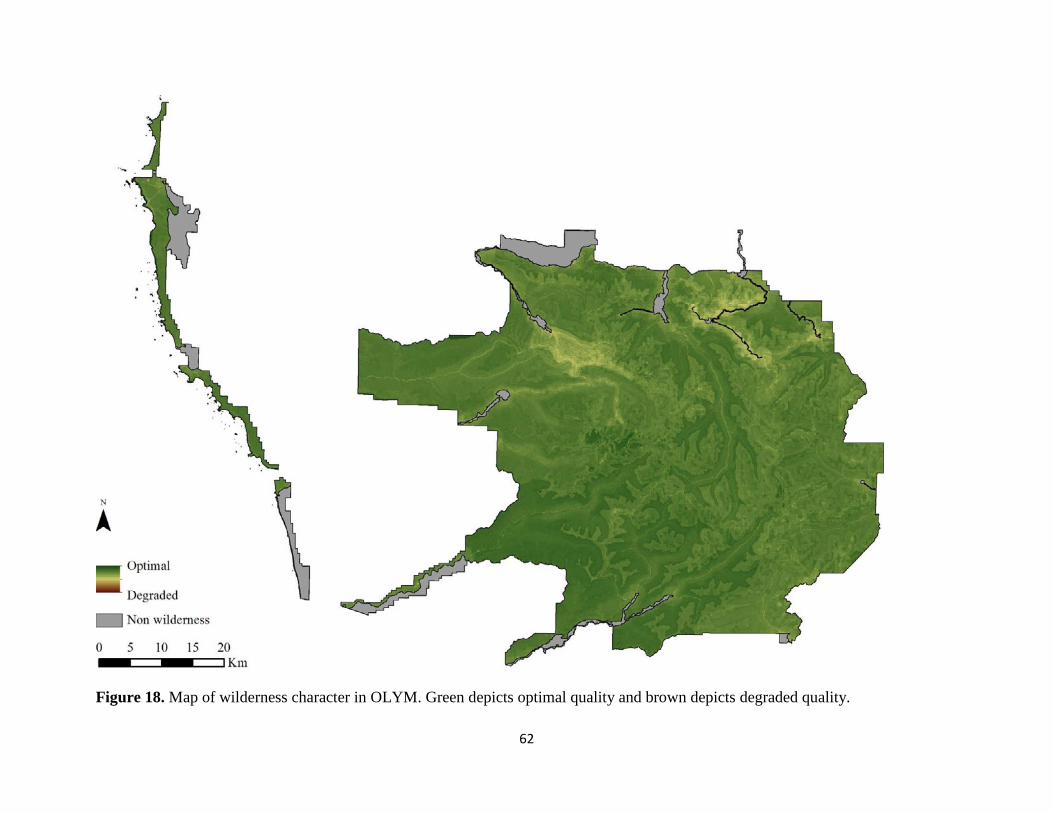
62
Figure 18. Map of wilderness character in OLYM. Green depicts optimal quality and brown depicts degraded quality.
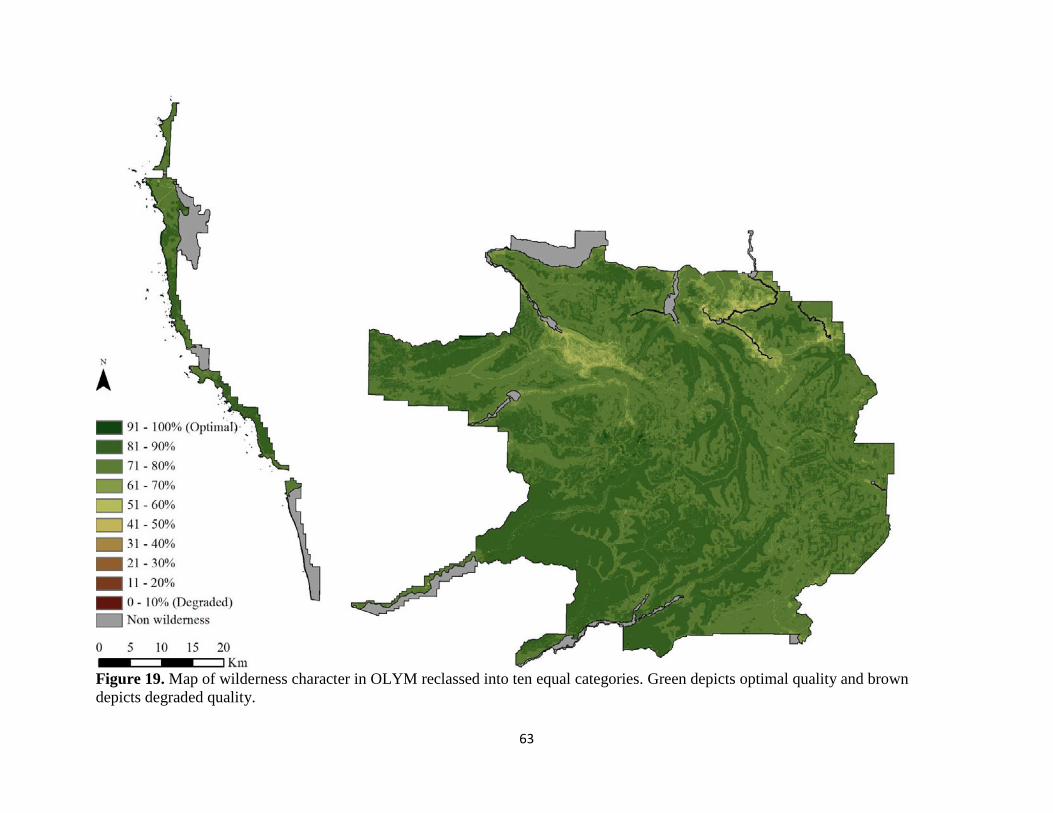
63
Figure 19. Map of wilderness character in OLYM reclassed into ten equal categories. Green depicts optimal quality and brown
depicts degraded quality.
64
Figure 20. Histogram of the wilderness character map values.
Improvements
The map products presented in this document have much room for improvement. The maps are
highly dependent on the wide range of spatial datasets that define wilderness character. As the
data quality becomes more accurate and complete and the missing data gaps are filled, the maps
will improve. Again, the availability of improved land cover maps and a high resolution Digital
Surface Model would increase the accuracy and effectiveness of the travel time and viewshed
models.
The issue of data quality also highlights the need for the NPS to manage its spatial database more
effectively. Clear communication is required to ensure that contractors providing GIS products
for the park submit comprehensive datasets and easy-to-understand metadata. Again, clear
communication with scientists conducting research in OYLM can allow for the generation or
improvement of spatial datasets that can be used to inform the map products. An example of this
communication is the soundscape raster data: discussion with researchers at the NPS Natural
Sounds and Night Skies Division facilitated refinements in their model calibration and use of
different outputs that are a more accurate of OLYM soundscape.
Park databases can be further improved by creating awareness among park staff to correctly
record spatial information gathered in the field. Field staff should be encouraged to learn how to
operate GPS units and download data into spatial datasets. Park staff with backcountry
experience should be encouraged to meet regularly with GIS technicians to transfer their
65
knowledge into spatial datasets. Field staff can also be used to ground-truth the accuracy of
spatial datasets used in the wilderness character map. In particular, it would be useful to test the
output of the travel time and viewshed models against observations in the field.
This mapping approach also highlighted the difficulties in accounting for “value added” features
of the landscape. Whilst the concept of wilderness character is positive, most of the measures
identified in Keeping it Wild are measures of loss or degradation from an ideal condition.
However, conceptually there are some features that add value to wilderness character. For
example, it is logical to consider the extirpation of a species as a degradation of the natural
quality of wilderness character and the persistence of an imperiled species as a positive value.
However, under the mathematical construct of the map and the wilderness character monitoring
framework, to add value to pixels in which the Olympic marmot (an important imperiled species
in OLYM) exist would mean that all the other pixels would be devalued for that same measure,
even though they might not even be suitable for a Olympic marmot. A similar paradox exists for
paleontological resources and some cultural resources. In many cases, these value added features
are a focal point for management actions, such as a paleontological site that is closed to public
entry due to the sensitive nature of the resources at that location. In that case, the map depicts a
loss of unconfined recreation and thus a degradation of the solitude and primitive and unconfined
recreation quality of wilderness character without accounting for the value added to wilderness
character by the presence and persistence of the paleontological resources. A future improvement
to this mapping approach would be to find a way to include “value added” situations rather than
just degradations of wilderness character.
Lastly, there are spatial differences between the park and wilderness GIS boundaries, resulting in
a number of slither polygons where these two boundaries overlap. Although this is a relatively
minor issue, as these datasets improve the final maps can be rerun to remove these slithers.
Final Concerns about Mapping Wilderness Character
A major concern of this work common to all GIS analyses is the tendency for end-users to
ascribe false levels of reliability and precision to the maps because they look accurate. Therefore,
it is important to emphasize that these map products are only intended as an estimate of selected
aspects of wilderness character and their relative spatial dimensions of variability and pattern.
Another concern is that wilderness researchers and users may debate the merits of even
attempting to map wilderness character. Some suggest that quantification of wilderness character
does not reflect how wilderness affects each of us in different ways (e.g., Watson 2004), while
others point to the need to develop indicators that can be used to aid monitoring and management
(e.g., Landres 2004). Therefore, it is important to clarify that the maps do not in any way portray
the symbolic, intangible, spiritual, and experiential values of wilderness character that are unique
to the individual person, the location, and the moment.
66
REFERENCES
Aplet, G., J. Thomson, and M. Wilbert. 2000. Indicators of wildness: Using attributes of the land
to assess the context of wilderness. In S. F. McCool, D. N. Cole, W. T. Borrie, and J.
O’Loughlin (Eds.), Proceedings of the wilderness science in a time of change conference,
Ogden, USA, May 23 – May 27. USDA Forest Service Proceedings RMRS-P-15-VOL-2:
Missoula, Montana.
Carver, S. 1996. Mapping the wilderness continuum using raster GIS. In S. Morain and S.Lopez-
Baros (eds) Raster imagery in Geographic Information Systems. OnWord Press, New Mexico,
283-288.
Carver, S. and S. Fritz. 1999. Mapping remote areas using GIS. In M. Usher (ed) Landscape
character: perspectives on management and change. Natural Heitage of Scotland Series,
HMSO. 112-126.
Carver, S. and M. Wrightham. 2003. Assessment of historic trends in the extent of wild land in
Scotland: a pilot study. Scottish Natural Heritage Commissioned Report No. 012 (ROAME
No. FO2NC11A).
Carver, S., L. Comber, S. Fritz, R. McMorran, S. Taylor, and J. Washtell. 2008. Wildness Study
in the Cairngorms National Park, Final Report, Commissioned by the Cairngorms National
Park Authority and Scottish Natural Heritage March 2008,
(http://www.wildlandresearch.org/Cairngorm2008.pdf)
Carver, S. 2010. 10.3 Mountains and wilderness in European Environment Agency Europe's
ecological backbone: recognising the true value of our mountains, EEA Report No 6/2010,
192-201.
ESRI. 2013. ESRI Support. Redlands, CA: Environmental Systems Research Institute.
(http://support.esri.com)
Fisher, P. 1993. Algorithm and implementation uncertainty in viewshed analysis. International
Journal of Geographic Information Science. 7(4) 331-347.
Fritz, S., S. Carver, and L. See. 2000. New approaches to wild land mapping in Europe.
Proceedings of I5-VOL-2. 2000. Missoula, Montana.
Landres, P. 2004. Developing indicators to monitor the “outstanding opportunities” quality of
wilderness character. International Journal of Wilderness 10(3):8-12, 20.
Landres, P., S. Boutcher, L. Merigliano, C. Barns, D. Davis, T. Hall, S. Henry, B. Hunter, P.
Janiga, M. Laker, A. McPherson, D.S. Powell, M. Rowan, and S. Sater. 2005. Monitoring
selected conditions related to wilderness character: a national framework. USDA Forest
Service Rocky Mountain Research Station General Technical Report, RMRS-GTR-151. 38
pages. Fort Collins, CO.
67
Landres, P., C. Barns, J.G. Dennis, T. Devine, P. Geissler, C.S. McCasland, L. Merigliano, J.
Seastrand, and R. Swain. 2008a. Keeping it Wild: An Interagency Strategy to Monitor Trends
in Wilderness Character Across the National Wilderness Preservation System. 81 pages.
USDA Forest Service, Rocky Mountain Research Station General Technical Report RMRS-
GTR-212, Fort Collins, CO.
Landres, P., M.B. Hennessy, K. Schlenker, D.N. Cole, and S. Boutcher. 2008b. Applying the
concept of wilderness character to National Forest planning, monitoring, and management. 45
pages. USDA Forest Service, Rocky Mountain Research Station General Technical Report
RMRS-GTR-217WWW, Fort Collins, CO.
Landres, P., W.M. Vagias, S. Stutzman. 2012. Using wilderness character to improve wilderness
stewardship. Park Science 28(3) 44-48.
Lesslie, R. 1993. The National Wilderness Inventory: wilderness identification, assessment and
monitoring in Australia. International wilderness allocation, management and research.
Proceedings of the 5th
World Wilderness Congress. 31-36.
Naismith, W.W. 1892. Scottish Mountaineering Club Journal. II: 136.
Rollins, M.G. 2009. LANDFIRE: a nationally consistent vegetation, wildland fire, and fuel
assessment. International Journal of Wildland Fire. 18: 235-249
Sanderson, E.W., M. Jaiteh, M.A. Levy, K.H. Redford, A.V. Wannebo, and G. Woolmer. 2002.
The human footprint and the last of the wild. Bioscience. 52(10): 891-904.
Thomas, K.A., T. Keeler-Wolf, J. Franklin, and P. Stine. 2004. Mojave Desert ecosystem
project: Central Mojave vegetation mapping database. Final Report. U.S. Geological Survey,
Western Ecological Research Center and Southwest Biological Science Center, 251pp.
Available online at:
(http://www.mojavedata.gov/documents/docs/RPT_Central_Moj_Veg_Database_Final_Repor
t_ThomasK_2004.pdf)
Washtell, J. 2007. Developing a voxel-based viewshed transform for rapid and real time
assessment of landscape visibility. Unpublished course paper. MSc in Multi-disciplinary
Informatics, University of Leeds.
Watson, A. E. 2004. Human relationships with wilderness: The fundamental definition of
wilderness character. International Journal of Wilderness 10(3): 4-7
Zahniser, H. 1962. Hearings before the Subcommittee on Public Lands of the Committee on
Interior Affairs, House of Representitives, 87th
Congress, 2nd
session, May 7-11, serial no.12,
part IV.
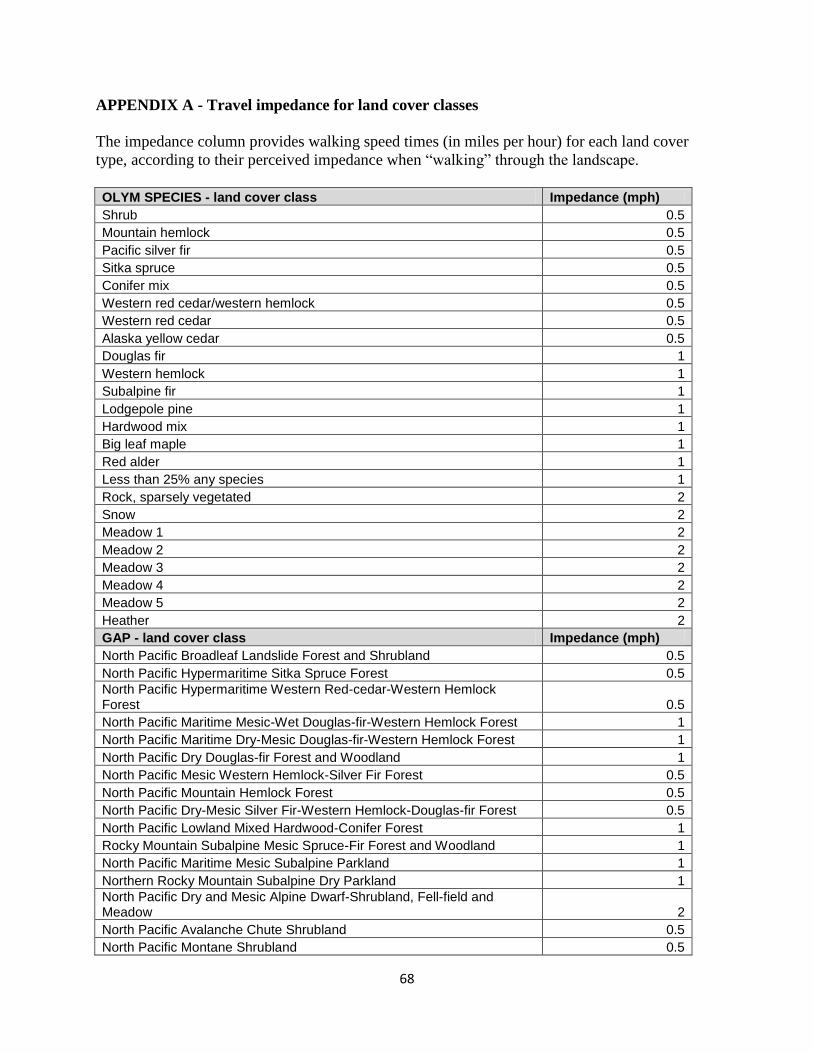
68
APPENDIX A - Travel impedance for land cover classes
The impedance column provides walking speed times (in miles per hour) for each land cover
type, according to their perceived impedance when “walking” through the landscape.
OLYM SPECIES - land cover class Impedance (mph)
Shrub 0.5
Mountain hemlock 0.5
Pacific silver fir 0.5
Sitka spruce 0.5
Conifer mix 0.5
Western red cedar/western hemlock 0.5
Western red cedar 0.5
Alaska yellow cedar 0.5
Douglas fir 1
Western hemlock 1
Subalpine fir 1
Lodgepole pine 1
Hardwood mix 1
Big leaf maple 1
Red alder 1
Less than 25% any species 1
Rock, sparsely vegetated 2
Snow 2
Meadow 1 2
Meadow 2 2
Meadow 3 2
Meadow 4 2
Meadow 5 2
Heather 2
GAP - land cover class Impedance (mph)
North Pacific Broadleaf Landslide Forest and Shrubland 0.5
North Pacific Hypermaritime Sitka Spruce Forest 0.5
North Pacific Hypermaritime Western Red-cedar-Western Hemlock Forest 0.5
North Pacific Maritime Mesic-Wet Douglas-fir-Western Hemlock Forest 1
North Pacific Maritime Dry-Mesic Douglas-fir-Western Hemlock Forest 1
North Pacific Dry Douglas-fir Forest and Woodland 1
North Pacific Mesic Western Hemlock-Silver Fir Forest 0.5
North Pacific Mountain Hemlock Forest 0.5
North Pacific Dry-Mesic Silver Fir-Western Hemlock-Douglas-fir Forest 0.5
North Pacific Lowland Mixed Hardwood-Conifer Forest 1
Rocky Mountain Subalpine Mesic Spruce-Fir Forest and Woodland 1
North Pacific Maritime Mesic Subalpine Parkland 1
Northern Rocky Mountain Subalpine Dry Parkland 1
North Pacific Dry and Mesic Alpine Dwarf-Shrubland, Fell-field and Meadow 2
North Pacific Avalanche Chute Shrubland 0.5
North Pacific Montane Shrubland 0.5
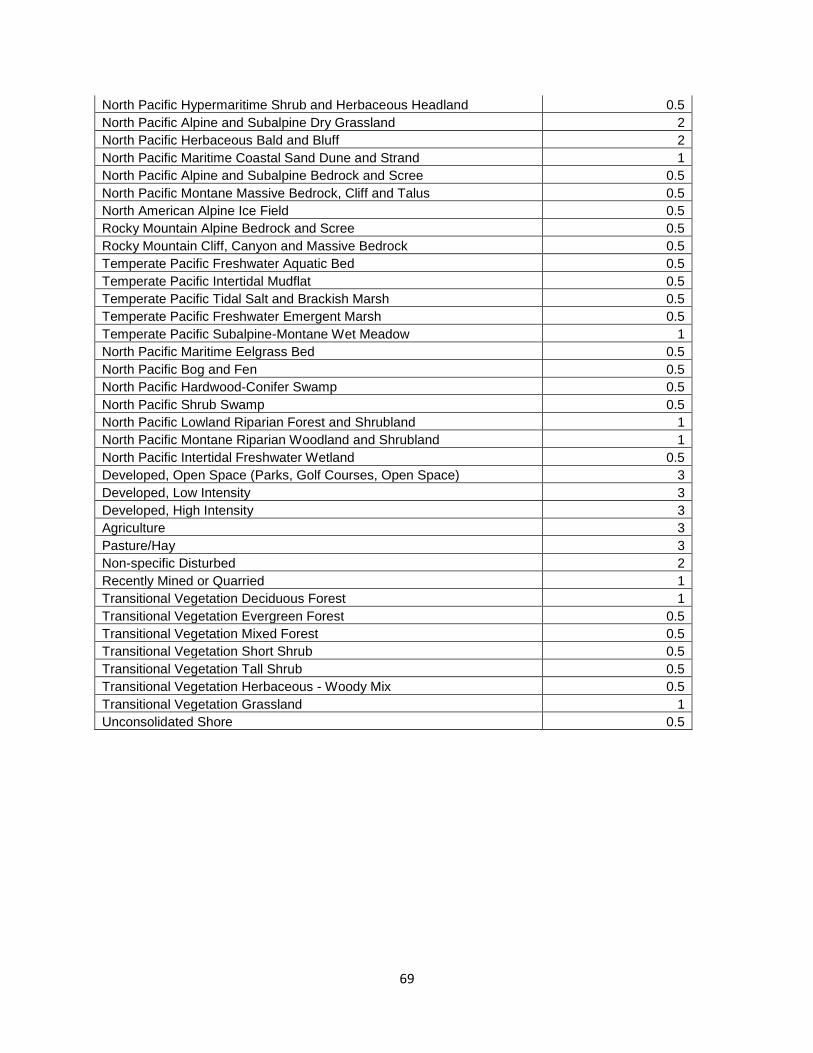
69
North Pacific Hypermaritime Shrub and Herbaceous Headland 0.5
North Pacific Alpine and Subalpine Dry Grassland 2
North Pacific Herbaceous Bald and Bluff 2
North Pacific Maritime Coastal Sand Dune and Strand 1
North Pacific Alpine and Subalpine Bedrock and Scree 0.5
North Pacific Montane Massive Bedrock, Cliff and Talus 0.5
North American Alpine Ice Field 0.5
Rocky Mountain Alpine Bedrock and Scree 0.5
Rocky Mountain Cliff, Canyon and Massive Bedrock 0.5
Temperate Pacific Freshwater Aquatic Bed 0.5
Temperate Pacific Intertidal Mudflat 0.5
Temperate Pacific Tidal Salt and Brackish Marsh 0.5
Temperate Pacific Freshwater Emergent Marsh 0.5
Temperate Pacific Subalpine-Montane Wet Meadow 1
North Pacific Maritime Eelgrass Bed 0.5
North Pacific Bog and Fen 0.5
North Pacific Hardwood-Conifer Swamp 0.5
North Pacific Shrub Swamp 0.5
North Pacific Lowland Riparian Forest and Shrubland 1
North Pacific Montane Riparian Woodland and Shrubland 1
North Pacific Intertidal Freshwater Wetland 0.5
Developed, Open Space (Parks, Golf Courses, Open Space) 3
Developed, Low Intensity 3
Developed, High Intensity 3
Agriculture 3
Pasture/Hay 3
Non-specific Disturbed 2
Recently Mined or Quarried 1
Transitional Vegetation Deciduous Forest 1
Transitional Vegetation Evergreen Forest 0.5
Transitional Vegetation Mixed Forest 0.5
Transitional Vegetation Short Shrub 0.5
Transitional Vegetation Tall Shrub 0.5
Transitional Vegetation Herbaceous - Woody Mix 0.5
Transitional Vegetation Grassland 1
Unconsolidated Shore 0.5