mapping the invocation structure of online political …ashton/pubs/invocation-structure- the...
TRANSCRIPT

Mapping the Invocation Structure of Online Political InteractionManish RaghavanCornell University
Ashton AndersonUniversity of Toronto
Jon KleinbergCornell University
ABSTRACTThe surge in political information, discourse, and interaction hasbeen one of the most important developments in social media overthe past several years. There is rich structure in the interactionamong different viewpoints on the ideological spectrum. However,we still have only a limited analytical vocabulary for expressingthe ways in which these viewpoints interact.
In this paper, we develop network-based methods that operateon the ways in which users share content; we construct invocationgraphs on Web domains showing the extent to which pages fromone domain are invoked by users to reply to posts containing pagesfrom other domains. When we locate the domains on a politicalspectrum induced from the data, we obtain an embedded graphshowing how these interaction links span different distances onthe spectrum. The structure of this embedded network, and itsevolution over time, helps us derive macro-level insights abouthow political interaction unfolded through 2016, leading up to theUS Presidential election. In particular, we find that the domainsinvoked in replies spanned increasing distances on the spectrumover the months approaching the election, and that there was clearasymmetry between the left-to-right and right-to-left patterns oflinkage.
ACM Reference Format:Manish Raghavan, Ashton Anderson, and Jon Kleinberg. 2018. Mappingthe Invocation Structure of Online Political Interaction. In WWW 2018: The2018 Web Conference, April 23–27, 2018, Lyon, France. ACM, New York, NY,USA, 10 pages. https://doi.org/10.1145/3178876.3186129
1 INTRODUCTIONPolitical interaction has long constituted a key use of social media,and there is a correspondingly rich history of research into itsstructure — one that extends the much longer history of scholarshipon the role of media in the political process [6, 14, 23, 25].
A crucial issue in this line of work is the extent to which politicalinteraction on social media takes place primarily among users whoare ideologically similar, or whether it reaches across the politicalspectrum. Early analysis of political blogging indicated a clusteredstructure, with a high density of linkage among ideologically similarblogs and a lower density of linkage between blogs with stronglydiffering views [1]. Subsequent work, looking at platforms thatarose further into the evolution of social media, suggested that amore complex structure was developing, in which homophily inviews remained a powerful force, but where the platforms wereproviding users with some level of cross-cutting exposure [3, 4].
This paper is published under the Creative Commons Attribution 4.0 International(CC BY 4.0) license. Authors reserve their rights to disseminate the work on theirpersonal and corporate Web sites with the appropriate attribution.WWW 2018, April 23–27, 2018, Lyon, France© 2018 IW3C2 (International World Wide Web Conference Committee), publishedunder Creative Commons CC BY 4.0 License.ACM ISBN 978-1-4503-5639-8/18/04.https://doi.org/10.1145/3178876.3186129
These questions are important, as they ask whether online politicalinteraction consists of opposing sides who engage with each other,or well-separated clusters who are isolated in “echo chambers” or“filter bubbles” [11, 27, 30].
The answers to such questions depend intrinsically on whichtypes of interactions are being considered. Existing work in theonline domain has implicitly focused on two standard forms of in-teraction: page-to-page interaction, expressed by hyperlinks amongdocuments [1]; and user-to-user interaction, expressed by commu-nication among people on social platforms [3, 4, 9]. Each of theseinduces a network on a set of entities — sources and users respec-tively — which can then be analyzed relative to an underlyingpolitical spectrum.
Networks of sources invoked by users. Here we consider adifferent type of political interaction network, defined as follows.When a user u shares a page A, and a user v replies by sharing apage B, there is not simply an interaction between users u and v;an interaction is also induced between pages A and B. As resharesdevelop into a widespread style of social media content production[8, 10, 17, 24], the ability of users to deploy page references asproxies in their discussion becomes an activity requiring very loweffort, and we find through a large-scale analysis of Twitter dataleading up to the 2016 U.S. Presidential election that such A-Binteractions are widespread: users regularly invoke links in thisback-and-forth fashion when they interact with each other.
These invoked interactions between pagesA and B are fundamen-tally different from both user-to-user and page-to-page interactionnetworks. Unlike free-form user-to-user interactions, they createlogical relationships among the information sources, not just theconsumers and sharers of these sources. But they are not like tradi-tional page-to-page interactions either, because they are not basedon a hyperlink from A to B, and they are not in general determinedby the authors of either A or B; it is the readers deciding how A andB should be used in discussion who are determining the logical linkbetween them. In this sense, invoked interactions between A and Bare not directly under the control of the authors of A and B; theyform a kind of “revealed interpretation” of A and B once they arereleased into social media.
The idea that replying to page A with page B can create a se-mantically meaningful connection between A and B formed thebasis of an elegant technique due to Frigerri, Adamic, Eckles, andCheng [12] for identifying pages to debunk widely circulated ru-mors. Drawing on the fact that snopes.com is a heavily-used sitefor evaluating Internet rumors, they demonstrated that many in-stances of a pair (B,A), where A is a page appearing in Facebookposts and B is a page on snopes.com, serves as strong evidencethat B is providing a judgment on the credibility of A. In this way,scanning the replies to posts where A occurs for pages residing onsnopes.com provides an automated method for identifying a pageB that can help users evaluate the veracity of A.
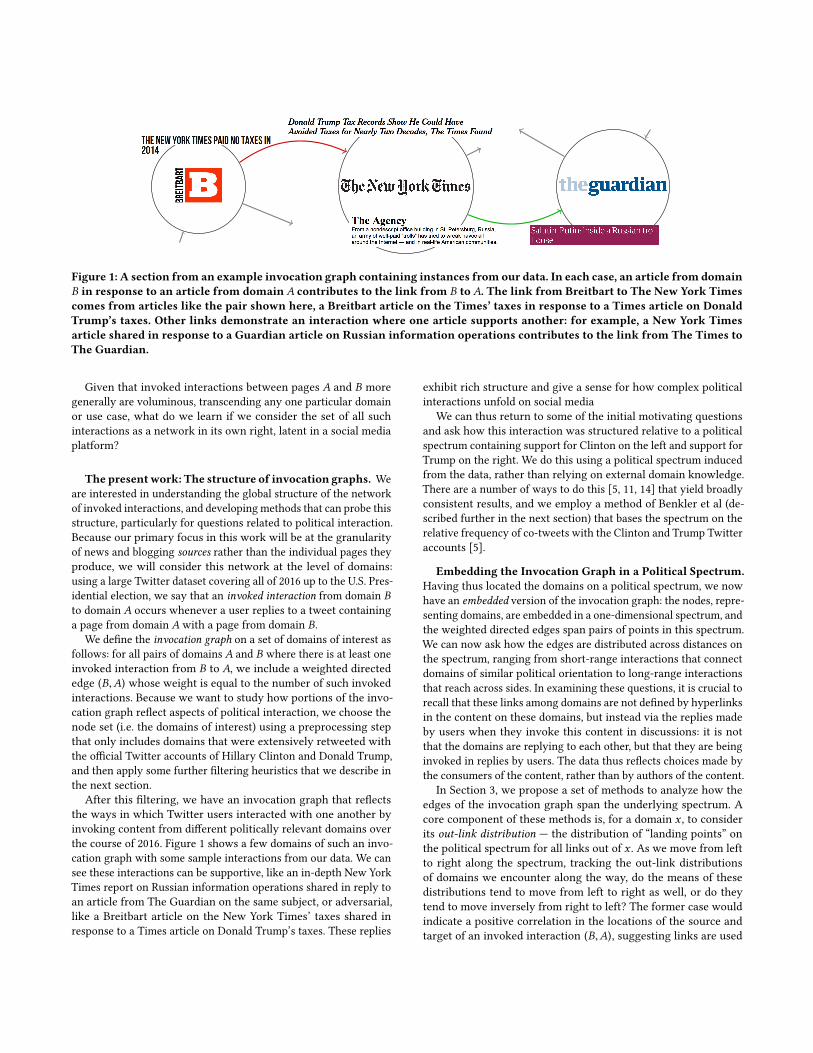
Figure 1: A section from an example invocation graph containing instances from our data. In each case, an article from domainB in response to an article from domain A contributes to the link from B to A. The link from Breitbart to The New York Timescomes from articles like the pair shown here, a Breitbart article on the Times’ taxes in response to a Times article on DonaldTrump’s taxes. Other links demonstrate an interaction where one article supports another: for example, a New York Timesarticle shared in response to a Guardian article on Russian information operations contributes to the link from The Times toThe Guardian.
Given that invoked interactions between pages A and B moregenerally are voluminous, transcending any one particular domainor use case, what do we learn if we consider the set of all suchinteractions as a network in its own right, latent in a social mediaplatform?
The presentwork: The structure of invocation graphs. Weare interested in understanding the global structure of the networkof invoked interactions, and developing methods that can probe thisstructure, particularly for questions related to political interaction.Because our primary focus in this work will be at the granularityof news and blogging sources rather than the individual pages theyproduce, we will consider this network at the level of domains:using a large Twitter dataset covering all of 2016 up to the U.S. Pres-idential election, we say that an invoked interaction from domain Bto domain A occurs whenever a user replies to a tweet containinga page from domain A with a page from domain B.
We define the invocation graph on a set of domains of interest asfollows: for all pairs of domains A and B where there is at least oneinvoked interaction from B to A, we include a weighted directededge (B,A) whose weight is equal to the number of such invokedinteractions. Because we want to study how portions of the invo-cation graph reflect aspects of political interaction, we choose thenode set (i.e. the domains of interest) using a preprocessing stepthat only includes domains that were extensively retweeted withthe official Twitter accounts of Hillary Clinton and Donald Trump,and then apply some further filtering heuristics that we describe inthe next section.
After this filtering, we have an invocation graph that reflectsthe ways in which Twitter users interacted with one another byinvoking content from different politically relevant domains overthe course of 2016. Figure 1 shows a few domains of such an invo-cation graph with some sample interactions from our data. We cansee these interactions can be supportive, like an in-depth New YorkTimes report on Russian information operations shared in reply toan article from The Guardian on the same subject, or adversarial,like a Breitbart article on the New York Times’ taxes shared inresponse to a Times article on Donald Trump’s taxes. These replies
exhibit rich structure and give a sense for how complex politicalinteractions unfold on social media
We can thus return to some of the initial motivating questionsand ask how this interaction was structured relative to a politicalspectrum containing support for Clinton on the left and support forTrump on the right. We do this using a political spectrum inducedfrom the data, rather than relying on external domain knowledge.There are a number of ways to do this [5, 11, 14] that yield broadlyconsistent results, and we employ a method of Benkler et al (de-scribed further in the next section) that bases the spectrum on therelative frequency of co-tweets with the Clinton and Trump Twitteraccounts [5].
Embedding the Invocation Graph in a Political Spectrum.Having thus located the domains on a political spectrum, we nowhave an embedded version of the invocation graph: the nodes, repre-senting domains, are embedded in a one-dimensional spectrum, andthe weighted directed edges span pairs of points in this spectrum.We can now ask how the edges are distributed across distances onthe spectrum, ranging from short-range interactions that connectdomains of similar political orientation to long-range interactionsthat reach across sides. In examining these questions, it is crucial torecall that these links among domains are not defined by hyperlinksin the content on these domains, but instead via the replies madeby users when they invoke this content in discussions: it is notthat the domains are replying to each other, but that they are beinginvoked in replies by users. The data thus reflects choices made bythe consumers of the content, rather than by authors of the content.
In Section 3, we propose a set of methods to analyze how theedges of the invocation graph span the underlying spectrum. Acore component of these methods is, for a domain x , to considerits out-link distribution — the distribution of “landing points” onthe political spectrum for all links out of x . As we move from leftto right along the spectrum, tracking the out-link distributionsof domains we encounter along the way, do the means of thesedistributions tend to move from left to right as well, or do theytend to move inversely from right to left? The former case wouldindicate a positive correlation in the locations of the source andtarget of an invoked interaction (B,A), suggesting links are used

to connect to similar sides of the political spectrum; the latter casewould correspond to a negative correlation and hence connectionsacross the spectrum, with domains on the left being invoked toreply to domains on the right, and vice versa.
It is not a priori obvious which type of correlation we shouldexpect to see; and as a reinforcement of this fact, we find that thenature of the correlation actually inverts over the course of 2016leading up to the U.S. Presidential election. In the early parts of2016 we have a positive correlation, with politically similar domainsbeing invoked to reply to each other; but by the time we reachthe months directly preceding the election, this same correlationmeasure has become negative, indicating that most of the linkingis now crossing the spectrum. We verify this effect using multiplemeasures, including one in which we compare the trends acrossthe spectrum to what we’d observe in a randomly rewired versionof the embedded graph.
We also propose a set of methods to identify inherent asymme-tries in the patterns of linkage: do replies from left to right have thesame structure as replies from right to left? Using our measures, wefind strong asymmetries in the 2016 Twitter data, with domains onthe right side of the spectrum having a disproportionately high rateof out-links in the invocation graph and domains on the left sideof the spectrum having a disproportionately high rate of in-links.This right-to-left flow in the replies persists across the entire timerange, and is a key characteristic of the structure.
Since a recurring theme in our analyses is the way in whichreplies increasingly engaged opposite sides of the political spectrumas 2016 went on, it is interesting to ask whether we see a similareffect in a more traditional user-to-user interaction graph, withnodes corresponding to users and directed edges to replies from oneuser to another. To explore this, we adapt the techniques developedfor the invocation graph to a user-to-user graph built from Reddit.Specifically, we analyze a snapshot of Reddit’s politics subreddit,r/politics, for the same period of 2016 up to the election; weclassify users by whether they had posted to the Clinton or Trumpsubreddits, and then look at the rate of replies among differenttypes of users. We find that the trend on Reddit closely tracks thetrend in the invocation graph built from Twitter, with increasinglinkage between the two sides as the election approached.
Overall, our methodology suggests that the invocation graphon domains, and its embedding into a one-dimensional spectrum,captures important aspects of political interaction on social media— the tendency of users to interact by invoking links to authoredcontent, and the use of these interaction patterns to thus revealrelationships among the content based on usage in everyday dis-cussion.
2 BASIC DEFINITIONSWe begin with a Twitter dataset containing aggregate-level infor-mation about tweet-reply pairs. For each month from January toNovember 2016 (the US Presidential election was held on Novem-ber 8, 2016), the dataset consists of pairs of domains x1 and x2along with an accompanying count, the number of times a tweetcontaining a page from domain x1 was posted in reply to a tweetcontaining a page from domain x2. In addition, for each month, wehave an auxiliary dataset of co-occurrences: for each domain x , the
number of times a user posted a tweet containing a page from x onthe same day that the user retweeted Hillary Clinton’s or DonaldTrump’s personal Twitter account. Finally, we have the number ofretweets of Clinton or Trump for each month.
The invocation graph we construct from this data is a directedgraph with domains as vertices, where each domain correspondsto a news source. We draw an edge x1 → x2 if a tweet containinga URL from domain x1 is posted in reply to a tweet containing aURL from domain x2. The weight of this edge is the number of suchtweet-reply pairs. On first inspection, the most prominent featureof this graph is that self-loops (consisting of links from a domain xto itself) have much higher weight than other edges. Since our goalis to examine political interactions between domains, we removeall self-loops from the graph.
Isolating Political Domains. The first issue we encounter isthat Twitter contains a wide range of URLs, not just pages frompolitically relevant domains. We could select only known politicaldomains by whitelisting them, i.e. only considering the subgraphover a predefined set of domains; however, this approach will in-evitably miss out on influential but less well-known news sources.
On the other hand, there are challenges to a completely unsu-pervised approach. URLs on Twitter are dominated by social mediasites (e.g. twitter.com, facebook.com) as well as content-hostingsites (e.g. imgur.com, bitly.com) which produce virtually no contentof their own, but instead host user-uploaded content such as im-ages, links, and text. While the usage of these content-hosting siteswould be interesting to study, this is outside the scope of our work.
We begin by blacklisting several known social media and content-hosting domains and remove them from the graph. However, thereare plenty of domains that appear on Twitter that are not politicallyrelevant, and we cannot individually remove each such domain.To filter out such domains, we need some measure of politicalengagement for each domain. We can construct such a measureby using the observation that politically relevant domains shouldfrequently co-occur with known political entities – in our case, theofficial Twitter accounts of Hillary Clinton and Donald Trump.
Our measure of political engagement for a domain, then, is sim-ply the number of times a user posted a tweet with that domain onthe same day that he or she retweeted either Clinton’s or Trump’sofficial Twitter account. Intuitively, the more politically engaginga domain is, the more it will co-occur with these political enti-ties. With this proxy, we can select domains with high politicalengagement, excluding social-media and content-hosting domains.
As a final filter, we require that each domain have an edge of atweight leastW to some other domain in the political subgraph. Thisrestricts our attention to the most actively used political domains.Based on this, we can formally define the invocation graph. Everydomain in the invocation graph
• is not blacklisted (social media and content-hosting domains)• has political engagement above some threshold p• has at least one edge to another domain in the invocationgraph with weight at leastW
We require the invocation graph be connected and contain someseed domain. Any choice of popular American news outlet would
yield exactly the same result, as they all belong to the same con-nected component. (We use nytimes.com, but the choice is immate-rial.)
Based on this definition, the algorithm to construct the invoca-tion graph is as follows: begin with the full graph, remove all nodesthat are either blacklisted or have political engagement below p,and run a breadth-first search beginning at nytimes.com followingonly edges of weight at leastW . In practice, we find that the valueswe use for p andW don’t affect our results much, and all of theresults presented here use p = 10000 andW = 100. Because westudy the change in this invocation graph over time, we build anew graph Gm for each monthm from January to November 2016.
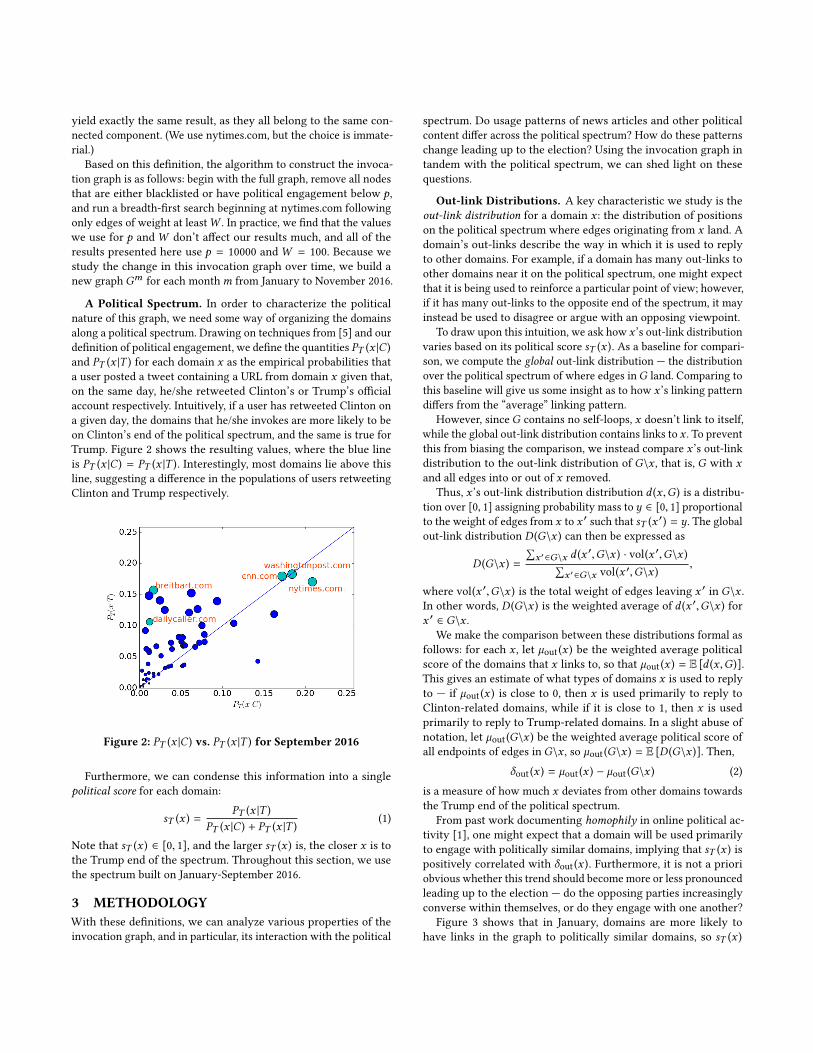
A Political Spectrum. In order to characterize the politicalnature of this graph, we need some way of organizing the domainsalong a political spectrum. Drawing on techniques from [5] and ourdefinition of political engagement, we define the quantities PT (x |C )and PT (x |T ) for each domain x as the empirical probabilities thata user posted a tweet containing a URL from domain x given that,on the same day, he/she retweeted Clinton’s or Trump’s officialaccount respectively. Intuitively, if a user has retweeted Clinton ona given day, the domains that he/she invokes are more likely to beon Clinton’s end of the political spectrum, and the same is true forTrump. Figure 2 shows the resulting values, where the blue lineis PT (x |C ) = PT (x |T ). Interestingly, most domains lie above thisline, suggesting a difference in the populations of users retweetingClinton and Trump respectively.
Figure 2: PT (x |C ) vs. PT (x |T ) for September 2016
Furthermore, we can condense this information into a singlepolitical score for each domain:
sT (x ) =PT (x |T )
PT (x |C ) + PT (x |T )(1)
Note that sT (x ) ∈ [0, 1], and the larger sT (x ) is, the closer x is tothe Trump end of the spectrum. Throughout this section, we usethe spectrum built on January-September 2016.
3 METHODOLOGYWith these definitions, we can analyze various properties of theinvocation graph, and in particular, its interaction with the political
spectrum. Do usage patterns of news articles and other politicalcontent differ across the political spectrum? How do these patternschange leading up to the election? Using the invocation graph intandem with the political spectrum, we can shed light on thesequestions.
Out-link Distributions. A key characteristic we study is theout-link distribution for a domain x : the distribution of positionson the political spectrum where edges originating from x land. Adomain’s out-links describe the way in which it is used to replyto other domains. For example, if a domain has many out-links toother domains near it on the political spectrum, one might expectthat it is being used to reinforce a particular point of view; however,if it has many out-links to the opposite end of the spectrum, it mayinstead be used to disagree or argue with an opposing viewpoint.
To draw upon this intuition, we ask how x ’s out-link distributionvaries based on its political score sT (x ). As a baseline for compari-son, we compute the global out-link distribution — the distributionover the political spectrum of where edges inG land. Comparing tothis baseline will give us some insight as to how x ’s linking patterndiffers from the “average” linking pattern.
However, since G contains no self-loops, x doesn’t link to itself,while the global out-link distribution contains links to x . To preventthis from biasing the comparison, we instead compare x ’s out-linkdistribution to the out-link distribution of G\x , that is, G with xand all edges into or out of x removed.
Thus, x ’s out-link distribution distribution d (x ,G ) is a distribu-tion over [0, 1] assigning probability mass to y ∈ [0, 1] proportionalto the weight of edges from x to x ′ such that sT (x ′) = y. The globalout-link distribution D (G\x ) can then be expressed as
D (G\x ) =
∑x ′∈G\x d (x
′,G\x ) · vol(x ′,G\x )∑x ′∈G\x vol(x ′,G\x )
,
where vol(x ′,G\x ) is the total weight of edges leaving x ′ in G\x .In other words, D (G\x ) is the weighted average of d (x ′,G\x ) forx ′ ∈ G\x .
We make the comparison between these distributions formal asfollows: for each x , let µout (x ) be the weighted average politicalscore of the domains that x links to, so that µout (x ) = E [d (x ,G )].This gives an estimate of what types of domains x is used to replyto — if µout (x ) is close to 0, then x is used primarily to reply toClinton-related domains, while if it is close to 1, then x is usedprimarily to reply to Trump-related domains. In a slight abuse ofnotation, let µout (G\x ) be the weighted average political score ofall endpoints of edges in G\x , so µout (G\x ) = E [D (G\x )]. Then,
δout (x ) = µout (x ) − µout (G\x ) (2)
is a measure of how much x deviates from other domains towardsthe Trump end of the political spectrum.
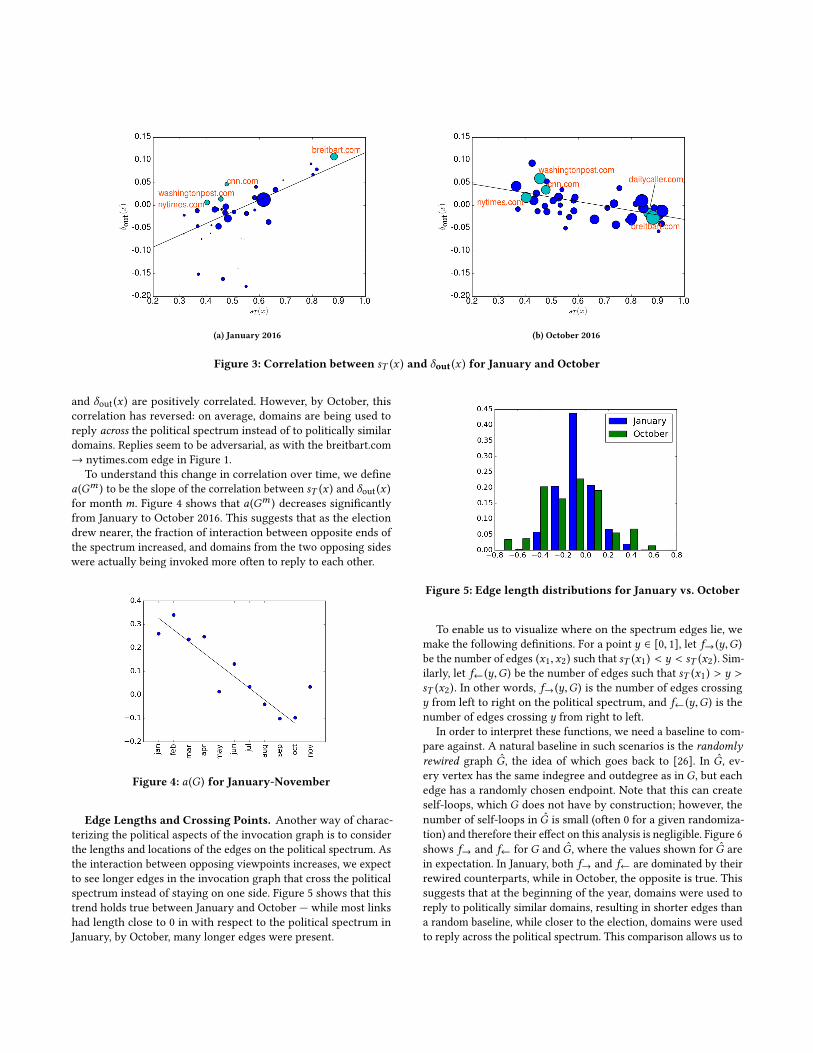
From past work documenting homophily in online political ac-tivity [1], one might expect that a domain will be used primarilyto engage with politically similar domains, implying that sT (x ) ispositively correlated with δout (x ). Furthermore, it is not a prioriobvious whether this trend should become more or less pronouncedleading up to the election — do the opposing parties increasinglyconverse within themselves, or do they engage with one another?
Figure 3 shows that in January, domains are more likely tohave links in the graph to politically similar domains, so sT (x )
(a) January 2016 (b) October 2016
Figure 3: Correlation between sT (x ) and δout (x ) for January and October
and δout (x ) are positively correlated. However, by October, thiscorrelation has reversed: on average, domains are being used toreply across the political spectrum instead of to politically similardomains. Replies seem to be adversarial, as with the breitbart.com→ nytimes.com edge in Figure 1.
To understand this change in correlation over time, we definea(Gm ) to be the slope of the correlation between sT (x ) and δout (x )for month m. Figure 4 shows that a(Gm ) decreases significantlyfrom January to October 2016. This suggests that as the electiondrew nearer, the fraction of interaction between opposite ends ofthe spectrum increased, and domains from the two opposing sideswere actually being invoked more often to reply to each other.
Figure 4: a(G ) for January-November
Edge Lengths and Crossing Points. Another way of charac-terizing the political aspects of the invocation graph is to considerthe lengths and locations of the edges on the political spectrum. Asthe interaction between opposing viewpoints increases, we expectto see longer edges in the invocation graph that cross the politicalspectrum instead of staying on one side. Figure 5 shows that thistrend holds true between January and October — while most linkshad length close to 0 in with respect to the political spectrum inJanuary, by October, many longer edges were present.
Figure 5: Edge length distributions for January vs. October
To enable us to visualize where on the spectrum edges lie, wemake the following definitions. For a point y ∈ [0, 1], let f→ (y,G )be the number of edges (x1,x2) such that sT (x1) < y < sT (x2). Sim-ilarly, let f← (y,G ) be the number of edges such that sT (x1) > y >sT (x2). In other words, f→ (y,G ) is the number of edges crossingy from left to right on the political spectrum, and f← (y,G ) is thenumber of edges crossing y from right to left.
In order to interpret these functions, we need a baseline to com-pare against. A natural baseline in such scenarios is the randomlyrewired graph G, the idea of which goes back to [26]. In G, ev-ery vertex has the same indegree and outdegree as in G, but eachedge has a randomly chosen endpoint. Note that this can createself-loops, which G does not have by construction; however, thenumber of self-loops in G is small (often 0 for a given randomiza-tion) and therefore their effect on this analysis is negligible. Figure 6shows f→ and f← for G and G, where the values shown for G arein expectation. In January, both f→ and f← are dominated by theirrewired counterparts, while in October, the opposite is true. Thissuggests that at the beginning of the year, domains were used toreply to politically similar domains, resulting in shorter edges thana random baseline, while closer to the election, domains were usedto reply across the political spectrum. This comparison allows us to

(a) January 2016 (b) October 2016
Figure 6: f→ (y) and f← (y) for G and G
get a sense for how actual behavior deviates from random behavior,and how this deviation changes over time.
Asymmetry in Out-links. Another striking feature of Figure 6is that f← dominates f→, showing that many more links crossedright-to-left than left-to-right. Intuitively, it seems that a dispropor-tionate number of edges originate on the right and end on the left,corresponding to right-leaning domains being used to reply to left-leaning domains. We can make this precise by defining r (x ) as theratio of indegree(x )/(indegree(x ) + outdegree(x )) and analyzinghow r (x ) changes with sT (x ). Figure 7 shows that r (x ) is negativelycorrelated with sT (x ), meaning that domains on the right end ofthe political spectrum produce a disproportionate number of out-links compared to domains on the left end. In other words, domainson the right are more often used to reply to other domains, whiledomains on the left are more often the recipients of replies.
Figure 7: sT (x ) vs. r (x ) for October
4 COMPARING TO THE USER LEVELHaving established a set of results for the structure of invocationgraphs on Twitter, we would like to verify that our findings are
qualitatively consistent with what we see in more traditional user-to-user communication graphs on social media. Since our Twitterdataset doesn’t contain information about individual users, weinstead turn to a publicly available Reddit dataset1. Reddit is a com-munity discussion website organized into posts, or “submissions,”and comments on those submissions. Comments are threaded, sothat a comment is either in reply to a top-level post or to anothercomment. The data consists of every post and comment from Red-dit in 2016, along with its author’s username. Reddit is subdividedinto forums for particular topics called subreddits. We focus onthree subreddits in particular: r/politics, r/hillaryclinton,and r/The_Donald, which are devoted to politics, Hillary Clinton,and Donald Trump respectively. All three subreddits were amongthe most active subreddits during 2016. Note that in addition tostudying user-to-user dynamics on Reddit, in principle we couldalso use Reddit data to replicate our Twitter invocation-graph anal-ysis at the domain level; however, it turns out that Reddit containstoo few comments with URLs for robust domain-level trends toemerge.
Interactions at the User Level. In order to test for analogoustrends at the user level to those we found at the domain level, weneed to modify our methods. In particular, we now need somekind of political information about users. Whereas in Section 2 weanchored the political spectrum to the official Clinton and TrumpTwitter accounts, here we anchor our notion of political affiliationsto r/hillaryclinton and r/The_Donald. Since most users areactive in at most one of the two subreddits, we have a simplernotion of a political score: we define a setUC of users who posted inr/hillaryclinton but not r/The_Donald, and we define a setUTof users who posted in r/The_Donald but not r/hillaryclinton.There are 22,164 users in UC and 281,334 users in UT (more thanten times the size ofUC ). We assume that most users inUC are pro-Clinton, while most users inUT are pro-Trump (this is consistentwith the explicit ground rules for participating in these subreddits).
1https://files.pushshift.io/reddit/

Twitter Reddit1 donaldjtrump.com thegatewaypundit.com2 thegatewaypundit.com zerohedge.com3 breitbart.com breitbart.com4 dailycaller.com donaldjtrump.com5 zerohedge.com dailycaller.com6 foxnews.com dailymail.co.uk7 nypost.com foxnews.com8 dailymail.co.uk nypost.com9 thehill.com bbc.co.uk10 politico.com theguardian.com11 cbsnews.com cbsnews.com12 nbcnews.com cnn.com13 cnn.com thehill.com14 washingtonpost.com nbcnews.com15 bbc.co.uk huffingtonpost.com16 theguardian.com washingtonpost.com17 nytimes.com nytimes.com18 huffingtonpost.com politico.com19 politifact.com newsweek.com20 newsweek.com politifact.com21 hillaryclinton.com hillaryclinton.com
Table 1: Comparison of Twitter and Reddit political spectra
Validating Political Information from Subreddits. We ver-ify that r/hillaryclinton and r/The_Donald contain strong sig-nal about political orientation by adapting our methodology fromTwitter to build a spectrum over the domains on Reddit, and thencomparing this spectrum to the one built from Twitter. To do this,we define PR (x |C ) to be the empirical probability that a post orcomment in r/hillaryclinton contains a URL from domain x(and analogously for PR (x |T ) and r/The_Donald). As in (1), we candefine a political score from Reddit as
sR (x ) =PR (x |T )
PR (x |C ) + PR (x |T ). (3)
Table 1 shows the orderings of the Twitter and Reddit spectrafor 21 domains. The Spearman rank correlation [28] (a measure ofsquared distance) between the two orderings is 0.871 (comparedto a maximum of 0.757 over 10, 000 randomly shuffled orderings).Thus the two settings align well, demonstrating that our notionof political affiliation is adaptable to Reddit, and that it containsstrong and consistent signal.
Building a User-to-User Graph on Reddit. With this notionof political affiliation, we can now investigate some basic prop-erties of political discourse on Reddit. Just as we first restrictedour attention to political domains on Twitter, here we restrict ourattention to the main political subreddit r/politics. Since only asubset of the users in r/politics are in eitherUC orUT , we focuson comment-reply pairs in which both users involved are in oneof UC or UT . There are 4 possible types of interaction: UC → UC ,UC → UT , UT → UC , and UT → UT where p → q means that auser from p posts a reply to a comment from a user in q. Let np→qbe the number of p → q interactions in a given time period. Weorganize the data into sliding windows of 30 days. In the followingplots, the value at a particular date represents the 30-day windowending at that date. Figure 8a shows comment counts throughout
2016 averaged over the next 30 days, and Figure 8b shows whatfraction of the comments were each type of interaction.
Figure 8b shows that a steadily rising number of comments arecross-cutting (e.g., are of types UC → UT andUT → UC ) from thebeginning of 2016 up until the election in early November, followedby a return to a baseline rate. Figure 8c further reinforces this point,showing a strong negative slope in the ratio of edges betweenusers of the same political leaning and users of different politicalleanings from January until the November 8 election. These resultsare consistent with our findings our Twitter, where an increasingfraction of political interactions reach across the political spectrumon Twitter up until the election.
To interpret the significance of these results, we adapt our ran-dom rewiring technique to the user level by randomly reassign-ing users to comments, preserving the invariant that each userstill posts the same number of comments as in the original data.Whether we randomize globally (a comment is randomly attrib-uted to any user from all of 2016) or each month (a comment isattributed to a randomly chosen user from the same month thatcomment was written), the results are the same – the observedslope is significantly more negative than the minimum over 100random trials.
Using our Reddit dataset, we’ve shown that our invocation graphmethodology can be adapted to analyze traditional user-user com-munication graphs. In particular, we’ve used co-occurrences todetermine political information about both users and domains. Themonth-to-month trend found at the user level mirrors our findingson Twitter — in the months leading up to the election, online polit-ical interaction increasingly reached across the political spectrum.
5 TWO-DIMENSIONAL ALIGNMENTOur formulation of the political spectrum in this work indicatesthat it has a natural two-dimensional structure, with one dimensioncorresponding to co-occurrence probabilities with content relatedto one candidate, and the other dimension corresponding to co-occurrence probabilities with content related to the other candidate.
In Section 4, when we established that our invocation graphmethodology extends naturally to the traditional user-level set-ting, part of our analysis involved measuring how well the one-dimensional spectra sT (·) and sR (·) shown in Table 1 align. Herewe consider how to measure the alignment of the correspondingtwo-dimensional spectra.
To make this comparison, we need to account for the fact thataxes may have different scales (e.g. posts on Reddit contain URLsat a different rate than on Twitter). This means we need to scalePR (x |C ) and PR (x |T ) in order to find the “best match” betweenthe two spectra. We formalize this as the following optimizationproblem, minimizing the squared ℓ2 distance of each pair of points:
mina,b :a,b≥0
∑x ∈D
(PT (x |C )−aPR (x |C ))2+ (PT (x |T )−bPR (x |T ))
2 (4)
where D is the set of domains. Since all points lie in the first quad-rant, we can drop the constraint a,b ≥ 0. Note that (4) can beseparated into 2 identical optimization problems of the form
minc
∑x ∈D
(ux − cvx )2. (5)

(a) Comment counts (b) Interaction types (c) Ratio of replies across the political spectrum
Figure 8: User-level trends from the Reddit dataset. In Figure 8c, a decrease in (nC→C + nT→T )/(nC→T + nT→C ) shows moreinteraction reaching across the spectrum.
If u and v are the vectors [ux : x ∈ D]⊤ and [vx : x ∈ D]⊤respectively, then this can be written asminc
∑x ∈D ∥u−cv ∥
22 . This
is convex and has derivatived
dc∥u − cv ∥22 =
d
dc(u − cv )⊤ (u − cv ) = 2v⊤u − 2cv⊤v .
Setting this equal to 0, we find that (5) has the solution c = v⊤uv⊤v .
Using this, we can scale the Reddit spectrum to compare it tothe Twitter spectrum, producing the plot shown in Figure 9. Thespectra roughly align, with the domains in approximately the samepositions for both Twitter and Reddit.
Figure 9: Scaled spectrum comparison
If instead we wish to minimize ℓ1 distance between pairs ofpoints, we get the optimization problem
mina,b :a,b≥0
∑x ∈D|PT (x |C ) − aPR (x |C ) | + |PT (x |T ) − bPR (x |T ) | (6)
Again, this results in two separate optimizations of the form
minc
∑x ∈D|ux − cvx |. (7)
The subgradient of each term is
{vx · sign(cvx − ux )} ux , cvx
[−vx ,vx ] otherwise
We sort the x ’s by increasing ux /vx , so i < j =⇒ uxi /vxi ≤ux j /vx j , and then choose i such that∑
j≤ivx j >
∑j>i
vx j and∑j<i
vx j <∑j≥i
vx j .
Essentially, i balances the vx j ’s, splitting them into two sets suchthat addingvxi to either set gives that set the larger sum of the two.Thus, the subgradient of (7) contains 0 for c = uxi
vxi, making this the
solution to (6).We can also use this same alignment technique to compare spec-
tra between months. Figures 10a and 10b show that in absoluteterms, the spectra produced by January and February on Twitterlook quite different. In fact, after scaling the axes, the spectra alignvery well (Figure 10c, using ℓ1-minimization). One way to see thisis to compare the quality of alignment in our data the quality ofalignment among shuffled versions of the spectra for January andFebruary, where the domains labeling the points are randomly per-muted; we find that the alignment for the real data has much lowercost than the typical alignment for shuffled data. The disparitybetween the unscaled spectra seems to indicate an influx of usersin February who retweeted Clinton but didn’t necessarily engagein other sorts of political activity; this left the relative position ofother domains in the two-dimensional spectrum unaffected.
We also note this type of scaling doesn’t affect the one-dimensionalorderings in Table 1. We can rewrite the political score as sT (x ) =
11+tan θT , where θT is the angle of x from the PT (x |C ) axis. Sincescaling the axes preserves the ordering of these angles, it also pre-serves the one-dimensional rankings.
6 FURTHER RELATEDWORKOur work builds on rich literatures in online social media, onlinenews, information diffusion, and the landscape of online politicalinteraction, and it also draws on a long history of work studyingthe role of media in politics.
With access to information now abundant, a growing line ofwork has investigated how this impacts consumption of politicalinformation. As mentioned in the introduction, a key issue has beenmeasuring the extent to which online political interaction crossesideological divides, or whether it stays relatively confined in “filter

(a) January 2016 (b) February 2016 (c) Scaled Comparison
Figure 10: Spectrum Comparison for January and February 2016 on Twitter
bubbles” or “echo chambers” [3, 11, 13, 15, 27, 31]. Concerns aboutthe Web potentially catalyzing balkanization, or fragmentation intoisolated ideological divisions, date from the 1990s [32]. Early em-pirical work on the structure of online political interaction throughblogging identified strong ideological partitions evident in large-scale analysis of linking patterns [1], whereas analyses of morerecent social media platforms finds evidence for a more complexstructure, in which both ideological entrenchment and exposure tomore diverse content is promoted on the Web [3, 11].
More broadly, our paper relates to the extensive work on thestructure of information sharing on the Web [4], as well as theoreti-cal work on how network structure affects information flow [18, 20].This structure has been quantified in many ways, particularly by or-ganizing shares into information cascades [8, 17], where nodes aretypically people and edges between people indicate if one persondirectly shared a piece of content with another person. In contrast,our work here introduces and studies invocation graphs, wherenodes are information sources and edges indicate that a user sharedcontent from one source in response to content from another source.
The role of the media in politics is the subject of an active fieldof study [19, 29]. Particularly relevant to our work here is the studyof how news and public opinion spread through social networks,including the early theory of two-step flow [21]. More recently,there has been a spirited debate about the impact that “influencers”have on these processes [2, 7, 16, 22, 33].
7 CONCLUSIONIn this work we have introduced invocation graphs, together witha set of techniques for analyzing them, as a means of probingthe structure of online political interaction. In combination withprevious methods for inducing a political spectrum from data, wedevelop methods for measuring several important phenomena. Inparticular, we analyzed a natural embedding of the invocation graphin the political spectrum, and asked how its edges are distributedacross this spectrum—whether they are sequestered in ideologicalpockets or whether they span larger ideological distances. Applyingthese techniques to political interaction on Twitter in the monthsleading up to the 2016 US Presidential election, we observed thatpolitical interaction via the invocation graph became increasinglycross-cutting as the election neared. We also developed methodsto analyze whether there are inherent asymmetries between how
the right and the left engage each other via replies. Applying ourtechniques to Twitter, we found that edges in in the invocationgraph more consistently went from sources on the right to sourceson the left than in the other direction.
It is worth emphasizing a critical feature of invocation graphs,which is that they are composed of invoked interactions as opposedto direct interactions. Although on a surface level invocation graphsmay resemble the hyperlink graphs that form a basic staple of Webanalysis, they are actually quite different, as the links are generallynot under the nodes’ control. News sources publish content, andthen it is up to the readership to determine how these sourcesconnect to each other in the invocation graph. In this sense, relativepositions and functions of news domains in invocation graphs areindicative of how the public actually uses them in online politicaldiscussion. Beyond the ideological territory news sources may tryto explicitly claim for themselves, invocation graphs position thesesources according to their roles in political interaction.
There are a number of important directions that remain to bepursued. First, it is intriguing to see how interaction both in theinvocation graph on Twitter and the user-to-user interaction graphon Reddit became more and more ideologically cross-cutting asthe election approached, given that homophily would suggest thatmost links should link to nearby points on the spectrum. Is there asystematic way to relate this trend to an underlying level of polar-ization, so that changes in the structure of the embedded invocationgraph might provide insight into polarization and how it evolves?Second, beyond the two large social media datasets we considered,it would be illuminating to apply our methods in other settings aswell. In particular, does online debate increasingly cross ideologicaldivides in the run-up to milestone events in general, or was thisspecific to the 2016 US Presidential election? In general, we believethat applying and extending our methods for online political inter-action using invocation graphs contains many promising directionsfor future work.
Acknowledgements. We thank LadaAdamic, GlennAltschuler,Isabel Kloumann, and Michael Macy for valuable discussions aboutthese topics. MR is supported by an NSF Graduate Research Fellow-ship (DGE-1650441). JK is supported in part by a Simons InvestigatorAward, an AROMURI grant, and NSF grant 1741441. This work wasperformed in part while AA and MR were at Microsoft Research.

REFERENCES[1] Lada A. Adamic and Natalie Glance. 2005. The Political Blogosphere and the
2004 U.S. Election: Divided They Blog. In Proceedings of the 3rd InternationalWorkshop on Link Discovery (LinkKDD ’05). ACM, New York, NY, USA, 36–43.https://doi.org/10.1145/1134271.1134277
[2] Eytan Bakshy, Jake M Hofman, Winter A Mason, and Duncan J Watts. 2011.Everyone’s an influencer: quantifying influence on twitter. In Proceedings of thefourth ACM international conference on Web search and data mining. ACM, 65–74.
[3] Eytan Bakshy, Solomon Messing, and Lada A Adamic. 2015. Exposure to ideologi-cally diverse news and opinion on Facebook. Science 348, 6239 (2015), 1130–1132.
[4] Eytan Bakshy, Itamar Rosenn, Cameron A. Marlow, and Lada A. Adamic. 2012.The Role of Social Networks in Information Diffusion. In Proc. World Wide WebConference.
[5] Yochai Benkler, Robert Faris, Hal Roberts, and Ethan Zuckerman. 2017. Study:Breitbart-led right-wing media ecosystem altered broader media agenda.Columbia Journalism Review 1, 4.1 (2017), 7.
[6] W. Lance Bennett. 1996. News: The politics of illusion. Longman.[7] Meeyoung Cha, Hamed Haddadi, Fabricio Benevenuto, and P Krishna Gummadi.
2010. Measuring user influence in twitter: The million follower fallacy. ICWSM10, 10-17 (2010), 30.
[8] Justin Cheng, Lada A. Adamic, P. Alex Dow, Jon M. Kleinberg, and Jure Leskovec.2014. Can cascades be predicted?. In 23rd InternationalWorldWideWeb Conference,WWW ’14, Seoul, Republic of Korea, April 7-11, 2014. 925–936. https://doi.org/10.1145/2566486.2567997
[9] Michael Conover, Jacob Ratkiewicz, Matthew R. Francisco, Bruno Gonçalves,FilippoMenczer, and Alessandro Flammini. 2011. Political Polarization on Twitter.In Proceedings of the Fifth International Conference on Weblogs and Social Media,Barcelona, Catalonia, Spain, July 17-21, 2011. http://www.aaai.org/ocs/index.php/ICWSM/ICWSM11/paper/view/2847
[10] P. Alex Dow, Lada A. Adamic, and Adrien Friggeri. 2013. The Anatomy of LargeFacebook Cascades. In Proceedings of the Seventh International Conference onWeblogs and Social Media, ICWSM 2013, Cambridge, Massachusetts, USA, July 8-11,2013. http://www.aaai.org/ocs/index.php/ICWSM/ICWSM13/paper/view/6123
[11] Seth Flaxman, Sharad Goel, and Justin Rao. 2016. Filter Bubbles, Echo Chambers,and Online News Consumption. Public Opinion Quarterly 80 (2016).
[12] Adrien Friggeri, Lada A Adamic, Dean Eckles, and Justin Cheng. 2014. RumorCascades. In ICWSM.
[13] R Kelly Garrett. 2009. Echo chambers online?: Politically motivated selective expo-sure among Internet news users. Journal of Computer-Mediated Communication14, 2 (2009), 265–285.
[14] MatthewGentzkow and JesseM Shapiro. 2010. What drivesmedia slant? Evidencefrom US daily newspapers. Econometrica 78, 1 (2010), 35–71.
[15] Eric Gilbert, Tony Bergstrom, and Karrie Karahalios. 2009. Blogs are echo cham-bers: Blogs are echo chambers. In HICSS’09. 42nd Hawaii International Conferenceon System Sciences. IEEE, 1–10.
[16] Malcolm Gladwell. 2006. The tipping point: How little things can make a bigdifference. Little, Brown.
[17] Sharad Goel, Ashton Anderson, Jake M. Hofman, and Duncan J. Watts. 2016. TheStructural Virality of Online Diffusion. Management Science 62, 1 (2016), 180–196.https://doi.org/10.1287/mnsc.2015.2158
[18] Benjamin Golub and Matthew O Jackson. 2009. How homophily affects learningand diffusion in networks. (2009).
[19] Doris A Graber and Johanna Dunaway. 2017. Mass media and American politics.Cq Press.
[20] Matthew O Jackson and Leeat Yariv. 2006. Diffusion on social networks. Economiepublique/Public economics 16 (2006).
[21] Elihu Katz. 1957. The two-step flow of communication: An up-to-date report onan hypothesis. Public opinion quarterly 21, 1 (1957), 61–78.
[22] Elihu Katz and Paul Felix Lazarsfeld. 1966. Personal Influence, The part played bypeople in the flow of mass communications. Transaction Publishers.
[23] Bill Kovach and Tom Rosenstiel. 1999. Warp Speed: America in the Age of MixedMedia. Century Foundation Press.
[24] Ravi Kumar, Mohammad Mahdian, and Mary McGlohon. 2010. Dynamics ofConversations. In ACM SIGKDD International Conference on Knowledge Discoveryand Data Mining. 553–562.
[25] Paul F. Lazarsfeld, Bernard Berelson, and Hazel Gaudet. 1944. The People’s Choice:How the Voter Makes Up His Mind in a Presidential Campaign. Duell, Sloan, andPearce.
[26] Michael Molloy and Bruce Reed. 1995. A critical point for random graphs with agiven degree sequence. Random structures & algorithms 6, 2-3 (1995), 161–180.
[27] Eli Pariser. 2011. The Filter Bubble: What the Internet is Hiding from You. Viking.[28] Charles Spearman. 1904. The proof and measurement of association between
two things. The American journal of psychology 15, 1 (1904), 72–101.[29] John Street. 2010. Mass media, politics and democracy. Palgrave Macmillan.[30] Cass Sunstein. 2007. Republic.com. Princeton University Press.[31] Cass R Sunstein. 2001. Echo chambers: Bush v. Gore, impeachment, and beyond.
Princeton University Press Princeton, NJ.[32] Marshall Van Alstyne and Erik Brynjolfsson. 1996. Could the Internet balkanize
science? Science 274, 5292 (1996), 1479.[33] Duncan J Watts and Peter Sheridan Dodds. 2007. Influentials, networks, and
public opinion formation. Journal of consumer research 34, 4 (2007), 441–458.