mapping “the hunger games”: using location quotients … · u.s. bureau of labor statistics...
TRANSCRIPT

U.S. BUREAU OF LABOR STATISTICS Career Outlook
1
Mapping “The Hunger Games”: Using location quotients to find the Districts of PanemElizabeth Cross | February 2017
“…Panem, the country that rose up out of the ashes of a place that was once called North America.” –The Hunger Games (Scholastic Press)
In The Hunger Games, author Suzanne Collins never reveals the exact locations of the Districts of Panem. What if you could map them by using data from the U.S. Bureau of Labor Statistics (BLS)?
U.S. BUREAU OF LABOR STATISTICS Career Outlook
2
Fans of the popular The Hunger Games trilogy know that the stories are set in Panem, a futuristic area previously called North America, with a capital located somewhere in what was known as the Rockies. Panem is divided into districts, each of which has a primary industry. BLS employment data can help you solve the puzzle of where in North America those districts would be.
Keep reading to learn how to use BLS data to identify 12 districts of Panem. Because BLS data cover the United States, this article uses clues from U.S. locations rather than from North America as a whole.
Finding data: Total employment and location quotientsEach district’s primary industry offers the best evidence of its geographic location. To find where an industry has a high concentration of workers, look at employment data by industry and occupation. Industry employment data tell you how many workers are in a particular type of firm or group of firms; occupation employment data tell you how many workers do a similar set of tasks.
Two BLS sources of employment data that will help in your analysis are the Quarterly Census of Employment and Wages (QCEW) and the Occupational Employment Statistics (OES) programs. QCEW data show industry employment and are provided here at the county level. OES data for occupation employment are shown here for metropolitan and nonmetropolitan statistical areas.

U.S. BUREAU OF LABOR STATISTICS Career Outlook
3
Total employment. Total employment can show you where lots of workers are in an industry or occupation. But the total number employed also may highlight areas where there are a lot of workers in every industry or occupation, such as large cities. Identifying a large number of workers doesn’t give you enough information for locating the districts.
Instead, you want to find where there are high concentrations of workers in a particular industry or occupation compared with the nation as a whole. For that, you’ll need the location quotient.
Location quotient. The location quotient is a ratio of the percentage of workers in an industry or occupation in a certain area to the percentage of workers in that industry or occupation nationally. A location quotient greater than 1.0 indicates a higher-than-average concentration for an industry or occupation.
For example, according to the 2015 OES estimates, actors make up .0367 percent of national employment. However, more than one-third of all actor employment is concentrated in California and makes up .1103 percent of that state’s total employment. To calculate the location quotient for actors in California, you divide the percentage of the occupation’s employment in California (.1103) by the percentage of employment nationally (.0367) to get a ratio of 3.01—indicating a higher-than-average concentration of actors in California. (See illustration.)
Finding District 12: Coal mining“Even hundreds of years ago, they mined coal here.” –The Hunger Games
To use data to find the districts of Panem, you’ll need to look for areas with the highest location quotients for the industries and occupations associated with each district. Begin with the district in which Katniss Everdeen, the protagonist of The Hunger Games, lived.

U.S. BUREAU OF LABOR STATISTICS Career Outlook
4
Industry location quotients. Using QCEW annual averages for 2015, chart 1 ranks the counties with the highest location quotients for the coal mining industry. Mingo County, West Virginia, had the highest location quotient.
In the United States, there were 64,135 workers in the coal mining industry out of 139,491,699 total workers, or about .05 percent. In Mingo County, there were 1,216 workers in the coal mining industry out of 5,563 total workers. Thus, (1,216/5,563) × 100 percent, or about 22 percent, of the workers in Mingo County were employed in coal mining.

U.S. BUREAU OF LABOR STATISTICS Career Outlook
5
To get the location quotient, divide the percentage of workers in coal mining in Mingo County (22) by the percentage nationally (.05). The result is a ratio of 440. (The data used to calculate this number were rounded to simplify the math, so the value shown here differs from the value shown in chart 1.) In other words, Mingo County has more than 400 times the concentration of coal mining employment nationally.
Mapping the industry location quotients shows a concentration of coal mining in an area that encompasses Kentucky, West Virginia, and Pennsylvania. (See map.)

U.S. BUREAU OF LABOR STATISTICS Career Outlook
6
Occupation location quotients. In addition to using industry data to see where coal mining employment is concentrated, you can use occupation data to search for District 12. Occupation employment in the coal mining industry helps you find the occupation in which that industry is the largest employer.
As table 1 shows, nearly all mine shuttle car operators worked in the coal mining industry in 2015. Mine shuttle car operators use shuttle cars to transport materials in underground mines. Location quotients for mine shuttle car operators are a good indicator of where mining activity is concentrated.

U.S. BUREAU OF LABOR STATISTICS Career Outlook
7
Table 1. Occupations in which the coal mining industry is the largest employer, 2015
Occupation Percent of occupation in coal mining Total employment Employment in coal mining
Mine shuttle car operators 93.5 2,310 2,160
Roof bolters, mining 93.1 5,220 4,860
Loading machine operators, underground mining
60.7 3,210 1,950
Source: U.S. Bureau of Labor Statistics, Occupational Employment Statistics.
Using the 2015 OES estimates, chart 2 ranks the metropolitan and nonmetropolitan areas with the highest location quotients for mine shuttle car operators. With a location quotient of 163.50, the Southern West Virginia nonmetropolitan area had the highest location quotient for mine shuttle car operators. This nonmetropolitan area comprises many counties, including Mingo County.

U.S. BUREAU OF LABOR STATISTICS Career Outlook
8
Conclusion. On the basis of statistical evidence, District 12 is most likely located in an area comprising parts of Kentucky, West Virginia, and Pennsylvania. This tristate area is where employment in the coal mining industry and its associated occupations are concentrated.
Finding other districts: Your turnEvery district of Panem has a dominant industry. Profiles for each district use QCEW and OES data; links to these industry profiles for each district are given below. The data may provide clues, but results are open to interpretation. Using these data, create your own map of Panem.
“And may the odds be ever in your favor.” –The Hunger Games
District data linksDistrict 1: Luxury goods
District 2: Rock quarrying
District 3: Electronic goods manufacturing
District 4: Fishing
District 5: Power generation
District 6: Transportation manufacturing
District 7: Lumber
District 8: Textiles
District 9: Grain
District 10: Livestock
District 11: Crops
District 12: Coal mining
District 1Luxury goodsNote: The North American Industry Classification System groups this industry under “other miscellaneous manufacturing.”

U.S. BUREAU OF LABOR STATISTICS Career Outlook
9

U.S. BUREAU OF LABOR STATISTICS Career Outlook
10
Table 2. Occupations in which the other miscellaneous manufacturing industry is a large employer, 2015
OccupationPercent of occupation in other miscellaneous manufacturing
Total employment
Employment in other miscellaneous manufacturing
Jewelers and precious stone and metal workers
28.3 25,270 7,160
Etchers and engravers 15.8 9,490 1,500
See footnotes at end of table.

U.S. BUREAU OF LABOR STATISTICS Career Outlook
11
Table 2. Occupations in which the other miscellaneous manufacturing industry is a large employer, 2015
OccupationPercent of occupation in other miscellaneous manufacturing
Total employment
Employment in other miscellaneous manufacturing
Painting, coating, and decorating workers
14.3 16,020 2,290
Source: U.S. Bureau of Labor Statistics, Occupational Employment Statistics.
Back to District Links
District 2Rock quarryingNote: The North American Industry Classification System groups this industry under “nonmetallic mineral mining and quarrying.”

U.S. BUREAU OF LABOR STATISTICS Career Outlook
12

U.S. BUREAU OF LABOR STATISTICS Career Outlook
13
Table 3. Occupations in which the nonmetallic mineral mining and quarrying industry is the largest employer, 2015
OccupationPercent of occupation in nonmetallic
mineral mining and quarryingTotal
employmentEmployment in nonmetallic mineral
mining and quarrying
Rock splitters, quarry 80.5 3,790 3,050
Dredge operators 46.5 1,850 860
See footnotes at end of table.

U.S. BUREAU OF LABOR STATISTICS Career Outlook
14
Table 3. Occupations in which the nonmetallic mineral mining and quarrying industry is the largest employer, 2015
OccupationPercent of occupation in nonmetallic
mineral mining and quarryingTotal
employmentEmployment in nonmetallic mineral
mining and quarrying
Crushing, grinding, and polishing machine setters, operators, and tenders
12.2 31,140 3,800
Source: U.S. Bureau of Labor Statistics, Occupational Employment Statistics.
Back to District Links

U.S. BUREAU OF LABOR STATISTICS Career Outlook
15
District 3Electronic goods manufacturingNote: The North American Industry Classification System groups this industry under “computer and electronic product manufacturing.”

U.S. BUREAU OF LABOR STATISTICS Career Outlook
16
Table 4. Occupations in which the computer and electronic product industry is the largest employer, 2015
OccupationPercent of occupation in computer
and electronic products manufacturing
Total employment
Employment in computer and electronic products
manufacturing
Semiconductor processors 93.1 24,230 22,570
Timing device assemblers and adjusters
46.2 1,190 550
See footnotes at end of table.

U.S. BUREAU OF LABOR STATISTICS Career Outlook
17
Table 4. Occupations in which the computer and electronic product industry is the largest employer, 2015
OccupationPercent of occupation in computer
and electronic products manufacturing
Total employment
Employment in computer and electronic products
manufacturing
Electrical and electronic equipment assemblers
45.8 212,170 97,200
Computer hardware engineers
37.4 75,870 28,370
Electromechanical equipment assemblers
30.3 46,400 14,060
Electrical and electronics engineering technicians
27.3 139,080 38,010
Electro-mechanical technicians
26.8 14,720 3,950
Industrial engineering technicians
20.4 62,290 12,730
Source: U.S. Bureau of Labor Statistics, Occupational Employment Statistics.

U.S. BUREAU OF LABOR STATISTICS Career Outlook
18
Back to District Links
District 4FishingNote : The OES survey excludes most of the agricultural sector, with the exception of logging, support activities for crop production, and support activities for animal production. The OES survey does not include the fishing industry; therefore, occupation location quotients cannot be calculated.

U.S. BUREAU OF LABOR STATISTICS Career Outlook
19

U.S. BUREAU OF LABOR STATISTICS Career Outlook
20
Back to District Links
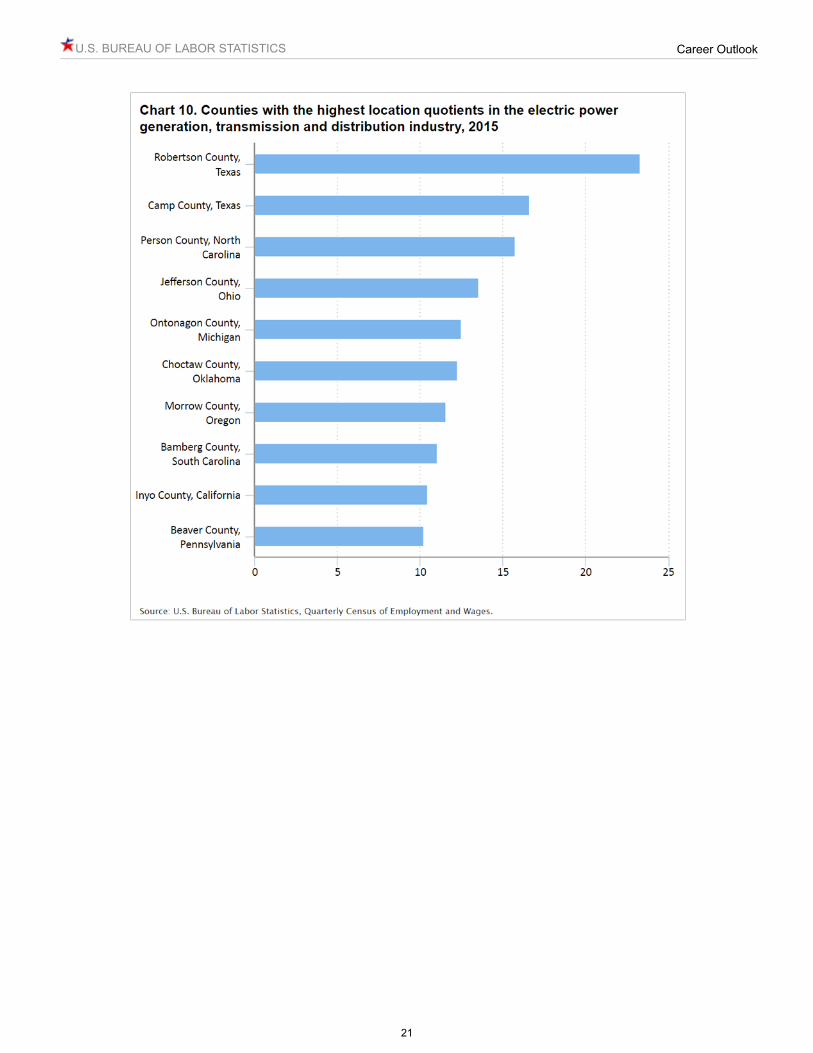
District 5Power generationNote: The North American Industry Classification System groups this industry under “electric power generation, transmission and distribution.”
U.S. BUREAU OF LABOR STATISTICS Career Outlook
21

U.S. BUREAU OF LABOR STATISTICS Career Outlook
22
Table 5. Selected occupations in which the electric power generation, transmission and distribution industry is the largest employer, 2015
OccupationPercent of occupation in electric
power generation, transmission and distribution
Total employment
Employment in electric power generation, transmission and
distribution
Power plant operators 70.0 37,510 26,240
See footnotes at end of table.

U.S. BUREAU OF LABOR STATISTICS Career Outlook
23
Table 5. Selected occupations in which the electric power generation, transmission and distribution industry is the largest employer, 2015
OccupationPercent of occupation in electric
power generation, transmission and distribution
Total employment
Employment in electric power generation, transmission and
distribution
Electrical and electronics repairers, powerhouse, substation, and relay
65.3 23,070 15,060
Nuclear technicians 64.9 6,500 4,220
Power distributors and dispatchers
61.3 11,540 7,070
Electrical power-line installers and repairers
48.8 115,380 56,270
Nuclear engineers 43.0 16,880 7,250
Source: U.S. Bureau of Labor Statistics, Occupational Employment Statistics.

U.S. BUREAU OF LABOR STATISTICS Career Outlook
24
Back to District Links
District 6Transportation manufacturingNote: The North American Industry Classification System groups this industry under “aerospace product and parts manufacturing.”

U.S. BUREAU OF LABOR STATISTICS Career Outlook
25
Table 6. Occupations in which the aerospace product and parts manufacturing industry is the largest employer, 2015
OccupationPercent of occupation in aerospace
product and parts manufacturingTotal
employment
Employment in aerospace product and parts
manufacturing
Aircraft structure, surfaces, rigging, and systems assemblers
91.4 42,810 39,110
See footnotes at end of table.

U.S. BUREAU OF LABOR STATISTICS Career Outlook
26
Table 6. Occupations in which the aerospace product and parts manufacturing industry is the largest employer, 2015
OccupationPercent of occupation in aerospace
product and parts manufacturingTotal
employment
Employment in aerospace product and parts
manufacturing
Aerospace engineers 40.1 66,980 26,840
Aerospace engineering and operations technicians
33.7 12,890 4,340
Avionics technicians 30.5 17,340 5,290
Materials engineers 13.1 27,040 3,530
Industrial engineers 8.3 247,570 20,470
Source: U.S. Bureau of Labor Statistics, Occupational Employment Statistics.
Back to District Links
U.S. BUREAU OF LABOR STATISTICS Career Outlook
27
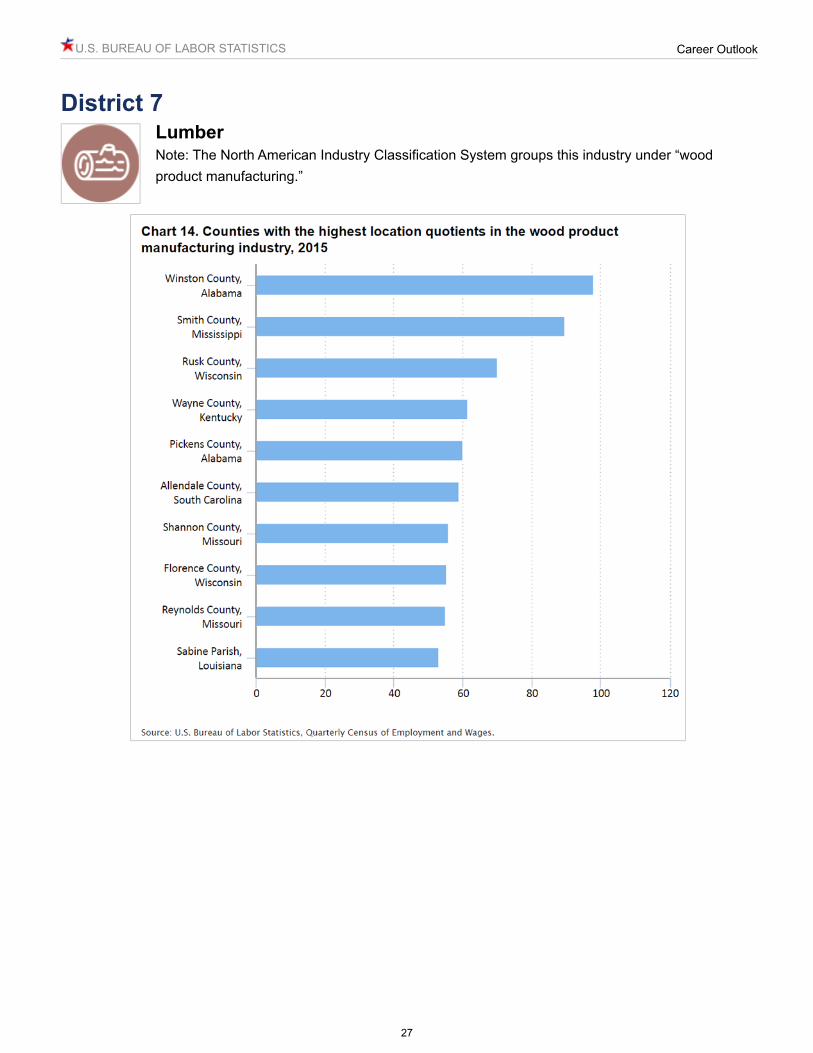
District 7LumberNote: The North American Industry Classification System groups this industry under “wood product manufacturing.”

U.S. BUREAU OF LABOR STATISTICS Career Outlook
28
Table 7. Occupations in which the wood product manufacturing industry is the largest employer, 2015
OccupationPercent of occupation in wood
product manufacturingTotal
employmentEmployment in wood product
manufacturing
Sawing machine setters, operators, and tenders, wood
77.1 48,600 37,470
Log graders and scalers 75.2 2,740 2,060
See footnotes at end of table.
U.S. BUREAU OF LABOR STATISTICS Career Outlook
29
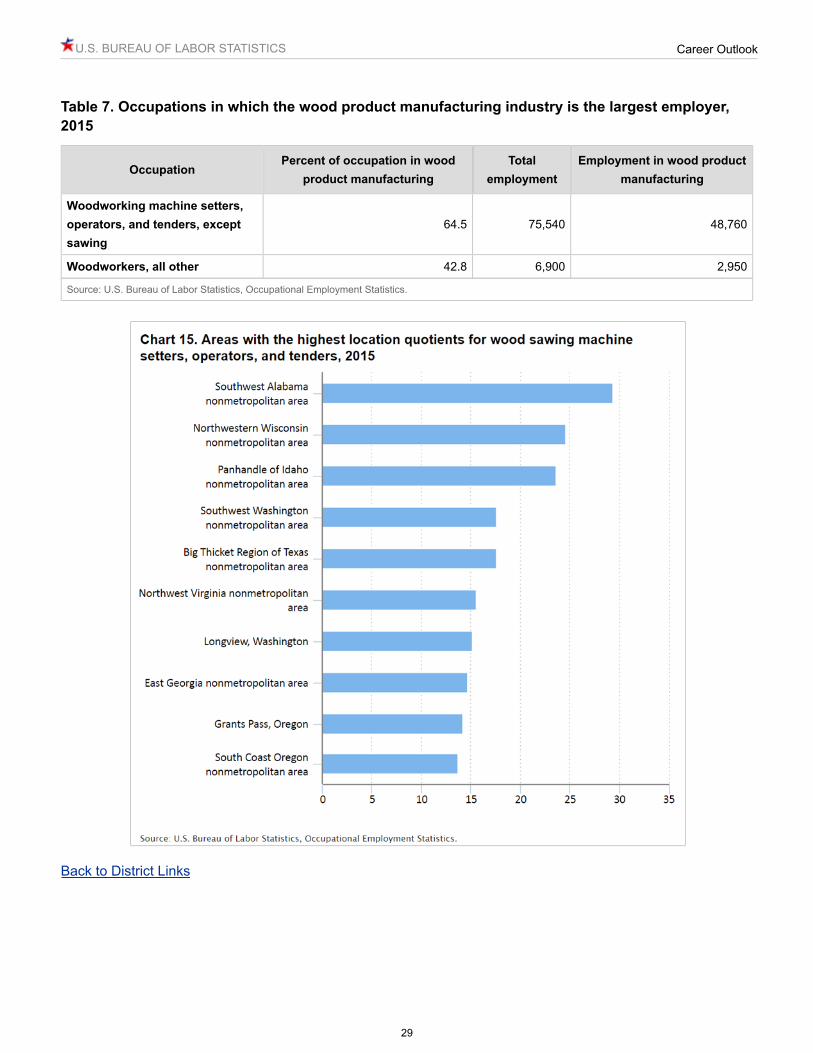
Table 7. Occupations in which the wood product manufacturing industry is the largest employer, 2015
OccupationPercent of occupation in wood
product manufacturingTotal
employmentEmployment in wood product
manufacturing
Woodworking machine setters, operators, and tenders, except sawing
64.5 75,540 48,760
Woodworkers, all other 42.8 6,900 2,950
Source: U.S. Bureau of Labor Statistics, Occupational Employment Statistics.
Back to District Links

U.S. BUREAU OF LABOR STATISTICS Career Outlook
30
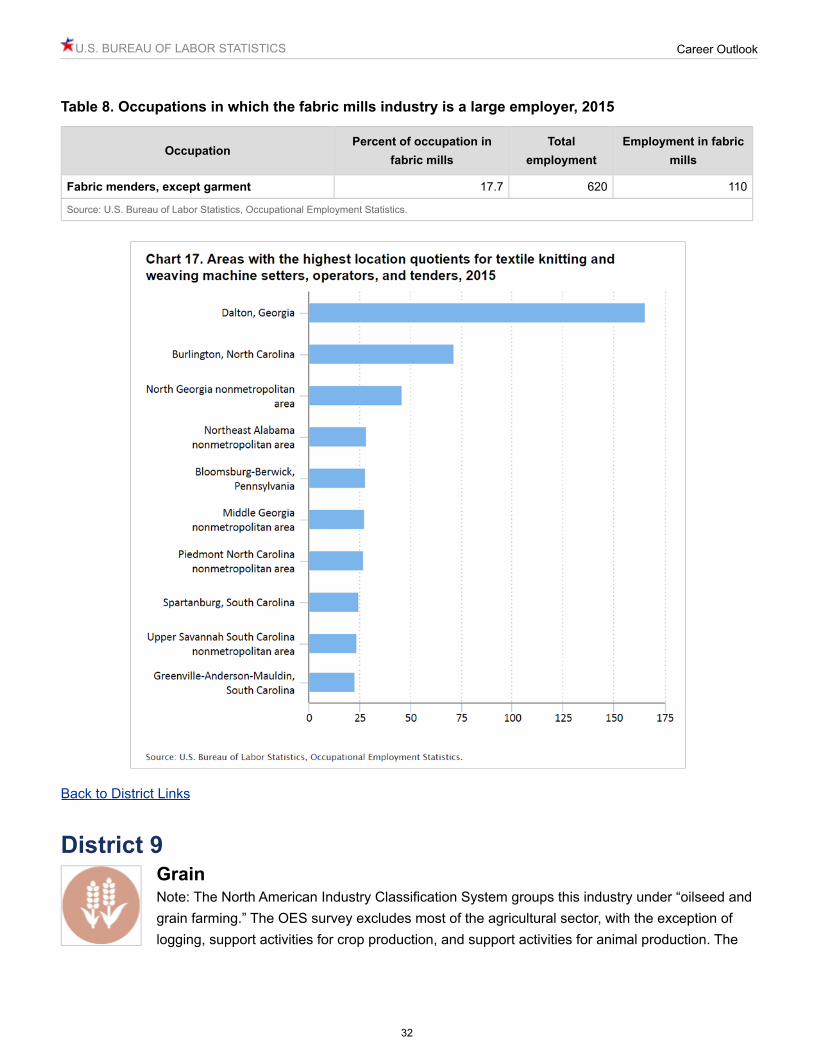
District 8TextilesNote: The North American Industry Classification System groups this industry under “fabric mills.”

U.S. BUREAU OF LABOR STATISTICS Career Outlook
31
Table 8. Occupations in which the fabric mills industry is a large employer, 2015
OccupationPercent of occupation in
fabric millsTotal
employmentEmployment in fabric
mills
Textile knitting and weaving machine setters, operators, and tenders
60.2 22,560 13,570
Textile winding, twisting, and drawing out machine setters, operators, and tenders
19.8 27,760 5,490
See footnotes at end of table.
U.S. BUREAU OF LABOR STATISTICS Career Outlook
32
Table 8. Occupations in which the fabric mills industry is a large employer, 2015
OccupationPercent of occupation in
fabric millsTotal
employmentEmployment in fabric
mills
Fabric menders, except garment 17.7 620 110
Source: U.S. Bureau of Labor Statistics, Occupational Employment Statistics.
Back to District Links
District 9GrainNote: The North American Industry Classification System groups this industry under “oilseed and grain farming.” The OES survey excludes most of the agricultural sector, with the exception of logging, support activities for crop production, and support activities for animal production. The

U.S. BUREAU OF LABOR STATISTICS Career Outlook
33
OES survey does not include the oilseed and grain farming industry; therefore, occupation location quotients cannot be calculated.

U.S. BUREAU OF LABOR STATISTICS Career Outlook
34
Back to District Links
District 10LivestockNote: The North American Industry Classification System groups this industry under “animal production and aquaculture.” The OES survey excludes most of the agricultural sector, with the exception of logging, support activities for crop production, and support activities for animal

U.S. BUREAU OF LABOR STATISTICS Career Outlook
35
production. The OES survey does not include the animal production and aquaculture industry; therefore, occupation location quotients cannot be calculated.

U.S. BUREAU OF LABOR STATISTICS Career Outlook
36
Back to District Links
District 11CropsNote: The North American Industry Classification System groups this industry under “fruit and tree nut farming.” The OES survey excludes most of the agricultural sector, with the exception of logging, support activities for crop production, and support activities for animal production. The

U.S. BUREAU OF LABOR STATISTICS Career Outlook
37
OES survey does not include the fruit and tree nut farming industry; therefore, occupation location quotients cannot be calculated.

U.S. BUREAU OF LABOR STATISTICS Career Outlook
38
Back to District Links

U.S. BUREAU OF LABOR STATISTICS Career Outlook
39
District 12Coal mining

U.S. BUREAU OF LABOR STATISTICS Career Outlook
40
Table 1. Occupations in which the coal mining industry is the largest employer, 2015
Occupation Percent of occupation in coal mining Total employment Employment in coal mining
Mine shuttle car operators 93.5 2,310 2,160
Roof bolters, mining 93.1 5,220 4,860
Loading machine operators, underground mining
60.7 3,210 1,950
Source: U.S. Bureau of Labor Statistics, Occupational Employment Statistics.

U.S. BUREAU OF LABOR STATISTICS Career Outlook
41
Back to District Links
Elizabeth Cross is an economist in the Office of Occupational Statistics and Employment Projections, BLS. She can be reached at
SUGGESTED CITATION:
Elizabeth Cross, "Mapping “The Hunger Games”: Using location quotients to find the Districts of Panem," Career Outlook, U.S.
Bureau of Labor Statistics, February 2017.
Finding hot jobsUsing OES occupation profiles in a job searchMapping out a career
RELATED CONTENT

U.S. BUREAU OF LABOR STATISTICS Career Outlook
42
Job openings Job search Mining
RELATED SUBJECTS