mapping rice and rice growing environments in west-africa using remote sensing and spatial modelling...
DESCRIPTION
Mapping rice and rice growing environments presented at the International Rice Congress in Bangkok 2014.TRANSCRIPT

Mapping rice and rice growing
environments in West-Africa using
remote sensing and spatial
modelling tools
Sander Zwart
AS El-Vilaly, JF Djagba, S Steinbach, F Holecz
4th International Rice CongressBangkok, Thailand, Oct 27 – Nov 1, 2014

1. Importance of rice production for food security
in West-Africa
2. Rice production environments
3. Strategy for rice mapping in West-Africa
4. First results
5. Challenges for rice mapping
4th International Rice CongressBangkok, Thailand, Oct 27 – Nov 1, 2014
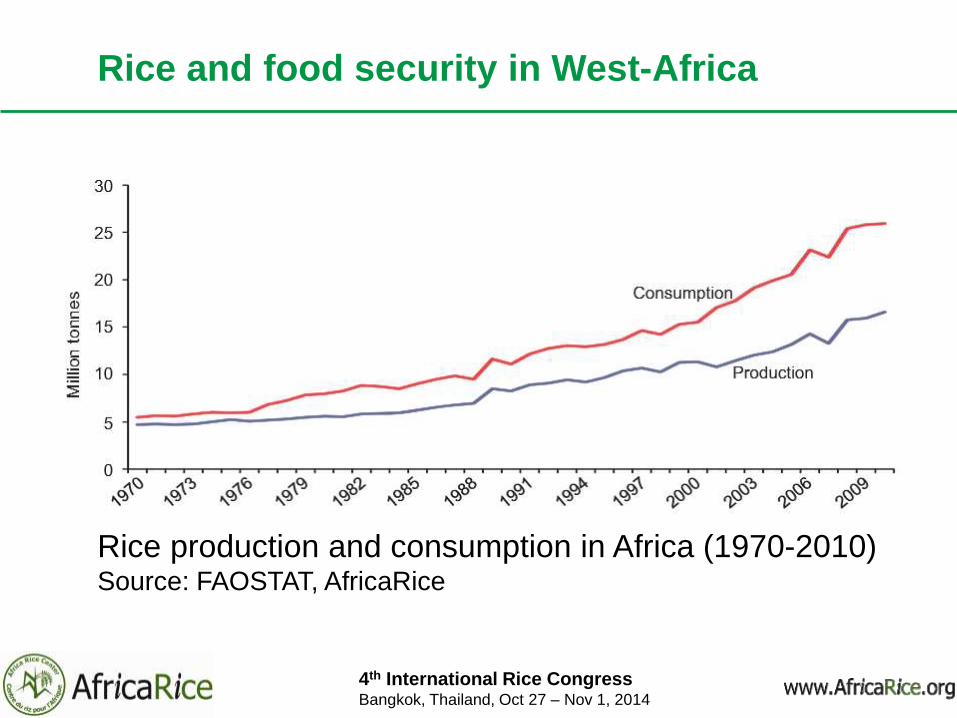
Rice and food security in West-Africa
Rice production and consumption in Africa (1970-2010) Source: FAOSTAT, AfricaRice
4th International Rice CongressBangkok, Thailand, Oct 27 – Nov 1, 2014

Rice and food security in West-Africa
Contribution of various staple crops in diets in West-Africa
(1961-2010)Source: FAOSTAT, AfricaRice
4th International Rice CongressBangkok, Thailand, Oct 27 – Nov 1, 2014

Rice and food security in West-Africa
Challenges for food security:
(West-)Africa is by far not self-sufficient and
depends on international markets.
Climate change is impacting W-Africa strongly;
less rainfall and more erratic and intense rainfall
events, lower river discharges, floods.
4th International Rice CongressBangkok, Thailand, Oct 27 – Nov 1, 2014

Rice and food security in West-Africa
Why do we need creating maps and statistics of
rice?
• (sub-)national rice statistics are very unreliable
or absent in Africa
• Understanding where rice is for efficient
targeting of technologies, interventions and
actions
4th International Rice CongressBangkok, Thailand, Oct 27 – Nov 1, 2014

Rice production environments
Rainfed upland
and lowland
Smallholder fields
Intercropping
Fragmented landscape
Inland valleys / wetlands
Very dynamic
One rice crop
Irrigated rice
Large-scale
systems
Gradual expansion
Two seasons
Mangrove rice
Cleared lands in forested areas
Stable systems
One season only
4th International Rice CongressBangkok, Thailand, Oct 27 – Nov 1, 2014

Rice production environments
Differences between Asian and African rice
landscapes
Asia Africa
Irrigated rice (80%) upland rainfed
lowland rainfed
lowland irrigated (~10%)
Stable area Dynamic & expanding
30% of arable land 4% of arable land
Contiguous rice areas Fragmented
Paddy land preparation Dry land preparation
High fertilizer inputs Low fertilizer inputs
4th International Rice CongressBangkok, Thailand, Oct 27 – Nov 1, 2014

Strategy for rice mapping in West-Africa
Rainfed upland
and lowland
Radar RS
Spatial modelling
Random Forest
Irrigated rice
Optical RS
Radar RS
Mangrove rice
off-season Landsat
GoogleEarth interpretation
4th International Rice CongressBangkok, Thailand, Oct 27 – Nov 1, 2014
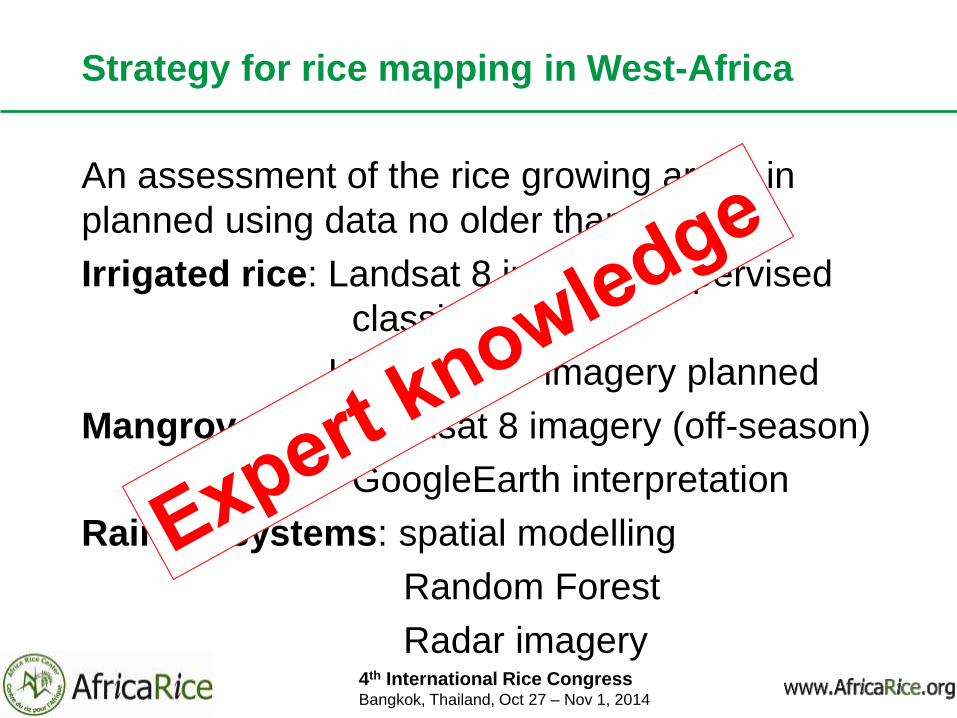
Strategy for rice mapping in West-Africa
An assessment of the rice growing areas in
planned using data no older than 5 years.
Irrigated rice: Landsat 8 imagery, supervised
classification
Use of radar imagery planned
Mangrove rice: Landsat 8 imagery (off-season)
GoogleEarth interpretation
Rainfed systems: spatial modelling
Random Forest
Radar imagery4th International Rice CongressBangkok, Thailand, Oct 27 – Nov 1, 2014

First results – irrigated rice
Pilot testing of radar remote sensing in two hubs:
Cosmo-SkyMed imagery is acquired every 16
days during rice season
Spatial resolution of 3m
Senegal: irrigated rice conditions (July-December)
Benin: upland and lowland rice (June-december)
Goals: mapping rice and assessing crop
phenology dates (SoS and harvest)
Field validation collected (500 points)
4th International Rice CongressBangkok, Thailand, Oct 27 – Nov 1, 2014

First results – irrigated rice
Preliminary results December 2013 (green is rice)
4th International Rice CongressBangkok, Thailand, Oct 27 – Nov 1, 2014

First results – mangrove rice
1. Visual interpretation and digitization in
GoogleEarth (2010-2014 high resolution
satellite images)
2. Remove water and mangrove forest patches
using off-season NDVI maps derived from
Landsat 8 imagery
Implemented in Senegal, The Gambia, Guinea-
Bissau, Guinea-Conakry, Sierra Leone, Liberia
Total of 11 Landsat scenes
4th International Rice CongressBangkok, Thailand, Oct 27 – Nov 1, 2014

First results – mangrove rice
4th International Rice CongressBangkok, Thailand, Oct 27 – Nov 1, 2014

First results – mangrove rice
4th International Rice CongressBangkok, Thailand, Oct 27 – Nov 1, 2014

First results – mangrove rice
4th International Rice CongressBangkok, Thailand, Oct 27 – Nov 1, 2014

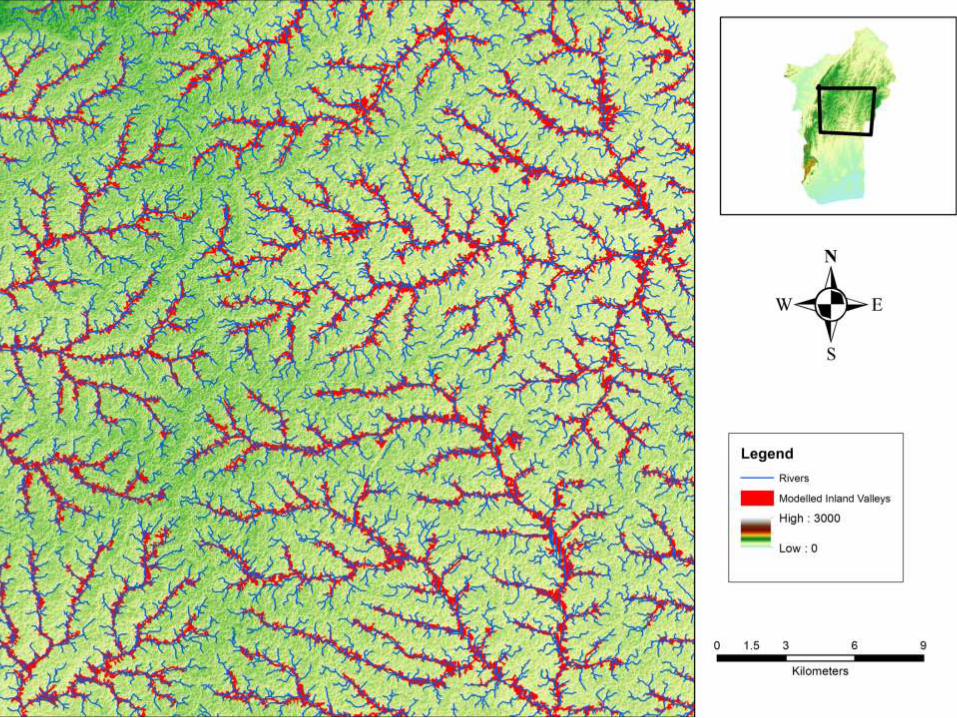
First results – mapping inland valleys / wetlands
Inland valley or wetlands (irrigated and rainfed
lowland)
• Areas suitable for rice production due to
favorable hydrological conditions
• Important for current and future rice production
4th International Rice CongressBangkok, Thailand, Oct 27 – Nov 1, 2014

First results – mapping inland valleys / wetlands
stream
20 202121
23 2324
25m2524 altitude (m)
30m
Digital Elevation Model(2-dimensional)
4th International Rice CongressBangkok, Thailand, Oct 27 – Nov 1, 2014
Selected inland valley bottom
1 m threshold
Spatial analysis – Mapping inland valleys
Remote Sensing – Beyond Images14-15 December 2013, Mexico City

First results – mapping inland valleys / wetlands
Validation
Omission/comission errors, accuracy and area
estimation/comparison
4th International Rice CongressBangkok, Thailand, Oct 27 – Nov 1, 2014

First results – mapping inland valleys / wetlands
Currently only 10% cultivated (official stats)
Mapping rice in the inland valleys using remote
sensing classification is (currently) impossible:
• valley size
• heterogenous agricultural landscape
• image resolution
• extent
• dynamics
4th International Rice CongressBangkok, Thailand, Oct 27 – Nov 1, 2014

First results – mapping inland valleys / wetlands
Random Forest
Machine learning technique based on the
construction of decision trees that can be used for
regression or classification purposes
Predict the presence of rice cultivation in the inland
valleys.
4th International Rice CongressBangkok, Thailand, Oct 27 – Nov 1, 2014
First results – mapping inland valleys / wetlands
• Collection of data on inland valleys and
presence or non-presence of rice or agriculture
• Building geo-spatial data bases containing:
Road networks, villages, travel distance, markets
(inputs and outputs), population density, inland
valleys, soil types, water availability, rainfall (remote
sensing), etc.
• Implementation in Sierra Leone, Liberia, Benin
and Mali
4th International Rice CongressBangkok, Thailand, Oct 27 – Nov 1, 2014

Challenges for rice mapping
• Rainfed upland agriculture might be too
fragmented, too small scall-scale, too dynamic,
to be able to identify.
• Skilled person-power
- Very few young people are educated in
GIS/RS
- (Almost) no experience with radar remote
sensing.
4th International Rice CongressBangkok, Thailand, Oct 27 – Nov 1, 2014

Thank you! Merci!
Center of Excellence for Rice Research
4th International Rice CongressBangkok, Thailand, Oct 27 – Nov 1, 2014