mapping of the status of cultural and … · indicators and statistics in east africa ... coicop...
TRANSCRIPT

MAPPING OF THE STATUS OF CULTURAL
INDICATORS AND STATISTICS IN EAST AFRICA
Final Report
Published September 2017
Research undertaken by: Ms. Yarri Kamara, UNESCO consultant

2
TABLE OF CONTENTS
ACRONYMS ............................................................................................................................................. 3
INTRODUCTION ....................................................................................................................................... 4
METHODOLOGY ...................................................................................................................................... 5
CURRENT AGENDAS FOR CULTURAL STATISTICS IN AFRICA ................................................................... 5
SUMMARY OF STATUS OF CULTURAL STATISTICS .................................................................................. 8
RECOMMENDATIONS ........................................................................................................................... 14
EXPLANATORY GUIDE TO COUNTRY SUMMARIES ................................................................................ 17
COUNTRY PROFILE: COMOROS ............................................................................................................. 20
COUNTRY PROFILE: DJIBOUTI ............................................................................................................... 23
COUNTRY PROFILE: ERITREA ................................................................................................................. 26
COUNTRY PROFILE: ETHIOPIA ............................................................................................................... 28
COUNTRY PROFILE: KENYA ................................................................................................................... 33
COUNTRY PROFILE: MADAGASCAR ....................................................................................................... 40
COUNTRY PROFILE: MAURITIUS............................................................................................................ 44
COUNTRY PROFILE: RWANDA ............................................................................................................... 49
COUNTRY PROFILE: SEYCHELLES ........................................................................................................... 54
COUNTRY PROFILE: SOMALIA ............................................................................................................... 58
COUNTRY PROFILE: SOUTH SUDAN ...................................................................................................... 60
COUNTRY PROFILE: TANZANIA ............................................................................................................. 62
COUNTRY PROFILE: UGANDA ................................................................................................................ 67
ANNEX 1: QUESTIONNAIRE – Ministries of culture .............................................................................. 72
ANNEX 2: QUESTIONNAIRE – National statistics institutes .................................................................. 76

3
ACRONYMS
CCI Cultural and creative industries
COFOG Classification of the Functions of Government
COICOP Classification of Individual Consumption by Purpose
CPC Central Product Classification
EAC East African Community
FCS (2009 UNESCO) Framework for Cultural Statistics
ICATUS International Classification Of Activities For Time Use Statistics
ILO International Labour Organization
ISCO International Standard Classification of Occupations
ISIC International Standard Industrial Classification
MC Ministry in charge of culture
NSO National statistics office
PwC PricewaterhouseCoopers
SDG Sustainable Development Goals
SITC Standard International Trade Classification
UIS UNESCO Institute for Statistics
WIPO World Intellectual Property Organization

4
INTRODUCTION The UNESCO Office for Eastern Africa commissioned this study to gain an understanding of the current status of cultural indicators and statistics in the 13 countries covered by the office: Comoros, Eritrea, Ethiopia, Djibouti, Kenya, Madagascar, Mauritius, Rwanda, Seychelles, South Sudan, Somalia, the United Republic of Tanzania and Uganda. The results of the study are to inform the design of a regional project proposal in collaboration with the UNESCO Institute of Statistics aimed at building capacity for obtaining regular indicators that can guide effective cultural policy in the region. Given the low level of policy attention and budgets allocated to the cultural sector in almost all the countries in the region, the project aims to contribute above all to the availability of cultural statistics that can advocate for increased funding and policy attention to the sector. A key concern for UNESCO is ensuring effective integration of the cultural sector in national development plans and strategies. Policymakers today tend to be most responsive to indicators on the economic dimension of culture, in particular the sector’s contribution to employment (and in some cases, specifically youth employment given the significant youth bulge in several Eastern African countries) and to GDP. Excitement on a global scale generated in the past decade about the growth and growth potential of the cultural or creative industries, has also served to pique interest for economic indicators on the cultural sector. Economic indicators on the cultural sector are thus a focus of this study, but not an exclusive focus. As is well known, the culture sector is multidimensional and while cultural policy in some countries focuses on cultural industries promotion, in others policy focuses more on heritage preservation and promotion, promoting national identity and social cohesion or ensuring cultural and/or linguistic diversity. Indicators on the more social dimensions of culture, such as participation in culture activities, consumption of cultural services/goods, and the domestic content in mass media are also a priority for some countries. It is worth remembering that this study focuses on indicators and statistics (see definitions below), which are exclusively quantitative data. Some dimensions of culture lend themselves better to quantitative measurement than others. If some of the more social and identity‐related dimensions of culture do not transpire as much as economic dimensions throughout the study, this is not a judgment on their relative importance, but because these dimensions are better captured through qualitative research methods. Three decades of work on cultural sector indicators in OECD countries and elsewhere has shown that given the complex scope of the culture sector, priorities will need to be established as it is impossible, and also neither necessary nor desirable, to measure all aspects of the culture sector1.
USEFUL DEFINITIONS Data : Characteristics or information, quantitative or otherwise, that are collected through observation Statistics : a collection of quantitative data Indicator : data element that represents statistical data for a specified time, place, and other characteristics
1 José Pessoa (2012). “Cultural Statistics in Africa: The Missing Link”. Paper for the Third Pan‐African Cultural Congress (PACC3). 28‐30 August 2012. Addis Ababa, Ethiopia.

5
The study starts with a presentation of the methodology used for collecting data to map the current situation of cultural statistics, followed by a discussion on some key international and national policy trends that shape the agenda for cultural statistics today in the region. The summarized results of the study are then presented – details on each country are presented in the country profiles in the annexure. Drawing on these results, recommendations for future action on cultural statistics are made.
METHODOLOGY The information in this study was collected through a review of data available on the internet, in particular on the web sites of national statistics institutes and of ministries in charge of culture. Interviews, either over the phone or through written response, were also carried out. The two questionnaires developed specifically for this study for the ministry in charge of culture and the national statistics institute respectively are presented in the annexure after the country summaries. Responses were collected from 12 out of the 13 countries in the study; for 4 of these countries responses were forthcoming from both statistics and culture departments, for the other 8 a response from only one of these parties was received. While a reasonable response rate was obtained for the study, the information collected over the phone or through written exchanges does not have the richness of detail that would have been collected through face‐to‐face interviews.
CURRENT AGENDAS FOR CULTURAL STATISTICS IN AFRICA
This section examines some of the international and regional policy agendas and trends that are driving and shaping the need for cultural statistics in the Eastern African region. Table 1 shows which of the 13 countries in the region have ratified key UNESCO cultural conventions for protecting and promoting cultural heritage and expressions. Ratification of these conventions implies commitment to certain objectives and indicators are needed to measure the extent to which such objectives are being met. The Conventions on safeguarding heritage, both tangible and intangible, and on protecting and promoting cultural expressions have had the greatest number of signatories in the region. The strategic concern for safeguarding the world’s cultural and natural heritage has also been explicitly taken up by the United Nations Sustainable Development Goals (SDGs): a sub target under Goal 11 on making cities and human settlements inclusive, safe, resilient and sustainable addresses heritage (see box below). Indicators to track progress on heritage protection are thus key for the SDG agenda. Table 1: UNESCO CULTURAL CONVENTIONS RATIFIED IN THE REGION
CONVENTION (Total Ratifications) Most ratified listed first
Comoros
Djibouti
Eritrea
Ethiopia
Ken
ya
Madagascar
Mauritius
Rwanda
Seychelles
Somalia
South Sudan
Tanzania
Uganda
2005 Protection and Promotion of the Diversity of Cultural Expressions (11)
X X X X X X X X X X X

6
2003 Safeguarding of Intangible Cultural Heritage (12)
X X X X X X X X X X X X
2001 Protection of the Underwater Cultural Heritage (1)
X
1972 Protection of the World Cultural and Natural Heritage (12)
X X X X X X X X X X X X
1970 Means of Prohibiting and Preventing the Illicit Import, Export and Transfer of Ownership of Cultural Property (5)
X X X X X
1954 Protection of Cultural Property in the Event of Armed Conflict (7)
X X X X X X X
1952, 1971 Protection of Copyright and Neighbouring Rights (2)
X X
Cultural and natural heritage in the SDGs Target: 11.4: Strengthen efforts to protect and safeguard the world’s cultural and natural heritage Indicator: 11.4.1: Total expenditure (public and private) per capita spent on the preservation, protection and conservation of all cultural and natural heritage, by:
‐ type of heritage (cultural, natural, mixed, World Heritage Centre designation) ‐ level of government (national, regional, and local/municipal) ‐ type of expenditure (operating expenditure/investment) ‐ type of private funding (donations in kind, private non‐profit sector, sponsorship)
Source: UNESCO Institute for Statistics
On a regional level, four countries in the region have signed the African Union’s 2006 Charter for African Cultural Renaissance. The African Union’s 2063 Agenda2 developed in 2015 has seven continent‐wide aspirations of which Aspiration 5 is directly linked to culture:
Aspiration 5 (An Africa with a strong cultural identity, common heritage, values and ethics): inculcating the spirit of Pan Africanism; tapping Africa’s rich heritage and culture to ensure that the creative arts are major contributors to Africa’s growth and transformation; and restoring and preserving Africa’s cultural heritage.
The monitoring framework for Agenda 2063 is currently being developed, so it is not yet clear what indicators will track progress on Aspiration 5. Prior to Agenda 2063, AU member countries had adopted the 2008 AU Plan of Action on Cultural and Creative Industries, which has as main objectives improving the living and working conditions of African artists and the contribution of cultural and creative industries (CCIs)to African development. The plan of action also addresses the need for statistical data on CCIs. The Plan of Action is scheduled to be reviewed in 2018 following data collection on member states’ progress. On a sub‐regional level, the East African Community (Burundi, Kenya, Rwanda, Tanzania and Uganda) has been developing initiatives to support the development of the creative and cultural industries
2 African Union Commission (2015). Agenda 2063 Framework Document – The Africa We Want. Addis Ababa, September 2015

7
among its member states and passed the East African Community Creative and Cultural Industries Bill in January 2015. The bill sets out the ambition to create an East African Creative and Cultural Industries Council to increase knowledge and understanding of the sector in member countries. The funding of cultural industries mapping studies in member states falls in line with this ambition, and Uganda has successfully published the results of such a mapping exercise thanks to EAC support. Growing urban populations, and in particular urban youth populations, combined with increasing disposable income of urban populations in some African countries is fuelling interest in the entertainment sectors of some of the more populous countries in the region such as Kenya, Uganda and Tanzania, inspired by the continent‐wide, and increasingly international, success of the Nigerian film (Nollywood) and music industries. A major international management consultancy firm, PricewaterhouseCoopers (PwC), which publishes global and regional entertainment and media outlooks, now publishes an outlook specifically for South Africa, Nigeria and Kenya. This trend contributes to growing interest on indicators on the economic contribution of cultural industries, in particular of film, music and in some contexts digital media. Some governments express keen interest in developing cultural industries to create employment for urban youth and as a consequence are interested in employment statistics for the cultural industries. The region also hosts some of Africa’s most touristic countries, and as the tourism sector matures in these countries, several are explicitly looking to diversify out of what has mainly been nature‐based tourism to other forms of tourism, including cultural tourism. Statistics that can inform on the links between tourism and culture are thus of specific interest for the region. In terms of instruments for cultural statistics, UNESCO and the UNESCO Institute for Statistics have developed two primary tools to guide countries in setting up cultural statistics frameworks and indicators: the 2009 Framework for Cultural Statistics3 which is essentially a guide on how to produce indicators on the cultural sector from standard international statistics classifications; and the Culture for Development Indicators (CDIS)4 which builds an index indicator giving a snapshot of the various dimensions of culture within a country.
Two UNESCO cultural statistics tools The Framework for Cultural Statistics (FCS) is a tool for organizing cultural statistics both nationally and internationally. The 2009 FCS provides guidance on two key levels:
1) It proposes a definition of the cultural sector for statistical purposes through the identification and measurement of the behaviours and practices resulting from the beliefs and values of a society. These are organized into mutually exclusive cultural domains, as well as related domains and transversal domains. Countries can adopt the standardized domains to define their culture sector or adapt them to their specificities.
2) Using the domains it shows how currently available international statistical classification systems, such as the International Standard Industrial Classification (ISIC) or the International Standard Classification of Occupations (ISCO) can be used to organize statistics on the culture sector and generate a range of indicators – employment, contribution to GDP, exports and imports, cultural participation.
The Culture for Development Indicator Suite (CDIS) is a policy and advocacy tool that gives a multidimensional perspective of how culture contributes to development and of what environment is in place for sustaining and enhancing cultural assets and processes for development. The 22 CDIS indicators and constructed indexes cover seven policy dimensions looking at 1) economic
3 http://www.uis.unesco.org/culture/Pages/framework‐cultural‐statistics.aspx 4 http://en.unesco.org/creativity/development‐indicators/about

8
contribution, 2) integration of culture in the education system, 3) governance for culture, 4) social participation in culture, 5) the gender environment, 6) communication framework for culture and 7) the sustainability of heritage. Looked at together the indicators give a snapshot of a country’s cultural “DNA”: of how vibrant and enabled the culture sector is.
SUMMARY OF STATUS OF CULTURAL STATISTICS
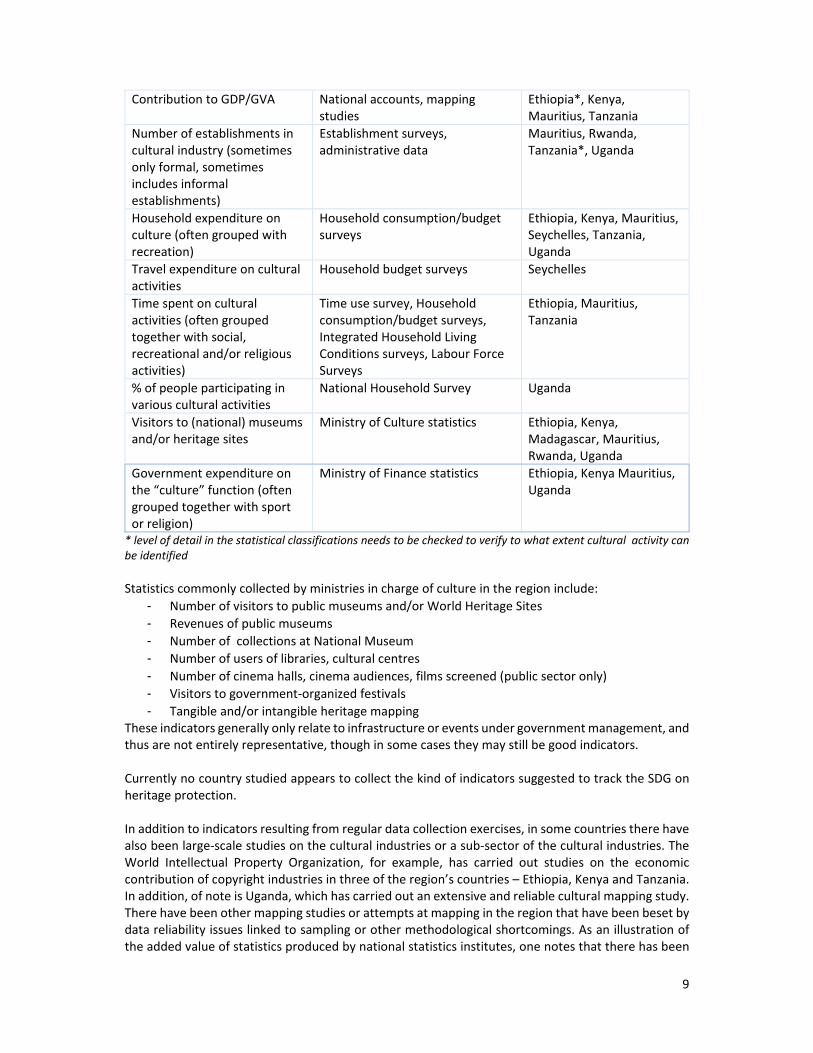
Availability of cultural statistics The availability of cultural statistics within the region varies quite widely across countries. The most important factor for the availability of statistics is somewhat logically the capacity of the national statistics institute. Relatively stronger statistics institutes already have national data (eg. employment by industry, employment by occupation, contribution to GDP by industry, household consumption data and time use data) from which indicators on the cultural sector can be extracted, although in some cases cultural establishments or activity is not be well represented in current data sets thus undermining the reliability of any extracted indicators. Some statistics institutes are also already directly generating indicators related to culture – for instance, several countries through their household consumption surveys have an indicator for household expenditure on culture and recreation. At the ministry in charge of culture level, funding constraints compounded by lack of knowledge and skills in statistics and of operation cultural policy frameworks with clear measurable targets, mean that few statistics are collected. Statistics collected by ministries of culture tend to be limited to visitor/user statistics of publicly‐run facilities such as museums, libraries and cultural centres, thus not completely representative (in particular not shedding light on cultural activity in the private sector). The table below summarizes the types of cultural indicators that are available or can be extracted from national statistics institutes’ data. Priority is given to data produced by national statistics institutes for the following reasons:
‐ Data is representative for the country or specified sub‐unit, as opposed for example to some ministry of culture data which is only representative of public sector facilities
‐ Quality control is generally stricter and senior policymakers in governments tend to give more credence to statistics vetted by their national statistics institute than other statistics
‐ Greater chances of regularity and sustainability of indicators that result from already existing data collection exercises.
Table 2: TYPES OF INDICATORS AVAILABLE
Type of indicator Types of sources Countries with indicator available or extractable
Employment in cultural industry
Labour Force Surveys, Urban employment surveys, Integrated Household Living Conditions surveys, Census
Ethiopia, Kenya, Mauritius, Rwanda, Tanzania, Uganda
Employment in cultural occupations
Labour Force Surveys, Urban employment surveys, Census
Ethiopia, Kenya, Rwanda, Tanzania, Uganda
% of people earning income from cultural products
National Household survey Uganda
9
Contribution to GDP/GVA National accounts, mapping studies
Ethiopia*, Kenya, Mauritius, Tanzania
Number of establishments in cultural industry (sometimes only formal, sometimes includes informal establishments)
Establishment surveys, administrative data
Mauritius, Rwanda, Tanzania*, Uganda
Household expenditure on culture (often grouped with recreation)
Household consumption/budget surveys
Ethiopia, Kenya, Mauritius, Seychelles, Tanzania, Uganda
Travel expenditure on cultural activities
Household budget surveys Seychelles
Time spent on cultural activities (often grouped together with social, recreational and/or religious activities)
Time use survey, Household consumption/budget surveys, Integrated Household Living Conditions surveys, Labour Force Surveys
Ethiopia, Mauritius, Tanzania
% of people participating in various cultural activities
National Household Survey Uganda
Visitors to (national) museums and/or heritage sites
Ministry of Culture statistics Ethiopia, Kenya, Madagascar, Mauritius, Rwanda, Uganda
Government expenditure on the “culture” function (often grouped together with sport or religion)
Ministry of Finance statistics Ethiopia, Kenya Mauritius, Uganda
* level of detail in the statistical classifications needs to be checked to verify to what extent cultural activity can be identified
Statistics commonly collected by ministries in charge of culture in the region include:
- Number of visitors to public museums and/or World Heritage Sites
- Revenues of public museums
- Number of collections at National Museum
- Number of users of libraries, cultural centres
- Number of cinema halls, cinema audiences, films screened (public sector only)
- Visitors to government‐organized festivals
- Tangible and/or intangible heritage mapping These indicators generally only relate to infrastructure or events under government management, and thus are not entirely representative, though in some cases they may still be good indicators. Currently no country studied appears to collect the kind of indicators suggested to track the SDG on heritage protection. In addition to indicators resulting from regular data collection exercises, in some countries there have also been large‐scale studies on the cultural industries or a sub‐sector of the cultural industries. The World Intellectual Property Organization, for example, has carried out studies on the economic contribution of copyright industries in three of the region’s countries – Ethiopia, Kenya and Tanzania. In addition, of note is Uganda, which has carried out an extensive and reliable cultural mapping study. There have been other mapping studies or attempts at mapping in the region that have been beset by data reliability issues linked to sampling or other methodological shortcomings. As an illustration of the added value of statistics produced by national statistics institutes, one notes that there has been

10
a wealth of studies in Kenya by international organizations, private firms and NGOs; government in Kenya, however, is somewhat wary of the figures touted by the various studies, if they are not backed up by the national institute of statistics. Table 3: QUANTITATIVE STUDIES AVAILABLE IN THE REGION
Country Study Lead organisations Year
Ethiopia Economic Contribution of Copyright‐based Industries in Ethiopia
World Intellectual Property Organization (WIPO)
2014
Entertainment and media outlook: 2015‐2019. South Africa – Nigeria – Kenya
Pwc (Private consultancy)
2015
Economic Contribution of the Film and TV Industry in Kenya
Kenya Film Commission 2013
Audience Consumption Trend Survey Kenya Film Commission undated
The role of culture and heritage in development in Kenya (unpublished study)
Kenya Institute for Public Policy Research and Analysis (KIPPRA)
2012
Unearthing the Gems of Culture: mapping exercise of Kenya’s creative cultural industries*
ACRI (NGO) 2012
Economic Contribution of Copyright‐based Industries in Kenya
WIPO 2009
Baseline Research on Cultural and Local Content Production in Rwanda’s Media Sector
Media High Council 2013
Rwanda Skills Survey – ICT sector and Tourism and Hospitality sector reports
Rwanda Development Board
2012
Tanzania Economic Contribution of Copyright‐based Industries in Tanzania
WIPO 2012
Mapping of cultural and creative industries Ministry in charge of culture, Uganda Bureau of Statistics, East Africa Community
2014
Mapping of cultural industries Uganda National Commission for UNESCO
2009
* Study does not contain any national indicators
Afrobarometer surveys Afrobarometer5 is a pan‐African, non‐partisan research network that conducts public attitude surveys on democracy, governance, economic conditions, and related issues across more than 30 countries in Africa. Currently 7 of the 13 countries in this study participate in Afrobarometer surveys. These surveys follow a common methodology but each country makes adaptations to the core questionnaire based on the national context and topics of particular interest at the time of survey. While the review of national questionnaires used in the latest round (Round 6) revealed few questions specific to culture (apart from data on ethnicity or language), the questionnaire could be a good tool for instance to probe either consumption behaviour or people’s attitudes to the level and/or type of cultural services available to them (for example, through questions like “Do you feel like your national culture is well represented in media content?”). The Latinobarometer surveys6 over the years for instance have included questions such as:
- How proud are you of Hispanic culture and the Spanish language?
5 http://afrobarometer.org/ 6 Latinobarometer 1995 ‐2015 time series data available on http://www.latinobarometro.org/latContents.jsp

11
- Participation in cultural or artistic groups
- When was the last time you went to the theatre?
- Attention paid to cultural issues on television Table 4: EAST AFRICAN COUNTRIES WITH AFROBAROMETER SURVEYS
Ethiopia
Kenya
Madagascar
Mauritius
South Sudan
Tanzania
Uganda
Capacity for cultural statistics Based on the review of available data in each country, the 13 countries in the region were grouped into three categories roughly indicative of their capacities for producing regular and reliable cultural indicators. Four countries in the group were found to have a strong existing base relative to their peers in the region, four a medium existing base and a further five a weak base (see table below). In this latter group, Somalia and South Sudan are facing severe security and humanitarian constraints; the (post‐)conflict situation prevalent in these countries means that the first and foremost priority is relaunching cultural activities; without this there will not be much to measure. It is not relevant to launch support action specifically on cultural statistics in these two countries in the immediate future.

12
Table 5: CLASSIFICATION OF COUNTRIES BY EXISTING BASE FOR CULTURAL STATISTICS
Strongest existing base Medium existing base Weak existing base (or unknown)
Ethiopia Kenya Seychelles Uganda
Mauritius Madagascar Rwanda Tanzania
Comoros Djibouti Eritrea South Sudan Somalia
As mentioned earlier the general level of capacity of national statistics institutes is a key determinant for the potential availability of cultural statistics. Another necessary factor is communication and collaboration between the statistics institute and the ministry in charge of culture. In most countries there has been limited interaction to date. Interaction between the two is necessary for statistics institutes to gain the level of understanding of the cultural sectors (in particular of cultural industries for economic data) necessary for extracting sector specific information from existing data or developing new data collection tools. In most countries in the region, a national definition of what is included in the culture sector and what is not does not exist, and this is problematic for statisticians working in the sector. Conversely, ministry of culture staff need better understanding of what statistics are, how they are constructed and how they can be used to better set realistic, relevant and cost effective priorities for cultural statistics. It is important to note, that data collection by national statistics offices is demand‐driven; data needs to be requested with justification by the relevant ministry. Once data is available, Ministry staff also need the capacity to analyse data and use indicators to develop effective policy initiatives. To date the only capacity building on cultural statistics in the region appears to have come from UIS activities mostly dating back to 2012. For some countries, for various reasons only representatives from the ministry in charge of culture attended workshops or meetings, when the attendance of statistics institutions would have been crucial for uptake. The institutional placement of the culture sector within government may also in some cases affect capacities, in particular financial and human resource capacities, for cultural statistics. When culture sits in a ministry that combines other sectors (for example Ministry of Sports and Culture, Ministry of Tourism and Culture), there is bound to be some internal competition for resources for the management and monitoring of cultural policy. Only two countries have what can be considered stand‐alone culture ministries (Madagascar and Mauritius), while the others have combined ministries. Popular combinations in the region include sitting culture together with tourismor sports. Given that the region hosts some of Africa’s most touristic countries, as well as some of its best athletic nations, within such combinations there is always the risk that the culture department is somewhat neglected thus limiting resources available to potentially work on statistics. A counter example however comes from Uganda where culture falls under the Ministry of Gender, Labour and Social Development, and yet the review found that it was the country in the region with the strongest apparent existing base for cultural statistics. In some countries, responsibility for some specific subsectors sits at other ministries: for example both in Uganda and Tanzania, heritage falls under the responsibility of the ministry in charge of tourism.

13
Table 6: INSTITUTIONAL PLACEMENT OF CULTURE CABINET
Country Culture mainly falls under the Ministry of…
Comoros National Education, Research, Arts and Culture
Djibouti Muslim Affairs, Culture and Waqf goods
Eritrea Commission for Sports and Culture under Ministry of Education
Ethiopia Culture and Tourism
Kenya Sports, Culture and the Arts
Madagascar Culture, Crafts and Heritage
Mauritius Arts and Culture
Rwanda Sports and Culture
Seychelles Tourism and Culture
Somalia Education, Culture and Higher Education
South Sudan Culture, Youth and Sports
Uganda Gender, Labour and Social Development
Tanzania Information, Culture, Arts and Sports
Priorities for cultural statistics Ministry of cultural representatives who responded to the study questionnaire were asked to identify and rank two top priorities to be pursued by cultural statistics in their country. Their combined responses (7 in total), summarized below, should be taken merely an indication of what some of the priorities to be pursued through cultural statistics may be in the region. For each country, larger and more in depth consultations would be necessary on this crucial issue for setting national cultural statistics agendas. Of those who responded to the question on data comparability, most respondents indicated that having data that was internationally comparable was either highly desirable or desirable, if not always necessary. Table 7: SOME PRIORITY OBJECTIVES TO BE PURSUED BY CULTURAL STATISTICS
Rank Priority objective to be pursued by cultural statistics
1 Measuring number of cultural products/services, cultural infrastructure (eg. number of museums, number of domestic films produced)
2 Measuring employment in the cultural sector
2 Measuring the economic contribution of cultural industries (value added, revenue, etc.)
4 Enabling the monitoring and evaluation of specific policy initiatives to understand the impact of public investment in culture
In terms of the culture sector featuring in national development strategies, this was found to be the case for 10 out of the 13 countries covered in the study, albeit to varying degrees. The countries with the strongest integration (on paper) of the culture sector have in some cases even identified indicators to track progress in the sector – e.g. Tanzania’s ambitions for the “entertainment” sector contained in 2016‐2020 National Development Plan7. These key documents for setting the national development agenda also give an idea of what priorities may be bestowed upon cultural statistics. These, as well as the main orientations of the national culture policy are outlined in the country profiles.
7 United Republic of Tanzania (2016). National Five‐Year Development Plan 2016/17‐2020/21. Pp 63‐64

14
RECOMMENDATIONS
General recommendations Given the context of resource constraints for culture departments and to a lesser but still significant extent, national institutes of statistics, pragmatism is key in any endeavours to increase the availability of cultural statistics. With this in mind, some recommendations are: Why is the key question Before settling on the choice of any indicator, why it is being collected or constructed and how it can be used should be clear. This is essential to not waste resources producing indicators that have little policy utility. Build on what is available This study has revealed that a significant base for cultural statistics already exists in several countries. One should first attempt to extract cultural indicators from existing data, if necessary making adjustments in tools and data sets to improve data reliability or access new data in the future. Statistics Canada under Canada’s cultural statistics programme launched in 1972 undertook such an approach. It compiled culture sector employment data from regular labour force surveys and population censuses; it made changes to existing surveys, such as including an occasional time budget module in the General Social Survey and adjusting expense categories in household expenditure surveys to obtain cultural indicators in these fields8. Conversely, disappointing experiences in some of the countries in the region with undertaking primary data collection for studies rather than building on existing data, seem to demonstrate the pitfalls of not building on what is available. Defining the boundaries of the culture sector is essential Statisticians need to know precisely what they are being asked to measure; a definition of the culture sector or of cultural industries that clearly delineates what is considered part of the sector and what is not is thus essential. UNESCO’s FCS provides a definition of culture for statistical purposes and this has been adopted by the mapping studies undertaken in the region and in some policy documents. What is essential is that there is a national discussion on how the culture sector should be defined within the national context. The statistical definition of the culture sector should be relevant for policy. A UNESCO report for the Asian region reminds us that an underlying assumption of sector statistics is that cultural industries form a group of economic and social activities that has the character of a sector, and that effective policy development for these industries is only possible if they are considered as a sector per se, with distinctive needs and function9. The United Kingdom’s creative economy framework (DCMS), which adopts one of the widest definitions of cultural and creative industries, holds some sway in some African countries. Ministries tempted to adopt this model should reflect on the utility of having statistics that cover sectors that may fall completely outside of their policy remit, such as IT software. Adopting wide definitions of cultural industries may inflate the sector’s weight in the economy and in employment, but can lead to statistics that cloud rather than guide policy by lumping together sub‐sectors with very different policy needs10.
8 Gordon, J.C. and Beilby‐Orrin, H. (2006). International Measurement of the Economic and Social Importance of Culture, OECD, draft 2006‐08‐9. p27 9 UNESCO Bangkok (2007): Statistics on cultural industries: Framework for the Elaboration of National Data Capacity Building Projects 10 One notes that in the UK DCMS data, the sector “Software, computer games and electronic publishing” accounted for more than a third of the creative economy’s contribution to national GVA in 2003 (see Gordon and Beilby‐Orrin, 2006), leading practitioners to cite two figures, one including the software, etc. sector, and one without to get a clearer picture of the rest of the creative economy.

15
Non‐exhaustive indicators can be useful Getting exhaustive statistics is often tricky, time‐consuming and expensive. For example getting a full picture of the contribution of the culture sector to employment involves: 1) taking employment in the cultural industries (from industry classifications) 2) adding those employed in cultural occupations within non cultural industries (from occupational classifications). However depending on policy objectives “partial” measurement of employment may be just fine. If the policy objective is to track the contribution of cultural industries to job creation, the “incomplete” indicator of employment in cultural industries, without trying to capture cultural jobs hidden in other industries can suffice(creation of “hidden” jobs would in this case rely on growth in another industry, for example in the case of car designers, growth of the car industry), and has the advantage of being more readily available. If on the other hand the policy objective is linked to arts education, then indicators on just cultural occupations would be of key interest. When the level of detail in data is insufficient to isolate all cultural activity, partial indicators can still be useful, especially over time, as they can give an indication of overall trends.
Recommendations for capacity building The type of capacity building support will vary depending on the capacity in each country. Generally the following type of support can be envisaged:
- Provide guidance to countries on building bridges between the ministry in charge of culture and the national statistics institutes. In some countries, where responsibility for the culture sector is spread across ministries, one may also have to provide support to ensure that there is sufficient communication between ministries with culture related mandates
- Where necessary, provide support for determining a national statistically relevant definition of the culture sector
- In some low capacity countries, it may be necessary to provide support to updating/finalizing the cultural policy strategy
- Training for ministry of culture staff to provide a basic understanding of what statistics are, how they are constructed or collected, and how they can be used
- Technical assistance to help ministries of culture determine what culture policy priorities are for the development of cultural statistics, in collaboration with the national statistics institute. It should be ensured that the identified cultural statistics are integrated in the national statistics development plan
- Depending on capacities, either training or technical assistance on various topics, such as: o Developing standardized tools for data collection that countries will adapt o Constructing indicators from existing data and design for any new data. o Establishing a sampling frame for cultural establishments
Generating cultural statistics in Zimbabwe
The UNESCO Regional Office for Southern Africa has been providing support to the Zimbabwe government on collecting cultural statistics using the Culture for Development Indicators. A workshop was held in March 2017 to review a statistical annex of the Quadrennial Periodic Report submitted in 2016 as part of the country’s monitoring of progress on the 2005 Convention for the Protection and Promotion of the Diversity of Cultural Expressions. The annex provides statistical information about government’s expenditure on culture, exports/imports of cultural goods, contribution of culture to GDP, and national landscape of books, music, media, issues of connectivity/access, as well as cultural participation.

16
International expert from the 2005 Convention Expert Facility, Alfonso Castellanos and UNESCO regional cultural advisor for Southern Africa, Damir Dijakovic, presented examples from the region and guided discussions for how better to ensure statistical data in Zimbabwe.
This event was part of a series of consultations and workshops situating growth in the cultural sector as a key pillar of work for attaining the goals in the Zimbabwe United Nations Development Assistance Framework strategy 2016‐2020 for sustainable development.
To give impetus to the collection and analysis of statistics by the ministry in charge of culture, an economist with a background in statistics has been recruited by the ministry. Thus, while the main responsibility for national data collection lies with the national statistics office, ZIMSTAT, the ministry of culture now has the capacity to set its data agenda and to analyse and exploit available data. For more information see: http://en.unesco.org/creativity/news/harnessing‐cultural‐statistics‐sustainable‐development

17
EXPLANATORY GUIDE TO COUNTRY SUMMARIES
A. SUMMARY ASSESSMENT The aim of the summary assessment is to divide countries into groups with similar levels of existing capacities for future capacity building support. Given the limitations of the study, this is an approximate, non‐exhaustive assessment.
General capacity of statistics institute
This is a summary assessment of the capacity of the national statistics institute as a whole, not their capacity in terms of statistics on culture. The assessment is based on the breadth of statistical data available on the website of the statistics institute11. A score between 1 and 3 is allocated, specific to the countries covered in this study. The countries who appear to have the strongest systems within the group are given a score of 3.
Availability of cultural statistics
This is a summary assessment of the amount of cultural statistics that were found to be available or potentially available under the study. A score between 1 and 3 is allocated, specific to the countries covered in this study The countries who appear to have the greatest amount of cultural statistics available within the group are given a score of 3.
Definition of cultural sector/industries
Does the cultural policy or other national policy document define what the culture sector is or what cultural industries are in a way that can guide statisticians working on cultural statistics.
B. BACKGROUND CONTEXT Background information on the country context and cultural policy.
C. EXISTING DATA Data is divided into two categories:
‐ National indicators (vetted by national statistics institute and generally covering the whole country): in terms of influencing policy, indicators that are generated or have received the approval of the national statistics institute hold the most sway with national government. Indicators that are embedded in national data collection instruments or that can be extracted from existing data (perhaps with adjustments to improve data quality) also have greater chance of being sustainable and regular, rather than indicators that result from specific cultural data collection exercises.
‐ Other indicators: this includes data collected by the ministry in charge of culture but not vetted by the statistics institute, specific studies undertaken by other parties (e.g. the WIPO economic contribution of copyright industries studies) that cover all or a part of the cultural sector. Mapping studies, when not signed off by the national statistics institute are listed under this category. Administrative data, such as visitors to government managed cinema halls, even when published by the statistics institute are also listed here because it is not nationally representative data.
11 Compiling and providing equal access to data is among the fundamental principles of best practice for national statistics institutes. See for example: http://ec.europa.eu/eurostat/statistics‐explained/index.php/Statistics_in_development_cooperation_‐_quality_in_statistics

18
Indicator Source Last year available
Frequency Accessibility of cultural data
Description of indicator Source of data/survey, classification used and level of disaggregation in the data. For employment data by industry, the main international classification used is ISIC Rev. 4. This classification uses 4 digit levels corresponding to Section, Divisions, Groups, Classes. The sections that cover most economic cultural activity are “Arts, entertainment and recreation” and “Information and Communication”. To get an accurate picture of the cultural sector, however ideally data at a 4‐digit level is necessary as outlined in the UNESCO Framework for Cultural Statistics. For employment data by occupation, the main international classification used is ISCO 08. To get an accurate picture of the cultural sector, ideally data at a 4‐digit level is necessary as outlined in the UNESCO Framework for Cultural Statistics.
Last time the survey was carried out
How often the survey is carried out
Available: the indicator already exists. In some cases it may be a combined indicator and it may or may not be possible to isolate what is specific to culture. Eg. government expenditure on “recreation, culture and religion”. Extractable: the indicator does not exist, but can be extracted from existing data sets. Unavailable: no indicator on culture exists or can be extracted with current structure of data

19
D. CULTURAL POLICY DEFINITIONS What are the priorities defined in the cultural policy. Different countries place different emphasis on heritage, identity or economic dimensions of culture and this has implications for what priorities are for cultural statistics. Is there a national statistically relevant definition of the culture sector/cultural industries? A definition for statistical purposes establishes boundaries around what is included or excluded12. Currently no standard definition exists for culture, and the choice of boundaries can have a significant impact on what one measures, and on the ease of measuring it. The UNESCO cultural domains model is increasingly being used, but it is worthwhile that each country reflects on particularities of their national contexts and on the already existing statistical frameworks and capacities to decide on a definition that will have the greatest utility for policy makers that will also have a long “shelf‐life” withstanding changing circumstances.
E. CULTURE INTEGRATED IN DEVELOPMENT PLANS Is the culture sector already integrated in the main national development strategy/plan? If so how? Strategic orientations for the culture sector contained in such plans may be used to guide priorities for cultural statistics.
F. CULTURAL STATISTICS PRIORITIES What objectives for cultural statistics were prioritized in responses to the questionnaire administered to ministry of culture representatives for this study, and/or are suggested by key policy documents.
G. LEVEL OF COLLABORATION BETWEEN CULTURE AND STATISTICS How much interaction has there been to date between the ministry in charge of culture and the national institute of statistics. Responses come from the questionnaires administered under this study.
H. PROCEDURE FOR INTEGRATING NEW INDICATORS What are the procedures of the national statistics institute for integrating new indicators in the national data collection agenda? For greatest sustainability and also greatest quality, ideally any new indicators for culture should be integrated in national data collection instruments, such as national census, labour surveys or household consumption surveys.
I. CAPACITY NEEDS What capacity development needs are indicated by ministry of culture representatives.
J. POTENTIAL STAKEHOLDERS It is understood that the key stakeholders in each country will be the ministry in charge of culture and the national statistics institute and the various bodies that may emanate directly from these. This section lists additional private or public sector stakeholders that may be a source of knowledge or of expertise for the future cultural statistics capacity building project.
12 Statistics Canada, 2011: Conceptual Framework for Cultural Statistics 2011

20
COUNTRY PROFILE: COMOROS Ministry in charge of culture
Ministère de la Jeunesse, de l’Emploi, de l’Insertion Professionelle, de la Culture et des Sports http://www.unesco.org/eri/portal/countryguide_all.asp?contr=KM
Stand‐alone
ministry: No
Institute in charge of statistics
Institut National de la Statistique, des Etudes Economiques et Démographiques (INSEED)
A. SUMMARY ASSESSMENT General capacity of statistics institute 1
Availability of cultural statistics 1
Definition of cultural sector/industries No
B. BACKGROUND CONTEXT Comoros is small island state with a population estimated at around 750,000 inhabitants. Tourism is less well‐developed here than in neighbouring Indian Ocean islands. Cultural policy focuses on creating national cohesion and identity, in particular through heritage preservation. In the field of cultural industries, there have been some initiatives to develop the film industry, for example, by the creation of the Comoros International Film Festival in 2012. Comoros also hosts an international arts biennale, Festival of Contemporary Arts in Comoros, launched in 2012
C. EXISTING DATA The national statistics institute does not have a website and unfortunately did not take part in the study. The ministry of culture indicated that no cultural indicators exist to date. In the 2015‐2019 strategic plan for statistics13, INSEED, the national statistics office, indicates that in the past exercise no state budget was allocated for data collection. As such the bureau was dependent on donor funding for most of its data collection agenda. In its assessment of the national statistics system, the strategy notes structural weaknesses in statistical capacity, with a lower performance on a World Bank assessment indicator for the period 2008‐2014 than 2005‐2007. The assessments speak of an absence of statistics in several policy domains, or for those available, low reliability and timeliness.14
D. CULTURAL POLICY DEFINITIONS Comoros is currently working on its cultural policy. A few years ago, with assistance from UNESCO, the government drafted a strategic document to prepare its cultural policy15. A key focus is on preservation of heritage and promotion of national identity and values. This priority appears to respond to separatist tensions that have occurred in Comoros. Mention is also made of information and communications technology to support the cultural sector and addressing issues of copyright for cultural industries development. The document does not appear to clearly delineate what is included in the culture sector.
E. CULTURE INTEGRATED IN DEVELOPMENT PLANS Promotion of youth, sports and culture features as a sub‐domain of the strategic area 3 “Reinforced access to social services and improved resilience of households” of the national development strategy
13 INSEED/Paris 21 (2015): Resumé de la stratégie nationale de développement de la statistique (SNDS 2015‐2019) de l’Union des Comores 14 Idem. 15 http://www.mineducomores.gouv.km/culture‐art.php?sm=politique‐nationale‐culture

21
for 2015‐2019, SCA2D16. The agenda for culture includes heritage protection and promotion as well as action aimed at supporting the development of cultural industries.
F. CULTURAL STATISTICS PRIORITIES The national development strategy’s integration of culture suggests prioritizing tracking cultural heritage, as well indicators on the economic aspects of cultural industries. The ministry in charge of culture respondent indicated the following categories of priorities:
‐ Measuring number of cultural products/services, cultural infrastructure (eg. number of museums, number of domestic films produced)
‐ Measuring the economic contribution of culture (GVA, revenue, etc.)
G. LEVEL OF COLLABORATION BETWEEN CULTURE AND STATISTICS
Statistics unit in Ministry in charge of culture No
Culture sector skills at national statistics institute Unknown
Little to no collaboration between the two departments to date is reported. No budget allocation is made at the ministry of culture level for statistical data collection.
H. PROCEDURE FOR INTEGRATING NEW INDICATORS Unknown.
I. CAPACITY NEEDS Awareness raising on the utility of cultural statistics Technical assistance and training on collecting and analysing cultural statistics
J. POTENTIAL STAKEHOLDERS Other ministries with culture‐related mandates
Role
Ministre de la Production, de l’Environnement, de l’Energie, de l’Industrie et de l’Artisanat
Crafts sector falls under this ministry
Ministre des Postes et Télécommunications, de la Promotion des Nouvelles Technologies de l’Information et de la Communications chargé des Transports et du Tourisme
Tourism falls under this ministry
Institution Role
Office Comorien de la propriété intellectuelle, which sits under the Ministry in charge of industry and crafts
Data on copyright
Indian Ocean Commission Véronique Espitalier‐Noël Tel: (+230) 402 6100 E‐mail: secretariat(at)coi‐ioc.org
Potential partner/funder. Works on promoting Indian Ocean identity and culture. (Seychelles, Mauritius, Madagascar, Comoros)
International Organization of La Francophonie
Potential partner/funder. Has organized workshops on supporting cultural industries sector in Indian Ocean countries
16 Union de Comores (2014) : Stratégie de croissance accélérée et de développement durable (SCA2D) 2015 – 2019. November 2014.

22
Centre national de documentation et recherche Director : Mr Nouroudine Abbdallah [email protected]
Research organization
Collective des Comores – Director Ms Fatima Boyer [email protected]

23
COUNTRY PROFILE: DJIBOUTI Ministry in charge of culture
Ministère des Affaires musulmanes, de la culture et de biens waqf. Facebook page only https://www.facebook.com/Affaires‐musulmanes‐Culture‐et‐Biens‐Waqfs‐470078879746502/
Stand‐alone ministry: No
Institute in charge of statistics
Direction de la Statistique et des études démographiques http://www.dised.dj
A. SUMMARY ASSESSMENT General capacity of statistics institute 1
Availability of cultural statistics 1
Definition of cultural sector/industries May be forthcoming
B. BACKGROUND CONTEXT The Djiboutian economy is centred around maritime logistics and increasingly a fast‐growing tourism sector. Tourism, currently mainly business and adventure tourism, is expected to be a key driver for growth in the country’s development plan, Vision2035, with a target of attracting 500,000 visitors a year by 203017. As part of these ambitions, Djibouti has identified several sites as potential UNESCO World Heritage Site candidates, including some cultural heritage sites. With its population of around 900,000 inhabitants, Djibouti’s cultural sector, for the most part however is still nascent. A 2010 report18 notes that among the cultural industry sectors, the music sector appears to be making the most strides, boosted by the creation of a directorate in charge of copyright in 2005; while sectors like cinema are currently practically inexistent. In the heritage sector, the construction of a national museum is underway19 to boost heritage promotion. The country is in the process of drafting its first cultural policy, which however has not yet been officially adopted. The 2010 report noted that there had not been any monitoring or evaluation of cultural sector activity. The 2010 diagnostic also notes very weak involvement of the private sector in the cultural sector, which may mean that the economic dimensions of culture are less prominent in Djibouti than in other countries in the region.
C. EXISTING DATA National statistics are the responsibility of a directorate in Djibouti – the Directorate of Statistics and Demographic Studies – and not an independent bureau of statistics. The directorate is placed under the Planning Commissioner for Statistics (CPCS). The directorate’s website was recently developed with support from UNICEF and currently does not make available as much information. While capacity of DISED may be improving, in the past it has been plagued by problems preventing the regular publication of its statistical yearbook20. Existing national statistics available on the website appear to use a combination of older classifications, such as ISIC Rev 2 for economic activity, and national classifications which do not permit
17 https://www.oxfordbusinessgroup.com/overview/radar‐country%E2%80%99s‐immense‐potential‐getting‐more‐attention. Accessed on 11 April 2017 18 Ali Omar, Geudi/ ACP Secretariat (2010). Outils d’analyse du secteur culturel des Pays ACP – Rapport final, République de Djibouti, Programme de soutien aux industries culturelles, ACP Secretariat. 19 http://www.lanationdj.com/djibouti‐ville‐ministre‐de‐culture‐visite‐locaux‐futur‐musee/# Accessed on 11 April 2017) 20 http://www.dised.dj/annsta.html Accessed on 9 April 2017

24
the identification of the cultural sector. However no one from the directorate was available for this study to confirm this. The ministry in charge of culture indicates that to date no data collection has taken place by them.
D. CULTURAL POLICY DEFINITIONS For the past three years, Djibouti has been working of drafting its first cultural policy. This policy, which is not yet official is expected to contain a definition of the cultural sector; it remains to be seen if the definition will be statistically relevant, setting the boundaries of what is included and what is not in the culture sector.
E. CULTURE INTEGRATED IN DEVELOPMENT PLANS The national strategy « Vision Djibouti 203521 » places importance on culture for its role for building a consensual society. Culture appears under the pillar “Peace and national unity” with the ambition to promote a culture of peace (note a subregional context marked by instability) and cultural identity through national languages, culinary arts, national dress and music. The pillar on “Consolidation of human capital” also includes the promotion of artistic and cultural creation. As in the prior pillar, the social and identity dimensions of culture are emphasized more than any economic dimensions. This section of the national strategy document identified strategic orientations for culture (which may perhaps be taken up in the cultural policy being finalized). These are:
• Affirm our cultural identity and national languages, which involves : ‐ Good organization and management of cultural activity ‐ Guaranteeing the right to culture for everyone ‐ Encouraging the participation of women and youth in cultural life
• Preserving and promotion national cultural heritage • Increasing material, human and financial resources allocated to cultural development • Promoting interregional cultural exchanges • Inculcating Islamic values to youth and strengthening their role in community development • Promoting women in their Islamic dimension and reinforcing further their participation in
community development as a whole As mentioned earlier, tourism is presented as a strategic growth sector, under the pillar dealing with diversification of the economy. Cultural tourism does not feature prominently in the strategies for this sector.
F. CULTURAL STATISTICS PRIORITIES The integration of culture in Vision 2035 suggests a priority for tracking cultural heritage and cultural participation. The respondent from the Ministry of culture indicated the following categories of objectives as priorities:
Monitoring and evaluation of specific policy initiatives
Economic impact studies for specific cultural activities (eg. impact of a festival, impact of culture on tourism, impact of World Heritage Site status).
G. LEVEL OF COLLABORATION BETWEEN CULTURE AND STATISTICS
Statistics unit in Ministry in charge of culture No
21 République de Djibouti (2013?). Vision Djibouti 2035

25
Culture sector skills at national statistics institute Unknown
The ministry in charge of culture indicates that there has been little to no contact with the directorate of statistics to date. A recent workshop organized by the UNESCO Institute for Statistics in Rabat (Morocco) was attended only by ministry of culture staff; unfortunately DISED was not represented for the technical issues which required technical statistical knowledge.
H. PROCEDURE FOR INTEGRATING NEW INDICATORS DISED is currently drafting a new national statistics plan and intends to include the culture cabinet in its consultations.
I. CAPACITY NEEDS The ministry indicates staff needs as priority capacity needs; specifically a staff member in charge of statistics for the ministry, a staff member responsible for finalizing the cultural policy and a focal point at the statistics directorate, and may be even at the Ministry of Higher Education.
J. POTENTIAL STAKEHOLDERS Other ministries with mandates related to culture
Role
Ministère délégué auprès du ministère de l'économie et des finances, charge du commerce, des PME, de l'artisanat, du tourisme et de la formalisation
Tourism and crafts fall under this ministry
Other institutions Role
Office djiboutienne des droits d’auteurs et des droits voisins (Contact through the Ministry of Culture)
Although recently created (2015 or 2016 ?), this body could be a source of information on the copyright industries.

26
COUNTRY PROFILE: ERITREA Ministry in charge of culture
Commission for Culture and Sports, Ministry of Education (no website, Commission established in 2015. Culture was previously under the Ministry of Information)
Stand‐alone ministry: No
Institute in charge of statistics
National Statistics and Evaluation Office (no website)
A. SUMMARY ASSESSMENT General capacity of statistics institute Unknown
Availability of cultural statistics 1
Definition of cultural sector/industries No
B. BACKGROUND CONTEXT Eritrea is a relatively young country, established as an independent state in 1993. As such, nation‐building and culture’s contribution to creating common history, heritage and identity are national priorities. Promotion of the youth agenda is also a national priority, in particular in context marked by strong out‐migration of youth. Some sources indicate that Eritrea’s economy is a command economy. This would suggest that private sector activity is limited. There are efforts to promote international tourism, although facilities remain limited and there are frequent travel advisories issued discouraging Eritrea as a destination.
C. EXISTING DATA No staff from the statistics office was available for this study and the office does not have a website. It is unclear what national indicators are available and whether the classifications and level of disaggregation permit isolation of the culture sector. The respondent from the recently established Commission of Culture was not aware of any national statistics on the culture sector.
D. CULTURAL POLICY DEFINITIONS Eritrea does not currently have a comprehensive cultural policy. One analyst notes that responsibility for the culture sector has been shifted and shared by multiple institutions until the recent creation of the Commission of Culture and Sports in 201522. In September 2015 the government issued the Cultural and Natural Heritage Proclamation (No. 177/2015), which puts in place the mechanisms for the protection and preservation of Eritrea’s cultural heritage. This legislation defines what heritage is. There is however apparently no comprehensive definition that delineates what the cultural sector covers.
E. CULTURE INTEGRATED IN DEVELOPMENT PLANS No national development plan was identified for this study. Promoting heritage and the contribution of culture to nation building appear as national priorities from the Ministry of Information website (this ministry formerly housed culture)23
F. CULTURAL STATISTICS PRIORITIES The ministry respondent indicates a particular interest for:
‐ Measuring national cultural/linguistic diversity ‐ monitoring and evaluation of specific policy initiatives
22 Senai W. Andemariam (2016), “Cultural Policy in Africa”, published on 17 November 2016 on http://musicinafrica.net/cultural‐policy‐eritrea (Accessed 11 April 2017) 23 http://www.shabait.com

27
The documentation on culture consulted for this study contains nothing to indicate particular interest in the economic dimension of culture.
G. LEVEL OF COLLABORATION BETWEEN CULTURE AND STATISTICS
Statistics unit in Ministry in charge of culture No
Culture sector skills at national statistics institute Unknown
The Commission for culture has requested statistics support from the statistics office but this has not been forthcoming so far.
H. PROCEDURE FOR INTEGRATING NEW INDICATORS Unknown. No staff from the statistics office was available for this study.
I. CAPACITY NEEDS A key priority for the ministry is developing Eritrea’s cultural policy and capacity support for this is prioritized over capacity needs for statistics per se.
J. POTENTIAL STAKEHOLDERS Suggested potential stakeholders include:
Institution Role
Cultural Affairs of the People’s Front for Democracy and Justice
Potential data source. This unit within the ruling party PFDJ oversees cultural performances for Independence Day, as well as training and monitoring of Eritrean cultural troupes that travel abroad.
National Museum, Dr. Yosief Libsekal Director of National Museum of Eritrea [email protected]
Source of data on heritage

28
COUNTRY PROFILE: ETHIOPIA Ministry in charge of culture
Ministry of Culture and Tourism (MCT) http://www.moct.gov.et/index.php/en/
Stand‐alone ministry: No
Institute in charge of statistics
Central Statistical Agency of Ethiopia (CSA)http://www.csa.gov.et/
A. SUMMARY ASSESSMENT General capacity of statistics institute 3
Availability of cultural statistics 3
Definition of cultural sector/industries Work ongoing
B. BACKGROUND CONTEXT National government in Ethiopia has long been interested in preserving and promoting its cultural heritage and the country today hosts nine UNESCO World Heritage Sites. Culture and tourism are under the same cabinet department, and compared to other countries in the region, a significant part of tourism is culture and not nature based. The country has experienced strong economic growth in the past decade, and there is growing interest for the development of cultural industries. Ethiopian arts festivals, such as the Addis International Film Festival and the biennial Addis Foto Fest are gaining international recognition. Film and music industries in particular are quite dynamic, and demand for – as well as supply of ‐ cultural products and services is in part being driven by large and relatively affluent diaspora populations. Some observers note that the copyright system is very young in Ethiopia compared to elsewhere in Africa24 and this creates challenges for cultural industries.
C. EXISTING DATA No staff from the national statistics institute was available for this study. However, a desk review appears to indicate good general capacity for statistics. For instance, the WIPO study on the economic contribution of copyright industries undertaken in 2014 in Ethiopia cites several available data, mostly from the CSA, for estimating various economic value indicators. The few data challenges that are described for undertaking the copyright study, relate to minor and specific issues. No staff from the ministry of culture was available for this study. The 2016 cultural policy makes cultural statistics a priority through a specific strategic orientation on developing a national cultural database infrastructure (see next section). The ministry website also indicates the creation in May 2016 of a development and research directorate to increase knowledge for policymakers and stakeholders and enhance culture and tourism’s contribution to national economic growth and development. The first national symposium of this directorate was organized in April 2017 with the theme “Culture and Tourism for National Development”. One of the papers presented at this symposium dealt directly with the theme of statistics on cultural industries “Classification and measuring methodologies to wake up the sleeping giant of Cultural industries sector for economic, social and human / intellectual development in Ethiopia ”25. The paper includes a discussion on how cultural industries should be defined in Ethiopia.
24 Belete W. and Tadesse S. (2014). The Economic Contribution of Copyright‐based Industries in Ethiopia. WIPO, Geneva. 25 Ministry of Culture and Tourism (2017): First Annual Research Conference “Culture and Tourism for National Development”. Conference Program and Abstracts.

29
NATIONAL INDICATORS (vetted by national statistics institute and generally covering the whole country)
Indicator Source Last year available
Frequency Accessibility of cultural data
Employment
Employment by industry National Labour Force Survey (2013). Urban Employment Survey (2015) Both use National Occupational and Industrial Classifications (NOIC) which are adapted from ISCO‐08) and ISIC, Rev. 4. Data is collected at 4‐digit level
2015 2013
Annual for urban survey. National survey previously in 2005
Possibly extractable. The major industry groupings correspond with ISIC groupings.
Employment by occupation National Labour Force Survey (2013). Urban Employment Survey (2015) Both use National Occupational and Industrial Classifications (NOIC) which are adapted from ISCO‐08) and ISIC, Rev. 4. Data is collected at 4‐digit level
2013 Annual for urban survey. National survey previously in 2005
Possibly extractable. Coding of cultural occupations needs to be checked
Economic value
Contribution to GDP National accounts. Not accessed for this study. Data likely available at at least 2‐digit level of the NOIC classification
Annual? May be difficult to isolate cultural activity
Cultural consumption/participation
Household expenditure on recreation and culture
Household consumption and expenditure survey. Country‐specific COICOP classification, 2‐digit level (?)
2010 Previously in 2004
Available. May be not possible to isolate culture from recreation
Time spent on “attending/visiting cultural places/events”, “mass media”, “social and cultural”
Ethiopia Time Use Survey 2014 First such survey. Supported by UN Women
Available
Funding of culture
Government expenditure by function “culture and sport”
Data found for 2002‐2006 in an IMF report “The Federal Republic of Ethiopia: Statistical Annex”. Data is
Unknown Unknown. Annual?
Available, but not sure that culture can be isolated

30
likely available at CSA or Ministry of Economics and Finance, but could not be found on their websites
from sport expenditure
OTHER INDICATORS
Indicator Source Last year available
Frequency Sectors covered
Number of cinema halls, cinema audiences, number of films screened, and income (for cinemas administered by Regional Cultural Bureaus
Cinema
Number of users of public libraries, number of books in public libraries
Libraries
Number of registered cultural heritage, museums, visitors and revenue Number of collected heritages at the National Museum
Heritage
Copyright industries contribution to GDP, to national income, to national employment
The Economic Contribution of Copyright‐based Industries in Ethiopia, World Intellectual Property Organization.
2014 One‐off Books and press, Music & theatrical productions, Film & video, Radio & TV, Photography, Software & databases, Visual & graphic arts, Advertising, Copyright collection societies
Ethiopia submitted a 2005 Convention Periodic Report in 2016, with some data on publishing and media contained in the statistical annex. http://en.unesco.org/creativity/sites/creativity/files/periodic_reports/old/ethiopia‐quardinnel‐periodic‐report.pdf

D. CULTURAL POLICY DEFINITIONS Ethiopia drafted a new cultural policy in 201626. The new policy notes in its introduction that past cultural policy did not sufficiently address the economic significance of cultural activities and the issues of links between culture and contemporary technological products, nor did it clearly provide for the “institutional setup and coordination procedure required for the development of cultural resources which is critical to all the development sectors”. The current policy aims to fill these gaps. While the policy does not contain a statistically relevant definition of the culture sector, it does include a specific strategy on developing the “national cultural database infrastructure” which provides for, among others, the identification of modern statistical methods and operational mechanisms to establish a national cultural database system. The other 13 strategies of the cultural policy include strategies for the development of heritage resources, of cultural industries, of cultural tourism, and of popular participation and public benefits of culture.
E. CULTURE INTEGRATED IN DEVELOPMENT PLANS Culture and tourism feature under the cross‐cutting sectors targeted under the 2015‐2019 Growth and Transformation Plan27. The assessment of progress under the first GTP plan reveals a focus on heritage retrieval, preservation and promotion. The ambition under the second strategy is that culture
and tourism together contribute to 5% of GDP. The main objectives are to “improve the utilization of information resources, enhance the development of cultural industry and market networks, increase the conservation and development of cultural heritage, improve the market system of tourism sector and increase the variety and number of domestic tourism service providers”. Actions identified include establishing theatre and cinema centres and organising a certain number of cultural festivals and exhibitions. Monitoring data that enables the assessment of such policy initiatives would be of interest. Supporting and documenting linguistic diversity is also a key concern in the GTP.
F. CULTURAL STATISTICS PRIORITIES No staff from the ministry in charge of culture was available for this study. However the strategic orientations for the culture sector contained in the national development strategy, GTPII and those in the 2016 cultural policy suggest priorities in tracking the status of heritage, the economic contribution of cultural industries, statistics elucidating the links between culture and tourism, monitoring data to assess the outcomes of policy initiatives aimed at organizing cultural festivals, and tracking linguistic diversity.
G. LEVEL OF COLLABORATION BETWEEN CULTURE AND STATISTICS Statistics unit in Ministry in charge of culture No
Culture sector skills at national statistics institute Limited
H. PROCEDURE FOR INTEGRATING NEW INDICATORS The Ministry of Culture needs to submit its data requests to Council of Ministers.
I. CAPACITY NEEDS To be clarified with the MCT ministry and CSA.
26 Ministry of Culture and Tourism (2016). Cultural Policy of the Federal Democratic Republic of Ethiopia. Addis Ababa 27 Federal Republic of Ethiopia (2015). Growth and Transformation Plan II (2015/16‐2019/20). May 2016. National Planning Commission, Addis Ababa.

32
J. POTENTIAL STAKEHOLDERS Other ministries with culture related mandate
Ministry of Communication and Information Technology http://www.mcit.gov.et
May have responsibility for broadcasting sector, although this is not clear from the website.
Institution Role
Ethiopian Musicians Association http://ethiomusicians.org/
Provide data on music sector
Ethiopian Copyright and Neighbouring Collective Management Society
Provide data on copyright industries. NB. This institution may not yet have been set up
Ethiopia Intellectual Property Office http://www.eipo.gov.et/
Provide data on copyright industries. In 2015 announced plans to set up collective management society.
Ethiopian Filmmakers Association https://www.facebook.com/Ethiopian‐Filmmakers‐Association‐492326344130083/
Provide data on the film sector
Abcon Plc Consulting House Website: http://www.abconltd.et/
National Afrobarometer partner

33
COUNTRY PROFILE: KENYA Ministry in charge of culture
Ministry of Sports, Culture and Arts (MoSCA) http://www.sportsculture.go.ke/
Stand‐alone ministry: No
Institute in charge of statistics
Kenya National Bureau of Statistics (KNBS)http://www.knbs.or.ke/
A. SUMMARY ASSESSMENT General capacity of statistics institute 3
Availability of cultural statistics 2
Definition of cultural sector/industries Yes, forthcoming
B. BACKGROUND CONTEXT In recent years, government interest in Kenya for promoting the culture sector has gained momentum, and ambitions have focused in particular on the youth employment potential of cultural industries. While various policy instruments are under development, strategies for the culture sector are not as well defined as for two related sectors, which are pillars of growth for the Kenyan economy – tourism and ICT. While there is some interest in developing cultural tourism, a clear strategy does not yet exist and no statistics are specifically collected on this. As for ICT, there are ambitious plans for developing the ICT sector, including the development of Konza Valley – a Kenyan Silicon Valley – which may also constitute a hub for digital arts and film. ICT statistics are quite detailed and some indicators may potentially serve as proxies for local content in the digital realm. While public policy to support the culture sector is still taking shape, private sector activity is quite strong in particular in Nairobi, and the commercial potential has been judged high enough to lead an international consultancy firm, PriceWaterhouseCooper to publish an entertainment and media outlook for the country.
C. EXISTING DATA The Kenyan statistics office, KNBS, has good general capacity with a wide range of statistics available. Some capacity for cultural statistics exists already, but apparently outside of KNBS itself which has not directly worked on the sector. Due to the strong commercial interest in culture in Kenya a wealth of data exists on Kenyan cultural industries. The data however come from multiple sources, are rarely comprehensive and use different definitions and methodologies resulting in inconsistencies. Without vetting from the Kenya National Bureau of Statistics, senior policymakers have tended to mistrust such data. Kenya was the first country in the African region to participate in the WIPO studies on the economic contribution of copyright industries, and Kenyan expertise subsequently supported a similar study in Tanzania. In 2012 a private organization carried out a mapping exercise of cultural and creative industries; this study yielded interesting data from a qualitative point of view, but its methodology was not sufficiently robust to yield any representative indicators. A mapping of the sector under the aegis of the East African Community, as carried out in Uganda, has not yet been finalized due to funding constraints. While several Indicators for the culture sector can be extracted from existing national data sets, KNBS staff points out certain challenges for the reliability of such indicators, notably lack of reliable administrative data and the fact that cultural entities are underrepresented in the statistical business register. One notes that Kenya is currently carrying out a census of establishments survey, which could have presented an opportunity for improving the representation of cultural entities in the business register.

34
On the ministry of culture side, National Museums of Kenya, an independent state corporation affiliated to the ministry currently collects data on visitors to public museums and heritage sites, which are disseminated with tourism sector data. The Ministry is currently working with the National Commission for UNESCO to set up a data collection tool for cultural indicators at the county government level.

35
NATIONAL INDICATORS (vetted by national statistics institute and generally covering the whole country)
Indicator Source Last year available
Frequency Accessibility of cultural data
Employment
Employment by industry Annual Enumeration of Employees and Self Employed Persons. ISIC rev. 4, upto 4 digits The labour statistics are included in the Annual Statistical Digest, which presents some statistics at the 2‐digit level. Thus for instance in this publication employment in “Publishing” and in “Motion Picture, Video and television programming production” sub sectors can be identified as well as employment in “Museums activities and operation of historical sites”
2016 Annual Probably only partially extractable. Most sections relative to cultural activity seem to be disaggregated only to the 2‐digit level
Employment by occupation 2015 Kenya Integrated Household Budget Survey. Kenya National Classification of Occupations, adapted from ISCO 08, 3 digit level. Survey results are not yet published
forthcoming Every 10 years Partially extractable
Economic value
Contribution to GDP National Accounts. ISIC rev. 4, up to 4 digits. 2016 Annual (Partially) extractable
Number of establishments Census of Establishments survey is currently ongoing. ISIC rev. 4 classification, level of disaggregation unknown. Not clear if only formal sector establishments are covered.
forthcoming Previously in 2010
Unclear
Cultural consumption/participation
Household expenditure on recreation 2015 Kenya Integrated Household Budget Survey Expenditure on cultural services. COICOP. Questionnaire indicates data collection at 6‐digit level. Cultural categories are identifiable
Forthcoming Every 10 years Available
Visitors to national museums Statistical Abstract, original source National Museums of Kenya
2016 Annual Available

36
Daily and weekly newspaper circulation Statistical Abstract, compiled by KNBS from media houses data.
2016 Annual Available
Number of internet domains Statistical Abstract, compiled by KNBS from Kenya Network Information Centre data. Could be proxy for local content on internet.
2016 Annual Available
Cultural production
Firm level use of intellectual property rights National Innovation Survey 2012. Indicators for firm‐level use of intellectual property – copyright included in questionnaire, but no firms in survey had claimed copyright but rather patents, trademarks, etc. Firms from cultural industries sectors may not be represented in the sample for this survey
2012 One‐off Unavailable. No copyright data identified
Funding of culture
Government and county expenditure on culture
Public finance statistics and National Treasury for county data, published in annual Statistical Abstract. COFOG classification is used: the “recreation, culture and religion” function is reported. The level of disaggregation available is not clear.
2016 Annual Available. May not be possible to isolate culture
OTHER INDICATORS
Indicator Source Last year available
Frequency Sectors covered
Consumer and advertising spending in: Radio, Film, TV, videogames, Internet content, Music, Books and press.
Entertainment and media outlook: 2015‐2019. South Africa – Nigeria – Kenya – PriceWaterhouseCooper
2015 5 years Radio, Film, TV, videogames, Internet content, Music, Books and press
Employment and contribution to GDP of film sector
Economic Contribution of the Film and TV Industry in Kenya, Kenya Film Commission
2013 One off Film and TV
Qualitative and quantitative data on employment, earnings, sources of funding, education level, etc, but no representative indicators
Unearthing the Gems of Culture: mapping exercise of Kenya’s creative cultural industries, African Cultural Regeneration Institute (ACRI)
2012 One off Cultural heritage, performance and celebration, visual arts, crafts and

37
design, books and press, audiovisual
Unclear The role of culture and heritage in Development in Kenya, KIPPRA
Unpublished2012
One‐off Unclear
Incidence of movie viewership, frequency of viewing movies with local content, awareness of locally produced films, etc
Audience Consumption Trend Survey, Kenya Film Commission
2010 One off Film and TV
Copyright industries contribution to GDP, to national income, to national employment
The Economic Contribution of Copyright‐based Industries in Kenya, World Intellectual Property Organization
2009 One off Books and press, Music and theatrical productions, Film and video, Radio and TV, Photography, Software and databases, Visual and graphic arts, Advertising, Copyright collection societies
Kenya has submitted two 2005 Convention periodic reports, the last one in 2016. The two reports do not contain a statistical annex. http://en.unesco.org/creativity/monitoring‐reporting/periodic‐reports/available‐reports‐20

38
D. CULTURAL POLICY DEFINITIONS The 2009 National Policy on Culture and Heritage, which is currently being revised, defines various sectors of cultural activity including cultural industries. A policy specifically on cultural industries is also being drafted which should contain definitions better suited to statistical purposes. Debates during the drafting of this policy have addressed the issue of the breadth of the cultural (or creative) industries sector, with some pushing for wider creative industries definitions and others for more restricted cultural industries definitions. Under devolved government, some county governments may also develop cultural policy instruments at the local level. Harmonization of definitions may have to be ensured between central and country level.
E. CULTURE INTEGRATED IN DEVELOPMENT PLANS Culture featured weakly in Kenya’s Vision 2030 as drafted in 2007. However “Sports, Culture and Arts” were later added as one of the sixteen priorities to be addressed under the Second Medium Term Plan 2013‐17. Falling under the social pillar, this combined subsector is given the role of “Celebrating the Best in us”. While the plan expresses particular interest in promoting creative arts and cultural heritage as major sources of employment and income generating opportunities for the youth in particular, the constraints analysis and flagship projects contained in the plan are disproportionately targeted at the sports sector. The culture sector is also called on to play a role in promoting national ethics and identity, under the enabling environment pillar.
F. CULTURAL STATISTICS PRIORITIES Given the stock of scattered data available, a key priority for Ministry of culture officials is harmonizing definitions and instruments so as to have reliable and comparable data. Data on employment, in particular youth employment is of strategic interest. The ministry respondent also indicated a priority for tracking cultural production, specifically things like number of films produced, number of cultural troupes and number of heritage centres.
G. LEVEL OF COLLABORATION BETWEEN CULTURE AND STATISTICS Statistics unit in Ministry in charge of culture None
Culture sector skills at national statistics institute Limited to none
The ministry, as well as the National Commission for UNESCO has recently been liaising with staff from the national statistics office on initiatives underway to develop standard instruments for collecting cultural economy data. Understanding of the culture sector by the statistics office is still weak and needs to be reinforced.
H. PROCEDURE FOR INTEGRATING NEW INDICATORS Current data collection strategy are contained in the current KNBS strategic plan 2013‐2017. The plan elaborates how the existing data gaps are expected to be filled mainly through surveys and censuses and also through enhancing use of administrative records.
The respondent from KNBS suggested that since data gaps of the cultural sector might not have been well covered during the development of the strategic plan a different approach may have to be employed. This would ideally involve a collaborative arrangement between KNBS and key stakeholders of the cultural sector. Broadly, the following would need to done
Establish a collaboration mechanism among the stakeholders of cultural sector
Define the cultural sector in Kenya’s context

39
Provide detailed description of the economic activities (of producers of goods and services in the cultural sector)
Jointly identify the sector’s statistical needs
Take stock of data available through administrative records and registers
Identify data gaps
Identify surveys and studies that need to be conducted to fill the data gaps
Put appropriate mechanism for data collection e.g. inclusion of cultural sector enterprises in CBR, funding, capacity building
Establish institutional arrangements for sustainability of production of the relevant statistics
I. CAPACITY NEEDS The key capacity need expressed by MoSCA is for technical support on data collection and collation, and particularly on developing standardized tools for cultural data collection. There is also a need expressed for training on statistics for monitoring and evaluation and on how to use data for more effective management and planning of the culture sector.
J. POTENTIAL STAKEHOLDERS Other ministries with culture‐related mandates
Role
Ministry of Tourism Source of culture‐related tourism information
Ministry of Information, Communications and Technology
Broadcasting and ICT sector fall under this ministry, which also has some initiatives for the recorded music sector
Other institutions
National Museums of Kenya Heritage data
Music Collection Society of Kenya http://www.mcsk.or.ke/
Source of information on music royalties, etc.
Film Commission of Kenya http://www.kenyafilmcommission.com/
Kenya Film Classification Board http://kfcb.co.ke
Source of information on film sector (eg. number of foreign films licensed versus domestic films)
Creative Economy Working Group
Private sector industry group
Strathmore University, Department of Economics http://www.strathmore.edu
Has shown interest in cultural economy
Institute for Development Studies, University of Nairobi http://ids.uonbi.ac.ke
National Afrobarometer survey partner, and also core partner for East Africa

40
COUNTRY PROFILE: MADAGASCAR Ministry in charge of culture
Ministère de la Culture, de l’Artisanat et du Patrimoine http://www.macp.gov.mg/fr/
Stand‐alone
ministry: Yes
Institute in charge of statistics
Institut National de la Statistique ‐ INSTAThttps://www.instat.mg/
A. SUMMARY ASSESSMENT General capacity of statistics institute 2
Availability of cultural statistics 2
Definition of cultural sector/industries No
B. BACKGROUND CONTEXT The action of the ministry of culture in Madagascar has been strongly focused on heritage and cultural traditions; today there is growing interest in developing cultural industries. The 2005 Cultural Policy (in the form of an Act) mentions cultural industries, however interviews for this study suggest that knowledge and capacities at the policy level on cultural industries remain limited. As an Indian Ocean island, tourism is a major revenue earner; statistics on certain interactions between tourism and culture may be of strategic interest.
C. EXISTING DATA The national institute of statistics, INSTAT does not make all statistics available on its website. Only summary presentations of certain indicators can be freely consulted on their website; to access Excel sheets formal requests have to be made. The informant designated by the INSTAT hierarchy was not fully aware of the classifications used nor the level of disaggregation for national employment and value added data. A report on Foreign Direct Investment28 available on the INSTAT website indicates that that ISIC data is available at a 4‐digit level, at least for some sections. Funding of INSTAT activities appears to be problematic and there is no regular plan for data collection for this reason. The data collection agenda is to a large extent set by international donors (ILO, World Bank, UNICEF, UNFPA, USAID, AfDB) who to date have not had an interest in cultural statistics. Surveys are not always carried out with regularity due to budgetary constraints. Labour statistics, produced with ILO support, for instance date from 2012. A new census will be organized in 2017; for political reasons all questions relative to ethnicity and religion have been removed. The statistics department would like to put in place a satellite account for tourism, but this has not been possible yet. Similar action for culture is not foreseen. The ministry in charge of culture mainly collects data related to services it offers – eg. library users, visitors to national museums, visitors to festivals organised/supported by the Ministry. No sector‐wide data is currently collected.
For the 2005 Convention Periodic report, the ministry recently did a data collection exercise for which they consulted INSTAT for data on cultural product exports and imports, and the contribution of the culture sector to GDP. (The INSTAT officer interviewed for this study was not aware of this).
28 INSTAT/Banque centrale de Madagascar (2014): Etude sur les investissements directs étrangers à Madagascar.

41
NATIONAL INDICATORS (vetted by national statistics institute and generally covering the whole country)
Indicator Source Last year available
Frequency Accessibility of cultural data
Employment
Employment by industry 2010 Labour survey – classification and digit level unclear
2010 Unknown
Economic value
Contribution to GDP National accounts – classification and digit level unclear
2016 Annual/quarterly Unknown
Number of establishments
Number of formal establishments Register of formal establishments using the national classification to 5 digit level ‐ Nomenclature Malagasy des activités de Madagascar 2012
2016 Annual May be Culture sector establishments may or may not be identifiable under the section “Recreational and social services”
Cultural consumption/participation
2010 survey includes household consumption data for the Ariary region. Classification and digit levels unclear
2010 Unknown
OTHER INDICATORS
Indicator Source Last year available
Frequency Sectors covered
Users of cultural services Ministry of culture collects data on public library users, visitors to national museums, visitors to festivals organized by the Ministry
Annual Heritage, public services, festivals
Madagascar is to submit a 2005 Convention Periodic Report in 2017. It is expected to contain a statistical annex.

42
D. CULTURAL POLICY DEFINITIONS The 2005 cultural policy29 (National Cultural Policy for Socio‐Economic Development) is still the current policy although there are plans to evaluate it and draft a new policy. While the policy provides a definition of “culture”, it does not delineate the boundaries of the cultural sector, nor provide a definition of cultural industries, even if development of the latter is listed as an objective. The ministry informant feels that, compared to heritage there are insufficient skills and knowledge on cultural industries in Madagascar today. The Indian Ocean commission is working on a sub‐regional cultural industries initiative.
E. CULTURE INTEGRATED IN DEVELOPMENT PLANS The 2015‐2019 National Development Plan does not have the cultural sector as a key development area, but culture does feature under the area related to human capital development with specific mention being made of valuing heritage to the benefits of local communities so that culture can be a lever for development
F. CULTURAL STATISTICS PRIORITIES The respondent from the Ministry of culture indicated as priorities
‐ Measuring the number of cultural products/services and/or cultural infrastructure – in particular artistic production output, and status of heritage
‐ Understanding the role of cultural activities in sustainable development, for example role in social cohesion
While the ministry representative was not aware of the UNESCO CDIS indicators, these indicators would respond well to the second priority.
G. LEVEL OF COLLABORATION BETWEEN CULTURE AND STATISTICS
Statistics unit in Ministry in charge of culture No
Culture sector skills at national statistics institute Limited
To date there has been little collaboration between the Ministry of culture and the institute for statistics. The preparation of the 2005 Convention periodic report in 2016 was among the first times the two institutions worked together. Previously in 2001, INSTAT had participated in survey design for a database on cultural heritage.
H. PROCEDURE FOR INTEGRATING NEW INDICATORS The key hurdle for integrating new indicators in national data collection exercises is financial. According to INSTAT, the Ministry of Culture would have to secure international funding to fund any cultural statistics that required new data collection. A clear case must be made for relevance and priority of proposed indicators, given the context of budgetary constraints.
I. CAPACITY NEEDS Basic training for ministry of culture staff on what statistics are and how they are collected. According to the ministry respondent, staff lack even basic notions of statistics. Training on data collection, analysis and presentation methods Training on monitoring and evaluation of cultural policies
29 Présidence de la République de Madagascar (2005). Loi n°2005‐006 portant Politique Culturelle Nationale pour un développement socio‐économique.

43
At the level of the statistics institute, funding constraints probably need to be addressed if statistics of international standard are desired.
J. POTENTIAL STAKEHOLDERS Other ministries with culture related mandates
Ministère du Tourisme http://www.tourisme.gov.mg/
Source of culture‐related tourism data
Ministère de la Communication et des relations avec les institutions http://www.mcri.gov.mg/
Media sector falls under this ministry
Other institutions Role
Office Malagasy de Droits d’auteur http://www.omda.mg/
Data on copyright
Office Malagasy du Cinéma https://www.facebook.com/Office‐Malagasy‐du‐Cin%C3%A9ma‐691797464305496/?hc_ref=PAGES_TIMELINE
Data on film sector. Recently created in 2014.
Coef Resources Facebook: fr‐fr.facebook.com/pages/COEF‐Ressources/556167787765141
National Afrobarometer survey partner
Indian Ocean Commission E‐mail: secretariat(at)coi‐ioc.org
Potential partner/funder. Works on promoting Indian Ocean identity and culture. (Seychelles, Mauritius, Madagascar, Comoros)
International Organization of La Francophonie Potential partner/funder. Has organized workshops on supporting cultural industries sector in Indian Ocean countries

44
COUNTRY PROFILE: MAURITIUS Ministry in charge of culture
Ministry of Arts and Culture http://culture.govmu.org
Stand‐alone
ministry: Yes
Institute in charge of statistics
Statistics Mauritiushttp://statsmauritius.govmu.org/
A. SUMMARY ASSESSMENT General capacity of statistics institute 3
Availability of cultural statistics 2
Definition of cultural sector/industries Yes
B. BACKGROUND CONTEXT Multiculturality and the preservation and promotion of cultural heritage have been and are key cultural objectives in Mauritius. The country hosts two UNESCO World Heritage sites. Recently greater policy attention has been paid to the cultural industries, notably through the drafting in 2013 of a white paper on the creative economy “Creative Mauritius – Vision 2025” with UNESCO technical assistance. The tourism sector is a major revenue earner and tourism statistics are regularly collected; the government has ambitions to develop cultural tourism. The ICT sector is also a key growth sector in Mauritius; developments in this sector may boost digital arts, such as animation.
C. EXISTING DATA National statistics are particularly well developed in Mauritius, and of note are certain statistical innovations such as the development of a composite index on the quality of life and sustainable development. Some cultural indicators are available from Statistics Mauritius and others can be extracted from existing data sets. The Ministry of culture also collects some statistics, on heritage site visitors for example.

45
NATIONAL INDICATORS (vetted by national statistics institute and generally covering the whole country)
Indicator Source Last year available
Frequency Accessibility of cultural data
Employment
Employment by industry Continuous multipurpose household survey, ISIC Rev 4, 4 digit level
2016 Annual, quarterly Extractable
Employment in cultural occupations Continuous multipurpose household survey, ISCO 08, 1 digit level
2016 Annual, quarterly Difficult to isolate cultural activity
Economic value
Contribution to GDP National Accounts ISIC Rev. 4 – 4 digit level is collected every 5 years. 1 digit level data is published annually. The main source of information comes from VAT data, so informal activity it not well captured
2015 Every five years Difficult to isolate cultural activity
Number of establishments
Registered and licensed establishments by industry
Administrative records. ISIC Rev 4, 4‐digit level. Covers only formal sector activity
2012 2011
Now discontinued
Extractable
Cultural consumption/participation*
Household expenditure on recreation and culture
Household Budget Survey. COICOP 2012 Previously held in 2006/7
Available. Culture can likely be isolated
Government expenditure on culture Public expenditure is tracked by function, including the function “Recreation, culture and religion”.
2016 Annual Available. Not sure if culture can be fully isolated
Quality of life and sustainable development indicators
The government has plans to develop an index on the quality of life and sustainable development. The current proposal of indicators under this index includes: Average time spent on social, cultural and recreational activities; Average time spent on mass media use and entertainment; Freedom of press (Freedom House index)
‐‐ ‐‐ Not yet available

46
OTHER INDICATORS The Ministry respondent reported that the following unpublished data is collected by the ministry:
‐ Number of subscribers and users of Centre de Lecture et d’animation culturelle
‐ Number of visitors to World Heritage sites and to the 2 national museums ‐ Number of artists commissioned by the Ministry of Culture
D. CULTURAL POLICY DEFINITIONS The White Paper “Creative Mauritius: Vision 2025” is considered the most recent cultural policy document. It was officially adopted in 2014 and its operational implementation is just getting underway. The document provides a statistically useful definition of the culture sector with reference to the UNESCO and UNCTAD definitions of the creative industries, and proposes six sub‐sectors for analysis: heritage; performing arts; visual arts and crafts; languages, literature and publishing; audiovisual and interactive media; design. Legislation on the status of the artists is currently being drafted; the application of this may facilitate the collection of certain cultural data.
E. CULTURE INTEGRATED IN DEVELOPMENT PLANS Development of the fashion, entertainment, animation and cinema industries feature in the country’s development strategy “Vision 2030”30. The 2015‐2019 Government Programme31 has also contains ambitions for the culture sector: “Arts and Culture” features in third place of nine strategic sectors identified under the chapter “Quality of life”. Arts and culture are called upon in particular to contribute to national unity and promotion of the tourism industry. Measures to promote cultural tourism, religious pilgrimage and film production are targeted. The programme also mentions a start‐up scheme to support cultural entrepreneurs and the implementation of the Status of the Artist project.
F. CULTURAL STATISTICS PRIORITIES The top 2 objectives identified by the Ministry of Culture representative in interview:
‐ Measuring employment in the cultural sector ‐ M&E of policy initiatives
Reliable statistics on employment are a key priority because of the importance of job creation for central government. This indicator is thus viewed as key for supporting the case for greater budget allocations to the cultural sector. Statistics Mauritius indicates that such an indicator would be relatively easy to obtain on an annual basis. On the monitoring and evaluation of policy initiatives, the Ministry of culture would need to take a lead role; these kind of indicators are difficult for Statistics Mauritius to generate. A key concern for all cultural statistics for the Ministry is to obtain reliable and representative data through scientific methods. Ministry data that is currently available does not hold much sway because policymakers do not have confidence in the figures. A tax rebate scheme for the film sector has recently been put in place and there is keen interest from central government in the development of the film industry. This subsector may thus be a specific focus for statistics. Statistics elucidating the links between culture and tourism are also of strategic interest.
30 Republic of Mauritius (undated): Vision2030 summary 31 Republic of Mauritius (2015): Government Programme 2015‐2019: Achieving meaningful change. Address by the President of the Republic of Mauritius, January 2015

47
G. LEVEL OF COLLABORATION BETWEEN CULTURE AND STATISTICS Statistics unit in Ministry in charge of culture No
Culture sector skills at national statistics institute Yes
The Ministry of culture does not have any officer with specific responsibility for statistics. On the other hand, Statistics Mauritius has a culture unit in place, but collaboration between the Ministry of Culture and Statistics Mauritius has been occasional to date. Statistics Mauritius has consulted the Ministry to request whether they wanted to add questions to certain household questionnaires. And the Ministry has requested a statistics officer from Statistics Mauritius, but this request has not been satisfied due to resource constraints. Data collection costs for education and health statistics are borne by Statistics Mauritius, and the Ministry of Culture would like the same set up for culture statistics.
H. PROCEDURE FOR INTEGRATING NEW INDICATORS Statistics Mauritius recommends the following steps to the Ministry of Culture for integrating new indicators in national statistics:
‐ Identification of data needs ‐ Data gap analysis and prioritisation
I. CAPACITY NEEDS The main capacity need expressed by the Ministry of Culture is training or technical assistance to make data skills for culture available in the country. Support is needed on questionnaire design, data collection, data analysis and presentation. A secondary need is up‐to‐date software for data analysis.
J. POTENTIAL STAKEHOLDERS Other ministries with culture‐related mandates
Role
Ministry of Tourism http://tourism.govmu.org
Data on tourism and links with culture
Ministry of Technology, Communication and Innovation http://mtci.govmu.org
Data on broadcasting sector and digital animation sector
Other institutions Role
University of Mauritius Has been carrying out some research in culture sector that could be useful. Not sure of content
Mauritius Film Development Corporation http://www.mauritiusfilm.mu/
Data on film sector. Its website has good level of information and claims that 75 production companies shoot films in Mauritius annually
Mauritius Society of Authors http://masa.intnet.mu/
Data on copyright
The National Heritage Fund http://www.nhf.govmu.org
Data on heritage protection
Straconsult Website: www.straconsult.com
Consultancy firm that works with Statistics Mauritius on the Afrobarometer survey.
Indian Ocean Commission E‐mail: secretariat(at)coi‐ioc.org
Potential partner/funder. Works on promoting Indian Ocean identity and culture. (Seychelles, Mauritius, Madagascar, Comoros)

48
International Organization of La Francophonie
Potential partner/funder. Has organized workshops on supporting cultural industries sector in Indian Ocean countries

49
COUNTRY PROFILE: RWANDA Ministry in charge of culture
Ministry of Sports and Culture http://www.minispoc.gov.rw/
Stand‐alone ministry: No
Institute in charge of statistics
National Institute of Statistics for Rwandahttp://statistics.gov.rw/
A. SUMMARY ASSESSMENT General capacity of statistics institute 3
Availability of cultural statistics 2
Definition of cultural sector/industries No, definition is not clear
B. BACKGROUND CONTEXT Rwanda has experienced strong economic growth and significant poverty reduction over the past decade. The country in particular has a rapidly developing ICT sector and has had recent successes in tourism promotion. Some documents note a concern with promoting local cultural expressions and languages in a rapidly evolving ICT context32. The recent culture policy places emphasis on promoting the Kinyarwanda language, supporting creative arts industries, developing cultural tourism and ensuring genocide memory.
C. EXISTING DATA The Rwandan statistics office, NISR has good capacity and there is a foundation of existing data from which culture sector indicators can be extracted, although the representation of cultural establishments in the data sets may need to be improved. Unfortunately no staff from the Ministry of Culture was available for this study to inform directly on data collection efforts undertaken by the Ministry. The East African Community creative industries mapping study33 included Rwanda, but based Rwandan data on existing national statistics, rather than on a mapping survey.
32 Media High Council (2013). Baseline research on cultural and local content production in the media sector. Kigali, July 2013 33 Not yet published.

50
NATIONAL INDICATORS (vetted by national statistics institute and generally covering the whole country)
Indicator Source Last year available
Frequency Accessibility of cultural data
Employment
Employment in cultural occupations Labour force survey. Data is collected twice a year and published annually. Classification: ISCO 08, 4 digits The EICV – Integrated Household Living Conditions survey done every 5 years also contains data
2016 annual Extractable
Employment by industry Labour force survey. Data is collected twice a year and published annually. Classification: ISIC Rev. 4, 4 digits The EICV – Integrated Household Living Conditions survey done every 5 years also contains data
2016 annual Extractable
Economic value
Contribution to GDP National Accounts ISIC Rev. 4 – 2 digit level
2016 Annual Partially extractable
Number of establishments
Establishments by industry Establishment census. Covers both formal and informal sectors. Classification: ISIC Rev. 4, 4 digits
2014 Every three years Extractable
Cultural consumption/participation
Time use The EICV – Integrated Household Living Conditions survey contains time use data but this covers working hours by occupation and time spent on domestic chores. Currently time spent on other activities, including cultural activities, is not tracked.
2014 Every three years Not available
OTHER INDICATORS
Indicator Source Last year available
Frequency Sectors covered
Local content in TV and radio programming and written media and some consumer consumption data.
Baseline research on cultural and local content production in Rwanda’s Media Sector, Media High Council
2013
One‐off TV, radio, written press

51
Employment by occupation in film and radio sectors
Rwanda Skills Survey 2012 – ICT Sector Report 2012 One‐off Film, radio, software and other ICT sectors
Employment by occupation Rwanda Skills Survey 2012 – Tourism and Hospitality Report. Contains sections on the Creative, Arts and Entertainment sub sector and on Museums and memorials sub sector
2012 One off Performing arts, visual arts, heritage (museums)
Museum visits and income MINISPOC (Ministry of Culture) Annual Reports 2015 Annual Heritage (museums)
Rwanda is to submit a 2005 Convention Periodic Report in 2017. It is expected to contain a statistical annex.

52
D. CULTURAL POLICY DEFINITIONS The 2015 National Cultural Heritage Policy34 aims at protecting and preserving Rwandan culture so that it may serve as a foundation for national development. The policy identifies seven strategic objectives on: Rwandan history, genocide memory, promotion of Rwandan cultural values, legal frameworks for creative arts sector, development of a strategy for cultural tourism, promotion of Kinyarwanda language, and promotion of a reading and writing culture. The policy document does not delineate clearly the boundaries of the culture sector.
E. CULTURE INTEGRATED IN DEVELOPMENT PLANS Rwanda Vision 202035 developed in 2000 and updated in 2012 does not make any specific mention of the culture sector. There is a strong emphasis on science, technology and ICT; developments in these sectors may contribute to an enabling environment for certain cultural industries, such as the digital arts. Culture as a sector also does not feature in the 2013‐2018 Economic Development and Poverty Reduction Strategy II36 paper. This paper features the tourism sector as one priority area, and most plans are focused on natural site tourism, therefore links with the culture sector are not directly made. The Rwanda Development Board does however include one cultural project – Kigali Cultural Village ‐ in the list of investment opportunities in the tourism sector37. There is thus an opportunity for improved statistics on the culture sector to improve integration of the sector in national development planning.
F. CULTURAL STATISTICS PRIORITIES No Ministry of Culture staff was available for this study to indicate priorities for statistics. Some of the objectives pursued by the cultural policy, such as promoting a reading and writing culture, can be elucidated by education sector statistics. On the creative arts, the statistics institute indicates that it would be easy to obtain data on employment in the culture sector as the survey infrastructure is already in place. Obtaining GDP data for the sector is more difficult as the required level of detail for disaggregation is not always available.
G. LEVEL OF COLLABORATION BETWEEN CULTURE AND STATISTICS
Statistics unit in Ministry in charge of culture Unknown
Culture sector skills at national statistics institute 1 staff officer in Social and Demographics department is responsible for cultural statistics
Collaboration to date between the Ministry of Culture and the national statistics institute appears to have been on an ad hoc basis.
H. PROCEDURE FOR INTEGRATING NEW INDICATORS Rwanda’s national data collection agenda is strictly set by the five‐year national statistics plan. The current plan runs until 2018. Stakeholder consultations will take place to draft the new plan. This
34 Republic of Rwanda (2015). National Culture Heritage Policy. Ministry of Sports and Culture, February 2015. 35 Republic of Rwanda (2012). Vision 2020. Revised 2012. Kigali. 36 Republic of Rwanda (2013). Economic Development and Poverty Reduction Strategy II 2013‐2018. Kigali. May 2013. 37 http://www.rdb.rw/rdb/tourism.html Accessed 18 May 2017

53
would be the only opportunity for the Ministry of Culture to integrate new culture indicators for the next five years. For example, the current structure of time use data could be modified so that it enables the tracking of cultural participation.
I. CAPACITY NEEDS No Ministry of Culture staff was available for this study to identify capacity needs for cultural statistics.
J. POTENTIAL STAKEHOLDERS Other ministries with culture‐related mandates
Role
Ministry of Trade, Industry and East African Affairs www.mineacom.gov.rw/
Has the mandate for tourism development
Ministry of Youth and ICT www.myict.gov.rw
ICT data related to culture
Other institutions Role
Rwanda Academy of Language and Culture http://ralc.gov.rw
Public institution to promote language and culture. They have been involved in past data collection efforts, such as the not completed mapping study
Media High Council http://mhc.gov.rw
Data on broadcasting and media sector. The Council is an independent constitutional body responsible for media capacity building.
Rwanda Society of Authors www.facebook.com/Rwanda‐Society‐of‐Authors‐Rsau‐240918333039314/
Data on copyright industries. Organisation was created in 2010, and may not yet be well established: for instance it has no website, only a very perfunctory Facebook page with no contact information.
Rwanda Film Federation http://rwandafilmfederation.com/ Email: [email protected]
Apex organisation for film makers. Potential source of information on film sector.

54
COUNTRY PROFILE: SEYCHELLES Ministry in charge of culture
Ministry of Tourism and Culture (formerly Youth, Sports and Culture. http://www.pfsr.org/
Stand‐alone
ministry: No
Institute in charge of statistics
National Bureau of Statisticshttp://www.nbs.gov.sc/
A. SUMMARY ASSESSMENT General capacity of statistics institute 3
Availability of cultural statistics 2
Definition of cultural sector/industries Partial
B. BACKGROUND CONTEXT Seychelles, a small island state with a population of less than 100,000, has tourism as one of the pillars of its economy. Culture sits in the same ministry of tourism, and there appears to be an ambition to place culture at the centre of tourism development38. Identity and heritage promotion are key cultural policy objectives and specific attention is given to popular participation in cultural activities and promotion of the Kreol language39. As in other Indian Ocean countries, there is growing interest in the cultural industries and 2014 saw the creation of a Creative Industries and National Events Agency. In addition to promoting creative industries, the events coordinated by this agency should contribute to developing cultural tourism.
C. EXISTING DATA National statistics appear well organized and a good amount of data is available on the website of the statistics institute. The levels of disaggregation of international classifications used however is low, probably due to the small size of the country. It is not clear from the Ministry of culture’s website what data, if any, are collected by the ministry and unfortunately no representative was available for this study.
38 http://www.nation.sc/article.html?id=244512 . Accessed on 10 March 2017 39 Ministry of Local Government, Sports and Culture (2004). The Cultural Policy of the Republic of Seychelles.

55
NATIONAL INDICATORS (vetted by national statistics institute and generally covering the whole country)
Indicator Source Last year available
Frequency Accessibility of cultural data
Employment
Employment by industry Administrative data compiled by NBS, covers only formal sector establishments; self‐employed artists not accounted for. Classification: ISIC Rev 4. 1 digit level. At this level only “Arts, entertainment and recreation” (which includes sports) can be clearly identified. Other culture sector activity is hidden in other sections Census data (2010) may be a better source for estimating this indicator
2016 Annual Only very partially
Economic value
Contribution to GDP National accounts. Classification: ISIC Rev 4. 1 digit level. At this level only “Arts, entertainment and recreation” can be clearly identified. Other culture sector activity is hidden in other sections. Note an indicator is extracted for “Value added by tourism related industry” which includes value added by “Arts, entertainment and recreation”.
2016 Annual Only very partially
Exports and imports Classification: HS 2002, division level 2016 Annual Only very partially
Cultural consumption/participation
Household expenditure on “recreation and culture”
2013 Household Budget Survey (NBS). Classification COICOP 2 digit level
2013 Every 5 years. But prior survey took place in 2006.
Available
Travel expenditure on cultural activities 2013 Household Budget Survey (NBS).
2013 Every 5 years. But prior survey took place in 2006.
Available
Languages spoken National census 2010 Every 10 years Available

56
D. CULTURAL POLICY DEFINITIONS Cultural policy in Seychelles prioritizes issues of identity, heritage and cultural participation. The 2004 Culture Policy40 does not define the culture sector in a statistically relevant sense. A 2014 act for the creation of a Creative Industries and National Events Agency (Act 17 of 2016) provides a clearer definition for creative industries, which however may not be comprehensive: “creative industry means an activity that combines the creation, production and commercialisation of products and services which (a) are intangible, tangible and cultural in nature and protected under the Copyright Act 2014); and (b) take the form of inter alia goods or services such as arts, dance, crafts, music, film video and literature.” A draft policy for cultural industries was prepared in 2015 with UNESCO support; when finalized this policy may give a statistically clearer definition of the industries. A music industry policy was also drafted at the same time.
E. CULTURE INTEGRATED IN DEVELOPMENT PLANS The 2017 National Strategy41 mentions “Participation in sports and culture will continue to be encouraged through the provision of infrastructure to enable Seychellois to participate effectively at the level of their community as well as in the national and international arenas”. Tourism is identified as one of two key drivers of growth
F. CULTURAL STATISTICS PRIORITIES No representative from the Ministry in charge of culture was available for this study to indicate what types of cultural indicators may be prioritised. Some of the functions of the Creative Industries agency include the promotion of exports of creative goods and services and the monitoring of trends in international creative industries and their impact on Seychellois culture and society. As such tracking cultural production/exports as well trends in cultural consumption (eg. number of foreign films and domestic films screened) may be of interest. Given the small size of the country collecting such statistics may not be too onerous. The goal on sports and culture participation contained in the national strategy could be elucidated by time use data.
G. LEVEL OF COLLABORATION BETWEEN CULTURE AND STATISTICS
Statistics unit in Ministry in charge of culture No
Culture sector skills at national statistics institute Limited
There has been little, and sporadic, contact between the ministry in charge of culture and the statistics institute to date. To work on cultural statistics, the statistics institute insists that it needs a clear definition of what the sector covers.
H. PROCEDURE FOR INTEGRATING NEW INDICATORS While current classifications often seem to lack the required level of data to identify cultural sector activity (employment, economic contribution), the statistics office indicates that it would be fairly easy to introduce modules in ongoing monthly surveys to target culture sector employment data, and slightly more difficult, but still possible, for value added data too. A culture module could also be integrated into the household budget survey, on request and justification by the Ministry in charge of culture.
I. CAPACITY NEEDS The statistics bureau appears well organized; they indicate however that they need a clear definition of the culture sector to be able to work on cultural statistics.
40 Ministry of Local Government, Sports and Culture (2004). The Cultural Policy of the Republic of Seychelles. 41 Republic of Seychelles: Seychelles 2017 Strategy

57
No representative from the Ministry of Culture was available for this study to comment on their capacity needs.
J. POTENTIAL STAKEHOLDERS
Other ministries with culture‐related mandates
Role
Department of Communications Technology, Office of the President http://www.ict.gov.sc/ [email protected]
Data on broadcasting sector
Institution Role
Seychelles Authors and Composers Society�Email: [email protected]
Provide data on cultural copyrighted production
Indian Ocean Commission E‐mail: secretariat(at)coi‐ioc.org
Potential partner/funder. Works on promoting Indian Ocean identity and culture. (Seychelles, Mauritius, Madagascar, Comoros)
International Organization of La Francophonie Potential partner/funder. Has organized workshops on supporting cultural industries sector in Indian Ocean countries
While there is no film board in Seychelles, the Seychelles Tourism Board is active in promoting film shoots in the country.

58
COUNTRY PROFILE: SOMALIA Ministry in charge of culture
Ministry of Education, Culture and Higher Education (MOCHE) http://moche.gov.so/index/
Stand‐alone ministry: No
Institute in charge of statistics
Directorate of National Statistics (DNS) ‐Ministry of Planning and International Cooperation http://mopic.gov.so/national‐statistics‐directorate/
NB. The regions of Puntland and Somaliland also have regional ministers for all sectors of government
A. SUMMARY ASSESSMENT General capacity of statistics institute Unknown (1 ?)
Availability of cultural statistics 1
Definition of cultural sector/industries No
B. BACKGROUND CONTEXT Somalia has been racked by decades of unrest and instability. Efforts to rebuild are earnestly underway and elections were successfully held in March 2017. The Somali context is marked by a bulging youth population and very high youth unemployment – at almost 70%, it is among the for the highest in the world42. The youth promotion agenda tends to influence greatly the cultural promotion agenda, and culture recently sat within Youth and Sports cabinet. Identification and protection of tangible cultural heritage has also at times been an urgent priority in the context of post‐conflict rehabilitation. A 2013 UNESCO scoping study43 noted that decades of civil war had resulted in the devastation of cultural infrastructure and severe loss of Somali national heritage with almost all cultural institutions damaged or destroyed. One also notes that several forms of artistic expression were curtailed in areas under the control of the extremist Al‐Shabaab group. Despite the challenging context some cultural activities manage to take place. One can for instance note the organization of the annual Hargeisa International Book Fair for nine editions in Somaliland, and in the past two years the federal ministry in charge of culture has made efforts to revive public cultural activity.
C. EXISTING DATA NATIONAL INDICATORS The Directorate of National Statistics appears quite active in rebuilding Somalia’s statistical base. In 2015 it led the process of reviewing the Statistical Act dating from the 1970s, overhauled the Consumer Price Index information to align with international COICOP classifications, and launched the results of the Population Estimation Survey, the first such exercise since 1986. Despite these efforts, it is unlikely that statistics permitting the identification of the cultural sector (employment, contribution to GDP, number of establishments, etc.) exist today. However, no staff from the DNS was available for this study to confirm this. OTHER DATA The NGO CISP (International Committee for the Development of Peoples) undertook qualitative research on Somali perceptions of their cultural heritage in 2016.
42 Padilla Q. and Trigo‐Arana G. (2013). Scoping Study on the Culture Sector in Somalia: A research study report. UNESCO, December 2013 43 Idem.

59
D. CULTURAL POLICY DEFINITIONS Somalia does not currently have a cultural policy.
E. CULTURE INTEGRATED IN DEVELOPMENT PLANS Youth, sports and culture is one of nine sectors targeted under the area of social development in the national development plan44. Under this area, the youth agenda is clearly given the greatest importance, within a context of high youth out‐migration and the risk of radicalization. Promotion of the cultural activities, however, does get a mention, to give “young Somalis an opportunity to revive Somali culture and express themselves creatively
F. CULTURAL STATISTICS PRIORITIES In the Somali context, the first priority for the Ministry in charge of culture is to relaunch cultural activity; without this, ministry staff have difficulty considering what data should be priority. Identifying and restoring tangible heritage probably has an important role to play in the post‐conflict cultural rehabilitation efforts.
G. LEVEL OF COLLABORATION BETWEEN CULTURE AND STATISTICS
Statistics unit in Ministry in charge of culture No
Culture sector skills at national statistics institute Unknown
H. PROCEDURE FOR INTEGRATING NEW INDICATORS No staff from the statistics body was available for this study. The DNS website indicates that work is ongoing to put in place the mechanisms for the “Somali High Frequency Survey” which is to establish a household and market survey system that can be used to regularly collect data in Somalia. The mechanism will use electronic means for greater cost efficiency. While statistics are not the immediate priority for the cultural department, this mechanism may provide an opportunity to collect household data related to culture (eg. on cultural participation).
I. CAPACITY NEEDS Capacity‐building specifically on cultural statistics, for it to be relevant and have an impact, in Somalia should be delayed until support for revitalizing cultural activity is in place.
J. POTENTIAL STAKEHOLDERS
Institution Role
The Heritage Institute for Policy Studies (HIPS) www.heritageinstitute.org
HIPS is an independent research organization with both qualitative and quantitative research skills. To date they have undertaken work mainly on human security and governance issues, but their fellows include scholars from the literature and culture field.
44 Federal Government of Somalia (2016): National Development Plan 2017‐2019. Final – October.

60
COUNTRY PROFILE: SOUTH SUDAN Ministry in charge of culture
Ministry of Culture, Youth and Sports Stand‐alone ministry:
No Institute in charge of statistics
National Bureau of Statistics
A. SUMMARY ASSESSMENT General capacity of statistics institute 1
Availability of cultural statistics 1
Definition of cultural sector/industries May be forthcoming
B. BACKGROUND CONTEXT South Sudan is currently plagued by instability and insecurity. Due to the security and logistical context in South Sudan, a lot of government activity is confined only to Juba, as plane travel is required for elsewhere. This places limits on any data collection exercise. This is true also for the Ministry in charge of culture. The ministry has recently been working on identifying candidate sites for UNESCO’s World Heritage list.
C. EXISTING DATA NATIONAL INDICATORS Limited national statistics in general are currently available on South Sudan. Economic activity as reported in the national accounts is largely dominated by the crude oil sector and national accounts data (GDP, value added) are disaggregated into oil and non oil sectors45. It is unlikely that statistics permitting the identification of the cultural sector (employment, contribution to GDP, number of establishments, etc.) exist today. However, no staff from the statistics bureau was available for this study to confirm this. The only national statistics specific to the culture sector found were relative to the government budget allocated to the cabinet (which also covers youth and sports). OTHER DATA The Ministry is currently working on undertaking an inventory of natural and cultural heritage with support from UNESCO. The ministry has also submitted film statistics for the UIS feature film survey in 2017.
D. CULTURAL POLICY DEFINITIONS A new cultural policy is being developed and should be approved during the course of 2017. A draft was not available for this study, so it is not clear whether the culture sector is delineated in a statistically relevant manner. The policy is expected to place a key emphasis on cultural dialogue for peace.
45 https://knoema.com/SSNA2011/national‐accounts‐of‐south‐sudan‐2014.

61
E. CULTURE INTEGRATED IN DEVELOPMENT PLANS In 2010, South Sudan drafted a national strategy entitled Vision 2040. Nation‐building and consolidation of a peaceful society are key themes in this strategy46, although the full strategy document was not consulted for this study.
F. CULTURAL STATISTICS PRIORITIES The primary concern right now for the Ministry is to re‐launch cultural activity. Without much activity on‐going, Ministry staff have difficulty considering what data should be priority. For the 2015/16 fiscal year only 0.2% of the government budget was allocated to the Culture, youth and sports cabinet47, but one notes that only 47% of this budget allocation was spent by the ministry. This may be indicative of the low level of lack of activity currently possible due to logistics and security concerns.
G. LEVEL OF COLLABORATION BETWEEN CULTURE AND STATISTICS Statistics unit in Ministry in charge of culture No
Culture sector skills at national statistics institute Unknown
There appears to be no collaboration between the Ministry in charge of culture and the National Statistics Bureau. According to the ministry in charge of culture, the latter is currently almost exclusively focused on collecting population statistics.
H. PROCEDURE FOR INTEGRATING NEW INDICATORS No staff from the statistics body was available for this study.
I. CAPACITY NEEDS Capacity‐building specifically on cultural statistics, for it to relevant and have an impact, in South Sudan should be delayed until support for revitalizing cultural activity is in place.
J. POTENTIAL STAKEHOLDERS
Institution Role
The Sudd Institute www.suddinstitute.org
The Sudd Institute is an independent research organization that conducts and facilitates research and training to inform public policy and practice. To date they have undertaken work mostly on the theme of governance and human security. They could potentially be partners on more qualitative studies.
46 https://pachodo.org/latest‐news‐articles/pachodo‐english‐articles/1634‐highlights‐of‐the‐vision‐2040‐for‐southern‐sudan Accessed 20 February 2017 47 Ministry of Finance and Economic Planning, 2015/16 Full Year Macro‐Fiscal Report, October 2016.

62
COUNTRY PROFILE: TANZANIA Ministry in charge of culture
Ministry of Information, Culture, Arts and Sports http://habari.go.tz/
Stand‐alone ministry: No
Institute in charge of statistics
National Bureau of Statisticshttp://www.nbs.go.tz/
A. SUMMARY ASSESSMENT General capacity of statistics institute 3
Availability of cultural statistics 2
Definition of cultural sector/industries Not clear
B. BACKGROUND CONTEXT Tourism constitutes a major economic sector in Tanzania (13% of GDP and 11% of employment48)., but the links with the culture sector for now are not very strong. Tourism is mostly nature based, as are Tanzania’s World Heritage sites and tourism and culture are under separate ministries. The culture cabinet used to sit with the Ministry of Education and previous cultural policy had a significant formative focus. Promoting the Kiswahili language was and is still also a priority. Today, there is increasing interest in cultural industries, and the film and music sectors particularly are thought to be experiencing rapid growth in urban centres. The creative industries, with a focus on entertainment, feature in the current national development plan (see section E).
C. EXISTING DATA The National Bureau of Statistics appears to have good capacity, although no one from the institute was available for this study. A significant amount of data that may allow for the extraction of cultural indicators already exists, although there may be issues with the representation of cultural establishments in the data sets. The sources available from outside of the bureau of statistics seem to indicate insufficient collaboration with the bureau of statistics and under‐exploitation of existing data. Hence the 2012 WIPO study on copyright industries in Tanzania, which had to be relaunched after an initial unsuccessful attempt, points out:“ One of the main shortcomings of the earlier attempt was the mistake of focusing on primary data rather than secondary data which are published and/or available in government reports and other records”49. An East African Community funded mapping study was undertaken in 2014 but to date the results have not yet been published. It may be that the mapping was confronted with the same difficulty as the earlier WIPO study.
48 World Tourism and Travel Council, 2014 cited in Tanzania Bureau of Statistics (2015): Compendium of tourism, accommodation facilities, culture, sports, information and communication statistics classifications for Tanzania 49 WIPO (2012), The Economic Contribution of Copyright‐based Industries in Tanzania. p24

63
NATIONAL INDICATORS (vetted by national statistics institute and generally covering the whole country) NB: The information contained in this comes entirely from internet research. Some conclusions, in particular regarding the accessibility of cultural data will need to be confirmed by the Tanzania Bureau of Statistics
Indicator Source Last year available
Frequency Accessibility of cultural data
Mapping
Employment
Employment by occupation
Integrated Labour Force Survey. TASCO classification (adapted from ISCO 1988), 4‐digit level
2014
5 surveys so far. Prior to 2014, held in 2006
Extractable
Employment by industry Integrated Labour Force Survey. ISIC Rev.4, 4‐digit level
2014
5 surveys so far. Prior to 2014, held in 2006
Extractable
Economic value
Contribution to GDP/value added System of national accounts. ISIC Rev.4, possibly 4‐digit level
2015 Annual Extractable
Foreign trade (imports and exports) System of national accounts. HS 2012 and SITC Rev 4. Digit levels unknown
2013 Annual? Unlikely that cultural products can be identified
Number of establishments
Number of establishments Statistical Business Register. Not sure whether this register covers only formal sector businesses. ISIC Rev. 4, at least 2‐digit level, possibly 4‐digit level
2014/15 First survey held in 2011/12
Extractable (may be only partially)
Cultural consumption/participation
Mean time spent on “attending, visiting cultural, entertainment and sport events”
Integrated Labour Force Survey. ICATUS 2014 5 surveys so far. Prior to 2014, held in 2006
Available, but not clear whether solely “cultural” events can be isolated.
Household expenditure on recreation and culture
2011/12 Household Budget Survey. COICOP, digit level unknown. The survey also included a module on domestic tourism
2011/12 6 surveys so far. Prior to 2011, held in 2001
Available, but not clear whether only culture can be isolated

64
In addition to these indicators, Tanzania Bureau of Statistics published in 2015 a “Compendium of tourism, accommodation facilities, culture, sports, information and communication statistics classifications for Tanzania. This is a methodological document and it highlights the lack of data sources in particular for culture and sports. OTHER INDICATORS
Indicator Source Last year available
Frequency Sectors covered
Mapping of cultural and creative industries Ministry of Information, Culture, Arts and Sports Study funded by EAC. This report has not yet been made public, apparently because of data quality issues
unpublished One‐off Cultural and Natural Heritage, Books and Press, Performing Arts and Celebrations, Visual Arts and Crafts, Audio Visual and Interactive Media, Design and Creative Services, Culture and Tourism, Intangible Culture Heritage.
Copyright industries contribution to GDP, to national income, to national employment
The Economic Contribution of Copyright‐based Industries in Tanzania, World Intellectual Property Organization. 2 Kenyan consultants who had worked on similar Kenyan study and Doreen Sinare of Copyright Society of Tanzania (COSOTA) and Alinda Lema of Business Registration and Licensing Agency (BRELA) were the researchers of the report
2012 One‐off Books and press, Music and theatrical productions, Film and video, Radio and TV, Photography, Software and databases, Visual and graphic arts, Advertising, Copyright collection societies

65
D. CULTURAL POLICY DEFINITIONS Current policy documents do not contain statistically relevant definitions of the culture sector. The cultural policy dating from 1997 is very comprehensive covering several cultural issues including promotion of the Kiswahili language, arts education, child upbringing and national values and identity. Cultural industries promotion is mentioned, but these industries are not defined. A new culture policy is currently being finalised; this may or may not contain a more statistically relevant definition of the sector. The methodological compendium produced by the statistics bureau in 2015 takes up UNESCO’s wide definition of culture but not that of cultural domains. In 2012, the UNESCO office commissioned a study to produce a strategic plan for CCIs in Tanzania; this study adopted UNESCO definitions of cultural domains. The mapping study also used this definition.
E. CULTURE INTEGRATED IN DEVELOPMENT PLANS The 2016‐2020 National Development Plan50 integrates the “creative industry sector” in its strategic interventions for industrialization and human development. The plan shows interest, in particular in the entertainment sector, which is deemed to hold strong employment potential for urban youth. Monitoring indicators identified in the national plan for the creative industries (also defined as “entertainment industry”) are:
‐ Share of GDP ‐ Real growth ‐ Number of registered training institutions ‐ Number of students registered for entertainment industry training education ‐ Number of registered individuals engaged in creative industry ‐ Number of arts groups registered ‐ Number of companies registered in creative industry ‐ Share of total employment
F. CULTURAL STATISTICS PRIORITIES The document review suggests certain priorities, in particular the performance indicators identified for the “entertainment” sector in the national development plan (see section E).
G. LEVEL OF COLLABORATION BETWEEN CULTURE AND STATISTICS
Statistics unit in Ministry in charge of culture 3 staff members dealing with statistics
Culture sector skills at national statistics institute Unknown
While there are staff with responsibility for statistics, it appears little to no budget has been allocated by the ministry in charge of culture for statistics. To date, there has been occasional liaising between the ministry and the statistics institute. The ministry notably provides certain data for the Tanzania Socio‐economic Indicators Database, and the bureau of statistics provided training, data collection and data analysis support for the mapping study.
H. PROCEDURE FOR INTEGRATING NEW INDICATORS No resource person from the Bureau of Statistics was available for this study, so the process for integrating indicators in national data collection instruments is not clear. One notes however, that Tanzania develops 5 year statistical master plans which set out the national data collection agenda; the most recent plan should cover the period 2015‐2019. The year 2018 is thus probably a good period
50 United Republic of Tanzania (2016): National Five‐Year Development Plan 2016/17 – 2020/21. p63‐64

66
for the Ministry of Culture to start consultations with the statistics bureau for future data collection needs.
I. CAPACITY NEEDS ‐ Training in data collection for ministry of culture staff ‐ IT equipment – computers, printers
J. POTENTIAL STAKEHOLDERS Other ministries with culture‐related mandates
Role
Ministry of Natural Resources and Tourism http://www.mnrt.go.tz/
Data on tourism related to culture
Institution Role
BASATA – National Arts Council http://www.basata.go.tz/english/aboutus.php
Data on artists and artistic production
Copyright Society of Tanzania http://www.cosota‐tz.org
Assist with data on copyright sectors. Currently no data or studies on website
Tanzania Film Board http://demos.entersoft.co.tz/fbtz/
Assist with data on film sector. Currently no data or studies on website
Tanzania Revenue Authority http://www.tra.go.tz/index.php/excise‐duty/243‐tax‐stamps‐on‐film‐and‐music‐products
Since 2012, the revenue authority has imposed excise duty on all audiovisual tapes, CDs and DVDs, with the obligation of affixing a stamp. It could therefore be a good source of data on imports and local production of audiovisual recordings.
REPOA Policy Research for Development Email: [email protected] Website: http://www.repoa.or.tz/
Research institute with data collection experience: local partner for Afrobarometer study.
Aga Khan University – East Africa Institute
Research institute with the creative economy as one of its focuses.

67
COUNTRY PROFILE: UGANDA Ministry in charge of culture
Ministry of Gender, Labour and Social Development (MGLSD) www.mglsd.go.ug/
Stand‐alone
ministry: No,
Institute in charge of statistics
Uganda Bureau of Statistics (UBOS)www.ubos.org
A. SUMMARY ASSESSMENT General capacity of statistics institute 3
Availability of cultural statistics 3
Definition of cultural sector/industries Yes, but needs improvement
B. BACKGROUND CONTEXT Uganda’s institutional placing of the culture cabinet under the Ministry of Gender, Labour and Social Relations is quite unique in the region. Culture in Uganda tends to be approached in a holistic sense, covering not only the cultural economy and heritage, but also culture in family life and social relations, hence this placement. Responsibility for certain cultural sectors, such as heritage and film, moreover lies with other ministries (see stakeholders section). There is growing interest in the economic dimension of culture as the Ugandan entertainment sector – in particular music and to a lesser extent film ‐ experiences rapid growth in urban centres. Tourism is relatively less important as a revenue earner than neighbours Kenya and Tanzania. But MTWA produces quite a comprehensive statistical abstract, which includes some cultural data, and promoting cultural heritage features quite strongly in the tourism’s department objectives. Both culture and cultural statistics are integrated in the national development plan, and of the countries reviewed for this study, Uganda currently has the greatest experience and infrastructure in place for cultural statistics.
C. EXISTING DATA The national statistics office appears to have good general capacity, and some significant experience in collecting indicators on the culture sector. Some cultural questions are integrated in national household survey instruments, and UBOS assisted the MGLSD in undertaking a mapping of cultural and creative industries in 2013, with funding from the East African Community51. The survey followed an earlier mapping survey undertaken in 2009 by the UNESCO National Commission for Uganda, working with a consultancy firm, with funding from UNESCO. UBOS contributed to this earlier study, but was not a key implementer, which perhaps why it was felt necessary to carry out a similar exercise 4 years later. While the 2014 study mentions the 2009 study it does not use its findings as benchmark values. An explanation probably lies in the fact that the two mapping studies adopt slightly different definitions on what is included in the culture industries sector – the 2013 study includes for instance sports and recreation, intangible heritage and cultural tourism.
51 Ministry of Gender, Labour and Social Development (2014): Report on the mapping of cultural and creative industries in Uganda

68
NATIONAL INDICATORS (vetted by national statistics institute and generally covering the whole country)
Indicator Source Last year available
Frequency Accessibility of cultural data
Mapping
2014 Mapping of cultural and creative industries. Indicators include employment, revenue by revenue band, tax revenues generated by sector.
Mapping undertaken by the MGLSD and UBOS with East Africa Community (EAC) funding. FCS definition of culture sector, including also related sectors: intangible heritage, sports and recreation, cultural tourism
2014 One‐off Available
Employment
% of people earning income from cultural products
Uganda National Household Survey (UBOS) 2012/13 Every 3 years Available
Employment in cultural occupations Classification: ISCO rev. 4, upto 4 digits. Sources include annual Urban Labour Force survey, national household survey, and census.
2015 annual for urban, 2 years & 10 years
Extractable
Employment by industry Classification: ISIC Rev. 4, 4 digits. Sources include annual Urban Labour Force survey, national household survey, and census
2015 annual for urban, 2 years & 10 years
Extractable
Economic value
Contribution to GDP/value added System of national accounts. ISIC Rev. 4, 2 digits. 2016 Annual Only partially extractable
Number of establishments
Number of cultural establishments 2010/11 Census of Business Establishments carried out by UBOS with World Bank support. ISIC Rev. 4, upto 4 digits
2010 Every 10 years, with 5 year updates
Extractable
Cultural consumption/participation
% of people participating in a cultural activity over past 12 months % of people listening to music or watching music videos
Uganda National Household Survey
2011/12 Every 3 years Available

69
% of readers and types of reading materials read
Visitorship to Uganda Museums MTWA Statistical Abstract 2013 * Annual Available
Household expenditure on culture Uganda National Household Survey. National classification is used. Permits the identification of expenditure on “Sports, theatre, etc”.
2011/12 Every 3 years Available, but culture cannot be fully isolated
Cultural infrastructure
Geolocalization of historical, cultural sites and video halls
2012 Population and Housing Census 2012 Every 10 years Available
Funding of culture
Central Government expenditure by function
Not accessed for this study. UBOS site indicates that COFOG classification is used for this data, thus expenditure on the “recreation, culture and religion” function should be identifiable, and depending on level of detail, spending specifically on culture.
2010/11 (on UBOS website)
Annual? Available. Culture may not be fully isolated
OTHER INDICATORS
Indicator Source Last year available
Frequency Sectors covered
Mapping of cultural industries Uganda National Commission for UNESCO 2009 One off All
Cultural production
% of local content on national TV broadcasters
Uganda Communications Commission 2014 Annual TV
Mapping of tangible and intangible cultural heritage
MTWA/Uganda Museums 2007 One‐off Heritage
Mapping of intangible cultural heritage of various ethnic groups
MGLSD 2010 and other years
Periodic Heritage

70
Data from the 2013 mapping held greater credibility because of UBOS participation in the study. Both surveys contain a wealth of industry information providing insights that can guide support policy initiatives on a micro level – e.g. the finding that women are less likely to have formal training in their cultural field than men, could suggest priority training programmes for women. The key economic indicators resulting from these surveys include number of jobs in the culture sector (230,000 for 2013 mapping and 250,000 for 2009 mapping), revenues by income bands, and amount of tax revenue collected from sector. The gaps highlighted by the existence of these two surveys are:
‐ The need for harmonization on what subsectors are included in the culture (or creative) sector ‐ The need for standardization of indicators: eg. employment in the 2009 survey is reported as
all those employed in cultural establishments, whereas in the 2014 survey differentiates between those directly undertaking cultural production activities and those providing support functions.
D. CULTURAL POLICY DEFINITIONS The 2006 Uganda National Cultural Policy contains a very holistic vision of culture, which for instance includes culture at the family level. While definitions are provided for both culture and cultural industries, these definitions are not statistically sufficient as they do not clearly delineate what subsectors compose the sector. The UBOS Compendium of Statistical Concepts and Definitions52 also contains the 2006 policy definition of culture and cultural industries. As noted above, the 2013 mapping by MGLSD and UBOS adopted the FCS definition of cultural domains and included related domains of cultural tourism and sports and recreation. A new cultural policy is expected to be adopted in 2017; this may clarify the boundaries of the culture sector more clearly.
E. CULTURE INTEGRATED IN DEVELOPMENT PLANS The Second National Development Plan 2015/16 – 2019/20 (NDPII) integrates the culture sector in various ways:
‐ CCIs are to contribute to the objective “promote decent employment opportunities and labour productivity). The 2013 mapping study is cited and it is noted that CCIs have the potential to create a lot more jobs than they currently do.
‐ The culture sector is to contribute to social cohesion, specifically to the objective “enhance effective participation of communities in the development process”
‐ Cultural products are to help ensure that tourism (a priority sector in the plan) promotes local culture and products.
An NDPII pipeline project to strengthen cultural and creative industries is planned for. This extensive and targeted integration of the culture sector in the national development plan provides good guidance on what type of cultural indicators may be prioritised.
F. CULTURAL STATISTICS PRIORITIES In addition to the priorities suggested by the National Development Plan in the previous section, the MGLSD respondent indicated the following priorities for cultural statistics: Measuring employment , in particular for film and music sectors – every 3 years. Measuring value added and exports and imports – every 5 years Measuring number of cultural products/services, in particular: films, music discs, craft basketry, infrastructure such as cultural centres, theatres, galleries, cinemas – every 2 years.
52 UBOS (2012). Compendium of Statistical Concepts and Definitions. Fourth Edition. Uganda Bureau of Statistics.

71
G. LEVEL OF COLLABORATION BETWEEN CULTURE AND STATISTICS
Statistics unit in Ministry in charge of culture Yes
Culture sector skills at national statistics institute Yes
The Ministry which covers several sectors, has a statistics unit and even drafts statistics plans (at least for 2006 – 2010). A manual on cultural statistics was drafted, but for lack of sufficient funds not implemented. A budget is regularly allocated for the collection of statistics, although this may not always be sufficient. UBOS’ social unit is in charge of cultural statistics and staff statisticians have accumulated some cultural statistics experience (through the 2013 mapping exercise, participation in UIS training, etc.) There may be some room for improvements in communication between UBOS and ministry in charge of culture; for instance collaboration on the mapping study was somewhat hindered by insufficient communication.
H. PROCEDURE FOR INTEGRATING NEW INDICATORS The requesting agency should give evidence of the data gap and of user demand. Selected indicators should be linked to and inform the National Standard Indicators, SDGs and National Development Policy II frameworks.
I. CAPACITY NEEDS The main capacity challenge is insufficient funding. Other challenges are:
‐ Need to have a good sampling frame for surveys covering the culture sector to improve reliability of indicators. This involves identifying cultural establishments nationwide.
‐ Need a clearer framework for classification of cultural activity ‐ As Uganda has now a significant stock of sectorwide data, there is a need for a better
understanding of subsectors (keen interest in particular in music and film sectors)
J. POTENTIAL STAKEHOLDERS Other ministries with culture‐related mandates
Role
Ministry of Tourism, Wildlife and Antiquities (cultural heritage‐ MTWA) http://tourism.go.ug
This ministry has the mandate for cultural heritage
Uganda Communications Commission, Ministry of Information and Communications Technology
Data on broadcasting and film sector
National Planning Authority Indicator identification for monitoring NDP II cultural objectives
Institution Role
Local governments (district level) Data dissemination and data collection
Uganda Registration Services Bureau www.ursb.go.ug
Data on copyright
Uganda Performing Rights Society http://uprs.ug/
Data on copyright, mainly music

72
ANNEX 1: QUESTIONNAIRE – Ministries of culture
INTERVIEW GUIDE MINISTRY IN CHARGE OF CULTURE
Target informant: Senior operational management level with overview of statistics and studies in field of culture Background: This questionnaire is being submitted to you in the framework of a desk study on the status of cultural statistics’ data and capacities in the 13 countries covered by the UNESCO Regional Office for Eastern Africa in view of developing a project proposal to strengthen capacities and available data on cultural indicators in the region.
Thank you in advance for your time and participation. A. CULTURAL STATISTICS EXPERIENCE 1. Has your ministry collected or collated any cultural indicators or data, directly or indirectly, in the
past? Indicator category Description of indicator(s)
(specify if it was just for a specific subsector, eg. crafts, film, heritage)
Periodicity (eg. annual, one‐off). Cite last year available
Method/source (e.g. national accounts data, census, ad‐hoc survey)
Quality: Satisfactory or unsatisfactory
Employment
Economic value (eg: value added/ revenues/ export value
Number of businesses/ operators (eg. mapping)
Impact studies (eg. multiplier analysis)
Number of products/ services / cultural infrastructure
Cultural consumption/ participation
Other

73
2. What difficulties have you encountered in collecting/collating data for the indicators cited? 3. What challenges have you encountered with respect to the reliability of the indicators cited?
4. Where did the funding for collecting/collating this data come from?
5. Have other organizations collected or collated any cultural indicators or data, directly or indirectly,
in the past? Examples could be studies by film boards, copyright or collection agencies, cultural NGOs.
Indicator category
Description of indicator(s)(specify if it was just for a specific subsector, eg. crafts, film, heritage
Year(s) Study lead organization
Quality: Satisfactory or unsatisfactory
Employment
Economic value (eg: value added/ revenues/ export value
Number of businesses/ operators (eg. mapping)
Impact studies (eg. multiplier analysis)
Number of products/ services / cultural infrastructure
Cultural consumption/ participation
Other
6. What international data collection exercises has your Ministry participated in?
UIS/UNESCO Feature Film Survey UIS/UNESCO Global Survey on Cultural Employment Statistics UNESCO CDIS indicators WIPO Copyright‐based industries studies Afrobarometer surveys Others: Any comments:
7. Of the various indicators/data cited above, which to your knowledge have been practically put to use and how (e.g. to design policy, to inform advocacy, to make budget allocation decisions, etc.)?

74
B. CULTURAL STATISTICS PRIORITIES 8. Is there a national definition of the cultural sector or cultural industries? If yes, what is it/where
can it be found? 9. In your opinion, how much is your current culture policy being implemented?
Good level of implementation Average Weak
10. Is CULTURE included in your country’s National Plan for Development?
Yes No Don’t know
11. Do you think better cultural statistics can lead to better integration of culture in national priorities? Yes No Don’t know
12. Data and indicators can serve multiple purposes. In your opinion, what are the top TWO priorities that should be pursued by cultural data and indicators for your country for the next 5 years (indicate 1 next to the top priority and 2 to the second). Specify in the last column, if you think the priority should be pursued for all cultural sectors, or if the focus should be on specific subsectors (e.g. film, crafts, heritage, etc).
Priority Indicator objective For all
cultural industries
For specific subsectors: please list
Measuring employment in the cultural sector
Measuring the economic contribution of cultural industries (value added, revenue, etc.)
Measuring number and characterization of cultural businesses/operators (mapping, etc.)
Measuring number of cultural products/services, cultural infrastructure (eg. number of museums, number of domestic films produced)
Tracking trends in cultural consumption /participation – eg. viewership of foreign/domestic films, number of museum visits
Enabling the monitoring and evaluation of specific policy initiatives to understand the impact of public investment in culture
Economic impact studies for specific cultural activities (eg. impact of a festival, impact of culture on tourism, impact of World Heritage Site status)
Measuring national cultural/linguistic diversity
Other… specify

75
13. For the two key indicators, what is the desired periodicity Indicator 1: Annual Every 2 years Every 5 years Every 10 years Based on periodicity of other national survey, which one?
Indicator 2: Annual Every 2 years Every 5 years Every 10 years Based on periodicity of other national survey, which one?
14. How much importance do you place on having data that is comparable with other countries
Highly desirable Desirable, but not necessary Not desirable at all Please explain: C. CULTURAL STATISTICS CAPACITY 15. Does the Ministry have staff with specific responsibility for statistics? Please give details. 16. Is there a budget allocated for statistics every year? If yes, how much is it?
17. What relationship do you have with the national statistics body? Formal partnership in place Occasional liaising but with no formal collaboration Little or no contact Please give details
18. What stakeholders do you think should/could play a key role in making cultural statistics available
Institution and contact details Role
19. Has there been any cultural statistics capacity building activity to your knowledge? When? By whom? Who participated? Assessment if any?
20. What capacity needs do you perceive for the availability of relevant and reliable cultural statistics?
For your ministry? For other institutions?
21. Of needs cited, which one is top priority to address?

76
ANNEX 2: QUESTIONNAIRE – National statistics institutes
INTERVIEW GUIDE NATIONAL STATISTICS INSTITUTES
Target informant: Senior management level, eg. Deputy Director, department head Background: This questionnaire is being submitted to you in the framework of a desk study on the status of cultural statistics’ data and capacities in the 13 countries covered by the UNESCO Regional Office for Eastern Africa in view of developing a project proposal to strengthen capacities and available data on cultural indicators in the region.
Thank you in advance for your time and participation. A. CULTURAL STATISTICS EXPERIENCE 1. Has your institute collected or collated any cultural indicators or data, directly or indirectly, in the
past? Indicator category
Description of indicator(s)(specify classification used – eg. ISCO, ISIC, COICOP and version)
Periodicity (eg. annual, one‐off). Cite last year available
Method/source (e.g. national accounts data, census, ad‐hoc survey)
Quality: Satisfactory or unsatisfactory
Employment
Economic value (eg: value added/ revenues/ export value
Number of businesses/ operators (eg. mapping)
Impact studies (eg. multiplier analysis)
Number of products/ services / cultural infrastructure
Cultural consumption/ participation
Other

77
2. What difficulties have you encountered in collecting/collating data for the indicators cited 3. What challenges have you encountered with respect to the reliability of the indicators cited
4. Where did the funding for collecting/collating this data come from?
5. What type of surveys are regularly carried out in your country that could contain cultural
statistics?
Type of survey Types of cultural indicators
Periodicity (e.g. annual, one‐off). Cite last year available
Classification and level of disaggregation
Appreciation of ease of extracting culture data:
Lead organization
System of national accounts
Labour force survey
National census
Household expenditure survey
Business surveys
Afrobarometer
Others
6. Have you been involved in any international cultural data collection exercises ?
UIS/UNESCO Feature Film Survey UIS/UNESCO Global Survey on Cultural Employment Statistics UNESCO CDIS indicators WIPO Copyright‐based industries studies Afrobarometer surveys Others:
B. CULTURAL STATISTICS PRIORITIES 7. Of the various indicator objectives that could be pursued, which would be easiest to implement
(i.e. data already exists or can be made available relatively easily)?
Indicator objective Ease: 1 – very easy, 5 ‐ impossible
Periodicity possible
Measuring employment in the cultural sector

78
Measuring the economic contribution of cultural industries (value added, revenue, etc.)
Measuring number of cultural products/services, cultural infrastructure (eg. number of museums, number of domestic films produced)
Tracking trends in cultural consumption /participation – eg. viewership of foreign/domestic films, number of museum visits
Enabling the monitoring and evaluation of specific policy initiatives to understand the impact of public investment in culture
Economic impact studies for specific cultural activities (eg. impact of a festival, impact of culture on tourism, impact of World Heritage Site status)
Measuring national cultural/linguistic diversity
Other… specify
8. How much importance do you place on having data that is comparable with other countries
Highly desirable Desirable, but not necessary Not desirable at all Please explain:
C. CULTURAL STATISTICS CAPACITY 9. What relationship if any do you have with Cultural ministry staff?
Formal partnership in place Occasional liaising but with no formal collaboration Little or no contact Please give details
10. Is there anyone on your staff with specific understanding of the cultural industries and/or the wider culture sector? Have a culture unit Have a culture focal point/expert No unit/expert but some understanding None of the above
11. What roles do universities or industry bodies currently play in data collection (general, not just
cultural data)?
12. Apart from the Ministry in charge of culture, what other stakeholders do you see as interesting partners for cultural statistics. What role could they play?
Institution and contact details Role
13. What is the process for integrating new indicators in your current data collection agenda?