mapping of the gene encoding a chicken homologue of the mammalian chemokine scya4
TRANSCRIPT
MOLECULAR GENETIC MARKERS
Single strand conformational polymorphisms inthe second exons of the ovine DMB, DYA andDYB genesJ F MaddoxCentre for Animal Biotechnology, Department of Veterinary Science,The University of Melbourne, Parkville 3052, Australia.
Accepted 8 January 1999
Source/description: Primers were designed to PCR amplify thesecond exon of the DMB gene based on a comparison between thehuman1 and murine2 DMB genes. A 257-bp fragment was amplifiedfrom sheep DNA. Sequencing of this fragment confirmed that it wasderived from the ovine DMB gene. Primers were designed to PCRamplify the second exons of the ovine DYA and DYB genes based onthe sequences for the cattle genes3,4. A 250-bp fragment wasamplified from sheep DNA for the DYA gene, and a 333-bp fragmentwas amplified for the DYB gene.
Primer sequences:
DMB: JM44 CTT(C/T)gTggC(C/T)CATgTggAAAgCACC
JM45: CCCAgAAgggCTgggTgTg(T/g)g(T/A)ggC
DYA: JM30 TgACCACgTCggCACTTA
JM31 ACCACTggTggCAggTgT
DYB: JM158 CACgggCTCTCCCgCAgAgAATT
JM160 CCCACAAggCTCTgTgTgAAggCAT
Guanine nucleotides in the primer sequence are represented by alower case `g' to ensure that they can be distinguished from cytosine`C'. All primer sequences are listed 59±39 and exon sequences are initalics. Limited amounts of these primers are available from theauthor's laboratory.
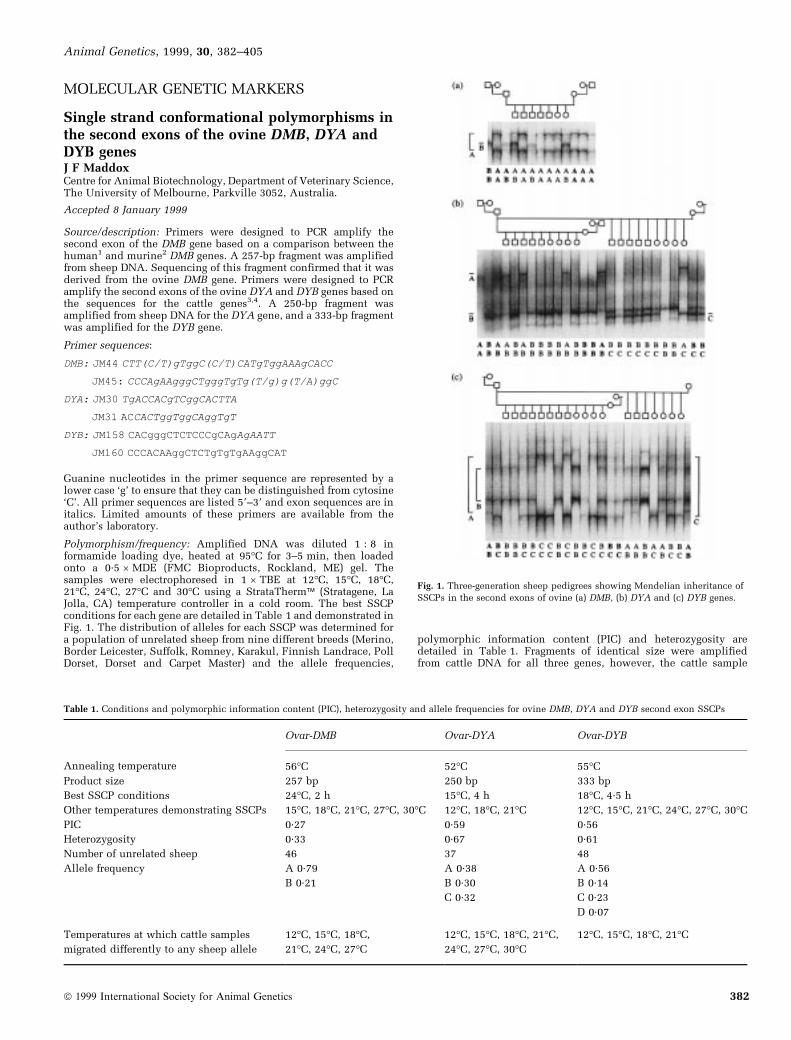
Polymorphism/frequency: Amplified DNA was diluted 1 : 8 informamide loading dye, heated at 95°C for 3±5 min, then loadedonto a 0.5 ´ MDE (FMC Bioproducts, Rockland, ME) gel. Thesamples were electrophoresed in 1 ´ TBE at 12°C, 15°C, 18°C,21°C, 24°C, 27°C and 30°C using a StrataThermä (Stratagene, LaJolla, CA) temperature controller in a cold room. The best SSCPconditions for each gene are detailed in Table 1 and demonstrated inFig. 1. The distribution of alleles for each SSCP was determined fora population of unrelated sheep from nine different breeds (Merino,Border Leicester, Suffolk, Romney, Karakul, Finnish Landrace, PollDorset, Dorset and Carpet Master) and the allele frequencies,
polymorphic information content (PIC) and heterozygosity aredetailed in Table 1. Fragments of identical size were amplifiedfrom cattle DNA for all three genes, however, the cattle sample
Animal Genetics, 1999, 30, 382±405
ã 1999 International Society for Animal Genetics 382
Fig. 1. Three-generation sheep pedigrees showing Mendelian inheritance of
SSCPs in the second exons of ovine (a) DMB, (b) DYA and (c) DYB genes.
Table 1. Conditions and polymorphic information content (PIC), heterozygosity and allele frequencies for ovine DMB, DYA and DYB second exon SSCPs
Ovar-DMB Ovar-DYA Ovar-DYB
Annealing temperature 56°C 52°C 55°CProduct size 257 bp 250 bp 333 bp
Best SSCP conditions 24°C, 2 h 15°C, 4 h 18°C, 4.5 h
Other temperatures demonstrating SSCPs 15°C, 18°C, 21°C, 27°C, 30°C 12°C, 18°C, 21°C 12°C, 15°C, 21°C, 24°C, 27°C, 30°CPIC 0.27 0.59 0.56
Heterozygosity 0.33 0.67 0.61
Number of unrelated sheep 46 37 48
Allele frequency A 0.79 A 0.38 A 0.56
B 0.21 B 0.30 B 0.14
C 0.32 C 0.23
D 0.07
Temperatures at which cattle samples
migrated differently to any sheep allele
12°C, 15°C, 18°C,
21°C, 24°C, 27°C12°C, 15°C, 18°C, 21°C,
24°C, 27°C, 30°C12°C, 15°C, 18°C, 21°C

generally migrated differently to the sheep fragment (Table 1). Onlythe DYB primers amplified a product from goat DNA. The DYB goatPCR product was identical in size to that of sheep and cattle, butmigrated differently for all SSCP conditions tested.
Mendelian inheritance: Segregation was observed in nine, three-generation families comprising a total of 126 individuals belongingto the International Mapping Flock (IMF). The data were consistentwith codominantly inherited alleles (Fig. 1).
PCR conditions: Genomic DNA (20 ng) was amplified in a 5-mlreaction volume consisting of 67 mm Tris±HCl (pH 8.8), 16.6 mm(NH4)2SO4, 0.2 mg/ml gelatine, 0.45% Triton X-100, 1.5 mm MgCl2,100 mm dNTPs, 6.25 ng of both the forward and reverse primers,0.125 U of AmpliTaq DNA polymerase (Perkin±Elmer, Victoria,Australia), 0.275 mg of TaqStart Antibody (Clontech, Palo Alto, CA)and 0.25 mCi a33P d-ATP (AMRAD, Victoria, Australia). Reactionswere performed in a 96-well plate and run on a DNA thermal cycler(PTC-100, MJ Research Inc., Watertown, MA), using the followingconditions: one cycle of denaturation at 95°C (2.5 min); 30 cycles ofdenaturation at 95°C (30 s), annealing at the temperature indicatedin Table 1 (30 s), extension 72°C (30 s); and one cycle of extension72°C (2.5 min).
Chromosomal location: The ovine DMB, DYA and DYB genes weremapped by linkage analysis on the IMF to the same region onchromosome 20.
Acknowledgements: The author would like to thank Nina Kang andStewart Fabb for technical assistance, and AgResearch (NewZealand) for access to the IMF. This research was supported by agrant from Meat and Livestock Australia.
References1 Kelly A.P. et al. (1991) Nature 353, 571±3.2 Cho S. et al. (1991) Nature 353, 573±6.3 van der Poel J.J. et al. (1990) Immunogenetics 31, 29±36.4 Stone R.T. & Muggli-Cockett N.E. (1990) Anim Genet 21, 353±60.
Correspondence: J F Maddox(e-mail:[email protected])
Nine polymorphic microsatellite markers in theSE Asian catfishes Pangasius hypophthalmusand Clarias batrachusF A M Volckaert1, B Hellemans1, L Pouyaud2
1Katholieke Universiteit Leuven, Laboratory of Aquatic Ecology, Ch.de Berostraat 32, B-3000 Leuven, Belgium; 2Catfish Asia Project,Instalasi Penelitian Perikanan Air Tawar, Jalan Ragunan±PisarMinggu, P.O. Box 7220/jkspm, Jakarta 12540, Indonesia
Accepted 1 March 1999
Source/description: Clones were obtained from a size-selectedgenomic library (the 300±800 bp fragments were cut with therestriction enzyme NdeII) of Clarias batrachus and Pangasiushypophthalmus (formerly called P. sutchi) (Teleostei; Siluroidei)after enrichment1 and by hybridisation with a g32P-labelled (CA)15probe. The sequences of the loci Cba02, Cba06, Cba07, Cba08,Cba09, Phy01, Phy03, Phy05 and Phy07 have been submitted toGenBank/EMBL (accession numbers AJ131375 to AJ131383) (Table1).
Primer sequences: The primers were selected with the PC/GENEprogramme2 and each primer was checked with the softwarepackage OLIGO3 (see Table 1).
PCR conditions: The Chelex (Biorad, Hercules, CA) extractionmethod was used. The 10 ml PCR reactions contained 1 mmnonlabelled primers (forward and reverse) and 0.1 mm g32P-labelledforward primer, 75 mm each dNTP, 1 ´ PCR reaction buffer (Euro-gentec, Seraing, Belgium), 1±2 mm MgCl2 (Table 1), 0.2 units Taqpolymerase (Goldstar, Eurogentec, LieÁge, Belgium) and 10±20 nggenomic DNA. The cycling profiles on a Triobloc (Biometra,Maidstone, UK) machine were: 95 °C for 45 s; 54±68 °C for 30 s(Table 1); 72 °C for 30 s (30 times). Thirty cycles were performed forall conditions with, at the end of the amplification, an additionalelongation step at 72 °C for 10 min. PCR products were electro-phoresed on 6% denaturing polyacrylamide gels together with anM13 control sequence in order to size the alleles. Gels were driedand exposed to X-ray films (Kodak) to visualize the PCR products.
MOLECULAR GENETIC MARKERS 383
Table 1. Name designation (Cba: Clarias batrachus; Phy: Pangasius hypophthalmus), GenBank accession number, sequence of forward and reverse primer,
annealing temperature, concentration of MgCl2, number of fish genotyped, number of alleles, size range of alleles and observed heterozygosity of nine
microsatellite loci developed in catfish
Locus
GenBank
access. no. Forward and reverse primer
Tan
(°C)
MgCl2
(mm) n
No. of
alleles
Range of
alleles (bp) Hobs
Cba02-KUL AJ131375 F-59-CCTTAACCACCAGTTCTGGAGCC-39 65 2 10 9 240±266 0.80
R-59-TGTGTTTGGAGGAATGCTAATGGC-39
Cba06-KUL AJ131376 F-59-TGGTGGTCTGACCGATGACTCC-39 68 1 8 3 221±251 0.25
R-59-TGTGCAGCAGTTTGTTAAAGTTCC-39
Cba07-KUL AJ131377 F-59-GTGTTCACTAATGACTTACTGGG-39 56 1 7 8 150±206 0.86
R-59-TCCCACATGAGCCTAATATCG-39
Cba08-KUL AJ131378 F-59-AGTGGTTCTTTATGTGGTAAGTG-39 59 1 8 7 180±200 0.88
R-59-TACAATACTCCGAGGTGGGC-39
Cba09-KUL AJ131379 F-59-CAAGACAACAAGGCTGTGGTGC-39 66 1 10 2 208±210 0.30
R-59-TGCATCTGATGACCCATATTTGC-39
Phy01-KUL AJ131380 F-59-GTAAACAGAGCCACCTGCGG-39 65 1 10 2 154±160 0.40
R-59-CAGATCCACACCCACAACACC-39
Phy03-KUL AJ131381 F-59-TAGGAGTCAGGAGTCGC-39 54 1 10 4 166±194 0.70
R-59-TGCAACGGTAACAAACC-39
Phy05-KUL AJ131382 F-59-AACAAATCAATCACAGCCTGCC-39 60 1 10 5 202±210 0.40
R-59-CGGTAGCGGGAAAGGATGG-39
Phy07-KUL AJ131383 F-59-GATCAGTCACTTCAGCACCTGCC-39 68 1 10 5 214±270 0.40
R-59-TCCAAATCTCTGTGATGGTGAGCC-39
ã 1999 International Society for Animal Genetics, Animal Genetics 30, 382±405

Mendelian inheritance: All Pangasius markers have been tested on apanel of two F1 families; inheritance is fully Mendelian. The Clariasbatrachus markers were not tested for Mendelian inheritance.
Polymorphism: Genomic DNA of Vietnamese Pangasiushypophthalmus and Indonesian Clarias batrachus was analysedat, respectively, 4 and 5 loci. The number of alleles per locus, thesize range and the observed level of heterozygosity were determined(Table 1).
Other species: Locus Cba06 amplified interspecifically in P.hypophthalmus. Locus Phy07 amplified interspecifically in C.batrachus.
Acknowledgements: Research has been funded by the EuropeanUnion (INCO contract IC18 CT960043).
Reference1 Kandpal R.P. et al. (1994) Proc Natl Acad of Sci USA 91, 88±92.2 Bender P.K. & Larson T.J. (1994) Meth Mol Biol 24, 299±306.3 Estruch J.J. (1997) Meth Mol Biol 70, 279±285.
Correspondence: Dr Filip Volckaert (e-mail: [email protected]).
Use of the human transcript map to assign fiveloci to bovine chromosomesC E Rexroad III, Y Yang, J E WomackDepartment of Veterinary Pathobiology, College of VeterinaryMedicine, Texas A & M University, College Station, TX 77843, USA
Accepted 10 March 1999
Source/description: The Human Transcript Map1 is rapidly progres-sing toward completion with the mapping of tens of thousands ofexpressed sequence tags (ESTs). The map location of bovinehomologues of human genes can be predicted from current knowl-edge of the conservation of synteny between the two genomes2,5,6.
For example, human homologues of genes that map to BTA1 are onHSA3q or HSA21 and the bovine homologues of genes that map toHSA3q are on BTA1 or BTA22. In an effort to increase the density ofgenes on the BTA1 map we have mapped bovine genes showingsequence similarity to ESTs from the Human Transcript Map of
HSA3q. To facilitate mapping in a bovine ´ rodent somatic cellpanel3 we selected HSA3q ESTs for which we could identify similarbovine sequences (Table 1).
PCR primers and conditions: Primer pairs were designed usingMacVector 4.1 software (Eastman Kodak Co., New Haven, CT). PCRreactions were carried out as follows with annealing temperaturesranging from 55 to 62°C. Ten microliter reactions included 1 ml of50 ng/ml DNA, 1 ml 10´ PCR buffer (PE Applied Biosystems), 1 ml of2 mm nucleotides (Sigma). Five microliters each F and R primer,and 5 U of Amplitaq Gold (PE Applied Biosystems) and 5.9 mlsterile ddH2O (Gibco). Thermocycling was done in a Perkin±Elmer9600 (PE Applied Biosystems) at 95°C for 10 min, 35 cycles of95°C for 30 min, 55±62°C for 30 min, 72°C for 30 min, followed by72°C for 7 min and a 4°C hold. Table 2 contains the primersequences.
Chromosomal assignments: Thirty-one bovine ´ rodent hybridswere typed by PCR and agarose gel electrophoresis for the presenceor absence of bovine specific fragment. The data were analyzed forconcordance with markers previously mapped to bovine chromo-somes as summarized in Table 3.
Comments: AGTR1 and P2RY1 had 95% protein sequence similar-ity with ESTs on HSA3q and mapped as expected to BTA1 basedon the orthology of HSA3q and BTA15. The human homologues ofboth of these genes have also been mapped to HSA3 (GDB).GLUT1 and LTF only had 63% and 67% protein sequence sim-ilarity with ESTs on HSA3 and so it is not surprising that theymapped elsewhere. The bovine homologue of GLUT1 shows89.5% sequence similarity with the human SLC5A1 gene and85.4% similarity with the mouse SLC2A1 gene. Human SLC5A1maps to HSA22, which would not be consistent with the bovinemap position. Mouse SLC2A1 maps to MMU4 and human SLC2A1maps to HSA1. It would appear then that we have mappedthe bovine homologue of SLC2A1 since comparative mapp-ing data could predict its assignment to BTA3. Our mapping ofLTF to BTA22 confirms the cytogenetic mapping data of Martin-Burriel4. This could be predicted because the human homologue
maps to HSA3. It is suprising that VIL2 had 95% sequencesimilarity with an EST on HSA3q yet still mapped to BTA9. Thiscould suggest that BTA9 and HSA3q have orthologous regionsor that the HSA3q EST is a member of a gene family includingVIL2.
Table 1. Bovine homologues of Human ESTs
Bovine gene
Locus
symbol
Bovine gene
Genbank
Accession no.
Human
EST
HSA3q map
position
(cR)
Human
EST Genbank
Accession no.
Nucleotide
sequence
similarity (%)
Angiotensin II type 1 receptor AGTR1 X62294 R71251 169 R71251 95
Ezrin VIL2 M98498 SHGC-10749 121 G13448 95
Glucose transporter type 1 GLUT1 M60448 SHGC-11002 181±187 G11226 63
Lactoferrin LTF M63502 SHGC33327 148±156 G27805 67
Purinergic receptor P2Y P2RY1 X87628 SHGC35403 173±174 G28604 96
Table 2. PCR primers for bovine genes
Locus symbol Forward primer Reverse primer
AGTR1 cacctcactaccaaatgagcatgg tgagatggctggatggcatc
VIL2 gcttcagtgggaatgttctggg aatggtgtgtgtgcgtagggagtg
GLUT1 ttcaggacactaacggctccag gacgggaataggcaaaacctaatg
LTF tgacgaggtaaagcctgcaaag gcaaaaatccgacttcaggaagg
P2RY1 cttgtgaagatgcaggaatccc cacgaggtgtaggcatttccac
ã 1999 International Society for Animal Genetics, Animal Genetics 30, 382±405
384 MOLECULAR GENETIC MARKERS

The Human Transcript Map is being used to increase the densityof Type I loci on bovine chromosomes. Increasing the number ofType I loci on bovine chromosomes will help identify regions ofconserved synteny and further define comparative maps betweenspecies.
References1 The Human Transcript Map, http://ncbi.nlm.gov/science96/.2 Womack, J.E. & Kata, S.R. (1995) Curr Opin Gene Dev 5, 725±33.3 Womack, J.E. & Moll, Y. (1986) J Hered 77, 2±7.4 Martin-Burriel, I. et al. (1997) Mamm Genome 8, 704±5.5 Chowdhary, B.P. et al. (1996) Mamm Genome 7, 297±302.6 Ma, R.Z. et al. (1998) Mamm Genome 9, 545±9.
Correspondence: James E Womack(e-mail: [email protected]).
RFLP markers in the bovine butyrophilin geneA Zegeye1, M Ashwell2, S Ogg1, C Rexroad2, I H Mather1
1Department of Animal and Avian Sciences, University ofMaryland, College Park, MD 20742, USA; 2Gene Evaluation andMapping Laboratory, USDA, Beltsville, MD, 20705, USA
Accepted 29 March 1999
Source/description: Primer pairs (Table 1) were used to amplify
specific regions of the bovine butyrophilin gene (BTN) (accessionnumber Z93323) using the PCR and genomic DNA isolated fromthree Holstein bulls and 10 Holstein cows. PCR products weredigested with a panel of four- and six-base cutting restrictionendonucleases to search for RFLPs. One exonic (exon 8) as well asfour intronic (two each in introns B and E) RFLPs were identified(Table 1). The HaeIII RFLP has been reported previously1.
PCR conditions: The 25 ml reaction mixture comprised 10±25 ng ofgenomic DNA in PCR buffer, dNTPs, Taq polymerase and 0.1 mm ofeach primer. Amplification was performed on a Hybaid (Franklin,MA) cycler in 96-well plates under the following conditions: pre-amplification denaturation for 5 min at 95°C, two cycles each at 3, 2,and 1°C above the optimal annealing temperature, followed by 30cycles at the optimal annealing temperature. The touchdownapproach increased the specificity of the resulting PCR product.Each cycle was set at 30 s denaturation at 95°C, 1 min at annealingtemperature, and 2 min at 72°C. Each reaction was completed byincubating at 72°C for 7 min
Comment: BTN has been mapped to chromosome 231,2. The proteinproduct of BTN is found in the mammary gland in speciesinvestigated, and its expression is limited to late pregnancy andlactation. Butyrophilin may play some role in milk secretion and/orhave an immune function.
Putative-QTL associations were investigated in five polymorphicHolstein families using the RFLPs described above, and the model as
MOLECULAR GENETIC MARKERS 385
Table 3. Concordancy of bovine sequences to chromosome markers
BTA AGTR1 (%) VIL2 (%) GLUT1 (%) LTF (%) P2RY1 (%)
1 90 58 47 47 90
2 65 52 77 77 71
3 50 70 100 90 50
4 67 61 73 73 67
5 53 52 58 65 53
6 48 61 68 55 55
7 69 55 73 77 62
8 43 68 81 87 43
9 61 90 61 61 68
10 35 45 65 58 29
11 48 58 65 77 48
12 68 71 77 71 61
13 36 61 68 75 39
14 68 52 58 52 74
15 58 65 71 67 52
16 61 74 61 70 61
17 63 36 57 61 63
18 58 58 77 71 65
19 74 42 35 29 74
20 65 61 74 74 71
21 69 65 77 84 75
22 58 71 84 97 65
23 58 61 74 68 65
24 73 53 57 57 77
25 63 67 65 71 65
26 59 73 67 70 59
27 62 52 61 61 55
28 60 39 52 52 60
29 71 65 55 62 52
X 42 68 61 68 42
Bovine chromosomal
assignment
1 9 3 22 1
GDB assignment of
human homologues
3 6 1, 22 3 3
ã 1999 International Society for Animal Genetics, Animal Genetics 30, 382±405

described in Ashwell et al.3 in a grand-daughter design4. In someinstances more than one marker was used in a single family. Theanalysis did not yield significant marker allele differences on mostmilk production and health traits considered, except in a singlefamily using the TaqI marker in which the percentage of protein hada P-value of 0.0137.
Acknowledgements: This work was funded by grants 9503887 fromthe USDA and ANSC96±92 from the Maryland AgriculturalExperiment Station (to IHM).
References1 Taylor, C. et al. (1996) Anim Genet 27, 183±185.2 Ashwell, M.S. et al. (1996) Anim Genet 27,171±173.3 Ashwell, M.S. et al. (1996) Anim Genet 27, 235±242.4 Weller, J.I. et al. (1990) J Dairy Sci 73, 2525±2537.
Correspondence: I.H. Mather.
A new allelic variant in the bovine prion proteingene (PRNP) coding regionJ SchlaÈpfer, N Saitbekova, C Gaillard, G DolfInstitute of Animal Breeding, University of Berne, 3012 Berne,Switzerland
Accepted 3 April 1999
Source/description: The prion protein gene (PRNP) seems to play akey role in transmissible spongiforme encephalopathies (TSE). Inspecies other than cattle, expression of spongiforme encephalopa-thies is clearly dependant on polymorphism in PRNP1. The fewgenetic studies in connection with BSE in cattle were restricted tothe coding region of PRNP. The gene has been mapped on bovinechromosome 13 (BTA13)2,3. The coding region of PRNP has five orsix copies (R1-R6) of a G-C-rich, 24 bp or 27 bp repeat unit4. Thisunit leads to the octapeptide Pro-His-Gly-Gly-Gly-Trp-Gly-Gln andits longer variant Pro-Gln/His-Gly-Gly-Gly-Gly-Trp-Gly-Gln. Thenucleotide sequence (accession number: X55882) is shown in Fig. 1.
R1CCTCAGGGAGGGGGTGGCTGGGGTCAG
R2CCCCATGGA- - -GGTGGCTGGGGCCAG
R3CCTCATGGA- - -GGTGGCTGGGGCCAG
R4CCTCATGGA- - -GGTGGCTGGGGTCAG
R5CCCCATGGT- - -GGTGGCTGGGGACAG
R6CCACATGGTGGTGGAGGCTGGGGTCAA
Typing of a mapping family material for the polymorphism withinthe PRNP coding region revealed an additional third allele (Fig. 2).
Primer sequences:
59 CTCTGCAAGAAGCGACCAAAACCTG 39
59 GGCCCCCTACCACTGCTCCAG 39
PCR conditions: PCR amplifications were carried out in 12 ml
Table 1. Primer pairs used to generate PCR products and the respective restriction endonucleases used to detect the polymorphisms
Primer pairs Region amplified
PCR product
size (bp)
RFLP endonuclease
(nucleotide numbers)
RFLP site
sequences
Name Sequence (59®39)
Opt.
temperature (°C)*
1F CTGAAGTTCCCGACAAACTCG 57 exon 2±59 exon 3 576 HpaIIy (1938±1941) CAGG®CCGG
1R CTCTGCATCTTCACCCACCAC TaqI (2074±2077) ACAA®TCGA
2F CTTCTTCCCAAGGCTGAC 57 exon 5±59 intron F 683 MboI (5495±5498) GATC®AATC
2R CTTACTGAGCTCTTCCAGG Tru9Iy(5493±5496) TTGA®TTAA
3F TCCCGAGAATGGGTTCTG 52 exon 8 893 HaeIII (6804±6807) AGCC®GGCC1
3R CACTGCCTGAGTTCACCTCA
*Optimal primer annealing temperature.
yAdditional potential HpaII and Tru9I RFLPs within the respective fragments were not completely characterized.
Fig. 1. Partial nucleotide sequence of coding region of the bovine
PRNP gene showing five (R1, R2, R3, R4, R5, R6) or six (R1, R2, R3,
R4, R5, R6) copies of the repeat element (4)
Fig. 2. Three times two individual homozygous for seven (A,B), six
(B,C) and five (E,F) copies of the G-C-rich repeat element within the
bovine PRNP coding region. M indicates size markers.
ã 1999 International Society for Animal Genetics, Animal Genetics 30, 382±405
386 MOLECULAR GENETIC MARKERS
containing 2 ml of Chelex-extracted DNA solution (Chelex 100,BioRad, Hercules, CA), 2.5 pmol of each primer, 0.25 mm of eachdNTP, 1 ´ PCR buffer with 1.5 mm MgCl2 (Appligene, Gaithersburg,MD) and 0.35 unit Taq polymerase (Appligene). The standard PCRprotocol consisted of a 3-min denaturation step at 95°C, followed by30 cycles of 30 s at 95°C, 30 s at 60°C and 30 s extension at 72°C. Afinal extension was performed for 20 min at 72°C.
Sequencing: To determine the nucleotide sequence of the thirdallele, PCR was performed with seven individuals homozygous forthe new allele in order to obtain sufficient fragment DNA forsubsequent sequence analysis. Bidirectional cycle sequencing(Amersham Pharmacia Biotech, RPN2438, Amersham Pharmacia,Buckinghamshire, UK) was carried out with 0.5 mg of template DNAaccording to the manufacturers recommendations. PCR primerswere annealed to the templates at 69°C for sequencing. Fragmentand sequence analysis were performed on 6% denaturing poly-acrylamide gels using a LI-COR DNA sequencer model 4200 l.
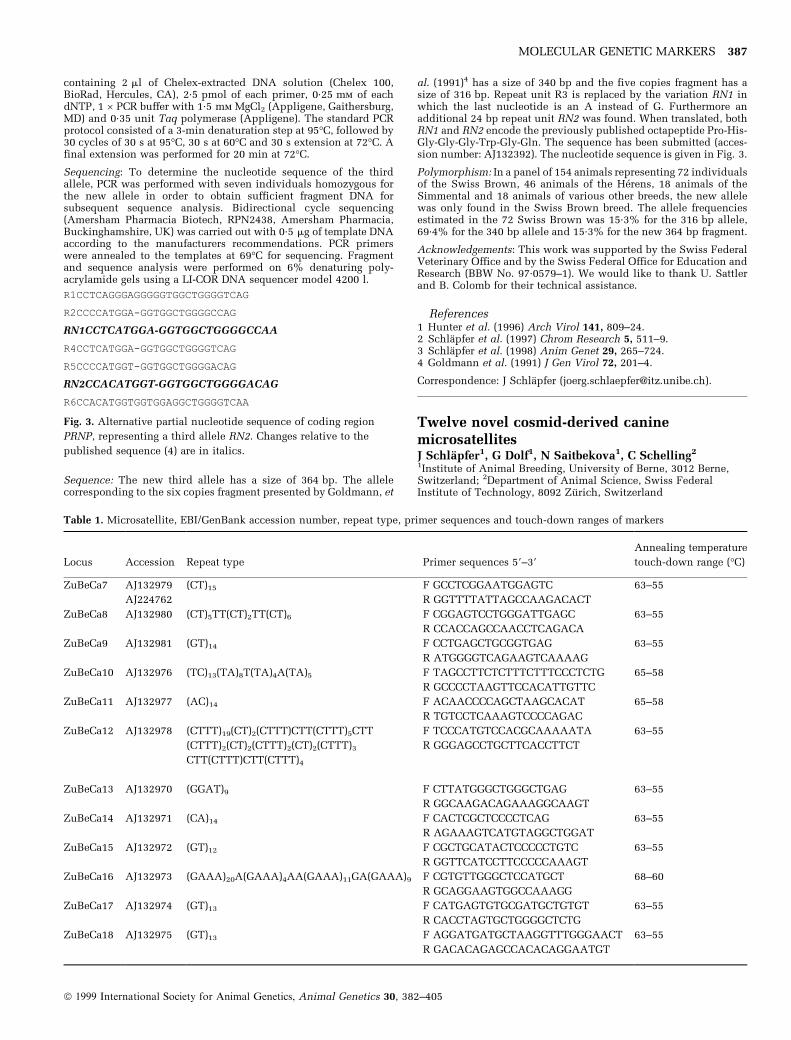
Sequence: The new third allele has a size of 364 bp. The allelecorresponding to the six copies fragment presented by Goldmann, et
al. (1991)4 has a size of 340 bp and the five copies fragment has asize of 316 bp. Repeat unit R3 is replaced by the variation RN1 inwhich the last nucleotide is an A instead of G. Furthermore anadditional 24 bp repeat unit RN2 was found. When translated, bothRN1 and RN2 encode the previously published octapeptide Pro-His-Gly-Gly-Gly-Trp-Gly-Gln. The sequence has been submitted (acces-sion number: AJ132392). The nucleotide sequence is given in Fig. 3.
Polymorphism: In a panel of 154 animals representing 72 individualsof the Swiss Brown, 46 animals of the HeÂrens, 18 animals of theSimmental and 18 animals of various other breeds, the new allelewas only found in the Swiss Brown breed. The allele frequenciesestimated in the 72 Swiss Brown was 15.3% for the 316 bp allele,69.4% for the 340 bp allele and 15.3% for the new 364 bp fragment.
Acknowledgements: This work was supported by the Swiss FederalVeterinary Office and by the Swiss Federal Office for Education andResearch (BBW No. 97.0579±1). We would like to thank U. Sattlerand B. Colomb for their technical assistance.
References1 Hunter et al. (1996) Arch Virol 141, 809±24.2 SchlaÈpfer et al. (1997) Chrom Research 5, 511±9.3 SchlaÈpfer et al. (1998) Anim Genet 29, 265±724.4 Goldmann et al. (1991) J Gen Virol 72, 201±4.
Correspondence: J SchlaÈpfer ([email protected]).
Twelve novel cosmid-derived caninemicrosatellitesJ SchlaÈpfer1, G Dolf1, N Saitbekova1, C Schelling2
1Institute of Animal Breeding, University of Berne, 3012 Berne,Switzerland; 2Department of Animal Science, Swiss FederalInstitute of Technology, 8092 ZuÈ rich, Switzerland
MOLECULAR GENETIC MARKERS 387
R1CCTCAGGGAGGGGGTGGCTGGGGTCAG
R2CCCCATGGA-GGTGGCTGGGGCCAG
RN1CCTCATGGA-GGTGGCTGGGGCCAA
R4CCTCATGGA-GGTGGCTGGGGTCAG
R5CCCCATGGT-GGTGGCTGGGGACAG
RN2CCACATGGT-GGTGGCTGGGGACAG
R6CCACATGGTGGTGGAGGCTGGGGTCAA
Fig. 3. Alternative partial nucleotide sequence of coding region
PRNP, representing a third allele RN2. Changes relative to the
published sequence (4) are in italics.
Table 1. Microsatellite, EBI/GenBank accession number, repeat type, primer sequences and touch-down ranges of markers
Locus Accession Repeat type Primer sequences 59±39
Annealing temperature
touch-down range (°C)
ZuBeCa7 AJ132979 (CT)15 F GCCTCGGAATGGAGTC 63±55
AJ224762 R GGTTTTATTAGCCAAGACACT
ZuBeCa8 AJ132980 (CT)5TT(CT)2TT(CT)6 F CGGAGTCCTGGGATTGAGC 63±55
R CCACCAGCCAACCTCAGACA
ZuBeCa9 AJ132981 (GT)14 F CCTGAGCTGCGGTGAG 63±55
R ATGGGGTCAGAAGTCAAAAG
ZuBeCa10 AJ132976 (TC)13(TA)8T(TA)4A(TA)5 F TAGCCTTCTCTTTCTTTCCCTCTG 65±58
R GCCCCTAAGTTCCACATTGTTC
ZuBeCa11 AJ132977 (AC)14 F ACAACCCCAGCTAAGCACAT 65±58
R TGTCCTCAAAGTCCCCAGAC
ZuBeCa12 AJ132978 (CTTT)19(CT)2(CTTT)CTT(CTTT)5CTT
(CTTT)2(CT)2(CTTT)2(CT)2(CTTT)3CTT(CTTT)CTT(CTTT)4
F TCCCATGTCCACGCAAAAATA
R GGGAGCCTGCTTCACCTTCT
63±55
ZuBeCa13 AJ132970 (GGAT)9 F CTTATGGGCTGGGCTGAG 63±55
R GGCAAGACAGAAAGGCAAGT
ZuBeCa14 AJ132971 (CA)14 F CACTCGCTCCCCTCAG 63±55
R AGAAAGTCATGTAGGCTGGAT
ZuBeCa15 AJ132972 (GT)12 F CGCTGCATACTCCCCCTGTC 63±55
R GGTTCATCCTTCCCCCAAAGT
ZuBeCa16 AJ132973 (GAAA)20A(GAAA)4AA(GAAA)11GA(GAAA)9 F CGTGTTGGGCTCCATGCT 68±60
R GCAGGAAGTGGCCAAAGG
ZuBeCa17 AJ132974 (GT)13 F CATGAGTGTGCGATGCTGTGT 63±55
R CACCTAGTGCTGGGGCTCTG
ZuBeCa18 AJ132975 (GT)13 F AGGATGATGCTAAGGTTTGGGAACT 63±55
R GACACAGAGCCACACAGGAATGT
ã 1999 International Society for Animal Genetics, Animal Genetics 30, 382±405

Accepted 3 April 1999
Source/description: Positive clones were isolated from a genomiccanine cosmid1 library with either of the end labeled oligonucleo-tide probes (AAAG)20, (GGAT)20, (GACA)20, (GA)20 or (CA)20. Thiscosmid library was established by ligating partially Sau3 A-digestedDNA of a male Bernese Mountain dog into Supercos I (Stratagene, LaJolla, CA). After Sau3 A subcloning into pUC19 and rescreening, 12positive clones, ZuBeCa7 through to ZuBeCa18, were isolated andsequenced on a LI-COR DNA sequencer model 4000 l (LI-COR,Lincoln, NE). The PCR primers shown in Table 1 were designedusing the OLIGO 5.0 program (National Biosciences, Plymouth,MN).
PCR conditions: Amplifications were carried out in 12 ml containing2 ml of DNA solution (Chelex 100, BioRad or High Pure PCRTemplate Preparation Kit, Boehringer, Mannheim, Germany),2.5 pmol of each primer, 0.25 mm of each dNTP, 1 ´ PCR bufferwith 1.5 mm MgCl2 (Appligene) and 0.35 units Taq polymerase(Appligene, Gaithersburg, MD) in a Perkin±Elmer 9600 or 9700thermocycler. PCR was performed using the following touch-downprogram2: initial denaturation for 5 min at 94°C, two cycles each of30 s at 94°C, 30 s in the respective touch-down range down from thehighest to the lowest annealing temperature (Table 1) and 30 s at72°C, followed by 14 cycles of 30 s at the lowest annealingtemperature. The final extension was for 30 min at 72°C. Sizes ofthe alleles were determined on 8% denaturing polyacrylamide gelsusing a LI-COR DNA sequencer model 4200 (LI-COR, Lincoln, NE).
Polymorphism: The sizes and number of alleles were observed in apanel of 52 dogs, representing 52 different breeds. The calculatedheterozygosity and polymorphism information content (PIC)3 aregiven in Table 2.
Mendelian inheritance: Codominant inheritance was
observed in the DogMap reference family pedigree4. ZuBe
Ca8 was not informative in this family material.
Other comments: ZuBeCa14 and ZuBeCa15 are two distinctmicrosatellites although they are derived from the same cosmidclone. All microsatellites amplify PCR products in wolf. ZuBeCa7, -8, -10, -12, -14, -15, and -17 amplify also in fox (Table 2). AlthoughZuBeCa8 is monomorphic in the DogMap reference family materialand in the 52 dog breed representatives, it is polymorphic in 29 foxindividuals (data not shown).
Acknowledgements: We thank B. Colomb, E. Garbely, and U. Sattlerfor their technical assistance and P. Schawalder for providing dogblood samples. This work was supported by the Albert-HeimStiftung, Switzerland and by the Union Bank of Switzerland actingon behalf of a client.
References1 Dolf G. et al. (1997) Anim Genet 28, 156±7.2 Don R.H. et al. (1991) Nucl Acid Res 19, 4008.3 Botstein D. et al. (1980) Am J Hum Genet 32, 314±31.4 Lingaas F. et al. (1997) Mamm Gen 8, 218±221.
Correspondence: J SchlaÈpfer ([email protected]).
A molecular marker for the chicken myostatingene (GDF8) maps to 7p11A Sazanov, D Ewald, J Buitkamp, R FriesLehrstuhl fuÈ r Tierzucht, Technische UniversitaÈt MuÈnchen, D-85350Freising-Weihenstephan, Germany
Accepted 6 April 1999
Source/description: Primers (GDF8up, 59-GAA GAA TTC GGA TGGGAC TGG ATT ATI GCI CC-39; GDF8dn, 59-CTC GAA TTC ACCCAC AGC GGT CTA CTA CCA TGG-39) were derived from thesequence of the murine growth/differentiation factor-8 (GDF8)cDNA, which has been shown to encode a myostatic factor1.GDF8 was thus termed myostatin (MSTN). PCR using these pri-mers yielded a 250-bp amplification product of chicken genomicDNA. This product was used to screen a gridded cosmid library ofthe chicken genome2. Nine hybridization signals were observed.GDF8-specifity of one cosmid clone, L11±141, was verified bysequencing. A fragment of 198 bp showed 100% identity withthe chicken cDNA (position 903±1100, accession number AF019621).
Chromosomal mapping: Cosmid L11±141 was used for fluorescencein situ hybridization as described by Masabanda et al. (1998)3.However, the digoxigenin±Cy3 system was applied as described byFlorijn et al. (1995)4 instead of the biotin±FITC±system for labelingand signal detection. Specific signals were detected in numerousmetaphases on chicken chromosome (GGA) 7. The average fractionallength of the signal position measured from the telomere of the q-arm (FLqter) on 11 chromosomes is 0.85 � 0.026. On this basis, weassign GDF8 to GGA 7p11.
Comments: GDF8 has been assigned to human chromosome (HSA)2q32.1±2q32.1 (www.gdb.org). NRAMP, located on HSA 2q35, is inGGA 7q135. The location of MSTN on GGA 7 could therefore beexpected, and it is likely that a significant part of GGA 7 (at least theregion p11±q13) is conserved in HSA2.
Mutations in the bovine and murine myostatin genes lead tophenotypes of hypermuscularity in these species1,5. Thus the
Table 2. Summary data for 12 canine microsatellites
Amplification
Locus Allele sizes (n = 52) No. of alleles (n = 52) PIC (n = 52) Heterozygosity Wolf Fox
ZuBeCa7 198±212 8 0.77 0.79 + +
ZuBeCa8 380 1 monom. monom. + +
ZuBeCa9 218±236 9 0.49 0.54 + ±
ZuBeCa10 149±167 6 0.38 0.39 + +
ZuBeCa11 198±212 8 0.56 0.63 + ±
ZuBeCa12 400±454 24 0.94 0.94 + +
ZuBeCa13 138±166 7 0.67 0.71 + ±
ZuBeCa14 149±155 4 0.45 0.51 + +
ZuBeCa15 185±201 5 0.27 0.29 + +
ZuBeCa16 184±246 18 0.88 0.89 + ±
ZuBeCa17 179±189 3 0.55 0.62 + +
ZuBeCa18 198±222 8 0.50 0.54 + ±
ã 1999 International Society for Animal Genetics, Animal Genetics 30, 382±405
388 MOLECULAR GENETIC MARKERS

chicken myostatin gene is a candidate for containing variationcausing differences in muscularity in chicken.
Acknowledgements: This work was made possible through grantsfrom the EU (contracts BIO4-CT9502872 and BIO4-CT980288).
References1 McPherron A.C. et al. (1997) Nature 387, 83±90.2 Buitkamp J. et al. (1998) Anim Genet 29, 295±301.3 Masabanda J. et al. (1998) Chrom Res 6, 231±38.4 Florijn R.J. et al. (1995) Hum Mol Genet 4, 831±36.5 Girard-Santosuosso O. et al. (1997) Mamm Genome 8, 614±16.6 Grobet L. et al. (1997) Nature Genet 17, 71±74.
Correspondence: R Fries ([email protected]).
A polymorphic CA-repeat at the porcinetransferrin (TF) locusM Van Poucke1, P Chardon2, M. Mattheeuws1, A VanZeveren1, L J Peelman1
1Department of Animal Nutrition, Genetics, Breeding and Ethology,Faculty of Veterinary Medicine, University of Ghent, 9820Merelbeke, Belgium; 2Commissariat a l'energie atomique/Institut
national de la recherche agronomique, Departement de radiobiologieet de radiopathologie, 78350 Jouy-en-Josas, France
Accepted 13 April 1999
Source/description: Transferrin is a member of a small family ofiron binding monomeric glycoproteins1. Primers based on theporcine liver transferrin cDNA sequence (GenBank accessionnumber X12386) were used to screen a porcine BAC library2.Subclones of the BAC clone obtained, were screened for CA-repeatsby Southern blot analysis with synthetic CA-oligonucleotides(Pharmacia, Uppsala, Sweden) as probes and sequenced using theALFexpressTM AutoreadTM Sequencing Kit (Pharmacia). Primersflanking a CA-repeat were selected with Primer 33 to study thepolymorphism.
Primer sequences:
Forward primer: 59-CATTGCTGTGGCTCTG-39 (59-Cy5-labelled)
Reverse primer: 59-CTACCAGTTTTGGCTTTGAC-39
PCR conditions: PCR amplifications were performed in 10 ml ona T3 Thermocycler (Biometra, GoÈttingen, Germany). The re-action mixes comprised 20±100 ng genomic DNA, 1.5 mm MgCl2, 20 mm Tris±HCl (pH 8.4), 50 mm KCl, 10 pmol of each pri-mer, 200 mm dNTPs and 0.5 U PlatinumTM Taq polymerase(Life Technologies, Merelbeke, Belgium). The thermal cyclingprofile was: 94°C (10 min) one cycle; 94°C (30 s), 54°C (30 s),72°C (1 min) 30 cycles; 72°C (10 min) one cycle. The fluorescentPCR products were electrophoresed on an ALFexpressTM DNASequencer and analysed by DNA fragment analyzer version 1.2(Pharmacia).
Allele frequency: Polymorphism was studied using DNA samplesof 11 Czech Meat, 34 Landrace, 14 Large White, 15 Meishan and21 Pietrain unrelated pigs. Among these 95 pigs, nine differ-ent alleles of the microsatellite were detected. The lengths ofthe corresponding PCR products were 144, 160, 164, 166, 170,174, 176, 178 and 180 bp. Allele frequencies are shown in Table1.
Chromosomal location: The porcine TF gene has been assigned tochromosome 13q31 by in situ hybridization4.
Acknowledgements: We are grateful to Prof. Dr H. Gelderman and DrA Stratil for providing the DNA samples. We thank Pascale Laffont,Linda Impe and Dominique Vander Donckt for excellent technicalassistance.
References1 Schaeffer E. et al. (1987) Gene 56, 109±16.2 Rogel-Gaillard C. et al. (1999) Cytogenet Cell Genet, in press.3 Rozen S. & Skaletsky H.J. (1998) Primer3. Code available
at http://www-genome.wi.mit.edu/genome_software/other/primer3.html.
4 Chowdhary B.P. et al. (1993) Anim Genet 24, 85±90.
Correspondence: L J Peelman(e-mail: [email protected])
MOLECULAR GENETIC MARKERS 389
Fig. 1. Fluorescence in situ hybridization of a GDF8-specific cosmid on
chicken chromosomes. (A) Partial metaphase with QFQ-banded
chromosomes prior to in situ hybridization; (B) same metaphase as in (A),
showing Cy3-signals specific for GDF8 on chromosome 7. The bar represents
10 mm.
Table 1. Sizes and frequencies of alleles observed
Breeds Number of animals Alleles (bp)
144 160 164 166 170 174 176 178 180
Czech Meat pig 11 0.000 0.591 0.000 0.000 0.091 0.273 0.045 0.000 0.000
Landrace 34 0.103 0.514 0.015 0.000 0.103 0.235 0.000 0.015 0.015
Large White 14 0.000 0.393 0.071 0.036 0.000 0.357 0.000 0.143 0.000
Meishan 15 0.067 0.000 0.000 0.000 0.000 0.933 0.000 0.000 0.000
Pietrain 21 0.071 0.714 0.048 0.000 0.048 0.095 0.000 0.024 0.000
Total 95 0.063 0.469 0.026 0.005 0.058 0.337 0.005 0.032 0.005
ã 1999 International Society for Animal Genetics, Animal Genetics 30, 382±405

A single nucleotide polymorphism and a (GA)nmicrosatellite in intron 6 of the canineendothelin receptor B (EDNRB) geneD Zemke1, V Yuzbasiyan-Gurkan1,2
1Department of Microbiology; 2Department of Small Animal ClinicalSciences, Michigan State University, East Lansing, MI 48824-1314,USA
Accepted 19 April 1999
Source/description: Consensus PCR primers to the published humanand mouse sequences were designed to amplify the intron betweenexons 6 and 7 of the canine endothelin receptor B (EDNRB) gene. Thenumbering of the exons is the same as for the published human andmurine sequences1,2. A total of 700 bp of canine sequence wasobtained from the resulting PCR product, including the entire intronand both 59 and 39 exonic sequences. The intron sequence (Genbankaccession no. AF134188) matched that of an intron previouslysequenced by others3 and reported to lie between exons 4 and 5
(Genbank accession no. AF026088). The two sequences were nearlyidentical, including a (GA)n microsatellite, except for the presence ofan extra G at base 235 in AF026088. Comparison of the surroundingexonic sequences reported by Liu et al. (1998)3 with the nearlycomplete canine EDNRB cDNA sequence obtained by this laboratory(Genbank accession no. AF034530) confirmed that this intron indeedlies between exons 6 and 7. During sequencing, a single nucleotidepolymorphism (SNP) was found, resulting in a G±A transition » 40nucleotides downstream of the polymorphic microsatellite (Gen-bank accession no. AF134188).
Primer sequences:
Forward primer, F: 59-AGACGGGAAGTGGCCAAAAC-39
Reverse primer, R: 59-GAGGCCATATTGATGCCGAT-39
SNP detection primer, S: 59-GACCAGTGATAAAGTCAAAAATCAT-39
Microsatellite forward primer, MF: 59-GAGAATTGGGCATGGGCAGA-39
Microsatellite reverse primer, MR: 59-TGACTTTATCACTGGTCT-TTG-39
PCR conditions: All PCR reactions were carried out in 25 mlreactions containing 0.6 U Taq polymerase, 0.8 mm of each primer,1.5 mm MgCl2, and 100 mm dNTPs. Reactions were denatured at94°C for 4 min, followed by 35 cycles of 94°C for 1 min, the chosenannealing temperature for 2 min, and 72°C for 3 min, followed by afinal extension at 72°C for 8 min. The initial PCR was performedusing primers F and R and 3 ml of genomic DNA at a 66°C annealingtemperature. The resulting band was sampled by stabbing into thegel with a pipette tip and transferring it to 15 ml of water. Threemicroliters of this sample was used as a template in the second PCRwith primers S and R for SNP detection and primers MF and MR formicrosatellite sizing, both at a 60°C annealing temperature. Theexpected size of the initial product was 740 bp, the SNP detectionproduct was 170 bp, and the microsatellite product » 131 bp. TheSNP detection primer was designed to introduce a partial BspHI
restriction site next to the single nucleotide polymorphism, which iscompleted when the polymorphic base is A and not completed if thepolymorphic base is G. Following BspHI digestion, the G allele isrepresented as a 170-bp band and the A allele as two bands of » 146and 24 bp.
Polymorphism: Genomic DNA from 36 dogs, representing 11 mixedbred animals and 25 different pure breeds was tested for both the GAand the SNP polymorphisms. Four alleles were observed with theGA microsatellite and two with the SNP. The observed hetero-zygosity (HET) was 0.42 for the microsatellite and 0.36 for the SNP.The third largest (GA)n microsatellite repeat allele was found to beassociated in all cases with an A at the SNP site. All other repeatalleles were associated with a G at this site.
Chromosomal location: Unknown.
Mendelian inheritance: Testing of a family of dogs (Fig. 1) segregat-ing for both the SNP and the microsatellite supported theinheritance of both of these variations in a Mendelian fashion.
Acknowledgements: This work was supported in part by grants fromthe American Kennel Club Canine Health Foundation, the Dalma-tian Club of America and the Jaqua Foundation.
References1 Elshourbagy N.A. et al. (1993) J Biol Chem 268, 3873±3879.2 Hosoda K. et al. (1994) Cell 79, 1267±1276.3 Liu P.-C. et al. (1998) Anim Genet 29, 236.
Correspondence: Vilma Yuzbasiyan-Gurkan (e-mail: [email protected]).
A HaeIII PCR-RFLP in the ZFY/ZFX genes ofhorsesC Senese1, M C T Penedo2, Y-L Shiue2, A T Bowling2, L VMillon2
1Dipartimento di Scienze delle Produzioni Animali, UniversitaÁ degliStudi di Basilicata, Potenza, Italy; 2Veterinary Genetics Laboratory,School of Veterinary Medicine, University of California, Davis, CA,USA
Accepted 19 April 1999
Source/description: Primers 5EZ and 3EZ1 were used to amplify a448-base pair (bp) fragment of the horse ZFY/ZFX gene bypolymerase chain reaction (PCR). Digestion of amplified DNA withHaeIII yielded sex-specific banding patterns when resolved byagarose electrophoresis. DNA sequences of horse ZFX and ZFYamplified fragments are deposited in GenBank (accession numbersAF132292 and AF133198).
Primer sequences:
P1±5EZ: 59-ATAATCACATGGAGAGCCACAAGCT-39
P2±3EZ: 59-GCACTTCTTTGGTATCTGAGAAAGT-39
Fig. 1. Two percent agarose gel showing SNP (lanes 2±7) and microsatellite (lanes 8±13) results for a family of six dogs. The sire (lanes 2 and 8) was homozygous
for the A SNP allele and the third largest microsatellite allele. The dam (lanes 3 and 9) was heterozygous for both SNP alleles and the second and third largest
microsatellite alleles. The offspring are shown in lanes 4±7 and 10±13. Lane 1 contains a 100-bp DNA ladder.
ã 1999 International Society for Animal Genetics, Animal Genetics 30, 382±405
390 MOLECULAR GENETIC MARKERS

PCR and restriction digest conditions: The 25-lL PCR reactionscontained 100 ng of DNA template, 1´ PCR buffer (Promega,Madison, WI), 0.25 mm each dNTP, 1.5 mm MgCl2, 5 pmole ofeach primer and 0.75 U of Taq polymerase (Promega). Temperaturecycling was as follows: one cycle at 97°C (2 min), 58°C (1 min), 72°C(1 min) followed by 29 cycles at 94°C (45 s), 58°C (1 min), 72°C(1 min). The 25 lL reaction volume was digested for at least 2 h with10 units of HaeIII (Pharmacia, Piscataway, NJ) and analyzed byelectrophor-esis in 3% Seakem GTG agarose gels (FMC Bioproducts,Rockland, ME). Gels were stained with ethidium bromide andphotographed under UV light.
Chromosomal location: ZFY/ZFX genes are located in the Y and Xchromosomes in placental mammals. The precise location in thehorse has not been determined. In humans, these genes map tochromosome bands Xp21 and Yp11.32.
Polymorphism: Sex-specific PCR-RFLP was verified by screening26 females and 29 males representing five horse breeds. In ad-dition, two infertile mares with an XY karyotype (sex-reversedfemales) were also tested. Banding patterns are shown in Fig. 1.ZFX contains a single HaeIII site that is lacking in ZFY. Thus,digested DNA in females yields two fragments of 403 and 45base pairs. In males, the DNA fragments correspond to the un-cut 448-bp ZFY and the two ZFX fragments. The small 45 bpgenerated by HaeIII digestion is not always visible in agarose gelsand is not included in Fig. 1. The banding pattern found for sex-reversed females is indistinguishable from that of males. A sex-specific HaeIII PCR-RFLP similar to horses has been described indogs3.
Comment: Sex-specificity of ZFY/ZFX HaeIII PCR-RFLP was alsoverified by parallel screening with SRY (sex determining region Ygene) primers RG4 and RG74 of 93 Quarter Horses (47 females and 46males). Sex classification with ZFY/ZFX and SRY was 100%concordant. Our results disagree with a report1 stating that horseZFY/ZFX did not show RFLPs with a group of enzymes thatincluded HaeIII. The failure to detect the HaeIII RFLP can beattributed to a technical problem, since our results clearlydemonstrate polymorphism. Furthermore, the DNA sequence ofZFX fragment (not shown) confirms the presence of the HaeIIIrestriction site.
References:1 Aasen E. & Medrano J.F. (1990) Biotechnology 8, 1279±81.2 Leung W.Y. et al. (1990) Cytogenet Cell Genet 54, 151±3.3 GarcõÂa-Muro E. et al. (1997) Anim Genet 28, 156.4 Griffiths R. & Tiwari B. (1993) Mol Ecol 2, 405±6.
Correspondence: M C T Penedo(e-mail: [email protected])
Characterisation of 33 chicken microsatelliteloci: 20 new locations on reference mapsM Morisson1, F Plisson-Petit1, D Dawson2, F Pitel1, VFillon1, J Gellin1, T Burke2, A Vignal1
1Laboratoire de GeÂneÂtique Cellulaire, INRA, BP27, F 31326 Castanet-Tolosan, France; 2Department of Biology, University of Leicester,Leicester LE1 7RH, UK
Accepted 21 April 1999
Source/description: Chicken (Gallus gallus domesticus) NdeIIgenomic fragments were PCR amplified using the method describedby Lisitsyn et al. (1993)1. The amplified fragments showed sizes of200±800 bp and were used to create (CA)n, (GA)n and (TTTC)nenriched libraries in pBluescript essentially by the methoddescribed by Armour et al. (1994)2 as modified by Gibbs et al.(1997)3. Clones that cross-hybridised to 32P-labelled (CA)n, (GA)n,or (TTTC)n probes were first selected for an insert size comprisedbetween 300 bp and 800 bp using M13 and M13rev primers. Theselected clones were sequenced using dyedeoxy terminators(Applied Biosystems, Foster City, CA) on an ABI 377 sequencingmachine. FASTA searches in the GenBank and EMBL databaseswere performed with each sequence to detect putative homologies orduplicates.Primers were designed with the assistance of the software Primer3v0.2b(http://www-genome.wi.mit.edu/genome_software/other/pri-mer3.html). The full sequences have been submitted to the EMBLdatabase and their accession numbers are given in Table 1.
PCR conditions: 25 ml amplification reactions were performed in96-well microtitre plates on a Hybaid OmniGene thermal cyclerusing the block control mode. Each reaction contains 25 ng ofgenomic DNA, 0.5 units Taq polymerase (Life Technologies Sarl,Cergy-Pontoise cedex, France), 1 ´ reaction buffer (Life Technolo-gies: 20 mm Tris pH 8.0, 50 mm KCl), 0.05 ´ W buffer (LifeTechnologies), 2 mm of each primer, 200 mm of each dNTP, andvaried concentrations of MgCl2 (given in Table 1). Amplificationwas performed as follows: 94°C 5 min for one cycle, 57°C 30 s, 72°C20 s, 94°C 30 s for two cycles, AT°C 30 s, 72°C 20 s, 94°C 30 s for 36cycles, AT°C 30 s, 72°C 10 min for one cycle (AT is given inTable 1).
Touchdown PCR conditions: The reaction conditions were as above(MgCl2 concentrations are given in Table 1) except that the reactionswere performed on a Perkin±Elmer model 9700 thermal cycler andthe reaction profile was: 94°C 5 min for one cycle, AT + 6°C 1 min,72°C 1 s, 94°C 40 s for three cycles, AT + 4°C 1 min, 72°C 1 s, 94°C40 s for three cycles, AT + 2°C 1 min, 72°C 1 s, 94°C 40 s for threecycles, AT°C 1 min, 72°C 1 s, 94°C 40 s for three cycles, AT°C 40 s,72°C 40 s, 94°C 40 s for 30 cycles (AT is given in Table 1).
MOLECULAR GENETIC MARKERS 391
Fig. 1. Agarose gel of ZFY/ZFX HaeIII PCR-RFLP in horses. Lanes 2, 3 and 4 are cut fragments from males. Lanes 5 and 6 are uncut fragments from a male and a
female, respectively. Lanes 7, 8 and 9 are cut fragments from females. Lanes 10 and 11 are cut fragments from X-Y females. Lanes 1 and 12, molecular size marker
(DNA size standard, 50 Base-Pair Ladder, Pharmacia Biotech).
ã 1999 International Society for Animal Genetics, Animal Genetics 30, 382±405

Table 1. Characterisation and PCR amplification conditions of 33 microsatellite loci
Locus name
Accession
number Repeat array* Primer sequences (59±39)
MgCl2(mM)
AT
(°C)yLength
(bp)*
EL Map
location
C map
location
GCT027 AJ233969 (CA)7CG(CA)7 F TGAAACTCATTTTCCTGCCC 1.5-2 55 106 NP CH2
R TTCAAAGTTCAGTTCCCGCT
GCT025 AJ233970 (GAAA)2(GAAG)6(AAAG)2 F CTGCGCACAAACTTCAAGAG 1.5 51 182 NP UL
R: GGTGGGGAAAAGGACAGC
GCT024 AJ233972 (TG)16 F CATTGCTTGGATGTTGGATG 1.5 55 237 NP CH1
R CTCCTATGTTCCATTGGTTTC
GCT032 AJ233977 (TG)6AG(TG)8 F CTGGCATACGGATTGGTTTT 1.5 55 241 NP CH1
R CTGTGTTGCAATGGCTCTGT
GCT038 AJ233983 (TG)28 F TTTGTGCTGCAGTCGTAACA 2 51 198 NP NP
R GCTGTGAAGGGAGAGAATG
GCT039 AJ233984 (AG)14 F GATCACGGAAACCCCAGC 1.5-2 55 106 UL UL
R TTCCTTCCTTCTCATGTGCC
GCT042 AJ012234 (CA)15 F GGGTTTGTCACCTCCTGGT 1.5 55 132 E38 NP
R TAGAGGCACGGGAAGGTATG
GCT044 AJ012236 (GA)4[(GA)2CA]4(GA)
14G2[(GA)2CA]4GA
[(GA) 2CA]6 (GA)6
F GGCACAAGCCTGGTGTTTAG 4 55 312 NP NP
[(GA)2CA] (GA)5
[(GA)2CA]4(GA)9
R GTTCACACACGCACAGGTTC
GCT046 AJ012238 (GT)15 F GGAGATGGTGTGTTTGCCTT 1.5-2 55 190 NP NP
R CCCACTTAGTTGCTTGTCC
GCT051 AJ012243 (TG)15 F TCAGTTGATAGCTGCATCCG 1.5 55 194 NP CH1
R GCTTTGAGAGCATGACCAGTT
GCT054 AJ012246 (CA)6TA(CA)4 F TCCTCCAGCTCTCACCCTAA 1.5-2 55 91 NP NP
R GCTGCAACAGGAAGGAAGTC
GCT055 AJ012247 (TG)14 F GAACATGGGCAATGCTCTTT 1.5 55 213 E16 C17
R TGTGTTCCTCTCCATGCGTA
GCT026 AJ233971 (CA)18 F GTCCTTCGTTGTCACTGTGC 1.5 55 219 NP CH4
R ATGACTCAGAATGCAGTGCG
GCT028 AJ233973 (CA)3T2(CA)4G2(CA)
3 TA(CA)6
F GGATTGAACAATTGCGTGTG 1.5 55 216 NP NP
R GCAGAGTGCCATCTTTACCAG
GCT029 AJ233974 (CA)14 F GGCAAAGGTTACAGGTCATA 3 55 125 NP NP
R ATCCAAATATGATAGACACTGA
GCT030 AJ233975 (TG)19 F TCTGGCTGGTGACTTTGTGA 2 57 139 NP NP
R AGCGTATTTTGTGCGACTCC
GCT031 AJ233976 (GA)9A2(GA)2G2(GA) 10
G2(GA)2
F TCAACAAATTGAAGAACGAA 3 55 147 CH1 NP
R TTACGACAATCACTAGCCCT
GCT033 AJ233978 (CT)20 F CCTTGTGGAAAAGGGTCT 3 55 148 CH1 NP
R GAGAGACATTCTGAAGCTTTTT
GCT034 AJ233979 (GA)13(GCAGAGCTACA)
(GA)7
F GATCTCGGGCCTCTCACC 3 55 162 CH1 NP
R TTCACTCTGCCTCTCGTCCT
GCT035 AJ233980 (GT)28 F AAGGACCCAGTGTTCTGTGG 3 57 180 NP UL
R GCACTTAGTCCACCCCATTC
GCT036 AJ233981 (CA)2CG(CA)5 F GGGAACTCAAACAAATGCGT 1.5 55 231 NP NP
R AGACAGGCCGGTTATCTTCC
GCT037 AJ233982 (TC)17 F AGCCACACAGCACACAGTTC 3 57 255 E26 NP
R ATTGGTTTTCTGATGGCCTG
GCT040 AJ012232 (CA)11 F CTGGTGCAACAGTGACGACT 1.5 57 119 NP NP
R AGGAGGGTAATGAGGCCCTA
GCT041 AJ012233 (TG)6T2(TG)6 F GGGAGGATGACCATCAGCTA 1.5 57 151 NP NP
R TCCATGCAGACACACTCCAT
ã 1999 International Society for Animal Genetics, Animal Genetics 30, 382±405
392 MOLECULAR GENETIC MARKERS
Polymorphism/segregation analysis: When no length polymorphismwas observed within the two reference families, the amplifiedfragments were denatured by heating at 95°C and loaded on a non-denaturing 10% acrylamide/bisacrylamide (49 : 1) gel containing5% glycerol, to visualise a SSCP4 through silver staining5. Segrega-tion analyses were performed in Compton6 or/and East Lansing7
chicken reference backcross mapping populations and geneticlocations on the maps calculated with the Map Manager software8.Thirteen markers were monomorphic in both families, but weanticipate that they will prove useful for mapping in othercrosses3,9. Finally, 20 new markers could be mapped and thecurrent marker orders for these loci can be found on the RoslinInstitute Genome Mapping Page at URL (http://www.ri.bbsrc.ac.uk/genome_mapping.html) within the ChickMap genome database(ChickGBase).
Acknowledgements: We would like to thank Dr N Bumstead and DrH Cheng for providing DNA samples of the reference populations.This work was supported by the EC ChickMap Project (contract BIOCT95±0287) and the BBSRC. M Morisson was supported by a DRI-INRA grant.
References1 Lisitsyn N.et al. (1993) Science 259, 946±51.2 Armour J.A.L. et al. (1994) Hum Mol Gen 3, 599±605.3 Gibbs M. et al. (1997) Anim Genet 28, 401±17.4 Beier D.R. (1993) Mamm Genome 4, 627±31.5 Budowle B. et al. (1991) Am J Hum Genet 48, 137±44.6 Bumstead N. and Palyga J. (1992) Genomics 13, 690±7.7 Crittenden L.B. et al. (1993) Poultry Science 72, 334±48.8 Manly K.F. (1993) Mamm Genome 4, 303±13.9 Groenen M. A. M. et al. (1998) Genomics 49, 265±274.
Correspondence: M Morisson(e-mail: [email protected]).
Two highly polymorphic dinucleotidemicrosatellites in rainbow trout (Oncorhynchusmykiss): OmyRGT7TUF and OmyRGT8TUFA Ozaki1, S K Khoo1, T Sakamoto2, N Okamoto1
1Department of Aquatic Biosciences, Tokyo University of Fisheries,Minato, Tokyo 108±8477, Japan; 2Department of Zoology, Universityof Guelph, Guelph, Ontario N1G 2 W1, Canada
Accepted 26 April 1999
Source/description: Positive clones were isolated from a plasmidlibrary of size-selected (150±400 bp) Sau3AI restriction fragmentsfrom the RTG-2 cell line1 by screening with an end-labelled (CA)10
oligonucleotide probe. The sequence was obtained from an ABI 310automated sequencer. Two clones OmyRGT7TUF and OmyRGT8-TUF were shown to contain a (CA)41 and (CA)24 repeat, respectively.PCR primers were designed on the basis of the flanking sequences.
Primer sequences:
Forward primer (OmyRGT7TUF): 59-CCATCCTTGACTGATACAGAGG-39
Reverse primer (OmyRGT7TUF): 59-GCCGAAAACACAGAACCTTC-39
Forward primer (OmyRGT8TUF): 59-AGAAGAGAATGAGAGGGAGGG-39
Reverse primer (OmyRGT8TUF): 59-CCACCCAGCAGATGTTAGCT-39
PCR conditions: The PCR amplification (25 ml final volume) wasperformed using 50 ng of genomic DNA, 20 pmol of each primer,0.2 U of Taq polymerase (TaKaRa), 200 mm each dNTP, 1.5 mmMgCl2 and PCR buffer (Tris±HCl, 10 mm; KCl, 50 mm; pH 8.3). Thethermal cycler profile was 2 min at 95°C followed by 35 cycles of95°C for 30 s, 58°C for 1 min, 72°C for 1 min and final extension of3 min at 72°C. Products were analysed by electrophoresis in 6%denaturing polyacrylamide gels followed by image reading on a Bio-Imaging Analyser (Fujix, Tokyo, Japan).
MOLECULAR GENETIC MARKERS 393
Table 1. Continued
Locus name
Accession
number Repeat array* Primer sequences (59±39)
MgCl2(mM)
AT
(°C)yLength
(bp)*
EL Map
location
C map
location
GCT043 AJ012235 (CA)11(TA)(CA)7(TA)4 F TAGCAGTCTCCGGGAACATT 3 55 195 NP NP
R GCTTCTCACCGCACCATTAT
GCT045 AJ012237 (CA)40 F GTGTCTGATGGGGTGTGAT 2 57 238 NP NP
R GCAGGCGTCGTTTAATTTGT
GCT047 AJ012239 (TG)6CT(TG)10 F CCTTAATCCCTTGCGTGTGT 1.5 55 234 NP NP
R ACAGGACATATTGCCCTTGC
GCT048 AJ012240 (CA)43 F GGAATGCTGTGGGTGGTATC 3 57 231 NP UL
R CCTTTTAACCCAATGCTGAA
GCT049 AJ012241 (TG)6AG(TG)3AG(TG)4 F TGACCCCAGAGCTGAGAAGT 3 57 214 CH1 NP
R GATGGCAAGAAACCGAGAAA
GCT050 AJ012242 (GAAGA)13(GAGGA)(GAAGA)
2GN(GAAGA)13
F AGAGACAGAGGAGAGGGAAAAA 3 57 262 CH1 NP
R AAAAGCCTTCCCTGCAAAAC
GCT052 AJ012244 (TG)24 F TAGAGAAAGGACTGCCCGAA 3 57 233 NP CH2
R TTGATGTCTTTGGGTCTTTTCA
GCT053 AJ012245 (CA)13 F CATCAGCATCAGCGTTGTTT 2 57 138 CH3 CH3
R ATGTGCACCCTCTCATCACA
GCT056 AJ012248 (GT)6 F GGTAAACCCGCTCATACGAC 2 57 170 UL NP
R GGGTACGGCATCTGTAGGC
F, forward; R, reverse; NP, no polymorphism; UL, unlinked; EL, East Lansing; C, Compton; AT, annealing temperature. Underlined locations were obtained by
studying single strand conformation polymorphism.
*AT appears in bold when a touchdown PCR was used.
yThe sequences of repeat arrays and lengths of PCR products are from the original sequenced clone.
ã 1999 International Society for Animal Genetics, Animal Genetics 30, 382±405

Polymorphism: Polymorphism were studied in 17 unrelated rain-bow trout obtained from five Japanese hatcheries. Thirteen differentalleles in the size range of 136±253 bp were detected fromOmyRGT7TUF. Using the same individuals, OmyRGT8TUF showed10 different alleles ranging from 104 to 145 bp. PIC values,heterozygosity, and allele frequencies are shown in Table 1.
Mendelian inheritance: Mendelian inheritance was confirmed bytyping three halfsib families.
Chromosomal location: Unknown.
Acknowledgements: This work was supported in part by grants-in-aid from the Japanese Fisheries Agency and JSPS-RFTF97L00902.
References1 Wolf K. & Quimby M.C. (1962) Science 135, 1065.
Correspondence: N Okamoto (e-mail: [email protected]).
A single nucleotide polymorphism in the bovinekit oncogene (Hardy±Zuckerman 4 felinesarcoma viral (v-kit) oncogene homolog)M D Grosz1, R T Stone2
1USDA-ARS, Fort Keogh Livestock and Range Research Laboratory,Route 1 Box 2021, Miles City, MT 59301 USA; 2USDA-ARS, RomanL. Hruska US Meat Animal Research Center, Clay Center, NE 68933±0166 USA
Accepted 14 May 1999
Source/description: Oligonucleotide primers were designed fromthe bovine Kit cDNA sequence (acc. D16680). Exon and intronboundaries were determined by comparison with the human KITgenomic sequence (acc. U63834).
PCR conditions and SNP analysis: Twelve microliter reactions wereperformed in microtiter plates with the following conditions: 80 nggenomic DNA, 50 mm KCl, 2.5 mm MgC12, 10 mm Tris±HC1pH = 9.0, 30 mm each of unlabeled dNTP, 0.4 mm each of twooligonucleotide primers, and 0.35 units of Taq polymerase. The PCRprofile was 3 min at 92°C, followed by 35 cycles of 92°C for 30 s,58°C for 30 s, and 72°C for 30 s. PCR products were digested withrestriction endonuclease PstI for 1 h after amplification usingspecifications provided by the supplier. Resulting DNA fragmentswere electrophoresed through 3.0% agarose gel, stained withethidium bromide, and photographed.
Polymorphism: Two alleles have been identified (`a' and `b', Fig. 1).
In a survey of 26 unrelated animals, allele `b' was identified in oneanimal, which was heterozygous (therefore, frequencies of `a' and `b'are 0.98 and 0.02, respectively).
Inheritance: No deviation from codominant Mendelian inheritancewas observed in 36 meioses.
Chromosomal location: KIT has been localized to bovine chromo-some 6 by previous linkage (RFLP)1 and somatic cell hybridanalysis2. This reported SNP has been used to place KIT on bovinechromosome 6, between BM4621 and BM415. Based on the limitednumber of meioses, CRIMAP was unable to determine the morelikely order between BM4621-KIT-CA028-BM415 and BM4621-CA028-KIT-BM415.
References1 Barendse W. et al. (1997) Mamm Genome 8, 21±28.2 Zhang N. et al. (1992) Genomics 14(1), 131±6.
Correspondence: M D Grosz (e-mail: [email protected]).
Five new polymorphic microsatellite markersfor pig chromosome 6pF Zhao1, L M Miller2, P Chardon3, C Rogel-Gaillard3, C FLouis1
1Departments of Biochemistry, Molecular Biology and Biophysics,2Fisheries and Wildlife, University of Minnesota, Minneapolis, MN55455, USA; 3LMRA, INRA, 78350 Jouy en Josas, France
Accepted 28 May 1999
Source/description: DNA from a BAC clone (ID: 145H12) containingthe polymorphic microsatellite marker S00871 was digested withSau3AI, ligated into BamHI-digested calf intestine alkaline phos-phatase (CIAP)-treated pBlueScript vector and transformed into E.coli DH5a cells. The resulting subclones were screened with a 32Pend-labeled (GT)10 oligonucleotide probe. Individual positive clones
Table 1. Polymorphic information content, heterozygosity, allele sizes and
frequencies of OmyRGT7TUF and OmyRGT8TUF
OmyRGT7TUF OmyRGT8TUF
PIC 0.84 0.79
Heterozygosity 0.81 0.81
Allele size (frequency) 253 (0.03) 145 (0.03)
225 (0.03) 143 (0.03)
192 (0.09) 140 (0.03)
180 (0.12) 136 (0.18)
175 (0.03) 131 (0.15)
172 (0.12) 129 (0.18)
168 (0.03) 127 (0.03)
166 (0.03) 119 (0.03)
160 (0.09) 113 (0.31)
150 (0.31) 104 (0.03)
143 (0.03)
140 (0.03)
136 (0.06)
Fig. 1. Heterozygote (a/b; lane 2) and homozygote (a/a; lane 3) for kit SNP.
Size standards (100 bp ladder, NEB) are in lanes 1 and 4.
ã 1999 International Society for Animal Genetics, Animal Genetics 30, 382±405
394 MOLECULAR GENETIC MARKERS

were subjected to PCR amplification using M13 PCR primers(M13F:GTAAAACGACGGCCAG; M13R: CAGGAAACAGCTAT-GAC).The resulting PCR-amplified DNA products were purifiedusing Qiagen columns (Qiagen, Inc. Santa Clarita, CA) and used astemplates for dye-terminator fluorescence cycle sequencing. Fiveunique (CA)n MS repeat sequences were identified for whichPCR primers were designed using the PRIMER program2; mi-crosatellite marker S0087 was not among the PCR-amplifiedsequences.
PCR conditions: PCR reactions were performed in a 10-ml vol-ume containing 12.5 ng template DNA, 5 pmol of each primer(Table 1), 40 mm of dCTP, dGTP and dTTP, 10 mm of dATP and0.5 U Taq polymerase supplemented with 20 mm of [a-32P]dATP(3000 Ci/mmol). The PCR conditions were 94°C for 2 min, followedby 30 cycles each consisting of 30 s at 94°C, 30 s at 55°C, and 30 sat 72°C, followed by a 3-min extension reaction at 72°C. PCRproducts were electrophoretically fractionated on polyacrylamidegels.
Polymorphism: To assess their heterozygosity, the five microsatel-lites were genotyped on 19 unrelated animals randomly selectedfrom six breeds of pig (three Meishan, two Yorkshire, three Duroc,three Hampshire, three Landrance and three Pietrain). The PCRprimers, number of alleles, allele sizes and heterozygosity are listedin Table 1.
Chromosome localization: The BAC clone from which these five MSsequences are derived contains the previously identified MSS00871, which has been mapped genetically to the swine chromo-some 6 genetic linkage map1. The cloned insert is estimated to be108 kb by pulse field gel electrophoresis (PFGE) (data not shown). InFISH experiments it was demonstrated that this clone is non-chimeric and localized to the proximal region of the chromosome 6parm (data not shown), which is consistent with its genetic assign-ment.
References1 Ellegren H. & Johansson M. et al. (1993) Genomics 16, 431±439.2 Lincoln S.E. et al. (1991). PRIMER: A computer program for
automatically selecting PCR primers. MIT Center for GenomeResearch and Whitehead Institute for Biomedical Research,Cambridge, MA.
Correspondence: Charles F Louis.
A new mutation in the bovine insulin-likegrowth factor binding protein-3A Haegeman, A Van Zeveren, L J PeelmanDepartment of Animal Nutrition, Genetics, Breeding and Ethology,Faculty of Veterinary Medicine, University of Ghent, 9820Merelbeke, Belgium
Accepted 5 June 1999
Source/description: Primers were constructed based upon thesequence of the bovine IGFBP3 gene (GenBank accession numberU83465).
Primer sequences:
59-primer: CCAAGCGTGAGACAGAATA
39-primer: GGAGGAGGGATAGGAGCAAG
PCR conditions: PCR amplifications were performed in 10 ml on aT3 Thermocycler (Biometra, GoÈttingen, Germany). The reactionmixes comprised 20±100 ng genomic DNA, 1.5 mm MgCl2, 20 mmTris±HCl (pH 8.4), 50 mm KCl, 10 pmol of each primer, 200 mmdNTPs and 0.5 U Taq platinum polymerase (Life Technologies,Merelbeke, Belgium). The thermal cycling profile was: 94°C(10 min) one cycle, 94°C (30 s), 64°C (30 s), 72°C (1 min) 30 cycles,72°C (10 min) one cycle.
Analysis of PCR-generated fragments: The PCR fragment from aBlonde d'Aquitaine animal and a Belgian Blue crossbred animalwere cloned in pCRTMII cloning vector (TA ConingÒKit, Invitrogen,San Diego, USA) and were sequenced using the ALFexpressTM
AutoreadTM Sequencing Kit (Pharmacia, Uppsala, Sweden). A T®Csubstitution was detected in intron 2 of the IGFBP3 gene in theBelgian Blue crossbred animal. The mutant allele can be identifiedby digestion with Nla III.
Allele frequency: The amplified fragments were digested for 2 hwith 5 U of Nla III. The digestion fragments were identified on a 2%agarose gel. The lengths of digestion fragments were 470 bp +114 bp + 69 bp for the mutant allele and 539 bp + 114 bp for thewild-type allele. One hundred and ten unrelated animals weregenotyped. The following breeds were included in this study:Belgian Blue, Limousin, Red and Black Holstein, Belgian Bluecrossbred, Red Pied and Red West Flanders, Blonde d'Aquitaine.Allele frequencies are shown in Table 1.
Mendelian inheritance: Codominant Mendelian segregation for thetwo alleles was observed in three families.
Chromosomal location: The bovine insulin-like growth factorbinding protein-3 has been assigned to chromosome 41.
Acknowledgements: We are grateful to F Coopman and G Mommensfor supplying the blood samples.
MOLECULAR GENETIC MARKERS 395
Table 1. Characterization of the five new swine microsatellite markers derived from BAC clone 145H12
Marker name Forward primer Reverse primer Number of alleles* Allele sizes (bp)* Heterozygosity*
MN40 CACACAGAGCCACTAACTG GGCTATCCAAGAGGACAGAAC4
148±156 0.78
MN41 CTGACTTACCAGGAACTGC CAGTGCTGACCCATAGA 5 134±151 0.56
MN42 GTCTGTGTGGAAGAGGCAGAAG GCATTCTCCATGGGTTTGG 10 119±182 0.47
MN43 CAGCTGTAGAGAGTGAGGG CTGCCTACACACTGCTTGCAC 5 101±114 0.67
MN44 GGAAGAAATGCCCTAAGATGG GGACATTTTCCTCAACTG 7 139±175 0.39
*Determined using DNA isolated from 19 unrelated pigs.
Table 1. IGFBP3 allele frequencies in eight cattle breeds
Breed
Wild-type
frequency
Mutant type
frequency N*
Belgian Blue 0.3 0.7 10
Red Pied 0.3 0.7 9
Red Holstein 0.75 0.25 20
Black Holstein 0.575 0.425 20
Belgian Blue crossbred 0.5 0.5 10
Limousin 0.57 0.43 7
Blonde d'Aquitaine 0.8 0.2 15
Red West Flanders 0.47 0.53 19
*N = number of animals investigated.
ã 1999 International Society for Animal Genetics, Animal Genetics 30, 382±405
References1 J.H. Maciulla et al. (1997) Anim Genet 28, 375.
Correspondence: L Peelman(e-mail: [email protected]).
Linkage assignment of the last unmapped cattleerythrocyte antigen system, EAFS M Kappes1, H C Hines2, M C T Penedo3, J W Keele1
1USDA, ARS, U.S. Meat Animal Research Center, Clay Center, NE68933, U.S.A.; 2Animal Genetics Laboratory, Department of AnimalScience, Ohio State University, Columbus, OH 43210, U.S.A.;3Veterinary Genetics Laboratory, School of Veterinary Medicine,University of California, Davis, CA 95616, U.S.A.
Accepted 5 June 1999
Description: Eleven erythrocyte antigen systems (EA) have tradi-tionally been used for parentage testing in cattle and all but one,EAF, have been assigned to chromosomal regions by genetic linkageinformation. EAF has been reported1 as being linked to EAS and PI2although the statistical support for the linkage was not very strong(Z = 2.87, u = 0.21). Statistical support for linkage was slightlyhigher (lodscore = 3.11) with a multipoint analysis when comparingthe presence or absence of linkage between [PI2-EAS] and EAF. Incontrast, two independent reports2,3 provided convincing evidenceagainst EAF and EAS linkage at recombination frequencies (RF) of0.35 and 0.44, respectively.
Genotyping: We have genotyped the EAF blood group system in 19cow families from the USDA-MARC bovine reference population4.The EAF genotypes were determined by using internationallystandardized, functionally monospecific haemolytic reagents pre-pared by absorption of alloimmune cattle sera according to standardprocedures5. All genotypic information was entered into a relationaldatabase6.
Linkage analysis and chromosomal location: Linkage analysis usingCRI-MAP7 was done as previously reported9. The two-point analysiswas performed against » 1450 previously linked markers. Two-pointlinkages were detected between 15 chromosome 17 markers andEAF (119 informative meioses) with a range in lodscores from 3.40to 15.95. The marker with closest linkage to EAF was BMS2220(Z = 15.50, u = 0.01). Evaluation of 42 co-informative meioses excludeslinkage between EAS and EAF at RF < 0.32, similar to publishedresults2,3. EAS has been mapped to BTA214. The chromosomallocation of EAF on the BTA17 linkage group can be viewed at http://sol.marc.usda.gov/.
References1 Georges M. et al. (1990) Anim Genet 21, 95±105.2 Hines H.C. & Larsen B. (1990) Anim Genet 21, 431±432.3 Grosclaude F. et al. (1990) Anim Genet 21, 427±429.4 Kappes S.M. et al. (1994) Anim Genet 25, 133±140.5 Hines H.C. et al. (1977) J Dairy Sci 60, 1143±1151.6 Keele J.W. et al. (1994) J Computat Biol 1, 65±76.7 Green P. et al. (1990) CRI-MAP, version 2.4, Washington Uni-
versity School of Medicine, St. Louis, MO.8 Kappes S.M. et al. (1997) Genome Res 7, 235±249.
Correspondence: S M Kappes(e-mail: [email protected]).
Molecular markers for the bovine gene encodingacidic seminal fluid protein precursor(spermadhesin 1, SPADH1) map to chromosome26q23J Masabanda1, J Buitkamp1, D Ewald1, R Einspanier2, RFries1
1Lehrstuhl fuÈ r Tierzucht; 2Lehrstuhl fuÈ r Physiologie, TechnischeUniversitaÈt MuÈnchen, 85350 Freising-Weihenstephan, Germany
Accepted 5 June 1999
Source/description: A bovine cDNA clone encoding bovine acidicseminal fluid precursor protein1 (aSFP) has been used to isolatethree genomic clones (ULVGy915.G2031, N0533, G136) by hybridi-zation to a six-genome equivalent bovine YAC library arrayed athigh density [the Resource Centre/Primary Database, Berlin,Germany (RZPD) library no. 915; http://www.rzpd.de].
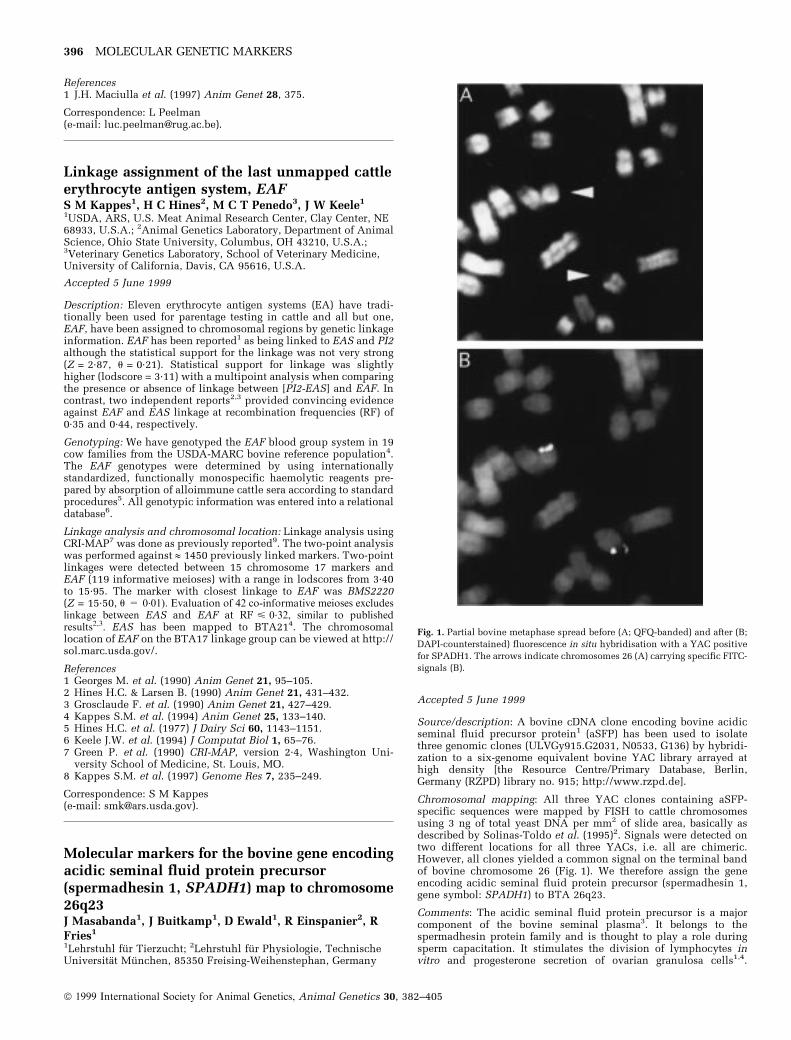
Chromosomal mapping: All three YAC clones containing aSFP-specific sequences were mapped by FISH to cattle chromosomesusing 3 ng of total yeast DNA per mm2 of slide area, basically asdescribed by Solinas-Toldo et al. (1995)2. Signals were detected ontwo different locations for all three YACs, i.e. all are chimeric.However, all clones yielded a common signal on the terminal bandof bovine chromosome 26 (Fig. 1). We therefore assign the geneencoding acidic seminal fluid protein precursor (spermadhesin 1,gene symbol: SPADH1) to BTA 26q23.
Comments: The acidic seminal fluid protein precursor is a majorcomponent of the bovine seminal plasma3. It belongs to thespermadhesin protein family and is thought to play a role duringsperm capacitation. It stimulates the division of lymphocytes invitro and progesterone secretion of ovarian granulosa cells1,4.
Fig. 1. Partial bovine metaphase spread before (A; QFQ-banded) and after (B;
DAPI-counterstained) fluorescence in situ hybridisation with a YAC positive
for SPADH1. The arrows indicate chromosomes 26 (A) carrying specific FITC-
signals (B).
ã 1999 International Society for Animal Genetics, Animal Genetics 30, 382±405
396 MOLECULAR GENETIC MARKERS
Furthermore, acidic seminal fluid protein serves as a lipidantioxidant protecting the spermatozoa from oxidative damage5.Southern and northern blots using the bovine cDNA at lowstringency hybridization conditions produce positive signals incattle and bison but not in goat, sheep, pig or humans1. Therefore,SPADH1 may be specific for the Bovinae lineage.
Acknowledgements: This work was made possible through a grantfrom the EU (BOREALIS project, contract BIO4-CT95-0073).
References1 Wempe F. et al. (1992) Biochem Biophys Res Commun 183, 232±
7.2 Solinas-Toldo S. et al. (1995) Cytogenet Cell Genet 69, 1±6.3 Einspanier R. et al. (1991) Biochem Biophys Res Commun 179,
1006±10.4 Einspanier R. et al. (1992) Mol Androl IV, 325±332.5 SchoÈneck C. et al. (1993) J Reprod Fertil (Abstract Series) 12, 21.
Correspondence: Ruedi Fries (e-mail: [email protected]).
Identification of a novel HaeIII PCR-RFLP in theSLA DQB geneA S Huett, D A J Innes, M J Moore, A E Schnieke, P G ShielsPPL Therapeutics Ltd, Roslin, Edinburgh EH25 9PP, UK
Accepted 5 June 1999
Source/description: The b1 microdomain of the Sus scrofa SLA DQBgene was amplified using published primer sequences1 in anoptimised polymerase chain reaction (PCR). Genotyping wasperformed following RFLP analysis of the POR product withrestriction enzyme HaeIII. For DNA sequence analysis, the PCRproduct was cloned into vector pGem-T (Promega, WI) andsequenced using standard protocols, and an automated sequencer(ABI). The DNA sequence has been submitted to the EMBL DNASequence Database under accession number AFI 13970. This newallele sequence shared 97% identity with alleles SLA-DQB-10 andSLA-DQB*G07
Primers:
SLAgDQB 5a: CGGAATTCCCCGCAGAGGATTTCGTGTACC
SLAgDQB 3b: CCGTCGTGCCTTCCTCTAT
PCR conditions: Reactions were performed in a total volume of30 ml, containing 50 ng genomic DNA, a final concentration of 1 mmMgCI2, 100 mm dNTPs and 50 pM each primer. PCR was performedusing an initial denaturation step of 94°C (5 min) followed by 35cycles of 94°C (15 s), 60°C (30 s) and 72°C (30 s), with a finalextension of 72°C (2 min). Products were digested with HaeIII and
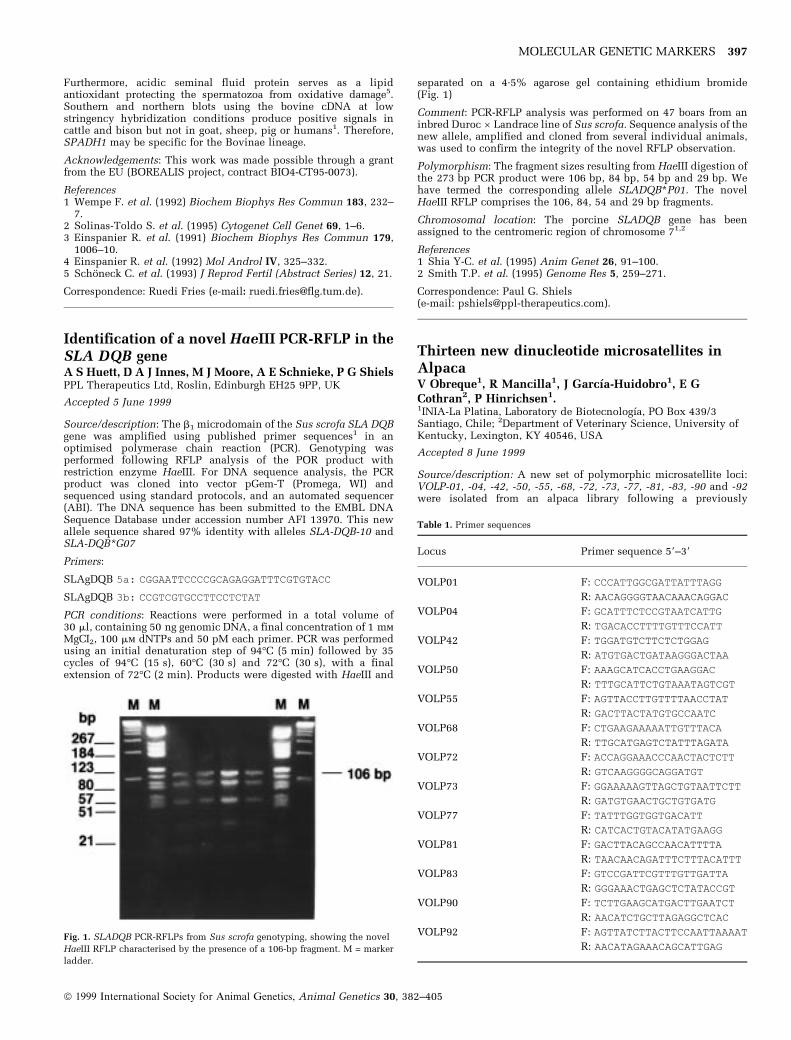
separated on a 4.5% agarose gel containing ethidium bromide(Fig. 1)
Comment: PCR-RFLP analysis was performed on 47 boars from aninbred Duroc ´ Landrace line of Sus scrofa. Sequence analysis of thenew allele, amplified and cloned from several individual animals,was used to confirm the integrity of the novel RFLP observation.
Polymorphism: The fragment sizes resulting from HaeIII digestion ofthe 273 bp PCR product were 106 bp, 84 bp, 54 bp and 29 bp. Wehave termed the corresponding allele SLADQB*P01. The novelHaeIII RFLP comprises the 106, 84, 54 and 29 bp fragments.
Chromosomal location: The porcine SLADQB gene has beenassigned to the centromeric region of chromosome 71,2
References1 Shia Y-C. et al. (1995) Anim Genet 26, 91±100.2 Smith T.P. et al. (1995) Genome Res 5, 259±271.
Correspondence: Paul G. Shiels(e-mail: [email protected]).
Thirteen new dinucleotide microsatellites inAlpacaV Obreque1, R Mancilla1, J GarcõÂa-Huidobro1, E GCothran2, P Hinrichsen1.1INIA-La Platina, Laboratory de BiotecnologõÂa, PO Box 439/3Santiago, Chile; 2Department of Veterinary Science, University ofKentucky, Lexington, KY 40546, USA
Accepted 8 June 1999
Source/description: A new set of polymorphic microsatellite loci:VOLP-01, -04, -42, -50, -55, -68, -72, -73, -77, -81, -83, -90 and -92were isolated from an alpaca library following a previously
MOLECULAR GENETIC MARKERS 397
Fig. 1. SLADQB PCR-RFLPs from Sus scrofa genotyping, showing the novel
HaeIII RFLP characterised by the presence of a 106-bp fragment. M = marker
ladder.
Table 1. Primer sequences
Locus Primer sequence 59±39
VOLP01 F: CCCATTGGCGATTATTTAGG
R: AACAGGGGTAACAAACAGGAC
VOLP04 F: GCATTTCTCCGTAATCATTG
R: TGACACCTTTTGTTTCCATT
VOLP42 F: TGGATGTCTTCTCTGGAG
R: ATGTGACTGATAAGGGACTAA
VOLP50 F: AAAGCATCACCTGAAGGAC
R: TTTGCATTCTGTAAATAGTCGT
VOLP55 F: AGTTACCTTGTTTTAACCTAT
R: GACTTACTATGTGCCAATC
VOLP68 F: CTGAAGAAAAATTGTTTACA
R: TTGCATGAGTCTATTTAGATA
VOLP72 F: ACCAGGAAACCCAACTACTCTT
R: GTCAAGGGGCAGGATGT
VOLP73 F: GGAAAAAGTTAGCTGTAATTCTT
R: GATGTGAACTGCTGTGATG
VOLP77 F: TATTTGGTGGTGACATT
R: CATCACTGTACATATGAAGG
VOLP81 F: GACTTACAGCCAACATTTTA
R: TAACAACAGATTTCTTTACATTT
VOLP83 F: GTCCGATTCGTTTGTTGATTA
R: GGGAAACTGAGCTCTATACCGT
VOLP90 F: TCTTGAAGCATGACTTGAATCT
R: AACATCTGCTTAGAGGCTCAC
VOLP92 F: AGTTATCTTACTTCCAATTAAAAT
R: AACATAGAAACAGCATTGAG
ã 1999 International Society for Animal Genetics, Animal Genetics 30, 382±405

described protocol1. The GenBank accession numbers for thesequences of the library clones of the loci in the above order areAF140767 through AF140779, consecutively.
PCR conditions: All the primers were characterized in a multiplexPCR reaction in 12.5 ml total volume containing 75 mm KCl, 10 mmTris±HCl (pH 8.0), 1.5 mm MgCl2, plus 0.2 mm of each dNTP, 5%DMSO, 0.5 units of Taq polymerase (Boehringer Mannheim GmbH,Mannhein, Germany), 50 ng template DNA and the primers. Theoptimal concentration of each primer pair was determined empiri-cally for each multiplex. Primers and DNA were incubated at 95°Cfor 10 min and then the rest of the cocktail was added. Reaction wasrun by 30 cycles in a PTC-100 thermocycler (MJ Research, Water-town, MA). Each cycle included a denaturation step at 95°C for 30 s,an annealing step at 55°C for 45 s and an extension step at 72°C for 1min. Primer sequences are given in Table 1.
Polymorphism: Variability of the 13 loci was examined in a group of30 alpacas with an ABI 377 Prism Automated DNA Sequencer andGenescan software (Perkin Elmer-ABI, Foster City, CA). The locinames, allele numbers and size ranges, observed heterozygosity andPIC values are shown in Table 2.
Chromosomal location: Not known.
Acknowledgements: This work was supported by a grant fromFundacion FIA (Chile), project no. 016-94. This study is part of aproject of the University of Kentucky Agricultural ExperimentStation and is published as paper 99-14-15.
References1 Obreque V. et al. (1998) Anim Genet 29, 461±2.
Correspondence: P Hinrichsen(e-mail: [email protected]).
Dopamine receptor D2 maps to bovinechromosome 15M R V Amarante1,2, C R Lopes2, J E Womack1
1Department of Veterinary Pathobiology, The Texas VeterinaryMedical Center, Texas A & M University, College Station, TX 77842-4467, USA; 2Departamento de GeneÂtica, Instituto de BiocieÃncias,Universidade Estadual Paulista, Botucatu, SP, CEP 18600-000,Brazil
Accepted 8 June 1999
Source/description: PCR primers were designed to amplify a 329-bpfragment of the 39-untranslated region of the bovine gene encodingthe dopamine receptor D2 (DRD2) protein. The primers weredesigned from the bovine mRNA sequence (Genbank: X51657)using the MAC VECTORTM 4.1.4 sequence analysis software1. Theprotein encoded by this mRNA sequence (Genbank: P20288) has97% amino acid similarity with the human dopamine receptor D2(Genbank: P14416). The DRD2 locus has been mapped to humanchromosome 11 by probing DNA from a panel of somatic cellhybrids2 and assigned to the region 11q22±23 by in situ hybridiza-tion3.
PCR primers:
F: 59-TGC TCA GTT ATC ACA GCA GTG GTC-39
R: 59-TGC GAA AAG GCG AGA GGA AGA G-39
PCR conditions: Amplification was carried out in a 10-ml reaction,10 mm Tris±HCl 1.5 mm MgCl, 50 mm KCl, pH 8.3, 100 mm of eachdNTP, 100 ng genomic DNA and 0.5 U Taq polymerase (Ampli TaqGold, Perkin±Elmer, Foster City, CA). The PCR cycled for 30 s at95°C, 30 s at 60°C and 25 s at 72°C, for 40 cycles, proceeded by 95°Cfor 10 min.
Chromosome assignment: The bovine DRD2 was mapped by syntenyanalysis using a panel of 31 hamster/bovine and mouse/bovinehybrid somatic cell lines described previously4. Bovine DRD2 was100% concordant with the microsatellite BM848 (D15S9) mapped tobovine chromosome 155. (Fig. 1)
Acknowledgements: We are grateful to CAPES (Brazil) grant number2679/95-5 which has supported MRVA, USDA NRI grant 95-37205-2190 and TAES Project 6718 to JEW.
References1 Chio C.L. et al. (1990) Nature 343,(6255) 266±9.2 Grandy D.K. et al. (1989) Proc Natl Acad Sci USA 86, 9762±6.3 Grandy D.K. et al. (1989) Am J Hum Genet 45, 778±85.4 Womack J.E. & Moll Y.D. (1986) J Hered 77, 2±7.5 Bishop et al. (1994) Genetics 136, 619±39.
Correspondence: M R V Amarante (e-mail: [email protected]).
Table 2. Summary data for loci and primers
Locus Repeat
Alleles
(n)
Size
range
(bp)
Observed
hetero-
zygosity PIC
VOLP01 (TG)20 5 240±256 0.235 0.384
VOLP04 (TG)19 13 226±258 0.914 0.863
VOLP42 (TG)14 4 185±193 0.680 0.448
VOLP50 (TA)6CATGT
(TA)3T(GA)2TA
3 178±204 0.474 0.389
VOLP55 (TA)3(TG)14 9 159±189 0.771 0.755
VOLP68 (CA)11 5 136±146 0.579 0.497
VOLP72 (CA)14 11 150±190 0.538 0.791
VOLP73 (TG)8 4 190±200 0.676 0.456
VOLP77 (TG)19 11 144±168 0.667 0.786
VOLP81 (TG)13 5 205±213 0.632 0.456
VOLP83 (CA)16 4 183±189 0.148 0.454
VOLP90 (CA)4TA(CA)3AA(CA)4TA
(CA)5(TA)2
CA
3 153±171 0.256 0.249
VOLP92 (CA)17(GT)3 8 194±218 0.813 0.686
Fig. 1. Lanes 1 and 9: 100 bp ladder (Boehringer Mannheim GmBH,
Mannheim, Germany). Lane 2: PCR product in bovine (329 bp; bovine DRD2
gene is present). Lane 3: PCR product in mouse. Lane 4: PCR products in
mouse/bovine somatic cell lines (329 bp; bovine DRD2 gene is present). Lane
5: PCR products in mouse/bovine somatic cell lines bands (bovine DRD2
gene is absent). Lane 6: PCR product in hamster. Lane 7: PCR products in
hamster/bovine somatic cell lines (329 bp; bovine DRD2 gene is present).
Lane 8: PCR products in hamster/bovine somatic cell lines (bovine DRD2 gene
is absent).
ã 1999 International Society for Animal Genetics, Animal Genetics 30, 382±405
398 MOLECULAR GENETIC MARKERS
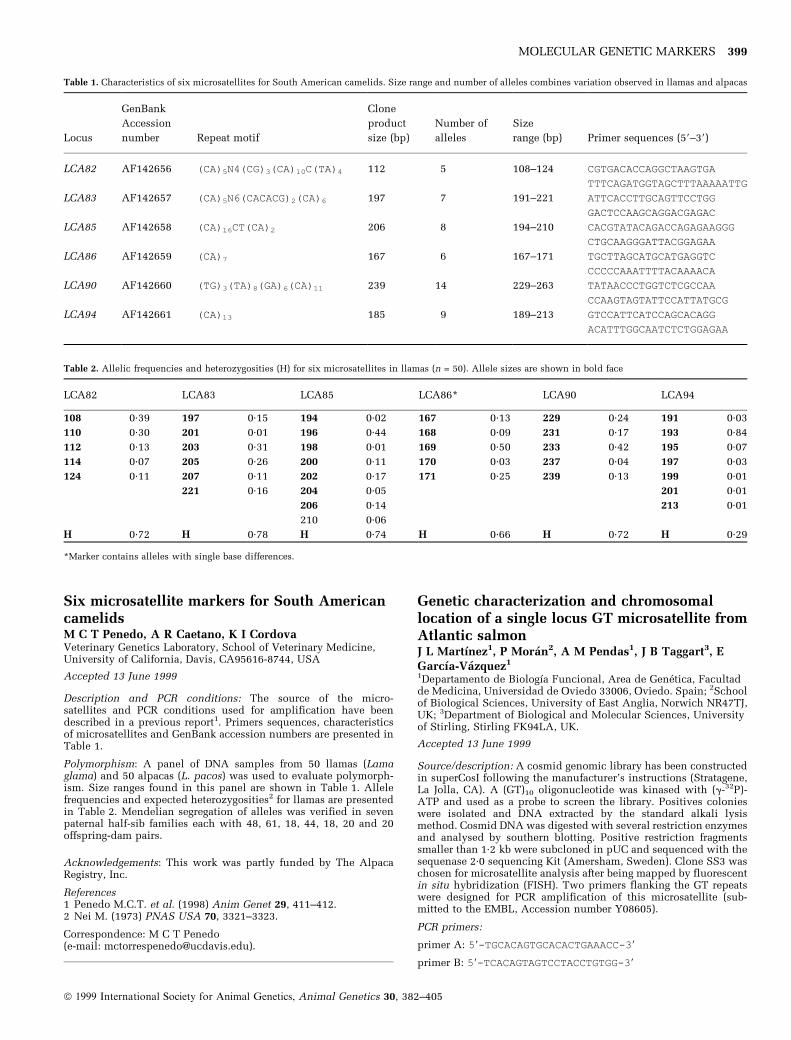
Six microsatellite markers for South AmericancamelidsM C T Penedo, A R Caetano, K I CordovaVeterinary Genetics Laboratory, School of Veterinary Medicine,University of California, Davis, CA95616-8744, USA
Accepted 13 June 1999
Description and PCR conditions: The source of the micro-satellites and PCR conditions used for amplification have beendescribed in a previous report1. Primers sequences, characteristicsof microsatellites and GenBank accession numbers are presented inTable 1.
Polymorphism: A panel of DNA samples from 50 llamas (Lamaglama) and 50 alpacas (L. pacos) was used to evaluate polymorph-ism. Size ranges found in this panel are shown in Table 1. Allelefrequencies and expected heterozygosities2 for llamas are presentedin Table 2. Mendelian segregation of alleles was verified in sevenpaternal half-sib families each with 48, 61, 18, 44, 18, 20 and 20offspring-dam pairs.
Acknowledgements: This work was partly funded by The AlpacaRegistry, Inc.
References1 Penedo M.C.T. et al. (1998) Anim Genet 29, 411±412.2 Nei M. (1973) PNAS USA 70, 3321±3323.
Correspondence: M C T Penedo(e-mail: [email protected]).
Genetic characterization and chromosomallocation of a single locus GT microsatellite fromAtlantic salmonJ L MartõÂnez1, P MoraÂn2, A M Pendas1, J B Taggart3, EGarcõÂa-VaÂzquez1
1Departamento de BiologõÂa Funcional, Area de GeneÂtica, Facultadde Medicina, Universidad de Oviedo 33006, Oviedo. Spain; 2Schoolof Biological Sciences, University of East Anglia, Norwich NR47TJ,UK; 3Department of Biological and Molecular Sciences, Universityof Stirling, Stirling FK94LA, UK.
Accepted 13 June 1999
Source/description: A cosmid genomic library has been constructedin superCosI following the manufacturer's instructions (Stratagene,La Jolla, CA). A (GT)10 oligonucleotide was kinased with (g-32P)-ATP and used as a probe to screen the library. Positives colonieswere isolated and DNA extracted by the standard alkali lysismethod. Cosmid DNA was digested with several restriction enzymesand analysed by southern blotting. Positive restriction fragmentssmaller than 1.2 kb were subcloned in pUC and sequenced with thesequenase 2.0 sequencing Kit (Amersham, Sweden). Clone SS3 waschosen for microsatellite analysis after being mapped by fluorescentin situ hybridization (FISH). Two primers flanking the GT repeatswere designed for PCR amplification of this microsatellite (sub-mitted to the EMBL, Accession number Y08605).
PCR primers:
primer A: 59-TGCACAGTGCACACTGAAACC-39
primer B: 59-TCACAGTAGTCCTACCTGTGG-39
MOLECULAR GENETIC MARKERS 399
Table 1. Characteristics of six microsatellites for South American camelids. Size range and number of alleles combines variation observed in llamas and alpacas
Locus
GenBank
Accession
number Repeat motif
Clone
product
size (bp)
Number of
alleles
Size
range (bp) Primer sequences (59±39)
LCA82 AF142656 (CA)5N4(CG)3(CA)10C(TA)4 112 5 108±124 CGTGACACCAGGCTAAGTGA
TTTCAGATGGTAGCTTTAAAAATTG
LCA83 AF142657 (CA)5N6(CACACG)2(CA)6 197 7 191±221 ATTCACCTTGCAGTTCCTGG
GACTCCAAGCAGGACGAGAC
LCA85 AF142658 (CA)16CT(CA)2 206 8 194±210 CACGTATACAGACCAGAGAAGGG
CTGCAAGGGATTACGGAGAA
LCA86 AF142659 (CA)7 167 6 167±171 TGCTTAGCATGCATGAGGTC
CCCCCAAATTTTACAAAACA
LCA90 AF142660 (TG)3(TA)8(GA)6(CA)11 239 14 229±263 TATAACCCTGGTCTCGCCAA
CCAAGTAGTATTCCATTATGCG
LCA94 AF142661 (CA)13 185 9 189±213 GTCCATTCATCCAGCACAGG
ACATTTGGCAATCTCTGGAGAA
Table 2. Allelic frequencies and heterozygosities (H) for six microsatellites in llamas (n = 50). Allele sizes are shown in bold face
LCA82 LCA83 LCA85 LCA86* LCA90 LCA94
108 0.39 197 0.15 194 0.02 167 0.13 229 0.24 191 0.03
110 0.30 201 0.01 196 0.44 168 0.09 231 0.17 193 0.84
112 0.13 203 0.31 198 0.01 169 0.50 233 0.42 195 0.07
114 0.07 205 0.26 200 0.11 170 0.03 237 0.04 197 0.03
124 0.11 207 0.11 202 0.17 171 0.25 239 0.13 199 0.01
221 0.16 204 0.05 201 0.01
206 0.14 213 0.01
210 0.06
H 0.72 H 0.78 H 0.74 H 0.66 H 0.72 H 0.29
*Marker contains alleles with single base differences.
ã 1999 International Society for Animal Genetics, Animal Genetics 30, 382±405

PCR conditions: One of the primers was end-labelled with (g-33P)ATP (Amersham) with T4 polynucleotide kinase (Pharmacia,Sweden). Amplifications were carried out using the GeneAmpPCR system 2400 from Perkin±Elmer Cetus, (Foster City, CA)samples containing » 50 ng Atlantic salmon DNA, 10 mm Tris±HClpH 8.8, 1.5 mm MgCl2, 50 mm KCl, 0.1% Triton X-100, 10 pmolunlabelled primer, 1 pmol labelled primer 1 U Dynazyme II DNAPolymerase (Finnzymes Oy) and 250 mm dNTP in a final volume of20 ml. PCRs were performed with an initial denaturing step (5 min at95°C) followed by 35 cycles consisting of denaturation at 95°C (20 s),annealing at 60°C (20 s) and extension at 72°C (20 s). The final extensionwas at 72°C (5 min).
Allele size and frequency: Thirty-one wild adults caught in theSpanish river Esva were analysed for variation at this locus(Table 1). To establish the allele sizes, the PCR products were runon denaturing acrylamide sequencing gels together with pUCsequence reactions.
Mendelian inheritance: Segregation analysis of the SS3 microsatel-lite performed in two monoparental families showed a codominantsingle locus behaviour.
Chromosomal location: Physical location of the cosmid containingthe SS3 microsatellite was performed in metaphases obtained fromwhole blood cultures of Atlantic salmon. Fluorescent in situhibridization was performed according to PendaÂs et al. (1993)1
and images were obtained using a Zeiss axioscope epifluorescent
microscope equipped with a CCD camera (Photometrics). After FISHanalysis, a single and robust fluorescent signal was observed in 85%of the cells analysed. The fluorescent signals were located in themiddle of an acrocentric chromosome pair (Fig. 1).
Acknowledgements: This work has been supported by the SpanishDGICYT (PB 94-1327) and by a collaborative agreement between theUniversidad de Oviedo and the Consejeria de Agricultura delPrincipado de Asturias.
References1 Pendas A.M. et al. (1993) Cytogenet Cell Genet 63, 128±30.
Correspondence: J L MartõÂnez.
Identification of five point mutations, includingan AluI RFLP, in the bovine butyrophilin geneY Husaini1,2, R J Wilkins3, H W Davey1
1Dairy Science Group, AgResearch, Ruakura, Private Bag 3123,Hamilton, New Zealand; 2Department of Cell & Molecular Biology,University of Technology, Sydney, Australia; 3Department ofBiological Sciences, University of Waikato, Hamilton, New Zealand.
Accepted 13 June 1999
Source/description: We have identified five polymorphisms in thebovine butyrophilin locus by comparing the DNA sequences derivedfrom two bovine genomic DNA libraries. Our first sequence `A'(GenBank AF005497) is compiled from overlapping clones isolatedfrom a library that we made using Holstein Friesian DNA1. Oursecond sequence `B' (GenBank AF037402) is from a Stratagenelibrary (Cat no. 945701, unknown breed) and contains 59-flankingsequence to ±3.6 kb. This latter sequence contains an additional1.7 kb of 59 flanking sequence which has not been previouslypublished.
Two of the nucleotide differences between sequences A and B are inthe coding region and result in amino acid substitutions. Nucleotide105 is T or A, and amino acid 16 is therefore Phe or Tyr,respectively; and nucleotide 2482 is A or T resulting in either aGlu or an Asp. Two further nucleotide differences are in introns, atpositions 1902 (G/T) and 1970 (G/A), and one is in the 59-flankingDNA at ±1500 (T/C). The G/T transversion at nucleotide 1902 inintron 2 creates an AluI site (Table 1).
PCR and digestion conditions: In order to determine the frequency ofthe RFLP at the AluI site, we designed two oligonucleotide primers,59-GATCCCTCATGCCTGGAATATG-39 and 59-GTTGCCCTTGACCTT-
Table 1. Allele sizes and frequency of the SS3 microsatellite
Allele (bp) Frequency
294 0.032
296 0.209
298 0.500
306 0.032
314 0.193
316 0.048
318 0.048
320 0.016
324 0.096
326 0.016
330 0.016
332 0.016
336 0.016
Fig. 1. Chromosomal location of the Atlantic salmon SS3 microsatellite locus
(arrows).
Table 1. Polymorphisms in the bovine butyrophilin gene sequence. Fre-
quency refers to the frequency of the allele containing the restriction
endonuclease site. References are (1) this paper and (2) Taylor et al. 1996
Nucleotide
position
Nucleotide
substitution
Amino acid
substitution Frequency Reference
±1500 T®C ± ± (1)
105 T®A Phe®Tyr ± (1)
1902 G®T ± 0.44 (1)
1970 G®A ± ± (1)
2482 A®T Gln®Asp ± (1)
4914 C®G ± ± (2)
4929 C®T ± ± (2)
5060 A®G Lys®Arg 0.125 (2)
0.15 (1)
5101 G®A Val®Iso ± (2)
5214 A®C Leu®Pro ± (2)
5060 C®T ± ± (2)
ã 1999 International Society for Animal Genetics, Animal Genetics 30, 382±405
400 MOLECULAR GENETIC MARKERS

TAGTGGA-39, that amplified a 568-bp product from nucleotide1639±2206 of the bovine BTN gene. PCR amplification in a totalvolume of 15 ml was performed on 100 ng of genomic DNA in 10 mmTris±HCl pH 8.3, 50 mm KCl, 3.0 mm MgCl2, 200 mm of each dNTP,1 mm of each primer and 1.5 U Taq DNA polymerase, using aPerkin±Elmer Cetus 9600 thermocycler (Emeryville, CA). Thereaction conditions involved an initial 2 min denaturation at 95°C,then 30 cycles of 30 s at 95°C, 15 s at 60°C, and 45 s at 72°C. Theproduct was digested with AluI and run on a 2.5% (w/v) agarose gel
in 1´ TAE buffer. The RFLP was identified as either undigestedDNA of 568 bp, or AluI digested fragments of 263 and 305 bp(Fig. 1A).
Allele frequency: The allelic frequency of the AluI RFLP wasdetermined to be 0.44, using DNA extracted from the blood of 55unrelated Holstein Friesian cows (Table 1). We also determined thefrequency of a HaeIII RFLP (Fig. 1B) previously identified by Tayloret al. (1996)2, using the PCR method they described. While neitherof the two alleles that we sequenced contained this HaeIII site atnucleotide 5060, the frequency in the 55 cows that we sampled was0.15 (Table 1).
Chromosome location: The gene (BTN) is linked to the majorhistocompatibility complex (MHC) in bovine (chromosome 23) andhuman (chromosome 6), and may have arisen by shuffling of exonsbetween two ancestral families. In mice, a translocation involvingchromosomes 17 and 13, has resulted in the association of btn with asyntenic group of MHC related genes on chromosome 13, separatefrom the MHC on chromosome 172,3.
Comment: Perhaps the most important polymorphisms we haveidentified are those which result in amino acid substitutions.Unfortunately, neither of these results in a RFLP. However, both areamenable to analysis by using amplification created restriction sites(ACRSs)4. In the case of the nucleotide substitution at residue 105, areverse primer terminating at the 39 end with 59-GATCATG-39, willcreate a BspH1 site in sequence A but not B. In the case of residue2482, a reverse primer with the 39 sequence 59-TGTAC-39 will createa BsrG1 site in sequence B but not A (altered nucleotides are boldand italic). We are currently examining the frequency of theseprotein polymorphisms using this method.
Acknowledgements: This work was supported by the New ZealandFoundation for Research Science and Technology.
References1 Davey H.W. et al. (1997) Gene 199, 57±62.2 Taylor C. et al. (1996) Anim Genet 27, 183±185.3 Ashwell M.S. et al. (1996) Anim Genet 27, 171±173.4 Lien S. et al. (1992) Anim Genet 23, 333±338.
Correspondence: H W Davey (e-mail: [email protected]).
Evaluation of two cDNA-derived bovine tandemrepeat sequences, BMON112 and BMON114
W C Warren1, T Allison1, N Tao1, S M Kappes2
1Monsanto Company, 700 Chesterfield Parkway, St Louis, MO63198, USA; 2USDA-ARS, US Meat Animal Research Center, POBox 166, Clay Center, NE 68933, USA
Accepted 18 June 1999
Source/description: Various bovine tissues were used as a source ofmRNA to generate cDNA libraries according to the manufacturersmethods (Gibco-BRL, Gaithersburg, MD. Expressed sequence tags(EST) from each library were 59 end sequenced at random using anABI 377 DNA sequencer (Applied Biosystems, Division of Perkin±Elmer, Emeryville, CA) according to standard protocols. Tandemrepeat sequences within an internal bovine EST database (59sequences) were identified using the BLAST method1. Thefrequency of observed dinucleotide repeats were low in this ESTdatabase (< 1%).
Primer sequences:
BMON112: 59 GGATTAATCTGATGCACATGGA 39
59 TTTGTCTTGTGCTGACAAACC 39
BMON114: 59 CTTCTTGCAGCCCATGAGA 39
59 AAACACACGAAGCAATGACCTA 39
PCR conditions: Tandem repeat sequences were amplified in a 20-mlreaction volume under the following conditions: 50 ng of bovinegenomic DNA, 0.2 mm dNTP's, 10 mm Tris±HCl, 1.5 mm MgCl2,50 mm KCl, pH 8.3, 10 pmole of each primer and 1 U of Taq DNA
MOLECULAR GENETIC MARKERS 401
Fig. 1. Butyrophilin genotyping using RFLP-PCR. Each agarose gel contains
all three genotypes. (A) AluI digestion of PCR amplified genomic DNA from
nucleotide 1639±2206 of the butyrophilin gene. (B) HaeIII digestion of PCR
amplified DNA from nucleotide 4844±5344 of the butyrophilin gene. The
DNA marker is the 1 kb ladder (BRL).
ã 1999 International Society for Animal Genetics, Animal Genetics 30, 382±405

polymerase (Boehringer Mannheim, Indianapolis, IN). Thermocy-cler conditions were an initial denaturation of 94°´ for 5 min,followed by 94°C for 30 s, 58°´ for 30 s, 72°´ for 30 s, ending at 72°´for 10 min, for a total of 35 cycles.
Polymorphism: Tandem repeat sequence amplification productswere analyzed by denaturing electrophoresis on 5% polyacrylamidegels followed by autoradiography. BMON114 exhibited polymorph-ism whereas BMON112 did not in the parents of the MARCreference family panel2. Allele size, heterozygosity and othercharacteristics are found in Table 1. BMON112 and BMON114contained GT repeats of 16 and 14, respectively.
Chromosomal location: BMON114 (306 informative meioses) mapsto BTA19 by linkage analysis (Cri-map V2.4) on the MARC referencefamily panel3. Two-point linkage analysis indicated that BMON114was linked to 26 markers on BTA19 with LOD scores ranging from3.33 to 48.49. Multipoint linkage analysis was used to determine thebest order and BMON114 was placed between BMS1069 and IDVGA-44 (5 cm from BMS1069 and 1 cm from IDVGA-44; http://sol.mar-c.usda.gov).
References1 Altschul S.F. et al. (1990) J Mol Biol 215, 403±410.2 Kappes S.M. et al. (1997) Genome Res 7, 235±249.3 Green P. et al. (1990) CRI-MAP, version 2.4, Washington Uni-
versity of School of Medicine, St. Louis, MO.
Correspondence: W C Warren(e-mail: [email protected]).
A Bsp143I PCR-RFLP in exon 3 of the ovinearomatase gene (CYP19)J Vanselow1, A Zsolnai2, L FeÂsuÈ s2, P Schmidt1, MSchwerin1
1Research Institute for the Biology of Farm Animals, Wilhelm-Stahl-Allee 2, 18196 Dummerstorf, Germany; 2Research Institute forAnimal Breeding and Nutrition, 2053 Herceghalom, Hungary
Accepted 26 June 1999
Source/description: CYP19 encodes the key enzyme of estrogen
biosynthesis aromatase cytochrome P4501,2. It was first shown in anadult human female that aromatase deficiency is associated withsexual infantilism3. Recent experimental approaches in CYP19knockout mice have demonstrated phenotypic and behaviouralchanges which severely affected reproduction in female and maleanimals4,5. Due to these findings and the important role of aromatasefor steroid hormone metabolism we consider CYP19 to be acandidate gene affecting reproductive performance. Primers havebeen derived from the coding region of the gene (EMBL accessionno. AJ012153). Amplicons were generated from different sheepgenomic DNA samples and screened for polymorphic sites by directsequencing (ABI 310C, Perkin±Elmer, Weiterstadt, Germany). Incodon 69 which is located in exon 3 a silent C/T transition wasidentified in several animals. As this polymorphism is situatedwithin the recognition site of the restriction enzyme Bsp143I(isoschizomer of Sau3AI), the enzyme was used as a diagnostictool for further investigations (Fig. .1).
Chromosomal location: The ovine CYP19 gene has been mapped tobands q24±q31 of chromosome 76,7.
Primer sequences:
Primer 1: 59-CCAGCTACTTTCTGGGAATT-39 (nt 181±200 AJ012153)
Primer 2: 59-AATAAGGGTTTCCTCTCCACA-39(nt 320±300 AJ012153)
PCR/RFLP assays: PCR-amplifications were performed in 25 ml ofreaction mixture containing the following: 20±100 mg genomicDNA; primers, 500 nm each; dNTPs, 200 mm each; 10 mm Tris±HCl, pH 9.0; 50 mm KCl; 1.5 mm MgCl2; Triton X-100, 0.1%; BSA,0.2 mg/ml; Taq DNA polymerase (Appligene/ONCOR, Heidelberg,Germany), 0.25 units.
The first cycle was at 94°C for 2 min. This was followed by 35 cyclesof 94°C for 15 s, 55°C for 30 s and 70°C for 2 min. The last PCR stepwas at 70°C for 5 min.
The PCR product (10 ml) was subsequently added to 10 ml of thefollowing restriction enzyme master mix and incubated for 14 h at37°C: 5 U Bsp143I per assay (MBI Fermentas, St Leon-Rot,Germany); 33 mm Tris-acetate, pH 7.9; K-acetate, 66 mm; Mg-acetate,10 mm; Triton X-100, 0.02%; BSA, 0.1 mg/ml.
Restriction fragments were subsequently analysed on a 4% agarose
Table 1. Characteristics of BMON112 and BMON114
Locus marker Annotation Allele (size range) % Heterozygosity Allele number Accession number
BMON112 Zn finger protein 112 0 1 AF133050
BMON114 Unknown 104±128 75 7 AF133049
Fig. 1. The figure shows 13 selected members of family 1 analysed for the Bsp143I RFLP. Undigested PCR products have a length of 140 bp (allele B) and, in the
case of allele A, are cut into two fragments of 82 bp and 58 bp. Open figures = genotype AA, closed figures = genotype BB, mixed figures = genotype AB.
ã 1999 International Society for Animal Genetics, Animal Genetics 30, 382±405
402 MOLECULAR GENETIC MARKERS

gel stained with ethidium bromide (Fig. 1).
Polymorphisms: The allele frequency of the polymorphism wasestimated by genotyping 38 randomly selected sheep of theHungarian Merino breed. Four other breeds were also investigated,each represented by five animals (Table 1).
Mendelian inheritance: Codominant Mendelian inheritance wasobserved in two families of the Hungarian Merino breed with 42(family 1, Fig. 1) and eight members (family 2).
Acknowledgements: We thank A. Garve and P. Steffenhagen forexcellent technical assistance. This work was supported by theGerman and Hungarian Departments for Agriculture with a bilateralscientific exchange programme (17/94).
References1 Simpson E.R. et al. (1994) Endocrine Rev 15, 342±55.2 Vanselow J. & FuÈ rbass, R. (1995) Gene 154, 281±86.3 Ito Y. et al. (1993) Proc Natl Acad Sci USA 90, 11673±77.4 Fisher C.R. et al. (1998) Proc. Natl. Acad. Sci. USA 95, 6965±70.5 Honda S. et al. (1998) Biochem. Biophys. Res. Commun. 252, 445±
49.6 Payen E. et al. (1995) Anim. Genet. 26, 331±33.7 Goldammer T. et al. (1999) Cytogenet. Cell Genet (in press).
Correspondence: J Vanselow(e-mail: [email protected]).
Assignment of a homologue of murine wingless-type MMTV integration site family member 3a(WNT3A) to chicken chromosome 2S Hughes1, T Crnogorac-Jurcevic2, J Sillibourne3, NBumstead1
1Institute for Animal Health, Compton Laboratory, Compton,Newbury RG20 7NN, UK; 2ICRF Molecular Oncology Unit,Department of Cancer Medicine, Imperial College School ofMedicine, Hammersmith Hospital, Du Cane Rd., London W12 ONN,UK; 3Wessex Regional Genetics Laboratory, Salisbury DistrictHospital, Salisbury SP2 8BJ, UK
Accepted 26 June 1999
Source/description: A 317-bp PCR product encoding a portion of achicken gene homologous to murine Wnt3a was generated fromchicken genomic DNA using degenerate WNT3A primers1 derivedfrom the murine sequence (EMBL accession number X56842). Thegenomic DNA sequence obtained showed 77% identity over 317-bpto murine mRNA for Wnt3a.
Primer sequences: Primers were derived from the chicken sequence.
Primer 1: 59 TCGGGCAGCTGTGAAGTGAAGA 39
Primer 2: 59 AGATCCTGTCACGAGTCCCGA 39
PCR conditions: The reaction mixture comprised per reaction:primers at 5 mm, dNTPs each at 1 mm, 1.25 U Taq polymerase,200 ng genomic DNA, 1´ PCR reaction buffer (Promega, Madison,WI), 1.5 mm MgCl2. The PCR profile was: denaturing: 94°C for 60 s;
MOLECULAR GENETIC MARKERS 403
Table 1. Allele frequencies in different sheep breeds
Breeds
Numbers of
animals
Frequencies
of allele A
Frequencies
of allele B
Hungarian Merino 38 0.74 0.26
Awassi 5 0.6 0.4
Lacaune 5 1.0 0
Tsigaja 5 0.6 0.4
Brit. Milksheep 5 0.6 0.4
Fig. 1. (a) The SSCP patterns observed in offspring 1±12 (left to right) from the
MDV mapping reference population are shown. The SSCP patterns for the
(61 ´ 72) and 72 parents correspond to the patterns seen in offspring 12 and 2,
respectively. (b) Linkage map of chicken chromosome 2 in the MDV mapping
reference population (distances in cm).
ã 1999 International Society for Animal Genetics, Animal Genetics 30, 382±405

annealing: 58°C for 60 s; extension: 72°C for 2 min. The reactionwas carried out for 30 cycles with a final extension at 72°Cfor 10 min using a Hybaid Omnigene Thermo-Cycler (Ashford,Middlesex, UK).
SSCP (single strand conformational polymorphism) analysis: Inter-nal primers designed from the chicken sequence gave a 265-bp PCRproduct from genomic DNA and its identity was confirmed bysequencing (EMBL accession number AF109144). The genomic PCRproduct was digested at 37°C using a combination of HaeIII andAluI, which gave products of 139 bp and 118 bp in size and anotherunder 10 bp, corresponding to cleavage sites identifiable from thesequence. The digested product was ethanol precipitated, resus-pended in loading buffer (98% formamide, 2% EDTA) anddenatured at 90°C for 5 min. Samples were placed on ice prior toanalysis on a non-denaturing polyacrylamide SSCP gel (0.5´monomer solution of SEQUAGEL MD, National Diagnostics,Atlanta, GA). The SSCP gel was run for 5 h at 8 W at roomtemperature (25°C), the gel was then silver stained using standardconditions2.
Polymorphism: Polymorphisms were observed between lines 61 and72
3. The segregation of these bands was analysed in the ComptonMarek's disease virus (MDV) mapping reference population3
(Fig. 1a). From sequence analysis of two of the progeny, represent-ing the two different alleles, the line 61 allele shows a change of C toG at position 141 and of C to T at position 191 when compared to theline 72 allele.
Mendelian inheritance: Autosomal codominance of the singlestranded conformational polymorphism was observed in F1 andbackcross matings between the Compton strains of chicken lines 61
and 72.
Chromosomal location: The segregation pattern of the line 61 SSCPin the 47 (61 ´ 72) ´ 72 backcross birds of the MDV mappingreference population indicated that WNT3A is closely linked toADL0228 (two recombinants in 47 progeny, LOD 10.6) andMCW0205 (one recombinant in 47 progeny, LOD 12.0) which lieon chicken chromosome 2 (Fig. 1b). The corresponding gene Wnt3ais located on mouse chromosome 114.
References1 Gavin B.J. et al. (1990) Genes Dev 4 (12B), 2319±2332.2 Sambrook J. et al. (1989) Molecular Cloning: A Laboratory Manual.
Cold Spring Harbor Laboratory Press, Cold Spring Harbor, NewYork.
3 Bumstead N. (1998) Avian Pathol 27, S78±S81.4 Nusse R. et al. (1991) Cell 64, 231±2.
Correspondence: S Hughes.
Mapping of the gene encoding a chickenhomologue of the mammalian chemokineSCYA4S Hughes, N BumsteadInstitute for Animal Health, Compton Laboratory, Compton,Newbury, Berkshire, RG20 7NN, UK
Accepted 26 June 1999
Source/Description: A cDNA (EMBL accession number AJ243034)encoding a chicken homologue of SCYA4, the gene encoding thecysteine-cysteine chemokine MIP-1b, was isolated from a cDNAlibrary prepared from the transformed chicken macrophage cell lineHD111. The coding sequence shares 68% identity to the humancoding sequence (EMBL accession number M25316).
Primer sequences: Primer sequences were derived from the chickencDNA sequence.
Primer 1: 59 ATGAAGGTCTCTGTGGCTGCCCT 39
Primer 2: 59 TCAGTTCAGTTCCATCTTGTTCAT 39
PCR conditions: The reaction mixture comprised per reaction:primers at 5 mm, dNTPs each at 1 mm, 1.25 units of Taq polymerase,
200 ng template genomic DNA 1´ PCR reaction buffer (Promega,Madison, WI), 1.5 mm MgCl2. The PCR profile was: denaturing,94 °C for 60 s, annealing, 60 °C for 60 s, extension, 72 °C for 2 min.The reaction was carried out for 30 cycles with a final extension at72 °C for 10 min using a Hybaid Omnigene Thermo-Cycler (Ashford,Middlesex, UK).
SSCP (single strand conformational polymorphism) analysis: A 753-bp PCR product was amplified from genomic DNA and its identitywas confirmed by sequencing (EMBL accession number AF146730).The genomic PCR product was digested at 37°C using a combinationof RsaI, HaeIII and AluI which produced a series of bands of 252-bp,236-bp and 116-bp in size with several bands under 80-bpcorresponding to cleavage sites identifiable from the sequence.The digested product was ethanol precipitated, resuspended inloading buffer (98% formamide, 2% EDTA) and denatured at 90 °Cfor 5 min. Samples were placed on ice prior to analysis on a non-denaturing polyacrylamide SSCP gel (0.5´ monomer solution ofSEQUAGEL MD, National Diagnostics, Atlanta, GA). The SSCP gelwas run for 5 h at 8 watts at room temperature (25 °C), the gel wasthen silver stained using standard conditions2.
Polymorphism: Polymorphisms were observed for these bandsbetween lines N and 15I. The segregation of these bands wasanalysed in the Compton mapping reference population3 (Fig. 1).
Mendelian inheritance: Autosomal codominance of the singlestranded conformational polymorphism was observed in F1 andbackcross matings between the Compton strains of chicken lines Nand 15I.
Chromosomal location: The segregation pattern of the Line N SSCPin the 56 (N ´ 15I) ´ 15I backcross birds of the Compton referencepopulation3 indicated that SCYA4 is closely linked to COM81 (6recombinants in 56 progeny, LOD 8.1). The current linkage mapsprovide good coverage of the chicken macrochromosomes. Thus asSCYA4 and COM81 do not exhibit linkage to any of the othermarkers scored in the Compton reference population it is likely thatthese two loci map to a microchromosome, designated linkage groupC38. The corresponding gene SCYA4 is located on human chromo-some 17 q11-q21, and its mouse orthologue (Scya4) on chromosome11.
References1 O'Regan M.N. et al. (1999) Immunogenetics 49, 68±71.2 Sambrook J. et al. (1989) Molecular Cloning: A Laboratory Manual.
Cold Spring Harbor Laboratory Press.3 Bumstead N. & Palyga J. (1992) Genomics 13, 690±7.
Correspondence: Simon Hughes.
Fig. 1. The SSCP patterns observed in offspring 6±21 (left to right)
from the Compton mapping population are shown. The patterns
observed in parental birds, line 15I (male) and line N ´ line 15I F1
(female) are identical to those seen in offspring 8 and 9, respectively.
ã 1999 International Society for Animal Genetics, Animal Genetics 30, 382±405
404 MOLECULAR GENETIC MARKERS
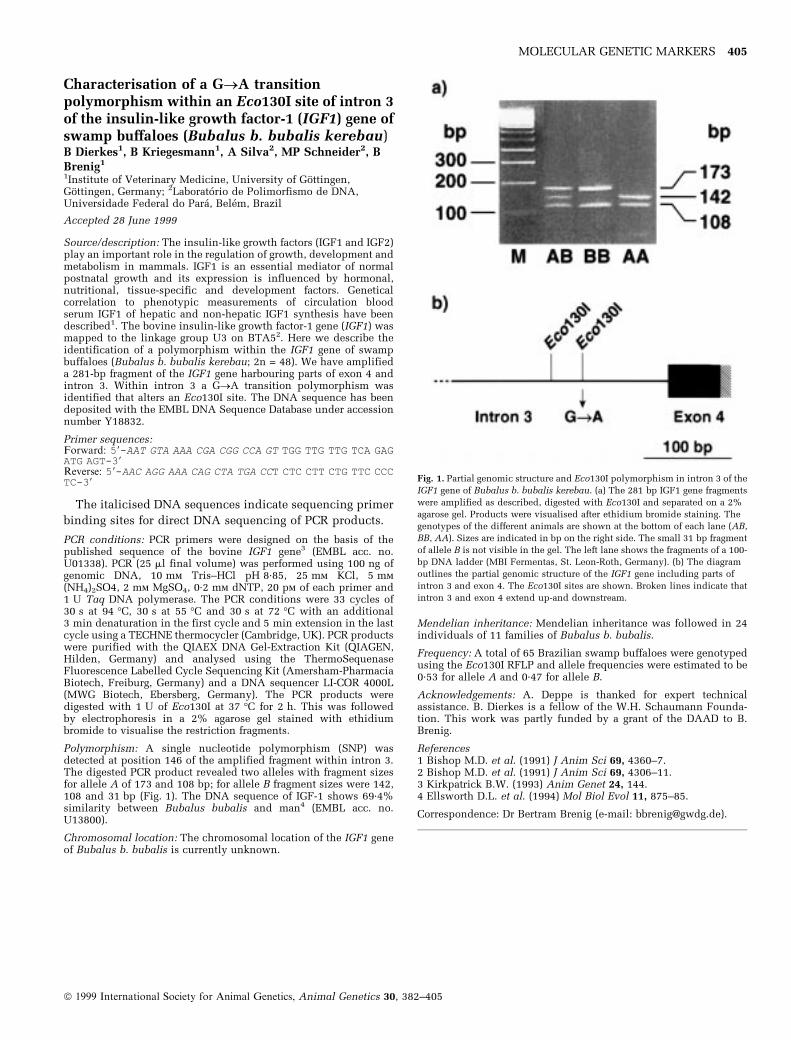
Characterisation of a G®A transitionpolymorphism within an Eco130I site of intron 3of the insulin-like growth factor-1 (IGF1) gene ofswamp buffaloes (Bubalus b. bubalis kerebau)B Dierkes1, B Kriegesmann1, A Silva2, MP Schneider2, BBrenig1
1Institute of Veterinary Medicine, University of GoÈttingen,GoÈttingen, Germany; 2LaboratoÂrio de Polimorfismo de DNA,Universidade Federal do ParaÂ, BeleÂm, Brazil
Accepted 28 June 1999
Source/description: The insulin-like growth factors (IGF1 and IGF2)play an important role in the regulation of growth, development andmetabolism in mammals. IGF1 is an essential mediator of normalpostnatal growth and its expression is influenced by hormonal,nutritional, tissue-specific and development factors. Geneticalcorrelation to phenotypic measurements of circulation bloodserum IGF1 of hepatic and non-hepatic IGF1 synthesis have beendescribed1. The bovine insulin-like growth factor-1 gene (IGF1) wasmapped to the linkage group U3 on BTA52. Here we describe theidentification of a polymorphism within the IGF1 gene of swampbuffaloes (Bubalus b. bubalis kerebau; 2n = 48). We have amplifieda 281-bp fragment of the IGF1 gene harbouring parts of exon 4 andintron 3. Within intron 3 a G®A transition polymorphism wasidentified that alters an Eco130I site. The DNA sequence has beendeposited with the EMBL DNA Sequence Database under accessionnumber Y18832.
Primer sequences:Forward: 59-AAT GTA AAA CGA CGG CCA GT TGG TTG TTG TCA GAGATG AGT-39Reverse: 59-AAC AGG AAA CAG CTA TGA CCT CTC CTT CTG TTC CCCTC-39
The italicised DNA sequences indicate sequencing primer
binding sites for direct DNA sequencing of PCR products.
PCR conditions: PCR primers were designed on the basis of thepublished sequence of the bovine IGF1 gene3 (EMBL acc. no.U01338). PCR (25 ml final volume) was performed using 100 ng ofgenomic DNA, 10 mm Tris±HCl pH 8.85, 25 mm KCl, 5 mm(NH4)2SO4, 2 mm MgSO4, 0.2 mm dNTP, 20 pm of each primer and1 U Taq DNA polymerase. The PCR conditions were 33 cycles of30 s at 94 °C, 30 s at 55 °C and 30 s at 72 °C with an additional3 min denaturation in the first cycle and 5 min extension in the lastcycle using a TECHNE thermocycler (Cambridge, UK). PCR productswere purified with the QIAEX DNA Gel-Extraction Kit (QIAGEN,Hilden, Germany) and analysed using the ThermoSequenaseFluorescence Labelled Cycle Sequencing Kit (Amersham-PharmaciaBiotech, Freiburg, Germany) and a DNA sequencer LI-COR 4000L(MWG Biotech, Ebersberg, Germany). The PCR products weredigested with 1 U of Eco130I at 37 °C for 2 h. This was followedby electrophoresis in a 2% agarose gel stained with ethidiumbromide to visualise the restriction fragments.
Polymorphism: A single nucleotide polymorphism (SNP) wasdetected at position 146 of the amplified fragment within intron 3.The digested PCR product revealed two alleles with fragment sizesfor allele A of 173 and 108 bp; for allele B fragment sizes were 142,108 and 31 bp (Fig. 1). The DNA sequence of IGF-1 shows 69.4%similarity between Bubalus bubalis and man4 (EMBL acc. no.U13800).
Chromosomal location: The chromosomal location of the IGF1 geneof Bubalus b. bubalis is currently unknown.
Mendelian inheritance: Mendelian inheritance was followed in 24individuals of 11 families of Bubalus b. bubalis.
Frequency: A total of 65 Brazilian swamp buffaloes were genotypedusing the Eco130I RFLP and allele frequencies were estimated to be0.53 for allele A and 0.47 for allele B.
Acknowledgements: A. Deppe is thanked for expert technicalassistance. B. Dierkes is a fellow of the W.H. Schaumann Founda-tion. This work was partly funded by a grant of the DAAD to B.Brenig.
References1 Bishop M.D. et al. (1991) J Anim Sci 69, 4360±7.2 Bishop M.D. et al. (1991) J Anim Sci 69, 4306±11.3 Kirkpatrick B.W. (1993) Anim Genet 24, 144.4 Ellsworth D.L. et al. (1994) Mol Biol Evol 11, 875±85.
Correspondence: Dr Bertram Brenig (e-mail: [email protected]).
MOLECULAR GENETIC MARKERS 405
Fig. 1. Partial genomic structure and Eco130I polymorphism in intron 3 of the
IGF1 gene of Bubalus b. bubalis kerebau. (a) The 281 bp IGF1 gene fragments
were amplified as described, digested with Eco130I and separated on a 2%
agarose gel. Products were visualised after ethidium bromide staining. The
genotypes of the different animals are shown at the bottom of each lane (AB,
BB, AA). Sizes are indicated in bp on the right side. The small 31 bp fragment
of allele B is not visible in the gel. The left lane shows the fragments of a 100-
bp DNA ladder (MBI Fermentas, St. Leon-Roth, Germany). (b) The diagram
outlines the partial genomic structure of the IGF1 gene including parts of
intron 3 and exon 4. The Eco130I sites are shown. Broken lines indicate that
intron 3 and exon 4 extend up-and downstream.
ã 1999 International Society for Animal Genetics, Animal Genetics 30, 382±405