mapping of global natural hazards research …
TRANSCRIPT
University of Nebraska - LincolnDigitalCommons@University of Nebraska - Lincoln
Library Philosophy and Practice (e-journal) Libraries at University of Nebraska-Lincoln
2019
MAPPING OF GLOBAL NATURALHAZARDS RESEARCH PRODUCTIVITYDURING 2006-2015Dr. K. KaliyaperumalUniversity Librarian, University of Madras, Chennai - 600 005, Tamil Nadu, India, [email protected]
Dr. R. Santha kumarYoung professional - II, Library and Documentation Center, ICAR-Central Institute of Brackis Aquaculture, R.A.Puram,Chennai - 600028, Tamil Nadu, India.
Dr. P. BalasubramanianUniversity Librarian, Manonmaniam Sundaranar University, Abishekapatti, Tirunelveli-627012, Tamil Nadu, India.,[email protected]
Follow this and additional works at: https://digitalcommons.unl.edu/libphilpracPart of the Library and Information Science Commons
Kaliyaperumal, Dr. K.; Santha kumar, Dr. R.; and Balasubramanian, Dr. P., "MAPPING OF GLOBAL NATURAL HAZARDSRESEARCH PRODUCTIVITY DURING 2006-2015" (2019). Library Philosophy and Practice (e-journal). 2963.https://digitalcommons.unl.edu/libphilprac/2963
CORE Metadata, citation and similar papers at core.ac.uk
Provided by DigitalCommons@University of Nebraska

MAPPING OF GLOBAL NATURAL HAZARDS RESEARCH PRODUCTIVITY
DURING 2006-2015
Dr. K. Kaliyaperumal
University Librarian, University of Madras, Chennai - 600 005, Tamil Nadu, India.
Email id: [email protected]
Dr.R Santha kumar
Young professional - II, Library and Documentation Center, ICAR-Central Institute of
Brackis Aquaculture, R.A.Puram, Chennai - 600028, Tamil Nadu, India.
Email id: [email protected]
Dr.P.Balasubramanian
University Librarian, Manonmaniam Sundaranar University, Abishekapatti,
Tirunelveli-627012, Tamil Nadu, India.
E.mail id: [email protected]
Abstract
This paper examines with scientometric tools a total of 7659 publications on natural
hazards indexed in web of science database during the period 2006-2015. The average
number of publications published per year was 765.9. The highest number of publications
(1264) was recorded in the year 2015. The relative growth rates (RGR) has decreased from
2007 (0.72) to 2015 (0.18) in the span of 10 years. The doubling time (DT) has gradually
increased from 0.96 in 2007 to 3.85 in 2015. The exponential growth of publications was
observed during the study period. Majority of publications were found in English language.
Authors from USA have contributed maximum number of publications compared to the other
countries and India stood 8th rank in terms of productivity in this period. A total of 7274
different institutions were involved in the productivity, among them Harvard University, USA
contributed highest number of 110 articles. The subject Geology contributed the largest
share (22.93%) among subjects followed by Environmental science ecology (19.66%), water
resources (15.45%) and Meteorology atmospheric sciences (12.43%) etc since the natural
hazards are delt by many disciplines.
Keywords: Productivity on Natural hazards, Trend in the productivity, relative growth rate
and doubling time.
1. Introduction
Natural hazards are frequently occurring now a days because the imbalance created by
the human in the physical and social environments of the globe. A natural hazard is a natural
phenomenon that might have a negative effect on humans or the environment. Natural
hazards are naturally occurring physical phenomena caused either by rapid or slow onset
events which can be grouped into two broad categories. Geophysical hazards encompass
geological and meteorological phenomena such as avalanche, earthquakes, volcanic
eruption, wildfire, cyclonic storms, floods, drought, blizzard, hailstorm, heat wave, tornado,
ice storm, climate change, coastal erosion, fires are socio-natural hazards since their causes
are both natural and manmade. Biological hazards can refer to a diverse array of disease and
infestation. So the natural hazards effects are increasing day by day and creating danger for
human life in the coming years. This is clear from the scientometric evidence from 2006 to
2015, that the number of publications in the Web of Science database was increased from 372
to 1133. Therefore the present study has been undertaken to know the growth and
development of publications in the field of natural hazards.
Scientometrics is one of the most important measures for the disciplines of science
based on published literature and communication. Scientometric analysis is the quantitative
study of a subject growth by using bibliometric indicators and statistical tools and techniques.
It throws light on the pattern of growth of individual to the respective subject literature, inter-
relationship among different branches of knowledge, productivity, authorship pattern, degree
of collaboration, pattern of collection building, and their use. Scientometric evaluation is a
very key component of any research and development activity. One well known productivity
indicator is the number of publications produced by the scientists, institutions and countries.
Studies like this will provide some insight into the complex dynamics of research activity and
enable researchers, scientists, policy makers and science administrators to provide adequate
facilities and proper guidance in which direction the researches to be conducted. Hence, such
an indispensable technique is used to evaluate the quality and quantity of literature published
across disciplines within a particular geographical area.
2. Objectives for the Study
The present study has been undertaken with the objectives of analysing the following
aspects:
❖ Year wise growth of publications
❖ Most prolific authors

❖ Highly productive countries
❖ Highly productive institutes
❖ Language-wise distribution of publications
❖ Most preferred source titles for publication in the field and
❖ High productive subject areas
3. Materials and Methods
The Web of Science database was used for retrieving data on natural hazards in topic field. A
total of 7659 publications were downloaded and analysed by using the Microsoft excels per
the objectives of the study. The Web of Science database allows us to refine the results in
terms of publication years, countries, institutes, authors, language, subjects and source titles.
4. DATA ANALYSIS AND INTERPRETATIONS
4.1 FORMS OF PUBLICATIONS
Table 1 Forms of publications
S. No. Forms of publications No. of publications Percentage
1 Journal articles 6868 89.67
2 Review 378 4.93
3 Conference papers 277 3.62
4 Editorial material 98 1.28
5 Book review 17 0.22
6 Book chapter 11 0.14
7 Meeting abstract 5 0.07
8 Letter 3 0.04
9 News item 2 0.03
Total 7659 100.00
The table 1 reveals that the major source of publications covered by web of science
databases on natural hazards research is Journal articles with 6,868 publications (89.67%)
followed by Review articles with 378 publications (4.93%). Conference papers ranks the
third position with 277 publications (3.62%) and Editorial material with 98 publications
(1.28%) and remaining forms are less than one percentage as seen in the table. The results
indicate that the research outputs on natural hazards of the period covered by the study are
mostly published in the form of journal articles.

Figure 1 Form of publications
4.2 TREND ANALYSIS - METHOD OF LEAST SQUARES
The least square method is used for the trend analysis so as to focus or predict the
trend for the future of further ten years from 2016 to 2025. It is a new approach to the field of
Scientometric made by this paper. However, this projection for the future may be depends
upon the obselence characters of the subject. If the obselence is quick, this may not be
suitable. This method works on the following formula:
The straight line trend has an equation of the type: Y = a + bX,
Where,
Y represents the estimated values of the trend, X represents the deviations in time
period; ‘a’ and ‘b’ are constants.
The values of two constants ‘a’ and ‘b’ are estimated by solving the following two
normal equations.
∑ Y = Na + b∑ X
∑ XY = a ∑ X + b∑ X2
Where N represents number of years for which data is given.
The variable X can be measured from any point of time as origin. To make calculation
simpler, it is better to take the mid-point of time as the origin because the negative values of
first half of the time series will equalize the positive values in the second half of the series
which symbolically gives ∑ X = 0.

When ∑ X = 0, the two normal equations for finding the constants ‘a’ and ‘b’ will be
Σ𝑌 = 𝑁𝑎 ⇒ 𝑎 = Σ𝑌
𝑁= 𝑌
Σ𝑋𝑌 = 𝑏Σ𝑋2 ⇒ 𝑏 = Σ𝑋𝑌
Σ𝑋2
This provides that the constant ‘a’ is simply equal to the mean of Y values and the
constant ‘b’ gives the rate of change. The constant ‘a’ refers to the Y intercept, i.e. the
difference between the point of origin and the point where the trend line touches the Y axis.
The constant ‘b’ refers to the slope of the line which indicates the change in Y for each unit
change in X.
Table 2 Computation of Straight Line Trend by the Least Squares Method
Year No. of
Publications
Actual (Y)
Deviation Multiply
(X)
XY X2 No. of Publications
Trend
2006 428 -4.5 -9 -3852 81 354
2007 448 -3.5 -7 -3136 49 445
2008 553 -2.5 -5 -2765 25 537
2009 587 -1.5 -3 -1761 9 629
2010 663 -0.5 -1 -663 1 720
2011 746 1 1 746 1 812
2012 908 1.5 3 2724 9 903
2013 995 2.5 5 4975 25 995
2014 1067 3.5 7 7469 49 1087
2015 1264 4.5 9 11376 81 1178
2016 11 1270
2017 13 1361
2018 15 1453
2019 17 1545
2020 19 1636
2021 21 1728
2022 23 1819
2023 25 1911
2024 27 2003
2025 29 2094
7659 15113 330 24480

The equation of the straight line trend is Y= a + bX
Since ∑ X=0, therefore
∑ Y 7659
a = ----- = ---------- = 765.9
N 10
∑ XY 15113
b= ---------- = --------- = 45.80
∑ 𝑋2 330
Thus substituting the value of ‘a’ and ‘b’ in the straight line of the trend, we get
Y= a = bX Y = 765.9 + 45.80 x X
Estimate of 2025 will be calculated on the basis of X= 29
Y2025 = 765.9 + 45.80 x 29 = 2094.1
Table 2 shows that the Trend value of the total publications, calculated year wise. Increasing
trend is seen in next 10 years of the period. The Trend value has been increased from 354 in
2006 to 2094 in 2025.
Figure 2 Trend of the Natural hazards literature
4.3 GROWTH OF PUBLICATIONS
Relative Growth Rate (RGR) and Doubling Time
The Relative Growth Rate (RGR) is the increase in number of articles or pages per
unit of time. This definition derived from the definition of relative growth rates in the study
of growth analysis in the field of natural hazards
. The mean relative growth rate (R) over the specific period of interval can be
calculated from the following equation.

Relative Growth Rate (RGR)
1 - 2R=Log W2 – Log W1/ T2-T1
Whereas
1-2 R- mean relative growth rate over the specific period of interval
Loge W1 - log of initial number of articles
Loge W2 - log of final number of articles after a specific period of interval
T2-T1- the unit difference between the initial time and the final time
The year can be taken here as the unit of time.
Doubling Time (DT) = 0.693/R
Table 3 Relative growth rate (RGR) and Doubling time (DT) of publications
Year
No. of
Publications (%)
Cumulativ
e Total
W1
W2
RGR
DT
2006 428 (5.59%) 428 - 6.06 - -
2007 448 (5.85%) 876 6.06 6.78 0.72 0.96
2008 553 (7.22%) 1429 6.78 7.26 0.48 1.44
2009 587 (7.66%) 2016 7.26 7.61 0.35 1.98
2010 663 (8.66%) 2679 7.61 7.89 0.28 2.48
2011 746 (9.74%) 3425 7.89 8.14 0.25 2.77
2012 908 (11.85%) 4333 8.14 8.37 0.23 3.01
2013 995 (12.99%) 5328 8.37 8.58 0.21 3.30
2014 1067 (13.93%) 6395 8.58 8.76 0.18 3.85
2015 1264 (16.50%) 7659 8.76 8.94 0.18 3.85

The year wise RGR is found to be in the range of 0.72 to 0.18. It has been observed
from Table 2 and figure 2 that RGR is downward trend from 2007 (0.72) to 2015 (0.18). The
doubling time (DT) was upward trend from 2007 (0.96) to 2015 (3.85).
Figure 3 Relative growth rates for research output
4.4 LANGUAGE WISE DISTRIBUTIONS
Table 4 Language wise distribution of publications
Rank Language No. of
Publications Rank Language
No. of
Publications
1 English 7488 (97.77%) 9 Croatian 4 (0.05%)
2 Spanish 37 (0.48%) 10 Japanese 4 (0.05%)
3 German 34 (0.44%) 11 Czech 3 (0.04%)
4 French 30 (0.39%) 12 Korean 3 (0.04%)
5 Polish 27 (0.35%) 13 Malay 2 (0.03%)
6 Italian 10 (0.13%) 14 Slovenian 2 (03%)
7 Portuguese 7 (0.09%) 15 Arabic 1 (0.01%)
8 Chinese 10 (0.12%) 16 Turkish 1 (0.01%)
Publications on natural hazards are spread over 16 languages. The study reveals that the maximum
number of publications have been published in English language with 7488 (97.77%) publications,
followed by Spanish language with 37 (0.48%) publications, German language ranks third position
with 34 (0.44%) publications, French language with 30 (0.39%) publications, Polish language with 27
(0.35%) publications, Italian language with 10 (0.13%) publications and Portuguese language with 7
(0.09%) publications. The most predominant language used for communication was English in every
year in total productivity on the subject during the study period.

Figure 4 Language wise distributions of publications
4.5 HIGHLY PRODUCTIVE COUNTRIES
Table 5 Highly productive countries
Rank Country Total
Publications (%) Rank Country
Total
Publications
(%)
1 USA 2183 (28.50%) 13 Netherlands 266 (3.47%)
2 Italy 682 (8.91%) 14 Austria 194 (2.53%)
3 England 579 (7.56%) 15 Turkey 171 (2.33%)
4 China 549 (7.17%) 16 Taiwan 159 (2.08%)
5 Germany 524 (6.84%) 17 Sweden 147 (1.92%)
6 France 428 (5.59%) 18 Norway 139 (1.82%)
7 Canada 401 (5.24%) 19 Poland 139 (1.82%)
8 India 383 (5.00%) 20 Greece 134 (1.75%)
9 Australia 323 (4.22%) 21 Korea 134 (1.75%)
10 Spain 302 (3.94%) 22 Iran 131 (1.71%)
11 Switzerland 302 (3.94%) 23 Egypt 125 (1.63%)
12 Japan 271 (3.54%) 24 New Zealand 125 (1.63%)
In all, there were 126 countries involved in the research in natural hazards field and
which published at least one publication. The publications share of highly productive
countries (≥125 publications) in natural hazards varies from 1.63% to 28.50% as seen in the
table 4 and figure 4. USA topped the list with highest share 2183 (28.50%) of publications.
Italy ranked second with 682 (8.91%) share of publications followed by England 579 (7.56%)
share of publications, China with 549 (7.17%) share of publications, Germany with 524
(6.84%) share of publications, France with 428 (5.59%) share of publications, Canada with

401 (4.24%) share of publications and India with 383 (5.00%) share of publications and the
remaining countries are publishing less than 5% of the research output in this study period.
Figure 5 Highly productive countries
4.6 IDENTIFICATION OF MOST PROLIFIC AUTHORS
Table 6 Identification of most prolific authors
Rank Author No. of
publications Percentage
1 Lu, X W 23 0.30
2 Pradhan, B 22 0.29
3 Stoffel, M 22 0.29
4 Cozzani, V 20 0.26
5 Zhang, Q 19 0.25
6 Fuchs, S 18 0.24
7 Zhang, Y 18 0.24
8 Lee, J H 17 0.22
9 Cutter, S L 16 0.21
10 Mehra, R 16 0.21
11 EL-Taher, A 15 0.20
12 Liu, Y 15 0.20
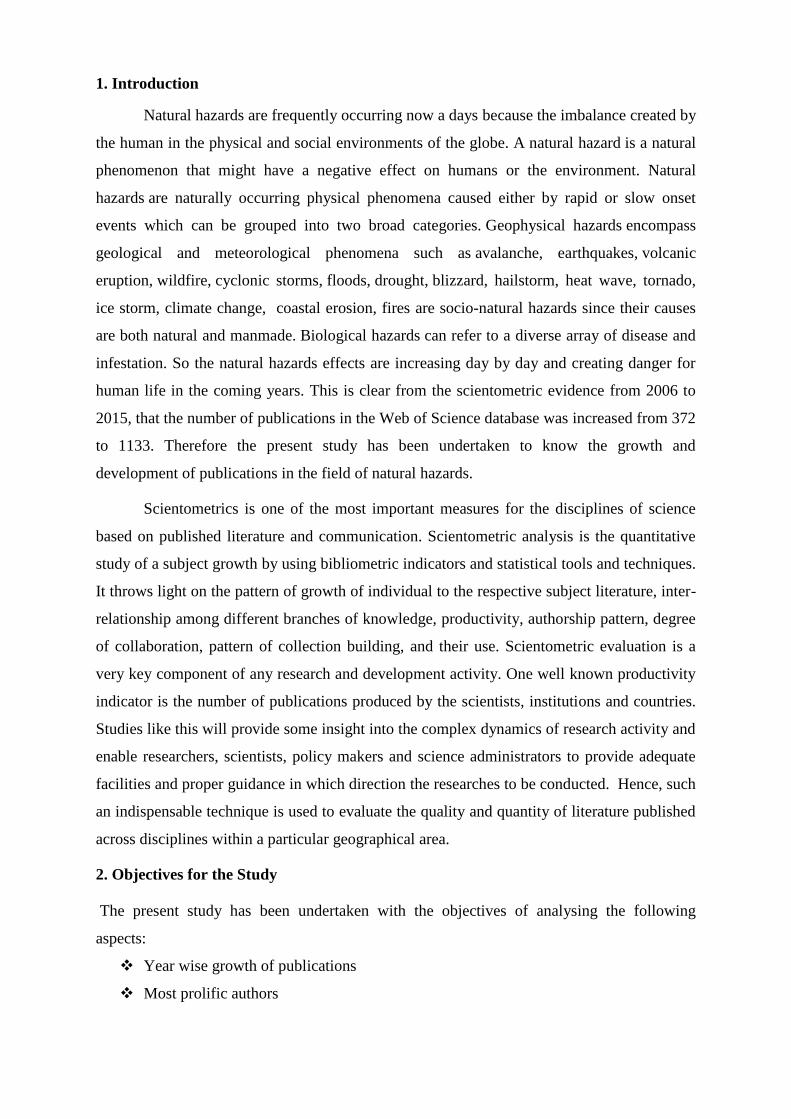
The authors having 15 or more publications during 2006-2015 are given in Table 6. Lu, X W
is the most productive author with 23 (0.30%) publications followed by Pradhan, B with 22
(0.29%) publications, Stoffel, M with 22 (0.29%) publications, Cozzani, V with 20 (0.26%)
publications, Zhang, Q with 19 (0.25) publications, Fuchs, S with 18 (0.24%) publications,
Zhang, Y with 18 (0.24%) publications and Lee, J H with 17 (0.22%) publications
respectively. And a total of 28,503 authors are contributed entire research output of the period
under study.
Figure 6 Most prolific authors
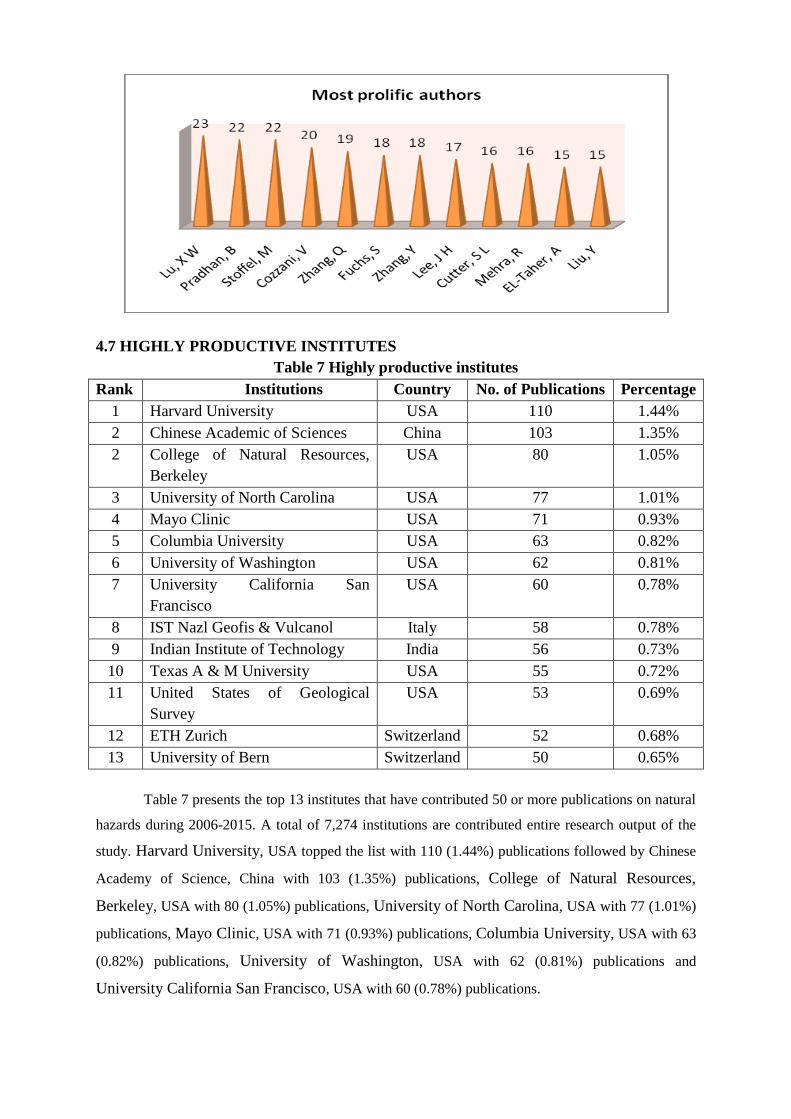
4.7 HIGHLY PRODUCTIVE INSTITUTES
Table 7 Highly productive institutes
Rank Institutions Country No. of Publications Percentage
1 Harvard University USA 110 1.44%
2 Chinese Academic of Sciences China 103 1.35%
2 College of Natural Resources,
Berkeley
USA 80 1.05%
3 University of North Carolina USA 77 1.01%
4 Mayo Clinic USA 71 0.93%
5 Columbia University USA 63 0.82%
6 University of Washington USA 62 0.81%
7 University California San
Francisco
USA 60 0.78%
8 IST Nazl Geofis & Vulcanol Italy 58 0.78%
9 Indian Institute of Technology India 56 0.73%
10 Texas A & M University USA 55 0.72%
11 United States of Geological
Survey
USA 53 0.69%
12 ETH Zurich Switzerland 52 0.68%
13 University of Bern Switzerland 50 0.65%
Table 7 presents the top 13 institutes that have contributed 50 or more publications on natural
hazards during 2006-2015. A total of 7,274 institutions are contributed entire research output of the
study. Harvard University, USA topped the list with 110 (1.44%) publications followed by Chinese
Academy of Science, China with 103 (1.35%) publications, College of Natural Resources,
Berkeley, USA with 80 (1.05%) publications, University of North Carolina, USA with 77 (1.01%)
publications, Mayo Clinic, USA with 71 (0.93%) publications, Columbia University, USA with 63
(0.82%) publications, University of Washington, USA with 62 (0.81%) publications and
University California San Francisco, USA with 60 (0.78%) publications.

4.8 MOST PREFERRED SOURCE TITLES
Table 8 Source Title of Publications
Rank Source Title No. of
Publications
Percentage Impact
Factor
1 Natural hazards 428 5.59% 1.719
2 Natural hazards and earth system
sciences
208 2.72% 1.735
3 Radiation protection dosimetry 104 1.36% 0.861
4 Environmental earth sciences 89 1.16% 1.059
5 Geomorphology 74 0.97% 2.577
6 PLOS One 69 0.90% 3.234
7 Journal of radioanalytical and
nuclear chemistry
61 0.80% 0.983
8 International Journal of Disaster
Risk Reduction
58 0.76% 1.242
9 Risk Analysis 57 0.74% 2.366
10 Journal of coastal research 50 0.65% 0.852
Table 8 provides the leading journals each with number of publications and impact factor.
The scientific literature on natural hazards is spread over 2167 different web of science
source journals. It reveals that Natural Hazards the list with the highest number of
publications 428 (5.59%) and the impact factor is 1.719, followed by Natural hazards and
earth system sciences with a share of 208 (2.72%) publications and the impact factor is 1.735.
Radiation protection dosimetry occupies the third position with 104 (1.36%) publications and
the impact factor is 0.861. The fourth highest source title is Environmental earth sciences
with 89 (1.16%) publications and the impact factor is 1.059, Geomorphology with 74
(0.97%) publications and the impact factor is 2.577 and PLOS One with 69 (0.90%)
publications and the impact factor is 3.234.
4.9 HIGH PRODUCTIVITY SUBJECT AREAS
Table 9 High productivity subject areas
Rank Subject No. of Articles Percentage
1 Geology 1756 22.93
2 Environmental sciences ecology 1506 19.66
3 Water resources 1183 15.45
4 Meteorology atmospheric sciences 952 12.43
5 Engineering 839 10.95
6 Public environmental occupational
health
471 6.15
7 Nuclear science technology 343 4.48
8 Physical geography 318 4.15

The scientific literature on natural hazards is spread over 117 different subjects. Table 9
shows high productivity subjects which are contributing more than 300 articles. It is found
that Geology has highest number of articles with 1756 (22.93%) followed by Environmental
sciences ecology contributing 1506 (19.66%) articles. Water resources occupy the third
position with 1183 (15.45%) articles. The fourth highest articles belonged to the subject
Meteorology atmospheric sciences with 952 (12.43%) articles, Engineering with 839
(10.95%) articles and Public environmental occupational health with 471 (6.15%) articles
respectively.
5. Conclusions
The present study attempted to highlight the growth and development of research
publication on natural hazards. A total of 7659 publications were published during 2006-2015
and the average number of publication per year was 765.9. The single most prevalent type of
publications is the journal, in which 89.67 % of the total literature is published. It is found
that natural hazards researcher’s preferred medium of communication is journal articles. The
exponential growth of publication was observed during the study period. Lu, X W is the most
productive author with 23 (0.30%) publications followed by Pradhan, B with 22 (0.29%)
publications and Stoffel, M with 22 (0.29%) publications. A total of 28,503 authors are
contributed entire research output of the period under study. USA topped the list with highest
share 2183 (28.50%) of publications. Italy ranked second with 682 (8.91%) share of
publications followed by England with 579 (7.56%) share of publications, China with 549
(7.17%) share of publications and Germany with 524 (6.84%) share of publications. Harvard
University, USA topped the list with 110 (1.44%) publications followed by Chinese
Academy of Sciences, China with 103 (1.35%) publications, College of Natural Resources,
Berkeley, USA with 80 (1.05%) publications, University of North Carolina, USA with 77
(1.01%) publications, The scientific literature on natural hazards is spread over 2167 different
web of science source titles.
References
1. Burton, I., Kates, R.W., White, G.F. (1993). The environment as hazard. Guilford
Press. ISBN 9780898621594.
2. Kademani, B. S., Vijai, K., Anil, S., & Anil, K. (2006). Scientometric dimensions of
Nuclear Science and Technology research in India: a study based on INIS (1970-
2002) Database, University of Malaya.

3. Santha kumar R and Kaliyaperumal K (2015). A Scientometric Analysis of Mobile
Technology Publications, Scientometrics, 105 (2), 921-939
4. Anil Sagr, Kademani, B.S, Bhanumathy, K and Ramamoorthy, N (2014). Recent
trend in radio isotopes: A scientometric analysis (1993-2012), DESIDOC Journal of
Library and Information Technology, 34(4), 349-358
5. Gupta, B.M, Ritu Gupta and Ahmed, M (2014). Mouth cancer research: A
quantitative analysis of world publications, 2003-12, DESIDOC Journal of Library
and Information Technology, 34(3), 232-240
6. Santha Kumar, R. & Kaliyaperumal, K (2015). Scientometric Analysis of Global
Publication Output in Mobile Technology: A Scientometric Study, DESIDOC Journal
of Library and Information Technology, 35(4), 287-292
7. Santha kumar R and Kaliyaperumal K (2014). Mapping of Mobile Technology
Publications: A Scientometric Approach, DESIDOC Journal of Library and
Information Technology, 34(4), 298-303
8. Gangan Prathap (2014). A Bibliometric Evaluation of Research on the Monsoon,
DESIDOC Journal of Library and Information Technology, 34(3), 191-196
9. Santha kumar R and Kaliyaperumal K (2015). Scientometric Analysis with Special
Reference to Mobile Technology Publications for the Year 2003 – 2013, International
Journal of Information Library & Society, 4 (1), 1-8
10. Anil Sagr, Kademani, B.S and Bhanumathy, K (2013). Research trends in agricultural
science: A global perspective, Journal of Scientometric Res., 2(3), 185-201
11. https://en.wikipedia.org/wiki/Natural_hazard