mapping of financial flows at the sector level: a untt wg ... · • what are the sources of...
TRANSCRIPT

i
Intergovernmental Committee of Experts on Sustainable Development Financing
Mapping of financial flows at the sector level: A UNTT WG contribution
in response to a request from the Co-Facilitators for cluster 1
November, 2013

ii
Contents Introduction……………………………………………………………………….…1 Chapter 1: Education (prepared by UNESCO)……………………………………..7 Chapter 2: Health (prepared by the WHO)………………………………………..14 Chapter 3: Infrastructure (prepared by the World Bank)………………………….26 Chapter 4: Renewable energy (prepared by UNDESA/DSD)…………………….37 Chapter 5: Forests (prepared by UNFF)…………………………………...………49

1
Introduction
1. Context
This paper is a compilation of sector highlights on: education (prepared by UNESCO); health (prepared by WHO); infrastructure (prepared by the World Bank); renewable energy (prepared by UNDESA/DSD); and forests (prepared by UNFF).
Given the short time frame, these contributions were based on existing information and data. They are presented here unedited, preceded by a short section which highlights some insights from this collection of sectoral mappings of financial flows.
2. Framework used for sector highlights
In order for the sectoral information to be readily usable by the Committee, a common structure was used by all agencies to frame their contributions.
Ideally, the goal should be to produce mappings of financial flows in the considered sectors, distinguishing different sources and different final uses, with channels and instruments in the middle (such a mapping has been attempted by the Climate Policy Initiative for climate finance since 2011). However, such mappings are not readily available and the data needed to produce them may be available for very few, if any, sectors.
As a practical solution, it was decided to adopt a simplified framework/structure which agencies would use to report on information that they are tracking in their sectors of interest. Agencies were encouraged to provide, to the extent possible, a snapshot of the most recent data in each area listed below, as well as time series data when available. The result is a collection of short assessments of financing flows for the sectors mixing qualitative and quantitative elements. The framework aims to provide the Committee with elements for answering the following questions at the sector/area level:
• What are the sources of financing flows in the sector? • How are the flows being used within each sector? • What are the channels and instruments used? • What are the synergies and complementarities among flows? • What are the future challenges?

2
The common structure used for all the sectors is the following.
Section Content 1.Introduction Scope considered for the sector (in terms of final uses/ activities)
and a brief overview of the state of the financial data for the sector. 2. Sources of flows to sector
Most recent available data on sectoral financial flows, by source of financing as far as possible, using a nomenclature appropriate to the specificities of the sector or available data. At the minimum, there should be a distinction between public and private flows, both domestic and international. In addition, a breakdown by country source would be useful, e.g. what countries are the largest providers of international funding in the sector?
3. Uses of flows within sector
What activities/sub-sectors are being funded? What countries are the largest recipients? Is there a high concentration of financing in a handful countries? When possible, provide a breakdown of flows per destination region; per country income group. What are the criteria for the allocation of the main types of public funds?
4. Channels and financial instruments
What channels (e.g. government budgets, multilateral development banks, private banks, etc.) are used? What financial instruments (for example, grants, loans, guarantees, for public finance; equity, debt, bank loans for private finance) are used? If possible, provide a qualitative picture by region/ country income group.
5. Synergies and complementarities among flows
Here, indicate to what extent different flows complement each other, and where gaps remain. For example: Does the current allocation of flows (all sources) broadly correspond with identified national needs in different country income groups? What is the role of ODA and public flows in the sector? How well do ODA and other public flows address needs in countries or areas where the private sector is not present? These elements can be based on bottom-up (country-level) assessments of financing flows in the sector.
6. Challenges for the future What key financing challenges should be addressed in the sector? 3. Insights from the sectoral mappings of financing flows This section highlights a few salient points that emerge from looking at the five sector mappings
together. It is not intended as a summary, but rather as a pointer to interesting lessons that are gained from looking at financing flows at the sector level, as opposed to staying at a macroeconomic level. Indeed, even though the sectors/areas examined here are far from covering the whole sustainable development universe, useful lessons can be drawn to inform a sustainable development financing strategy.
3.1 Data issues A common thread of the five chapters is that lack of adequate data is hampering our understanding
or at least preventing comprehensive monitoring of financial flows. For all the five sectors covered in the next chapters of this paper, data limitations are highlighted as a serious impediment. The heterogeneity of these five chapters is, in large part, conditioned by differences in data availability, and clearly illustrates how access to relevant data conditions the way issues related to financing are addressed from a substantive perspective.
Overall, in all sectors covered here (and there is no reason to think that they are the exception), the
picture of financing flows is incomplete.

3
In health, education, infrastructure and forests, Official Development Assistance (ODA) is relatively well tracked. Conversely, in the case of renewable energy, it is not possible to identify ODA flows directly from the traditional OECD sources and estimates have to be obtained in indirect ways. Even in relatively well monitored sectors, complications arising from reporting rules and complex financial circuits between the donors and ultimate recipients create difficulties in obtaining fully consistent and reliable pictures for ODA (see Chapter 1 on education for a concrete example).
National (and even more sub-national) government flows in some sectors are also difficult to track,
as shown in Chapter 5 on forests and also mentioned in Chapter 3 on infrastructure. Going deeper into details, whole dimensions of financial involvement by governments are not well apprehended, for example regarding the maze of explicit and implicit subsidies and other forms of support that benefit various sectors. For some sectors, international institutions are compiling and estimating figures for those; in others, they remain largely unseen. Yet their importance in the economics of the sectors, and hence for the financial flows that those attract, in particular from private investors, can be critical.
The reliability of data on private financial flows is highly variable across sectors. In sectors
involving large-scale commercial activities, some private flows are tracked by private institutions. However, data of interest to the private sector often do not reflect all development-relevant flows. In infrastructure and renewable energy, private institutions tend to focus their monitoring on capital investment (as directly relevant to capital markets), and not on operation and maintenance (Chapter 3). Yet, in infrastructure, the latter is a critical component of financing flows and its capture is necessary to get a comprehensive picture of the sector. As for forests, private investment that is tracked concerns mostly timber and related processing industries, not forest management; a large portion of economic activities and related financial flows relevant to forests are not well tracked due to their informal nature (Chapter 5).
Expenditures by private households or small firms are also unequally tracked across sectors. The
health sector benefits from having well-established satellite accounts at the national level. Education does not. Even for health, it is apparently difficult to obtain comparable, updated figures on expenditures by households at different levels of income, although this information is of critical importance to policy.
Overall, data availability often seems to cause an “ODA bias”, where ODA (and to a lesser extent
other international sources of finance) is intensely scrutinized whereas other financial flows are not well measured and understood, although they may be more important or more relevant to the functioning of a sector. For example, the chapter on forests notes that domestic government and private expenditures on forest management are not well monitored (Chapter 5).
This suggests that improving data systems and the tracking capabilities of the statistical apparatus
for monitoring development outcomes should be an immediate concern. Four of the five chapters present this as a key challenge for the future (the exception being the chapter on renewable energy, which thanks to its strong private sector component and its central place in the climate change nexus has benefited from increasing data availability). Such undertaking would likely be a relatively low-cost but high return proposition. Chapter 3 suggests that the costs of improving the monitoring system for infrastructure to a level that is relevant for policy-making would be of the order of $ 10 million per year, or 0.001% of investment amounts involved.
In summary, the current apparatus for collecting and monitoring financial data relevant to
internationally agreed sustainable development goals does not seem fit for purpose. Addressing this gap will be a key challenge for monitoring the post-2015 development agenda. It seems clear that relevant models for collecting and analyzing data should be different across sectors, to reflect the differing reality of financing flows in each of them (see below and individual chapters).

4
3.2 Changes in financing flows over time A look at the time patterns of financing flows in the five sectors shows rising investment or
expenditures in most of them, with nuances. In infrastructure, budget allocation by national governments has been growing, as has private participation in infrastructure; this has been accompanied by the emergence of new financiers from large middle-income countries, especially in Africa (Chapter 3). Investment in renewable energy has also been growing rapidly over the last decade (Chapter 4). Chapter 1 mentions that, over the past decade, national governments in many low income countries have increased their domestic spending on education, with an average annual rate of growth for total spending on education in low-income countries of 7.2% a year. ODA disbursements for forestry activities more than doubled between 2002-2004 and 2008-2010 (Chapter 5). Total expenditure on health (public and private) is estimated to have tripled in low-income countries between 2000 and 2011, also tripled in lower-middle income countries, and quadrupled in upper-middle income countries (Chapter 1).
Large financing gaps remain in education and health, as abundantly documented elsewhere. For
example, the poorest countries continue to face major shortfalls in resources needed to achieve Education for All, with an estimated financing gap for basic education of US$26 billion annually, once domestic spending and ODA is taken into account (Chapter 1). Stark differences persist in health, where on average low-income countries were estimated to spend $31 per capita in 2011, versus $4,574 in developed countries, a 148-fold difference. Even without referring to precise needs or targets, Chapter 3 acknowledges that spending for infrastructure in developing countries is inadequately low. Lastly, Chapter 5 argues that spending for forest management is still inadequately low in many countries.
3.3 Variety of financing models across sectors/ areas Another striking feature of the five chapters taken together is the variety of financing models that
prevails across sectors. The main actors/ sources of finance are different, and so are the main financial instruments and channels used. For example, in low and lower-middle income countries, households are the primary source of expenditure on health, overwhelmingly from out-of-pocket expenditures (Chapter 2). This contrasts with sectors like infrastructure and renewable energy, where the majority of financing flows to large projects financed by corporations and governments (Chapters 3 and 4).
The sample of sectors represented here helps make clear that, while much importance has been
given to the importance of private flows for development in recent years, in many sectors public financing flows remain of critical importance. Chapter 2 shows that, in developed and higher-middle income countries, governments are the main spenders on health. Even in infrastructure, the largest share of the $800 billion estimated annual spending on new investment in developing countries comes from domestic public spending (Chapter 4). In sum, in all sectors reviewed here, the public sector plays a critical role, through direct expenditure or other forms of financial and policy support.
The review also shows the importance of ODA as a source of finance in social sectors in
developing countries. More than 25% of health expenditures recorded by WHO in low-income countries comes from external resources, with ODA representing a large portion of those resources. In education, aid continues to be important for the poorest countries; even though national spending provides the most important contribution to the education sector, ODA amounts to as much as one-fifth of education budgets in low income countries on average. ODA makes up a much smaller portion of total resources available for the education sector in middle income countries, which rely mainly on domestic financing (Chapter 1). ODA is also important in other sectors, even though its size in proportion to total financial flows is smaller. Despite a significant increase in recent years, ODA only accounts for about 10% of overall infrastructure finance (Chapter 3).
Coming to financing channels, there are obvious differences among the sectors reviewed here
regarding the role of banks and other financial institutions as well as capital markets. The financing of social sectors such as health or education does not, in many countries, rely on these channels; nor does

5
the forest sector except for very specific activities. By contrast, financial institutions play a major role in infrastructure and renewable energy. Chapter 2 documents the rise of non-governmental organizations (NGOs) as a conduit for international public finance in the health sector. Chapter 1 notes that this has not had a parallel in the education sector. In other sectors, the critical importance of development banks (from national to regional to international) is noted, as conduits for resources from different sources through trust funds as project facilitators, and as providers of financial products such as insurance and guarantees.
This variety of financing models across sectors is mirrored within sectors. Taking renewable energy
as an example, large-scale investments (e.g. wind farms, solar PV parks) are different from small-scale, decentralized investment (e.g. solar PV on individual houses, geothermal heating/cooling systems, solar water heaters, etc.) in the sources and channels of financing. The two face very different technical and financial constraints and are best addressed through different policy frameworks and financing models (Chapter 4).
In summary, the heterogeneity of financial models and circuits both across and within sectors
is a constitutive feature of development finance, and this has important implications for policy-making.
3.4 Coherence, consistency and synergies of financing flows One of the key questions for global policy should be whether financing flows are going where they
are most needed, the needs in this case being defined with respect to sustainable development objectives and targets. A first related dimension is whether development assistance and related international public flows to developing countries complement private flows. A second dimension is whether the allocation of ODA across recipient countries reflects measured needs. In spite of patchy data for many sources of finance in the sectors reviewed here, interesting insights can be gained on these two aspects.
Focusing first on the allocation of ODA among recipient countries, both the chapter on forests and
that on education point to important differences in allocation of funds across countries that are not easily explained by the importance of forest cover or country income level (for forests) or the education gap (for education). Similarly, Chapter 1 notes the wide dispersion of ODA allocation across countries at similar levels of income, and the fact that countries with lower GDP per capita have not receive more ODA for health per capita during the period 2002-2010.
Regarding the predictability of external public flows, Chapter 5 notes that “disbursements are not
consistent over time”. Two sectors among those reviewed (education and health) point to recent instances of reductions of bilateral aid commitments in a situation of continuing financing gaps, especially in low-income countries.
Allocation of resources from the national budget is a recurring theme across the five chapters. The
importance of allocating adequate resources to education is documented in Chapter 1. Chapter 5 relates low priority of public expenditure on forest management to insufficient awareness of the economic contribution of the sector. The chapters also point to competition among sectors for budget allocations, an issue that has been abundantly discussed in the development literature.
More broadly, general allocation of resources appears not necessarily aligned with global or
national priorities, or even towards most efficient use of money. Chapter 2 notes as an important issue the fact that aid flows are “heavily biased towards three communicable diseases, whereas non-communicable diseases and injuries now account for over 50% of the burden of disease”. For education, Chapter 1 comments that, while “there have been several cases where donors pooling their funding and aligning with national education plans have produced impressive results”, there is a danger that donors are now moving away from such approaches towards project-based support. Chapter 4 notes the importance that is given to large-scale investment in renewable energy in terms of public policy and financial support, even though small-scale, decentralized technologies and solutions would merit more attention. Similarly, within sectors private investment tends to focus on specific sub-sectors or activities

6
(telecommunications for infrastructure; large-scale wind and solar for renewable energy; wood products extraction and processing industries for forests), and this is often imperfectly balanced by public flows.
Geographic allocation of total financing flows is also a relevant dimension to consider. In
infrastructure, private participation is highly concentrated geographically, with 70% of investments in the last 15 years made in 10 countries (Chapter 3). For renewable energy, the picture is different. Investment has until very recently been heavily concentrated in Europe, North America and China. Recent years, however, have seen a steady growth of investment to a broader group of developing countries, with developing countries as a whole poised to overtake developed countries in a few years if trends continue. Even so, investment still largely involves a limited number of countries (Chapter 4).
In conclusion, whereas better data would certainly allow more precise assessment of existing
allocation imbalances (in regard to desirable sustainable development objectives or outcomes), and whereas the sources of these imbalances are multiple and the ways to address them can be debated, the partial picture that emerges points to a need for global policy-makers to re-examine allocations of financial resources along a number of dimensions, with sustainable development goals in mind.
3.5 Challenges for the future Here again, diversity characterizes the challenges that are identified in the different chapters. Taken
together, they cover the whole span of well-known barriers that have been highlighted in the development literature, from limited domestic resource mobilization capacities to access to finance and capital by corporations to lack of social safety nets and insurance systems, and finally broader governance issues. Challenges linked to lack of coherence in resource allocation, which have been mentioned above, are not re-stated in detail here, but are nevertheless important for the five sectors covered and suggest a general pattern.
The need to improve domestic resource mobilization capacities, especially in low-income countries,
is emphasized in Chapter 1 on education. As domestic government expenditures are the most important source of financing in this sector, improving revenue generation and ensuring that an appropriate share of public spending is allocated to education are critical. The chapter on forests also emphasizes revenue allocation mechanisms as a key area for improvement (Chapter 5).
Chapter 3 on infrastructure puts forward challenges linked with access to capital in order to increase
investment. Solutions proposed include finding new financial instruments and new ways to share risks. In addition, the chapter recommends a focus on the project supply side, the objective being to facilitate the identification of bankable projects. The chapter on forests shows the importance of ensuring access to finance to households and small enterprises that are key stakeholders in that sector. It also suggests that payments for ecosystem services could contribute to a better recognition of the value of forests for sustainable development.
For renewable energy, while concerns similar to those in infrastructure apply in relation to scaling
up large-scale investment, political economy constraints may be the binding ones going forward, as discussed in Chapter 4. They relate to the difficulty of reaching satisfactory agreements across countries linked by energy systems, as well as internal acceptability of higher energy prices and large subsidies to renewable energy producers.
The chapter on health identifies a key challenge as limiting the current heavy reliance on direct out-
of-pocket payments in low income countries as a source of financing for health. It suggests that external assistance could be designed to help countries move from direct out-of-pocket payments to forms of prepayments and pooling systems (Chapter 2).
Lastly, various chapters identify challenges related to governance. This includes ensuring
accountability of NGOs and civil society organizations as recipients of aid funding (Chapter 2); finding socially acceptable parameters for public support to private investment for development objectives (Chapter 4); and broader governance issues (Chapter 5).

7
Chapter 1 Mapping of financial flows to education
1. Introduction Over the past decade, national governments in many low income countries have increased their
domestic spending on education. Faster economic growth, better revenue generation and a stronger commitment to education have helped ensure that real spending on education in low income countries increased by 7.2% a year, on average, over the past decade. Aid continues to be important for the poorest countries: even though national spending provides the most important contribution to the education sector, Official Development Assistance (ODA) amounts to as much as one-fifth of education budgets in low income countries on average (UNESCO, 2012). However, the poorest countries continue to face major shortfalls in resources needed to achieve Education for All, with an estimated financing gap for basic education of US$26 billion annually, once domestic spending and ODA is taken into account (UNESCO, 2013). ODA makes up a much smaller portion of total resources available for the education sector in middle income countries, which rely mainly on domestic financing.
This section analyses education financing beyond domestic public resources. Information on
household expenditure on education is not sufficiently available in a comparable way, so it is rarely integrated into an overall picture of education financing. This makes it difficult to ascertain how the costs of education are shared between governments and households – and, within households, between the rich and the poor.1 With respect to external financing, such data are mainly available for donors reporting to the OECD Development Assistance Committee (DAC). These data capture annual disbursements to the sector, split by the level of education.2 Other sources of financing, such as those from emerging, non-DAC donors, including Brazil, Russia, India, China, and South Africa (BRICS), philanthropic organisations, corporations and other potential sources of innovative financing remain less available, leaving an incomplete picture of what resources are at the disposal of the sector. This brief overview of financial flows draws largely on the Education for All Global Monitoring Reports, which each year include analysis on financing in the context of achieving education goals.
2. Sources of flows to sector
The share of national income devoted to education is an indicator of government commitment
to education. Among low and middle income countries with comparable data, 63% increased the share of national income spent on education in the past decade. Coupled with economic growth and greater government capacity to raise revenue, this led to significant increases in total education expenditure.
Most countries that accelerated progress towards education-related MDGs and EFA over the
last decade did so by increasing spending on education substantially or maintaining it at already high levels. Among countries furthest from universal primary education in 1999, the ten where the net enrolment ratio increased fastest from a starting point below 85% devoted 4.4% of GNP, on average, between 1999 and 2010. This is substantially more than in the ten countries where net enrolment ratios increased the least, in which just 3.4% of GNP went to education over the period.
Countries in sub-Saharan Africa that have shown increased financial commitment to education have witnessed impressive progress in education, reaching at least 5% of GNP. In 1999, the United Republic of Tanzania spent just 2% of its GNP on education. By 2010, the share was 6.2%. Over the same period, its primary net enrolment ratio doubled. In Senegal, an increase in spending from
1 By contrast, the health sector has developed a more comprehensive picture of financing through the
development of national health accounts. Such an approach would also be helpful for the education sector. 2 This information is provided by the OECD Creditor Reporting System which can be found at
https://www.oecd.org/dac/stats/idsonline

8
3.2% of GNP to 5.7% allowed impressive growth in primary enrolment and the elimination of the gender gap. In Kenya, which spent over 5% of its income on education over the decade, the net enrolment ratio rose from 62% in 1999 to 83% in 2009.
Despite this promising global trend, some countries have maintained a low level of spending,
allocating less than 3% of GNP to education over the past decade. They include countries that are still a long way from achieving EFA. With a net enrolment ratio of just 69% in 2011, the Central African Republic, for example, reduced its spending from 1.6% to 1.2% of GNP on education, the lowest proportion among all low and middle income countries with data. Guinea spent less than 3% of GNP on education, even though it still has wide gender disparities in primary and secondary school. Pakistan has the second largest number of children out of school yet spent just 2.3% of GNP in 2010 (UNESCO, 2012).
Aid disbursements by DAC donors to the education sector have increased since 2002 from
US$6.7 billion to US$13.4 billion by 2011. While this doubling of aid funding has provided an important contribution to the sector, it is a cause for concern that aid to the sector declined by 7% between 2010 and 2011, even though a substantial financing gap for achieving Education for All remains. This decline is at a time when the number of children out-of-school has stagnated, leaving 57 million children without this opportunity in 2011 (UNESCO, 2013). The changes in education aid reflect changes in aid patterns more broadly, with education comprising around 13% of sector-allocable aid over the past decade (UNESCO, 2012). There are, however, more recent indications that some donors are de-prioritising education within their aid budgets, suggesting that the sector’s share of overall aid is at risk of falling.
Reliable information on the amount emerging non-DAC donors spend on education is largely
unavailable. Data are piecemeal and information that is available does not conform to DAC definitions of ODA, making it difficult to obtain a comparable picture of their contributions. The limited evidence available suggests that the impact of these donors on resources to education, particularly to address education-related MDGs and Education for All goals, is likely to be limited (UNESCO, 2012). To take one example, just 2% of the amount committed by India to other developing countries from 2008 to 2010 was allocated to education, compared with 25% for energy projects and 15% for transport infrastructure projects. Information from China suggests that the majority of its education funding to poorer countries is in the form of scholarships for students to study in China or sending Chinese teachers abroad, with a limited amount of funds for building schools (UNESCO, 2012).
The limited available evidence on spending by the private sector on education suggests that the
sector also appears to benefit very little from private contributions originating from OECD-DAC countries: private foundations and corporations based in rich countries provide an estimated US$683 million a year to support education in developing countries, equivalent to just 5% of aid from DAC donors (UNESCO, 2012). Only one-fifth of these funds are provided by philanthropic organizations, whose aims are more closely aligned with those of aid donors (UNESCO, 2012).
3. Use of flows within sector
In order to assess the contribution that financing makes to achieving education-related MDGs and EFA priorities, it is important to assess flows by the level of education to which aid is directed and the type of recipients (by income group and region)3.
Aid disbursements by education level: Over the last decade aid disbursements to basic
education4 have comprised around 43% of total aid to education. Aid to the sub-sector doubled
3 Detailed information can be found at:
http://www.unesco.org/new/fileadmin/MULTIMEDIA/HQ/ED/pdf/gmr2012-report-aid-tables.pdf 4 In the OECD-DAC classification, ‘basic education’ covers pre-primary, primary and basic life skills for
youth and adults.

9
from around US$2.8 billion in 2002 to US$5.8 billion in 2011 (Figure 1). Despite this positive trend, aid to basic education fell between 2010 and 2011, the first time there has been a reduction since the publication of aid disbursement data in 2002. This reduction of 6% is greater than total aid reductions of 3% over the same period (Brookings Institution and UNESCO, 2013).
Despite concerns that the MDG focus on primary education could be at the cost of higher
levels, aid disbursements to secondary education doubled over the decade from US$1.1 billion in 2002 to US$2.2 billion in 2011, although this sub-sector also witnessed a decline between 2010 and 2011. Aid to post-secondary education, which has similarly doubled over the decade, is on par with aid levels to basic education. While aid to higher education can in some circumstances play an important role in supporting capacity development, it unfortunately rarely reaches developing countries. Around three-quarters of aid for tertiary students is spent on the costs of them studying in the donor country, via scholarships and student imputed costs. This spending, which is equivalent to around one-quarter of total direct aid to education, is excluded from OECD-DAC’s definition of ‘real’, or country programmable, aid (UNESCO, 2012).
Figure 1: Total aid disbursements to education, 2002 to 2011
Source: EFA Global Monitoring Report team analysis based on OECD Creditor Reporting System
(2013). The top five bilateral donors to basic education include the United Kingdom, the United States,
Germany, France and Japan (Figure 2). Reflecting the more general trend, three of these reduced their aid to basic education between 2010 and 2011 – the United States, France and Japan. The five largest multilateral donors provide around one-quarter of aid to basic education. Of these, the World Bank and EU Institutions are the largest multilateral donors to basic education, although the EU Institutions reduced their aid to basic education dramatically over the period.

10
Figure 2: Donors to basic education, 2010-2011
Source: EFA Global Monitoring Report team analysis based on OECD Creditor Reporting System
(2013). Aid disbursements by income group: In 2011, lower middle income recipient countries
accounted for the largest proportion of aid disbursed to the education sector (40% of the total), and to the basic education sub-sector (45% of the total). Low income countries, which account for 37% of out-of-school children, received 26% of total aid to education and 32% of total aid disbursed to basic education. Low income countries were hardest hit by the reduction in aid to basic education between 2010 and 2011, facing a reduction of 9% while aid to lower middle income countries increased by 6% over the period (Figure 3).
Figure 3: Total aid allocated to basic education by country income groups, 2010–2011
Source: EFA Global Monitoring Report team analysis based on OECD Creditor Reporting System
(2013).

11
Aid disbursements by region: In 2011, sub-Saharan Africa, which is home to over half of the
world’s out-of-school children, accounted for the largest share of education aid, receiving 27% of aid disbursed to the sector and 30% of aid to the basic education sub-sector (Figure 4). South and West Asia, the second largest recipient of total aid to education (18%), received 25% of aid for basic education in 2011. East Asia and the Pacific received 15% of total aid disbursements to the education sector. The majority of this is to secondary and post-secondary education, with aid disbursements to basic education being only 9% of the total.
Figure 4: Total aid to basic education by region, 2010-2011
Source: EFA Global Monitoring Report team analysis based on OECD Creditor Reporting System
(2013). Although sub-Saharan Africa receives the largest share of aid to education, the largest
recipients of aid to education are countries in South and West Asia and East Asia and the Pacific. Amongst the top recipients are countries with large populations, including China, India, and Pakistan. The United Republic of Tanzania and Ethiopia are the only two African countries to make it into the top 10 recipients of aid to education in 2010 but feature near the bottom of the list.
A similar pattern is true of basic education, except that China is not a top recipient of basic
education aid. Palestine and Jordan receive large volumes of aid to basic education, largely due to disbursements by the UN Agency for the relief of Palestinian refugees (UNWRA). The top recipients of aid to basic education are in South and West Asia. Ethiopia and Mozambique are the only two countries from sub-Saharan Africa, which make it onto the list of countries receiving the most aid to basic education in 2010.
There is a highly variable distribution of aid resources by primary-school aged child amongst
low income countries. The EFA Global Monitoring Report has calculated that it would cost around US$130 per primary-school aged child to provide an acceptable quality of education (UNESCO, 2010). On average, low income countries allocate US$41 per primary school aged child and receive US$16 per child from aid donors. In Afghanistan, for instance, was US$39 per child in 2011; in

12
Chad, however, it made up just US$4 per child despite Chad having some of the poorest education indicators in the world. Kenya and Niger, two countries amongst the 10 with the highest out-of-school populations, receive less than US$10 per primary school aged child (Brookings Institution and UNESCO, 2013).
From the limited information available on non-DAC donors and private contributions to the
education sector, it appears that these are seldom aligned with the education-related MDGs or EFA goals. The contributions of most foundations and corporations are not strategically coordinated with the broader global EFA framework with the majority appearing to be directed towards higher education. In addition, middle income countries attract these donors’ interest more than low income countries. Within the private sector contributions, foundations focus their efforts more on countries most in need while corporations typically disburse to regions of strategic importance to them. Corporations, however, give over four times the resources that philanthropic organisations give to the education sector (UNESCO, 2012). 4. Channels and financial instruments
The Global Partnership for Education (GPE) is the only pooled global funding mechanism for the sector. It was established in 2002 as the EFA Fast Track Initiative, with the goal to accelerate progress towards primary education by promoting sustained increases to aid and more efficient spending, together with sound sector policies and adequate and sustainable domestic financing. While it does not report to OECD-DAC, an assessment of data from its own sources suggest that it has jumped from being the 13th-largest donor in 2007 to being the 5th-largest donor in 2011, when its disbursements were at an all time high. However, the GPE’s funding has been smaller than hoped, and considerably smaller than comparable global funds in health. The 2011 replenishment generated US$1.5 billion for the years between 2011 and 2014, compared with the US$2.5 billion requested (Brookings Institution and UNESCO, 2013).
Multilateral contributions are an important share of total aid to education (Figure 2). Reporting
of these contributions to OECD-DAC is limited to unearmarked sources of financing – meaning those where the multilateral agency decides how they are to be allocated. However, there are also significant earmarked contributions from bilateral agencies channeled through multilateral agencies (e.g., trust funds). These contributions are reported under bilateral aid, as decisions about the purpose of the funds, and often the geographical allocation, are made by the bilateral donor and not the multilateral agency. While some multilateral institutions may account for a relatively small share of total basic education aid as reported by the DAC, they may still manage large basic education programs through earmarked contributions. For example, UNICEF is not one of the largest donors in terms of unearmarked aid. But in practice, it has significant education programmes funded by bilateral donors, which make it the largest recipient of bilateral-to-multilateral funding to basic education (the World Bank being the second largest). 5. Synergies and complementarities among flows
The Education for All movement has encouraged country-led education planning. As national planning processes have been strengthened, donors have also increasingly reported through government systems, rather than parallel systems. There are several cases where donors pooling their funding, and aligning with national education plans have produced impressive results (UNESCO, 2011). There is a danger, however, that donors are now moving away from such approaches towards project-based support which allow results to be attributed directly to them.
Strong global coordination by donors is particularly important in education given that the sector
has a very narrow donor base; in 2011, for instance, the top 10 donors provided almost three-quarters of overall aid to education, and just three donors provided close to one-third of aid to basic education (Brookings Institution and UNESCO, 2013; UNESCO, 2012). In recent years, many bilateral donors have begun to concentrate their aid on fewer partnerships, with nearly all EU donors reducing the number of partner countries under the agreed EU Code of Conduct on Division of Labour and Complementarity. However, the decision by donors on which recipient countries to
13
prioritise and which to withdraw from has essentially been an inward looking process with little or no coordination at the global level. The Netherlands, for example, was amongst the top three donors to basic education over the past decade and decided to cut its aid to education in 2011 due to changing political and strategic priorities. This has not led to other aid donors filling the gap in countries from which the Netherlands has withdrawn its support, however. In Bolivia, Burkina Faso and Zambia, for example, both Denmark and the Netherlands are terminating education aid simultaneously, despite having been significant donors to these countries (GPE, 2013).
6. Challenges for the future
Domestic financing is the most important aspect of education financing. Widening the tax base and ensuring an appropriate share of public spending is allocated to education would significantly increase resources to the sector. However, poor countries are unlikely to be able to afford all the costs of education for the foreseeable future, particular given the financial needs associated not only with expanding access to education but also to improving educational quality. Aid is likely to remain an important component of financing for these countries. The recent reduction in aid to education urgently needs reversing.
The education sector appears not to be benefiting from resources from emerging donors and
private organisations to the same extent as other sectors, notably health. There is a need to identify innovations in supporting education through these sources, while making sure these sources are allocated to the benefit of education for all.
Finally, to get a more complete picture of resources for education, and whether they are being
allocated to support those most in need, national education accounts should be developed (as already happens in the health sector) which draw together information across different sources – including public spending, DAC and non-DAC aid donors, the private sector, as well as households. References
Brookings Institution and UNESCO (2013) Financing for Global Education: Opportunities for Multilateral Action. A report prepared for the UN Special Envoy for Global Education for the High-level Roundtable on Learning for All: Coordinating the Financing and Delivery of Education. Washington, DC / Paris: Center for Universal Education at the Brookings Institution / Education for All Global Monitoring Report.
GPE (2013) 2012 Pledge Monitoring Report. Washington, DC: Global Partnership for
Education. UNESCO (2010) Reaching the Marginalized - 2010 Education for All Global Monitoring
Report. Paris: UNESCO UNESCO (2011) Beyond Busan: Strengthening aid to improve education outcomes. Education
for All Global Monitoring Report Policy Paper 2. Paris: UNESCO UNESCO (2012) Youth and Skills: Putting Education to Work - 2012 Education for All Global
Monitoring Report. Paris: UNESCO UNESCO (2013) Schooling for millions of children jeopardized by reductions in aid.
Education for All Global Monitoring Report Policy Paper 9. Paris: UNESCO

14
Chapter 2 Sustainable Financing for Health5
1. Introduction
Achieving consensus on a common boundary of health care activities is crucial for the complex task of international comparisons and the System of Health Accounts (SHA) was developed for this purpose. It provides a functional approach based on selected health care activities that can be captured by transactions. Transactions are valued activities that take place between different actors or organisations. The transactions recorded in the SHA accounting framework relate to health care goods and services provided and consumed to improve the health status of individuals and of the population as a whole. It has to be emphasized that health itself is a condition, and is therefore not exchangeable, in contrast to health care. Health has value in use and not in exchange. Therefore, in health accounts, it is the demand, supply and distribution of health care goods and services, rather than health per se, that define the transactions measured.6 The first version of SHA was updated during the period 2009-2011 as a joint exercise of the OECD (which published the first SHA), WHO and EUROSTAT with inputs from many other agencies including the World Bank.
SHA is used as the basis for collection and recording of national health expenditures. This includes expenditure from sources external to the country that are spent in the country. WHO collates, analyses, and updates health expenditure data from its 194 Member States each year after consultation with national authorities. A comparable series is available from 1995. The data and meta-data are available in a publicly accessible database (http://apps.who.int/nha/database/DataExplorerRegime.aspx) and the data are also used by the World Bank and UNDP in their publications.
In many countries it is not possible to obtain data on domestic health expenditures originating from external sources by donor. For this, the most commonly used source is the OECD’s Development Cooperation Directorate (DAC) Creditor Reporting System (CRS) data base. Donors report on their expenditures by sector, including on health and population7. General budget support, some of which may be used for health, is reported separately in the CRS and is not included in the analysis in subsequent sections. Donors initially reported only on their commitments, which are not necessarily intended to be disbursed or spent in the year the commitment is made. A series on disbursements is now also available with most DAC donors reporting since 2005. A portion of disbursements is not intended to be sent to a recipient country so a third series, called country programmable aid (CPA), has been available only since 2004. Even then, there frequently are discrepancies between the totality of what donors say they have disbursed in CPA to a particular country and the external funds that appear in domestic health accounts reporting. This is partly because components of CPA are not for the designated recipient country to spend itself, but can cover expenditure by the donor country, sometimes in the donor country, that is somehow linked to the recipient country. The other reason is that not all donors report to the DAC.
In addition to the 25 bilateral DAC donors that are members of OECD and that are mandated to
report to the OECD, 24 non-DAC bilateral donors currently report their aid flows to DAC
5 Prepared by David B. Evans and Nathalie Van de Maele, Department of Health Systems Governance and
Financing, WHO, Geneva. 6 Chapter 4 “Global boundaries of health care” of the System of Health Accounts 2011.
(http://www.who.int/nha/sha_revision/sha_2011_final1.pdf) 7 Purpose code used: HEALTH (Health policy and administrative management, Medical education/training,
Medical research, Medical services, Basic health care, Basic health infrastructure, Basic nutrition, Infectious disease control, Health education, Malaria control, Tuberculosis control, Health personnel development) + part of POPULATION POLICIES/PROGRAMMES AND REPRODUCTIVE HEALTH (Reproductive health care, Family planning, STD control including HIV/AIDS, Personnel development for population and reproductive health).

15
voluntarily, but only 2 with sufficient detail to allow their reported disbursement to be broken down by sector. The Bill and Melinda Gates Foundation is the only foundation to report voluntarily to the OECD on health disbursements, and it has done so only since 2011 (with data from 2009). However, a number of emerging donors, such as the BRICS countries, donors from the Middle East, OECD countries that are not DAC members such as the Czech Republic and Turkey, and a number of foundations active in health do not report to the OECD. The Institute of Health Metrics Evaluation (IHME) at the University of Washington has made an attempt to identify flows from these sources to supplement the data in the CRS. Their most recent data suggests that in 2011 global disbursements were 23% higher than those reported in the CRS, although it is difficult to validate these claims. Moreover, many of the additional sources that the IHME says it captured do not identify the recipient of their funds so the OECD data remain the source of choice. In the following sections, when we report on expenditures that can be identified at country level through health accounts we use the WHO Global Health Expenditure database. When we report on donor flows to countries, or to particular activities, for health and population, we rely on the OECD DAC-CRS data base. 2. Sources of flows to sector
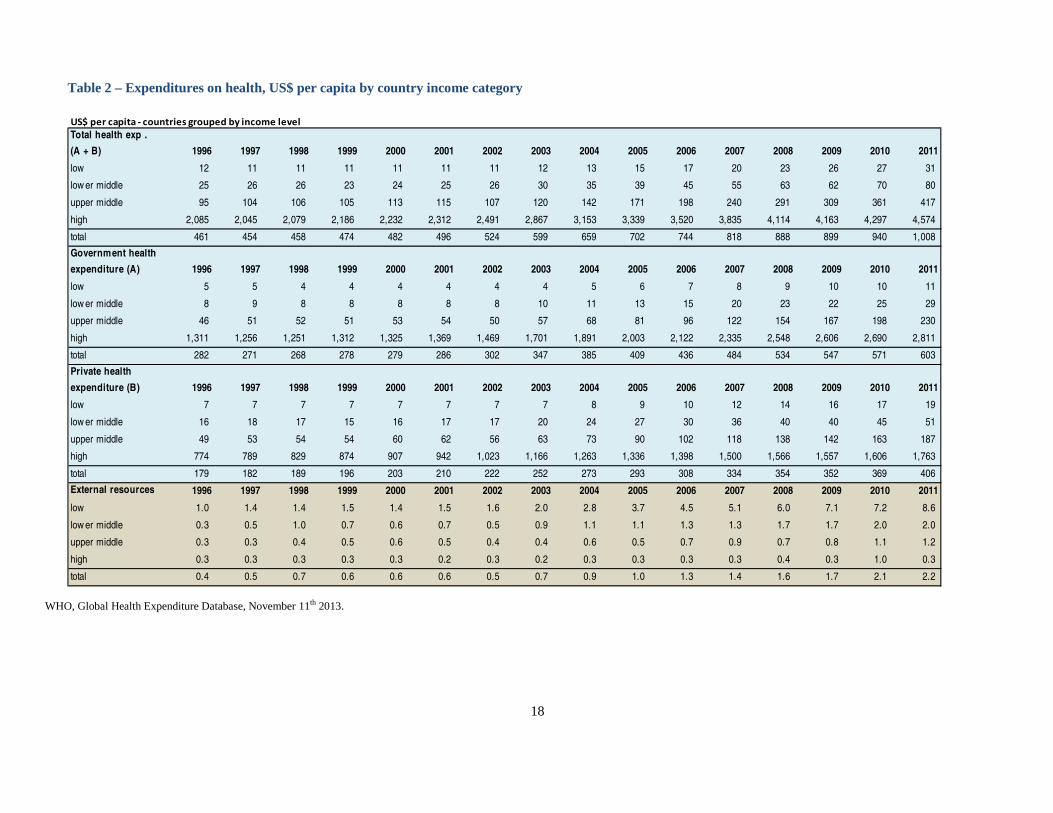
Health accounts based on SHA show total expenditure on health in a country as the sum of government and private health expenditure. Government expenditure could be further broken into funding through compulsory insurance mechanisms and other types of government expenditure although we report only total government expenditure here. Tables 1&2 show trends since 1996 in total health expenditures (and the components of government and private expenditures) and total health expenditures per capita for low, lower- and upper-middle, and high income countries separately (using the World Bank’s country categorization of 2013). Expenditures are in millions of current US dollars converted at official exchange rates.
Global spending on health in 2011 was almost US$ 7 trillion. The vast majority (82.6%) was
spent in the high income countries. Spending, however, increased most rapidly in upper middle income countries over the period (increasing five-fold), followed by lower middle income (a 4 fold increase), low income (more than 3 fold) and then high income countries (more than doubling). Health expenditure per capita also increased most rapidly in upper-middle income countries (more than quadrupling over the period) followed by lower-middle income countries (more than tripling). However, the higher rates of population growth in low income countries means that the increase in per capita health spending was only slightly higher in low than high income countries (more than doubling in each case).
Private spending accounted for around 63% of all health spending in low and lower-middle
income countries as a group in 2011, compared to 45% and 39% in upper-middle and high income countries. The bulk of private spending in low and lower-middle income countries is derived from direct out-of-pocket payments levied at the time patients seek care (86%). This has been shown consistently to deter people from seeking or continuing needed treatment, and to result in severe financial hardship, even impoverishment, for many of those who seek care.8 The incidence of financial catastrophe linked to out of pocket payments falls to negligible levels only when the share of out of pocket payments falls below around 20% of total health expenditures, so an objective of health financing policy is frequently to reduce the reliance on out of pocket payments through increased prepayment and pooling.9 This would result in an increasing Proportion of funding coming from compulsory prepayment and pooling (e.g. total government spending), but this trend can be observed only in the middle income countries over the period (Table 1).
Some of the increased health expenditure observed over the period came from sources external
to the countries in which they were spent. Tables 1 & 2 also show trends in externally sourced
8 WHO. The World Health Report 2010. Health System Financing: the Path to Universal Coverage, Geneva,
WHO, 2010. 9 ibid

16
expenditures that can be tracked at country level. For most countries it is not possible to identify the proportion channeled through government versus the private sector, so we report the total separately. Note, however, that these external funds form part of the total health expenditures reported in the other parts of the table, so the amounts cannot be summed.
Expenditure from external sources grew more rapidly than overall expenditures, particularly
since the Millennium Declaration, with its heavy emphasis on health, was signed in 2000. As a result the share of total expenditure derived from external sources increased substantially in low income countries – from just over 12% in 2000 to more than 27% in 2011 (table 1). These are weighted averages, derived by summing all aid arriving in all the low income countries and dividing by sum of the total health expenditures in those countries. The simple average share of external sources in total expenditure across the countries is higher at 34% reflecting that one large low income country, Bangladesh, receives relatively lower contributions than many of the smaller countries. Six low income countries derived more than 50% of their total expenditures from external sources in 2011.
Despite the greater percentage rise in externally sourced funding for health in low income
countries, the bulk of the increased funding in dollar terms still came from domestic sources. A little over $11.3 billion of the $17.5 billion increase in health spending in the group of low income countries as a whole came from domestic sources.
Only where countries routinely undertake health accounts exercises with considerable detail is
it possible to identify the sources of external funds actually being spent in the countries. For a majority of countries we are forced to turn to the OECD CRS data base as described earlier which provides details of disbursements as reported by donors. Sometimes they also link these disbursements to individual recipient countries, discussed subsequently. Details are provided in Table 3 where we also show total disbursements estimated by the Institute of Health Metrics Evaluation. The starting year is 2002 when a reliable series on disbursements covering most donors began. Although IHME reports disbursements for earlier years, they are estimates based on the relationship between commitments and disbursements for subsequent years, a relationship that is not very strong so that estimates of disbursements must have wide uncertainty intervals.

17
Table 1 – Expenditures on health, US$ millions by country income category
Million US$ - countries grouped by income level
Total health exp .
(A + B) 1996 1997 1998 1999 2000 2001 2002 2003 2004 2005 2006 2007 2008 2009 2010 2011
low 6,746 6,554 6,410 6,511 7,072 7,072 6,898 7,866 9,077 10,440 12,235 14,389 17,320 19,517 21,116 24,284
lower middle 48,299 52,582 52,178 48,391 50,929 53,558 56,343 66,387 77,609 89,619 103,939 129,789 149,019 150,069 172,499 198,661
upper middle 197,065 218,175 225,253 225,803 246,104 252,782 235,792 268,309 318,532 386,519 452,024 551,733 675,682 722,091 850,348 990,087
high 2,400,805 2,367,071 2,419,199 2,555,911 2,624,179 2,733,382 2,962,334 3,428,587 3,793,484 4,040,142 4,286,918 4,704,299 5,082,437 5,174,981 5,374,593 5,758,628
total 2,652,914 2,644,383 2,703,041 2,836,616 2,928,283 3,046,794 3,261,367 3,771,150 4,198,701 4,526,720 4,855,116 5,400,211 5,924,457 6,066,658 6,418,556 6,971,659
Government health
expenditure (A) 1996 1997 1998 1999 2000 2001 2002 2003 2004 2005 2006 2007 2008 2009 2010 2011
low 2,763 2,673 2,472 2,299 2,606 2,684 2,511 2,971 3,400 3,914 4,741 5,500 6,643 7,657 7,869 9,012
lower middle 16,274 17,265 17,152 16,663 17,342 17,912 18,439 21,302 24,549 28,606 35,584 45,811 53,770 53,820 61,192 72,435
upper middle 95,773 107,280 110,017 109,669 115,747 117,890 111,050 128,051 153,764 183,000 219,061 280,895 356,531 390,649 466,544 546,389
high 1,509,586 1,453,663 1,454,864 1,534,140 1,557,441 1,619,057 1,746,535 2,034,059 2,274,474 2,424,087 2,583,977 2,864,826 3,147,728 3,239,901 3,365,420 3,538,901
total 1,624,397 1,580,880 1,584,505 1,662,770 1,693,136 1,757,544 1,878,535 2,186,383 2,456,187 2,639,607 2,843,362 3,197,032 3,564,672 3,692,028 3,901,025 4,166,738
Private health
expenditure (B) 1996 1997 1998 1999 2000 2001 2002 2003 2004 2005 2006 2007 2008 2009 2010 2011
low 3,982 3,881 3,939 4,212 4,466 4,387 4,387 4,895 5,677 6,526 7,494 8,889 10,677 11,861 13,247 15,271
lower middle 32,025 35,318 35,025 31,728 33,587 35,645 37,904 45,085 53,061 61,014 68,355 83,979 95,249 96,249 111,307 126,225
upper middle 101,292 110,896 115,236 116,134 130,357 134,892 124,742 140,259 164,767 203,519 232,964 270,838 319,150 331,441 383,804 443,698
high 891,219 913,408 964,335 1,021,772 1,066,738 1,114,325 1,215,799 1,394,528 1,519,010 1,616,055 1,702,941 1,839,473 1,934,708 1,935,080 2,009,173 2,219,726
total 1,028,518 1,063,503 1,118,535 1,173,845 1,235,147 1,289,250 1,382,833 1,584,767 1,742,515 1,887,114 2,011,753 2,203,180 2,359,785 2,374,630 2,517,531 2,804,921
External resources 1996 1997 1998 1999 2000 2001 2002 2003 2004 2005 2006 2007 2008 2009 2010 2011
low 559 828 804 875 855 944 1,046 1,353 1,932 2,566 3,200 3,699 4,425 5,316 5,519 6,732
lower middle 594 1,003 1,930 1,438 1,224 1,492 1,103 1,896 2,366 2,540 2,933 3,147 3,938 4,044 4,825 4,987
upper middle 710 686 948 1,102 1,280 1,113 921 865 1,260 1,227 1,694 1,994 1,721 1,951 2,655 2,864
high 398 328 343 363 295 286 298 271 322 318 397 364 543 361 1,307 395
total 2,260 2,845 4,025 3,779 3,654 3,835 3,369 4,385 5,880 6,651 8,224 9,204 10,627 11,672 14,306 14,978
18
Table 2 – Expenditures on health, US$ per capita by country income category US$ per capita - countries grouped by income level
Total health exp .
(A + B) 1996 1997 1998 1999 2000 2001 2002 2003 2004 2005 2006 2007 2008 2009 2010 2011
low 12 11 11 11 11 11 11 12 13 15 17 20 23 26 27 31
low er middle 25 26 26 23 24 25 26 30 35 39 45 55 63 62 70 80
upper middle 95 104 106 105 113 115 107 120 142 171 198 240 291 309 361 417
high 2,085 2,045 2,079 2,186 2,232 2,312 2,491 2,867 3,153 3,339 3,520 3,835 4,114 4,163 4,297 4,574
total 461 454 458 474 482 496 524 599 659 702 744 818 888 899 940 1,008
Government health
expenditure (A) 1996 1997 1998 1999 2000 2001 2002 2003 2004 2005 2006 2007 2008 2009 2010 2011
low 5 5 4 4 4 4 4 4 5 6 7 8 9 10 10 11
low er middle 8 9 8 8 8 8 8 10 11 13 15 20 23 22 25 29
upper middle 46 51 52 51 53 54 50 57 68 81 96 122 154 167 198 230
high 1,311 1,256 1,251 1,312 1,325 1,369 1,469 1,701 1,891 2,003 2,122 2,335 2,548 2,606 2,690 2,811
total 282 271 268 278 279 286 302 347 385 409 436 484 534 547 571 603
Private health
expenditure (B) 1996 1997 1998 1999 2000 2001 2002 2003 2004 2005 2006 2007 2008 2009 2010 2011
low 7 7 7 7 7 7 7 7 8 9 10 12 14 16 17 19
low er middle 16 18 17 15 16 17 17 20 24 27 30 36 40 40 45 51
upper middle 49 53 54 54 60 62 56 63 73 90 102 118 138 142 163 187
high 774 789 829 874 907 942 1,023 1,166 1,263 1,336 1,398 1,500 1,566 1,557 1,606 1,763
total 179 182 189 196 203 210 222 252 273 293 308 334 354 352 369 406
External resources 1996 1997 1998 1999 2000 2001 2002 2003 2004 2005 2006 2007 2008 2009 2010 2011
low 1.0 1.4 1.4 1.5 1.4 1.5 1.6 2.0 2.8 3.7 4.5 5.1 6.0 7.1 7.2 8.6
low er middle 0.3 0.5 1.0 0.7 0.6 0.7 0.5 0.9 1.1 1.1 1.3 1.3 1.7 1.7 2.0 2.0
upper middle 0.3 0.3 0.4 0.5 0.6 0.5 0.4 0.4 0.6 0.5 0.7 0.9 0.7 0.8 1.1 1.2
high 0.3 0.3 0.3 0.3 0.3 0.2 0.3 0.2 0.3 0.3 0.3 0.3 0.4 0.3 1.0 0.3
total 0.4 0.5 0.7 0.6 0.6 0.6 0.5 0.7 0.9 1.0 1.3 1.4 1.6 1.7 2.1 2.2
WHO, Global Health Expenditure Database, November 11th 2013.

19
Table 3: Trends in Development Assistance for Health: Disbursements
FLOWS 2002 2003 2004 2005 2006 2007 2008 2009 2010 2011
Official Development Assistance 4,131 5,345 6,498 9,057 10,581 13,048 14,896 16,538 17,943 19,067DAC Countries 2,700 3,719 4,112 5,996 7,119 8,435 10,009 10,900 11,413 12,507
Memo: Private Donors (BMGF)
Multilateral 1,431 1,627 2,386 3,061 3,462 4,613 4,887 5,536 6,455 6,481
Non-DAC Countries 103 75 80
Other Official Flows (non Export Credit) 540 1,292 550 541 486 517 733 992 2,127 1,530DAC Countries 38 6 30 3 3
Memo: Private Donors (BMGF)
Multilateral 540 1,291 512 535 486 517 703 990 2,124 1,530
Non-DAC Countries
Private Grants 1,516 1,394 1,723DAC Countries
Memo: Private Donors (BMGF) 1,516 1,394 1,723
Multilateral
Non-DAC Countries
TOTAL 4,671 6,637 7,048 9,598 11,067 13,565 15,629 19,047 21,463 22,320 IHME total 12,440 13,258 14,602 16,813 18,412 21,277 24,724 25,445 28,160 27,433
OECD DAC CRS database (http://stats.oecd.org/Index.aspx?datasetcode=CRS1). November 11th 2013. IHME “Financing Global Health 2012: The End of the Global Age?” Data and Methods (http://www.healthmetricsandevaluation.org/publications/policy-report/financing-global-health-2012-end-golden-
age#/data-methods).

20
Comparison of tables 1 and 3 suggests that US$ 7.34 billion of the disbursements reported by donors
(based on the US$22.32 billion in the CRS) does not arrive in countries in a form for them to spend, at least in the year in which the disbursements are made. This might be partly attributable to the less than complete data available for many countries but, as explained earlier, some aid funds are not intended to be spent in recipient countries and are used for such activities as research or technical support funded in or from the donor country.
Table 3 shows the increasing importance of the Bill and Melinda Gates Foundation, recorded under
“private grants memo”. It started reporting to the OECD only in 2011 with data starting 2009, and accounted for between 6.5% and 8.0% of all disbursements in the three most recent years. The line on “other official flows: non-export credit10” refers largely to funding from development banks such as IBRD, IDB, EBRD, AsDB, and AfDB. The relative importance of these flows fluctuated from a low of 3.8% in 2007 to a high of 19.5% in 2003. It was just under 7% in 2011. Although 24 non-OECD countries reported their disbursements on overall aid, only 2 provided data with enough detail to identify their disbursements on health (and population), and they accounted for less than 1% of all health disbursements since 2009.
Traditional bilateral assistance from the OECD-DAC countries accounted for the highest proportion
of disbursements over the period, at just under 60%, fluctuating from a low of 53.2% (2010) to a high of 64.3% (2006). The US government is the largest bilateral donor to the health sector in dollar terms followed by the UK and Canada (Table 4).11 The data reported for the individual bilateral donors in table 4 exclude funds transferred from donor countries to multilateral agencies which appear as multilateral funding. The table also shows the increasing contributions played by the Global Fund (GFATM) and the GAVI Alliance, which have started reporting to the OECD only in recent years. They jointly contributed almost 18% of total disbursements in 2011.12 Table 4 – Largest individual donors, disbursements to health and population, US dollars million ODA by Donor (million US$) 2002 2003 2004 2005 2006 2007 2008 2009 2010 2011
All Donors, Total 4,131 5,345 6,498 9,057 10,581 13,048 14,896 16,538 17,943 19,067
of which Bilateral DAC countries 2,700 3,719 4,112 5,996 7,119 8,435 10,009 10,900 11,413 12,507
of which USA 1,224 1,676 1,631 2,989 3,460 4,129 5,287 6,066 6,358 7,129
of which UK 416 376 452 645 878 1,094 1,001 1,088 1,212 1,504
of which Canada 60 100 169 296 213 413 407 432 447 667
of which Australia 82 98 107 120 177 175 200 225 333 473
of which Germany 98 179 232 212 248 348 404 423 475 406
of which France 132 178 238 251 276 96 346 336 416 197
of which multilateral 1,431 1,627 2,386 3,061 3,462 4,613 4,887 5,536 6,455 6,481
of which GFATM 216 584 1,006 1,254 1,627 2,172 2,337 3,031 2,647
of which GAVI 885 676 413 699 748
of which WHO 418 357 437
OECD DAC CRS, November 11th 2013.
10 Transactions by the official sector with countries on the DAC List of ODA Recipients which do not meet the
conditions for eligibility as Official Development Assistance, either because they are not primarily aimed at development, or because they have a grant element of less than 25 per cent.
11 The contributions of donors in terms of GDP are very different showing that Luxembourg, Ireland, Norway, and Sweden have been the largest donors to health sector over the past 10 years (2002-2011).
12 WHO is not traditionally seen as a funding agency. The recent funding passing through WHO is for polio eradication.

21
3. Uses of flows within sector Some countries receive more aid than others. Table 5 shows the top 10 recipients in terms of US dollars
per capita for the period 2002 to 2010 from two different series. The first is WHO’s Global Health Expenditure database which tracks funding that arrives in countries for them to spend. The second is the disbursement series of the OECD, disbursements which donors link to particular countries. There is considerable, though not complete overlap between the two series.
Table 5. Top 10 development assistance for health countries in terms of US$ per capita, by
data source, 2002-10
Expenditure (GHED) Disbursements (OECD DAC
CRS)
Country US$/
capita Country US$/
capita
Namibia 353 Botswana 389
Botswana 303 Namibia 321
Zambia 167 Zambia 207
Rwanda 130 Swaziland 187
Swaziland 119 Rwanda 172
Malawi 116 Malawi 136
Lesotho 84 Mozambique 132
United Republic of Tanzania 76 Lesotho 121
Uganda 74 Liberia 109
Gambia 70 Uganda 108
Source: Van de Maele et al. 2013.13 At the same time, a number of countries received relatively little development assistance for health.
Mauritius, received the lowest allocation at only US$3 per capita over the period, but it is an upper middle income country. Guinea, the Central African Republic and the Democratic Republic of Congo did not fare much better, receiving $16, $17 and $25 per capita in turn, while at the same time being among the poorest countries in the world.14 Botswana and Namibia, receiving the most donor assistance in health per capita have GDP’s per capita at least 10 times those of Guinea, Central African Republic and the Democratic Republic of Congo. The lack of correspondence between need (in terms of GDP per capita) and development assistance for health flows is considered again in section 5.
13 Van de Maele, N., D.B. Evans & T. Tan-Torres Edejer. “Development assistance for health in Africa: are we
telling the right story?”, Bulletin of the World Health Organization, 91(7): 483-490, 2013. 14 ibid

22
Reported disbursements of official development assistance (bilateral and multilateral aid) for health by region and country income group are shown in Table 6. The highest proportions are allocated to Africa among regions, and to low income countries by country income grouping.
Table 6 – ODA by region and income groups:
OECD DAC CRS, November 11th 2013. Few countries routinely report their health accounts with enough detail to identify the areas in which their
funds are spent. This prevents an assessment of trends in the use of health expenditures over time for a large enough set of countries to include here. Some information is available on where bilateral and multilateral donors channel their funds in the OECD-DAC CRS database. Table 7 shows that the greatest proportion of official development assistance is allocated to the control of sexually transmitted diseases, largely HIV/AIDS – over 40% in recent years. Three diseases – HIV/AIDS, tuberculosis and malaria accounted for over 52% of all disbursements in 2011.
Table 7 – Official Development Assistance by health sub-sector
ODA by health sub-sector (million US$) 2002 2003 2004 2005 2006 2007 2008 2009 2010 2011
13040: Std control including hiv/aids 843 1,434 1,985 3,051 3,896 5,089 6,259 6,595 7,201 7,794
12220: Basic health care 670 642 744 1,031 1,333 1,881 2,281 1,933 2,317 2,391
12110: Health policy & admin. management 990 1,169 1,406 1,488 1,584 1,461 1,435 1,558 1,614 1,792
13020: Reproductive health care 283 433 394 521 523 585 890 1,152 1,258 1,445
12262: Malaria control 25 75 156 325 443 497 899 1,480 1,607 1,353
12250: Infectious disease control 553 562 698 917 1,104 1,690 1,138 1,234 1,061 1,177
12263: Tuberculosis control 15 57 122 152 213 312 412 492 787 784
13030: Family planning 286 298 107 257 205 252 385 520 492 585
12191: Medical services 144 175 235 200 198 219 203 324 349 419
12240: Basic nutrition 107 200 160 125 166 223 234 396 366 406
12230: Basic health infrastructure 106 147 138 607 393 419 347 457 423 344
12182: Medical research 25 26 227 253 400 246 193 171 194 256
12181: Medical education/training 22 45 46 51 50 70 77 73 110 113
12281: Health personnel development 23 33 40 26 28 60 82 88 89 93
12261: Health education 38 44 38 48 41 39 55 55 65 84
13081: Personnel dvpt: pop. & repro health 0 5 1 5 4 7 8 12 9 32
OECD DAC CRS, November 11th 2013.
million US$ 2002 2003 2004 2005 2006 2007 2008 2009 2010 2011
Africa, Total 1,360 2,180 3,106 3,779 4,647 5,693 7,548 8,161 8,834 9,486
Asia, Total 1,362 1,400 1,807 2,624 2,848 3,318 3,308 3,717 4,172 4,180
America, Total 238 402 454 568 633 721 878 894 918 976
Oceania, Total 78 95 126 149 141 141 170 205 205 299
Europe, Total 66 79 76 301 208 193 197 215 241 236
unidentified 1,027 1,189 930 1,637 2,105 2,982 2,795 3,347 3,573 3,890
LDCs, Total 1,084 1,730 2,344 3,091 3,572 4,287 5,503 5,652 6,690 7,207
Other LICs, Total 120 201 258 332 446 568 659 768 1,000 1,042
LMICs, Total 1,344 1,430 1,959 2,732 2,899 3,381 3,606 4,013 4,183 4,324
UMICs, Total 375 521 653 766 1,074 1,290 1,638 1,828 1,648 1,694
unidentified 1,208 1,463 1,284 2,137 2,590 3,523 3,489 4,278 4,422 4,801
23
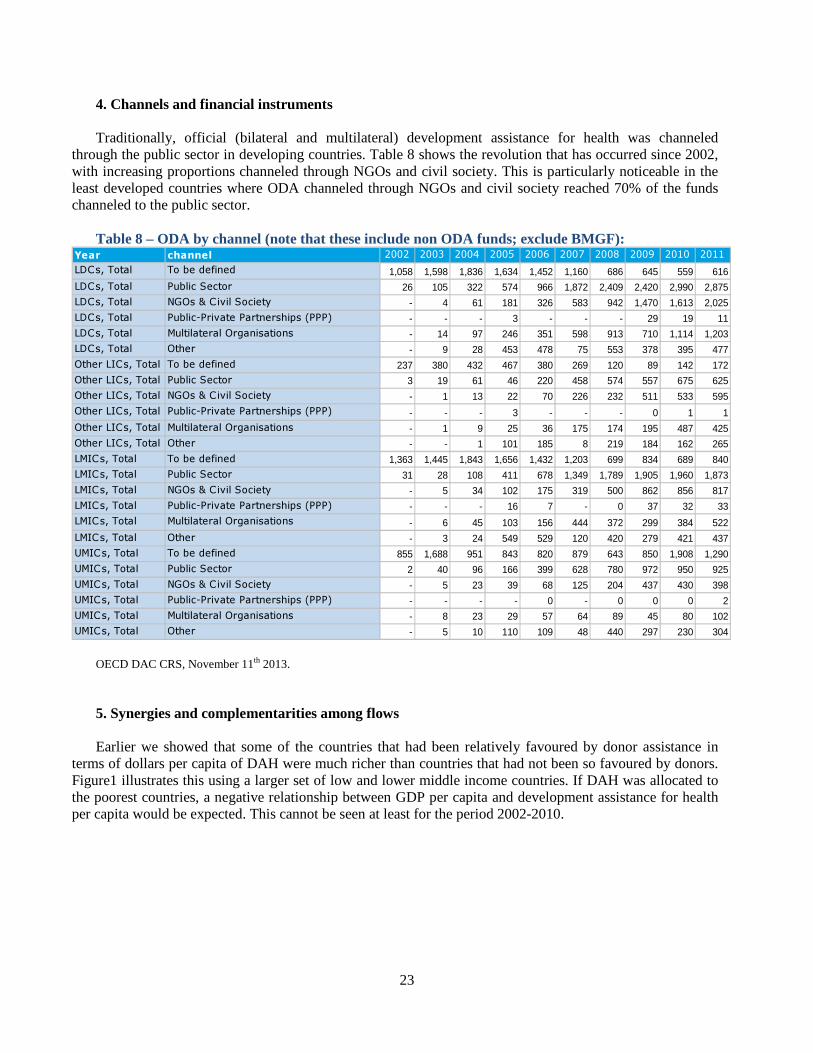
4. Channels and financial instruments Traditionally, official (bilateral and multilateral) development assistance for health was channeled
through the public sector in developing countries. Table 8 shows the revolution that has occurred since 2002, with increasing proportions channeled through NGOs and civil society. This is particularly noticeable in the least developed countries where ODA channeled through NGOs and civil society reached 70% of the funds channeled to the public sector.
Table 8 – ODA by channel (note that these include non ODA funds; exclude BMGF):
Year channel 2002 2003 2004 2005 2006 2007 2008 2009 2010 2011
LDCs, Total To be defined 1,058 1,598 1,836 1,634 1,452 1,160 686 645 559 616
LDCs, Total Public Sector 26 105 322 574 966 1,872 2,409 2,420 2,990 2,875
LDCs, Total NGOs & Civil Society - 4 61 181 326 583 942 1,470 1,613 2,025
LDCs, Total Public-Private Partnerships (PPP) - - - 3 - - - 29 19 11
LDCs, Total Multilateral Organisations - 14 97 246 351 598 913 710 1,114 1,203
LDCs, Total Other - 9 28 453 478 75 553 378 395 477
Other LICs, Total To be defined 237 380 432 467 380 269 120 89 142 172
Other LICs, Total Public Sector 3 19 61 46 220 458 574 557 675 625
Other LICs, Total NGOs & Civil Society - 1 13 22 70 226 232 511 533 595
Other LICs, Total Public-Private Partnerships (PPP) - - - 3 - - - 0 1 1
Other LICs, Total Multilateral Organisations - 1 9 25 36 175 174 195 487 425
Other LICs, Total Other - - 1 101 185 8 219 184 162 265
LMICs, Total To be defined 1,363 1,445 1,843 1,656 1,432 1,203 699 834 689 840
LMICs, Total Public Sector 31 28 108 411 678 1,349 1,789 1,905 1,960 1,873
LMICs, Total NGOs & Civil Society - 5 34 102 175 319 500 862 856 817
LMICs, Total Public-Private Partnerships (PPP) - - - 16 7 - 0 37 32 33
LMICs, Total Multilateral Organisations - 6 45 103 156 444 372 299 384 522
LMICs, Total Other - 3 24 549 529 120 420 279 421 437
UMICs, Total To be defined 855 1,688 951 843 820 879 643 850 1,908 1,290
UMICs, Total Public Sector 2 40 96 166 399 628 780 972 950 925
UMICs, Total NGOs & Civil Society - 5 23 39 68 125 204 437 430 398
UMICs, Total Public-Private Partnerships (PPP) - - - - 0 - 0 0 0 2
UMICs, Total Multilateral Organisations - 8 23 29 57 64 89 45 80 102
UMICs, Total Other - 5 10 110 109 48 440 297 230 304
OECD DAC CRS, November 11th 2013. 5. Synergies and complementarities among flows Earlier we showed that some of the countries that had been relatively favoured by donor assistance in
terms of dollars per capita of DAH were much richer than countries that had not been so favoured by donors. Figure1 illustrates this using a larger set of low and lower middle income countries. If DAH was allocated to the poorest countries, a negative relationship between GDP per capita and development assistance for health per capita would be expected. This cannot be seen at least for the period 2002-2010.

24
Figure 1: Development Assistance for Health per capita versus GDP per capita, 2002-2010
6. Challenges for the future Despite rapid increases in development assistance for health since 2000, around 70% of all health
spending still comes from domestic sources even in low income countries. As yet, however, they are unable to finance universal coverage with even a minimum level necessary health services. The background papers prepared for the High Level Task Force on Innovative Financing for Health Systems estimated that, to ensure universal coverage with a minimum set of health interventions, the average low-income country would need to find $60 per capita by 2015. Elovainio and Evans recently showed that even with high rates of economic growth, 32 of 49 vulnerable countries would not be able to reach this level of spending from domestic sources assuming current levels of external assistance remain the same.15 When it is considered that this is the barest minimum of health services and that the calculations assume that all health spending will be on this set of efficient services, the reality is that considerably higher amounts of spending will be required.
Domestic growth can contribute, but more external funding will also be required. A major concern at the
moment is that many bilateral donors are reducing their aid commitments. Some have also reduced their disbursements to health and others have recently said that they will not keep trying to achieve the target of 0.7% of GNI in the near future.
A second issue relates to the fact that aid flows are so heavily biased towards three communicable
diseases. Funding for these diseases is critical. The concern is the neglect of other conditions, particularly non-communicable diseases and injuries. Even in the low income countries, non-communicable diseases and injuries now account for over 50% of the burden of disease, and they are becoming diseases of the poor as they are in high income countries.
15 Elovainio, R. & D.B. Evans. “Raising and spending domestic money for health”, Chatham House Working Group
on Finance, Paper 2, May 2013. http://www.chathamhouse.org/sites/default/files/public/Research/Global%20Health/0513_healthfinance.pdf
0
5,000
10,000
15,000
20,000
25,000
30,000
0 50 100 150 200 250 300
GD
P (
US
$ p
erc
ap
ita
)
DAH (US$ per capita)
2002-2010 - low and lower middle income
countries (2002-2010 per capita)
WHO Global Health Expenditure Database

25
The third issue is the increased importance of NGOs and civil society as recipients of aid funding. Considerable attention has been given to increasing transparency and reducing corruption and waste in the public sector over the last 10 years, but it is also important to ensure similar levels of probity with the very large sums of development assistance for health now being channeled through non-government actors.
A final issue is the heavy reliance on direct out-of-pocket payments in low income countries as a source
of domestic financing for health. This means that perhaps a billion of the world’s poor do not seek the care they need each year, and around 100 million of those that do are pushed into poverty as a result of having to pay at the point of service. While this is not directly a problem of external aid flows, external assistance could be designed to help countries move from direct out of pocket payments to forms of prepayment and pooling rather than developing mechanisms for channeling funds to countries, holding them in the country, auditing them and monitoring their use.

26
Chapter 3 Financial flows in infrastructure sectors
1. Introduction
In order to foster sustainable development, more and greener infrastructure is needed in the developing world. Investments in sectors like (i) energy, (ii) information and communication technologies (ICT), (iii) transport, and (iv) water and sanitation including irrigation can spur economic growth while serving the poor by providing them with better access to basic services. Given the long-life span of infrastructure, investments need to be made in low-carbon and resilient infrastructure if the development they foster is to be sustainable.
The supply of infrastructure finance appears to be far short of need, resulting in a significant investment gap. However, the magnitude of this gap is difficult to estimate given a lack of data on current investments and financial flows. In order to understand how to close this gap a better understanding of current investments, potential sources of funding and financing mechanisms is needed.
In the absence of harmonized cross-country data on infrastructure investments, we do not know how much is really spent in which sectors, through which channels and by whom. Few governments report public spending in a way that would allow identifying infrastructure spending, let alone disaggregating it between operation and maintenance spending and capital expenditure (i.e. investments). In addition, a larger share of infrastructure finance comes from sub-national governments, state-owned enterprises, private investors and operators often through special financing arrangements with institutional funds and development banks. Therefore, standardized data from very different sources would be needed.
With the notable exception of Sub-Saharan Africa, limited data is available on how much is actually spent for infrastructure in developing countries. The International Transport Forum reports capital and maintenance expenditure for roads, railways, waterways, and seaports, Global IHS Insights reports data for power and telecommunication spending and Global Water Intelligence for water and sanitation. Most of this data is, however, only reported for developed countries.
The African Infrastructure Country Diagnostics (AIC D) was a major effort to systematically build an infrastructure data base, covering both public and private actors, service quantity and quality, operation and maintenance, and capital expenditure, compiling data for 24 Sub-Saharan African countries for 2001-2006 (Foster & Briceno-Garmendia, 2010). The dataset has not been updated since.
The Infrastructure Consortium for Africa (ICA) rece ntly started collecting data officially reported by its member countries in 2010-2012 (ICA, 2013). However, this data suffers from shortcomings such as potential double-counting, no differentiation between capital expenditure and operation and maintenance spending, and under-reporting on investments from the private sector.
The World Bank’s Private Participation in Infrastru cture (PPI) Project Database is the most comprehensive source to track private sector investments in developing countries. It includes data on over 5,000 infrastructure projects in 139 low- and middle-income countries from 1990 onwards. The database records total investment commitments by a private party in projects in which it assumes operating risks. Projects included in the database do not have to be entirely privately owned nor financed but are mostly privately operated. The database draws its information exclusively from publicly available sources.
Based on the limited data available, this paper aims to review existing information on financial flows for investments in infrastructure in developing countries. It starts with an assessment of sources of current infrastructure investments and its uses, and assesses the channels and financial instruments connecting

27
sources and users. It concludes with a discussion of how the different flows can complement each other so as to maximize synergies and highlights some challenges in closing the funding gap.
2. Sources of flows Infrastructure investments in the developing world are broadly estimated to be around US$ 800 bn
per year. Fay et al (2010) estimate it to be about US$ 600-800 bn in 2005, while Bhattacharya et al (2012) report a number of US$ 800-900 bn in 2008 (all without operation and maintenance spending). These estimates are compiled from a variety of sources with differing levels of reliability. Some rough estimates suggest that most of current infrastructure investments go to East Asia & the Pacific (above US$ 200 bn in 2005), while much less (about US$ 45 bn in 2005) is invested in regions, such as Southeast Asia, Middle East & Northern Africa, Latin America & the Caribbean, and Sub-Saharan Africa (MDB Working Groups 2011a).
The largest share of this spending comes from domestic public spending, followed by the private sector and official development assistance (ODA). Bhattacharya et al (2012) estimate that 60-70% of current capital expenditure is financed by national government budgets, 20-30% by the private sector, 5-8% by developed countries through bilateral ODA and Multilateral Development Banks (MDBs) and small share by funding from new sources (3%). Similar shares are derived from the AICD data for Sub-Saharan Africa including operation and maintenance (Table 1). Based on capital expenditure only, the estimates for Sub-Saharan Africa are closer to estimates for all of Africa from ICA (Table 1). While the ICA data depicts the growing role of infrastructure funding from emerging economies (like China), it is likely to underestimate the role of the private sector.
Table 1: Annual investments in infrastructure in developing countries by source
Africa, 2012 Sub-Saharan Africa, 2001-2006 Developing World, 2008
ICA data AICD data Bhattacharya et al.
capital only capital + O&M capital only
bn US$ % bn US$ % bn US$ % bn US$ %
National governments 42.2 47 9.4 38 29.8 66 500-600 60-70
Developed countries 18.3 20 3.6 14 3.6 8 40-60 5-8
Emerging economies 21.4 24 2.5 10 2.5 6 20 3.0
Private sector 7.9 9 9.4 38 9.4 21 150-250 20-30
Total 89.3 24.9 45.3 800-900
Source: ICA (2013) for Africa, 2012; Foster & Briceño-Garmendia (2010) for Sub-Saharan Africa, 2001-2006 and
Bhattacharya et al. (2012) for Developing World, 2008. Notes: O&M = operation and maintenance spending, capital = capital expenditure. The ICA data does not
differentiate between these two types.
2.1 Public Sources
Although budget allocation by national governments to infrastructure is substantial and growing, overall spending is rather modest. For example, national governments allocated US$ 9.4 bn per year to build new infrastructure in Sub-Saharan Africa in 2001-2006 (Table 1), which equals 6-8% of their national budgets. With spending for operation and maintenance, total annual government spending for infrastructure amounts to about US$ 30 bn in 2001-2006 (Table 1), or some 4.7% of GDP (Foster & Briceno-Garmendia, 2010). Government spending in Africa grew with a rate of 8.6% per year between 2010 and 2012 (ICA, 2013). Yet further growth in public spending, especially in low-income countries, will be constrained by a narrow tax base and unsustainable debt levels (MDB Working Group 2011).

28
Despite a significant increase in recent years, ODA only accounts for about 10 percent of overall infrastructure finance. At $93 billion in 2011, ODA is dominated by financing from MDBs with US$ 75 bn in 2011. Bilateral ODA peaked in 2008 around US$ 21 bn, while MDB funding has been growing steadily (Figure 1). Yet MDB lending for infrastructure projects is reverting to pre-crisis trends (MDB Working Group 2011).
New financiers from large middle-income countries are likely to finance an increasing share of developing countries’ infrastructure. This is particularly true in Africa, where they funded some 24% of infrastructure investments in 2012 (table 1). Out of all funding for Africa that came from non-national public sources, ca. 30% came from China (US$ 13.4 bn, mostly through official loans from the Export-Import Bank of China and the China-Africa Development Fund), 12% came from the Arab Coordination Group (US$ 5.2bn, one-third from the Kuwait Arab Fund for Arab Economic Development), 1.6% from India (US$ 667m mainly through lines of credit extended by the Export-Import bank of India), and 1.1% from Brazil (US$ 530m in lines of credit issued by its national development bank BNDES) (ICA, 2013).
Figure 1: Infrastructure funding through bilateral ODA and MDBs 2000-2011 (in US$ bn)
Source: Based on information collected by the MDB Working Group (2011). Notes: Bilateral ODA only incudes contributions from OECD countries as reported to the Development Assistance
Committee (DAC) of the OECD. 2.2 Private sources
Private participation in infrastructure plays a cri tical role in infrastructure investment and is growing but varies greatly across regions. According to the PPI data, total private participation reached US$ 185 bn in 2012, slightly down from its 2010 peak of US$ 196bn (Figure 2). In 2012 private investments were highest in Latin America & the Caribbean (US$ 87bn), but had actually decreased steadily since 1998. South Asia achieved the highest growth rate over the same time period (62% per year) now accumulating US$ 35bn of private investments. It is followed by Eastern & Central Asia (total US$ 22bn in 2012 with an annual growth of 11%), Eastern Asia & the Pacific (total US$ 17bn in 2012 with an annual growth of 1.4%), Sub-Saharan Africa (total US$ 12.8bn in 2012 with an annual growth of 17%) and Middle East and Northern Africa (total US$ 6.7bn in 2012 with an annual growth of 2.6%) (Figure 2).
New private financing sources may play an increasing role for infrastructure investments. With ca. US$71 trillion in assets and their long time horizons, institutional investors are seen as an important long-term
$0
$10
$20
$30
$40
$50
$60
$70
$80
$90
$100
2000 2001 2002 2003 2004 2005 2006 2007 2008 2009 2010 2011
European Bank Reconstruction and Development
African Development Bank
Inter-American Development Bank
Asian Development Bank
European Investment Bank
World Bank Group
Bilateral ODA

29
financing source for infrastructure (Kaminker & Stewart, 2012). Diaspora capital is another source of funding for infrastructure projects which has become increasingly available for projects in Africa (ICA, 2013).
Figure 2. Private participation in infrastructure investments by region, 1998-2002 (in US$ bn)
Source: PPI data from World Bank and Public-Private Infrastructure Advisory Facility Notes: Estimates adjusted by US$ CPI to calculate 2012 US$ values; Sub-Saharan Africa = Sub-Saharan Africa, SA
= South Asia, MENA = Middle East &Northern Africa, LAC = Latin America & the Caribbean, ECA = Eastern and Central Asia, EAP = East Asia and the Pacific.
3. Uses of flows
The allocation of investments across sectors varies according to funding sources. A sectoral breakdown is only available for Africa for public investment, where data from the AICD suggests that it is primarily focused on energy and transport followed by ICT and water and sanitation (Figure 3). In contrast, private sector finance primarily goes into ICT and energy.
Figure 3. Infrastructure spending by sector and funding source in Sub-Saharan Africa (in US$ bn), 2001-2006:
Source: AICD data based on Foster & Briceno-Garmendia (2010)
5.0
5.7
1.1
2.1
1.1
1.1
0.2
0.7
1.8
1.2
9.4
3.3
12.3
4.2
0 5 10 15 20
Energy
ICT
Transport
W&S Private
sector
Emerging
economies

30
Private participation remains highly concentrated with most of the investments made in a few
emerging economies. The financial crisis only increased this trend (MDB Working Group, 2011a). PPI data shows 70% of all investments in the last 15 years were made in only 10 countries – most of it in Brazil and India (Table 2). that only a small percentage of private investments are made in low income countries: 1.3% in 1998 and 2.7% in 2012 with a peak at 4.4% in 2007 (Figure 4).
Table 2. Top 10 countries with highest private investments in 1998-2012 (in US$ mio)
Country 1998-
2012
% of total private
investment
Brazil 309,399 24.7%
India 238,935 19.1%
China 81,146 6.5%
Turkey 66,434 5.3%
Russian Federation 56,047 4.5%
Mexico 51,987 4.2%
Nigeria 30,033 2.4%
Malaysia 24,629 2.0%
Egypt, Arab Rep. 23,061 1.8%
Source: PPI data from World Bank and Public-Private Infrastructure Advisory Facility Figure 4. Low income countries by total private investments from 1998-2012 (in US$ mio)
Source: PPI data from World Bank and Public-Private Infrastructure Advisory Facility Notes: Low-income countries defined as countries with GNI per capita less than US$ 1,035.

31
Table 3. Private investments by sector and sector segment, 1998-2012 (in US$ bn)
1998 1999 2000 2001 2002 2003 2004 2005 2006 2007 2008 2009 2010 2011 2012 Total
Electricity 32.4 23.5 29.8 16.1 13.3 20.6 13.6 18.9 26.7 50.1 57.3 75.3 76.7 66.2 76.3 596.7
Natural Gas 9.0 4.0 2.8 4.8 3.2 5.1 2.2 3.4 3.5 5.5 2.0 1.6 6.9 7.9 0.5 62.4
Energy 41.4 27.5 32.6 20.9 16.5 25.8 15.7 22.4 30.1 55.6 59.3 76.9 83.6 74.1 76.8 659.1
Telecommunication 66.4 44.0 52.8 51.4 38.0 31.4 50.2 64.7 69.4 77.0 82.4 63.7 78.2 61.5 52.4 883.4
ICT 66.4 44.0 52.8 51.4 38.0 31.4 50.2 64.7 69.4 77.0 82.4 63.7 78.2 61.5 52.4 883.4
Airports 4.2 0.7 2.7 1.5 0.2 0.8 1.0 5.8 9.2 4.7 2.3 0.1 2.6 1.5 15.7 53.0
Railways 4.6 3.9 1.1 1.0 0.3 1.2 0.6 2.0 10.1 4.3 2.6 2.5 2.8 12.9 6.8 56.8
Roads 10.5 2.5 4.5 6.1 2.8 5.1 3.1 6.8 11.1 15.6 15.6 15.2 21.5 17.9 23.9 162.3
Seaports 2.1 3.0 2.5 1.7 2.3 2.3 2.2 7.5 6.1 8.2 7.0 5.4 5.2 4.4 1.7 61.6
Transport 21.4 10.2 10.8 10.3 5.6 9.5 6.9 22.0 36.4 32.8 27.6 23.1 32.1 36.7 48.2 333.7
Treatment Plant 0.8 0.5 0.9 0.9 0.5 0.8 1.5 1.5 0.6 1.8 2.2 0.8 1.5 0.7 0.6 15.7
Utility 2.5 8.3 8.7 1.5 1.4 1.0 4.2 1.4 2.3 2.0 0.9 0.3 0.8 2.0 3.4 40.8
Water Transfer - 1.0 0.1
Water and
Sanitation 3.3 8.8 9.6 2.4 2.0 1.9 5.6 2.9 3.0 3.8 3.1 2.1 2.5 2.7 4.0 57.6
Total 132.5 90.5 105.8 85.0 62.2 68.5 78.4 112.0 138.9 169.2 172.3 165.8 196.3 174.9 181.4 1933
Source: PPI data from World Bank and Public-Private Infrastructure Advisory Facility Notes: Estimates adjusted by US$ CPI to calculate 2012 US$ values.

32
Private investments also favor very few segments in the ICT and energy sectors. Telecommunication has traditionally been the prime destination of private investment due to its ability to charge full-cost prices. However, private investments in electricity have more than doubled since 1998 and became the main destination for private finance. Investment in transport varies greatly by year, but is generally growing, while investments in water and sanitation remain marginal (Table 3).
4. Channels and financial instruments The vast majority of public infrastructure investments are channeled through domestic
budgets, bilateral ODA, and MDBs. MDB funding is mainly delivered through grants, loans (concessional and semi-concessional) and incentives such as guarantees that intend to crowd-in capital from private sources.
Where capacity to raise tax revenues and access to capital markets is limited, mechanisms such as Resources for Infrastructure (RfI) arrangements can be a significant source of infrastructure financing. Mainly manifested through export credit, RfI arrangements allow governments to exchange oil or mineral extraction rights for turnkey infrastructure and could be a particularly useful in resource-rich countries, as in Africa. The current value of signed RfI contracts is estimated to be at least US$ 28 bn (World Bank, 2013a).
In today’s investment climate, private banks play a relatively small role in infrastructure financing. Private bank lending had been the dominant form of financing long term investments in infrastructure, particularly in the early, higher-risk construction stage, but suffered from the financial crisis, reaching a historic low in 2012 (World Bank, 2013b). In today’s financial climate, commercial banks have almost completely pulled back from project finance transactions and prefer to provide balance-sheet financing. Moreover, commercial banks typically do not offer financing with the long tenors required for infrastructure, and they are even less likely to finance projects in developing countries.
Public Private Partnerships (PPP) have become a useful financing instrument with private participation taking various forms, ranging from fu ll equity ownership to contractual forms without any equity involvement. Data from the PPI database (Figure 5) shows that greenfield project (i.e. private entity firm or a public-private joint venture builds and operates a new facility for the period specified in the project contract) are the most prominent participation type followed by concessions (i.e. private firm takes over management of a state-owned enterprise for a given period) and divestitures (i.e. a private firm buys an equity stake in a state-owned enterprise through an asset sale, public offering, or mass privatization program) and only a marginal share through management & lease contracts.
Sovereign wealth funds, pension funds, and insurance funds could potentially become an important new channel to mobilize non-bank capital for infrastructure financing – if good projects with the desired risk-return profile could be developed. Infrastructure investments offer stable, long-term returns to fund investors that are seeking to diversify their assets from government instruments. Sovereign wealth funds alone are now managing US$ 5 trillion. Yet currently a negligible percentage (about 1%) of Sovereign wealth funds, pension and insurance funds are allocated to infrastructure - mostly in middle income countries (World Bank, 2013a).
These non-bank private infrastructure investment modes have traditionally favored loan financing but bond financing is increasingly drawing a larger share of infrastructure investment. With policy-induced low interest rates and quantitative easing in higher income countries constraining the market, global investors are drawn by higher yield and long term return benefits in developing countries and further encouraged by improvements in the credit quality of emerging markets to invest (Figure 6).

33
Figure 5. Private Investment in Infrastructure by PPI types, 1998-2012
Source: PPI data from World Bank and Public-Private Infrastructure Advisory Facility Notes: Estimates adjusted by US$ CPI to calculate 2012 US$ values. Innovative mechanisms can help to channel large savings in developing countries into scaled-
up, reliable and profitable financing for infrastru cture capital requirements. Diaspora bonds could be exploited to absorb a portion of the estimated US$ 400 bn annual savings of diaspora resources that are usually left dormant in low yielding bank accounts or stashed at home. For instance, the Africa50 Fund aims to mobilize domestic capital in the form of pension funds and central bank reserves with diaspora backing (ICA, 2013). Over the last 5 years, local-currency bond markets that can capture domestic savings, have been among the best performing assets classes in emerging and developing countries despite international market instability (World Bank 2013).
Figure 6. Non-Bank Private Infrastructure Investment Financing
Source: World Bank, 2013a
0
20
40
60
80
100
120
140
160
180
200
199819992000200120022003200420052006200720082009201020112012
Management and lease contract
Concession
Divestiture
0%
10%
20%
30%
40%
50%
60%
70%
80%
90%
100%
1990-2010 2011-2011 2012-2012 (projected)
Loans
Bonds

34
5. Synergies and complementarities among flows
The infrastructure finance gap is significant. There is no way to estimate this gap exactly as it depends on what is defined as the investment need (e.g. universal access or relative needs) and on what is currently spent (which as discussed above is hard to measure) (Estache & Fay, 2007). Nevertheless, the various estimates available suggest a gap of about US$ 1 trillion per year through 2020 to keep pace with the demands of rapid urbanization, growth, and the push for greater global integration and connectivity, in addition to US$ 200-300 bn per year to assure that infrastructure investments are low emitting and climate resilient (World Bank, 2013b; Bhattacharya et al., 2012; Fay et al., 2010).
Traditional public sources of infrastructure finance are strained so that they are unlikely to be able to cover the financing gap. Few governments have the room to increase infrastructure spending given their debt burden, low tax bases and limited access to international capital markets. While an increase in funding from emerging economies is likely, funding from developed countries through ODA and MDBs is unlikely to increase.
Bilateral and multilateral ODA has been largely complementary to domestic financing and plays a catalytic role to mobilize additional funding from diverse sources. Through partial risk and partial credit guarantees and leverage mechanisms such as equity tranches covering first loss provisions, ODA has been particularly useful for credit enhancement making risky developing country infrastructure projects more attractive for private investors and commercial banks.
More finance from private sources will be needed, but will not substitute for public financing. Private and public capital play a complementary role in infrastructure financing. Public funds should be targeted so as to catalyze greater private finance for more and greener infrastructure through improving project design and implementation, mitigating investment risk and expanding available financing instruments.
Donors and national governments need to increase resources allocated to developing a pipeline of bankable projects. The private sector is very unlikely to undertake costly feasibility studies if actual project implementation and returns are highly uncertain. Donors can help by working with governments to fund and develop project preparation facilities that help overcome capacity bottlenecks and information constraints.
Public commitments and mechanisms are needed to reduce the risk of private investments in infrastructure sectors. Given its high up-front capital costs and longtime horizons of pay-back, infrastructure investments often have unattractive risk-return profiles. Governments must ensure that pricing and other incentives, as well as regulations are aligned so to reduce risks and increase returns, for example through strong commitments for legal and institutional frameworks. PPPs are a means to overcome structural weaknesses of infrastructure investments through financial incentives (such as loss guarantees, payment guarantees, and upfront subsidies) and non-financial incentives (including political risk coverage and preferential tariffs).
Viability gap funding mechanisms can help channel private sector funds towards well-prepared infrastructure projects and can support PPPs. These mechanisms play an important role to promote high quality projects that are economically worthy, but not financially viable. By supporting high quality PPPs that have been prepared to international standards, viability gap funding can support the movement of the PPPs pipeline to the market.
Building on the synergies between improved project quality, investment climate and financing availability can attract greater financial resources. Especially, MDBs can play a key role in mobilizing additional financing from private sources by deploying financing instruments, helping countries to improve their policy and regulatory environment and improving project design, while also fostering demonstration and selection of successful projects (World Bank, 2013c).
35
6. Challenges for the future In order to understand what is currently spent, what the funding gap and fiscal exposure is and
where to invest, better data on infrastructure investments is needed. The current lack of basic data on quantity and quality of infrastructure stocks, access to services, prices and costs, efficiency parameters, and spending gap is a perennial problem for planning agencies, ministries of finance, investors, analysts and advisors. As the collection of such data and its regular update would only require relatively modest resources (US$ 10 mio annually for all countries worldwide, so about 0.001% of the funds at stake), this should be a priority for action (MDB Working Group, 2011b).
While more private finance will be needed to close the current infrastructure gap, unattractive
risk-return profiles and the lack of bankable projects are impeding greater private investments. National governments, as well as bilateral donors and MDBs have a crucial role to play in increasing incentives, reducing risks, expanding financing instruments and identifying a pipeline of bankable projects. Project preparation facilities and PPPs will be needed to leverage private finance at the scale needed.
New financing instruments must be found to channel the vast capital of institutional investors
and existing savings into infrastructure investments. Expanding the use of guarantees, risk insurance and innovative finance is crucial to crowd in private finance. Credit enhancements would build local capital markets, and mitigate currency risk and specific regulatory risks, thereby releasing long-term capital. In addition, diaspora bonds or local currency bonds are promising new instruments to absorb some of the available private savings.
References
Bhattacharya, A., Romani, M., Stern, N. (2012). Infrastructure for Development: Meeting the Challenge, policy background paper for Brookings-G24 High-Level Seminar, April 11, 2012.
Estache, A., Fay, M. (2007). Current Debates in Infrastructure Policy. Policy Research Working Paper 4410, Washington, DC: World Bank.
Fay, M., Toman, M., Benitez, D., Csordas, S. (2011). Infrastructure and Sustainable Development. In: Fardoust, Shahrokh, Yongbeom Kim, and Claudia Paz Sepúlveda (eds.) Postcrisis Growth and Development: A Development Agenda for the G-20.MDB Working Group on Infrastructure (2011a). Supporting Infrastructure in Developing Countries, Submission to the G20.
Foster, V., Briceno-Garmendia, C. (2010). Africa’s Infrastructure: A Time for Transformations. The World Bank: Washington, DC.
ICA, 2012. Infrastructure Financing Trends in Africa: ICA annual Report 2012. Infrastructure Consortium for Africa.
MDB Working Group (2011a). Supporting Infrastructure in Developing Countries. Submission to the G20.
MDB Working Group (2011b). Infrastructure Needs Assessment, Annex 1. Submission to the G20.
Kaminker, C., Stewart, F. (2012). The role of institutional investors in financing clean energy. OECD Working Papers on Finance, Insurance and Private Pensions, No. 23.
World Bank (2013a). Financing for Development Post-2015. Washington, DC.

36
World Bank (2013b). Demand for Long-Term Financing of Infrastructure. Contribution to the G20 umbrella paper on Long-Term Investment Financing for Growth and Development, prepared by the World Bank with inputs received from the UN-DESA, OECD, IAE and the Monetary Authority of Singapore.
World Bank (2013c). Official Sources of Non-Concessional Long-Term Financing: The Role of the Multilateral Development Banks. Contribution to the G20 umbrella paper on Long-Term Investment Financing for Growth and Development, prepared by the World Bank with inputs from the AfDB, AsDb, EBRD, IaDB, OECD and UN-DESA.
Yepes, T. (2008). Investment needs in infrastructure in developing countries: 2008-2015. The World Bank, mimeo.

37
Chapter 4 Mapping of finance flows for renewable energy
1. Introduction There is no ready-made mapping of financial flows for the renewable energy sector. Available studies
and databases do not have comparable definitions and scopes. This note mainly uses two sources: (i) the Global landscape report produced annually by the Frankfurt School/UNEP and Bloomberg New Energy Finance (BNEF) (we use the version 2013); and (ii) the Global Landscape of Climate Finance 2013, produced by the Climate Policy Institute (CPI).16
The scope considered in this note is based on availability of data. It includes renewable energy,
including investment in projects, manufacturing capacity, venture capital/ private equity and R&D. It excludes large hydropower, as well as investments in transmission and distribution networks. It also excludes investments in energy efficiency. Note that investments in heating and cooling systems such as solar water heaters and geothermal heating and cooling are often excluded from reports, in particular from the often quoted reports done by BNEF. In summary, available data offer only a partial view of the broad renewable energy sector, and this should be kept in mind when reading this note.
Ramped-up investments in renewable energy are perceived as one of the keys to climate change
mitigation in coming decades. During the last decade, investment has taken off rapidly, as illustrated by Figure 1.
Figure 1: New investment by region, 2004-2012
Source: BNEF, 2013.
16 The latter report covers, in addition to renewable energy, investments in energy efficiency and other
mitigation and adaptation activities. However breakdowns are provided that allow one to provide figures for the scope that is considered here, given ad hoc assumptions.
0
50
1 00
1 50
2 00
2 50
3 00
2 00 4 20 05 2 00 6 20 07 200 8 2 00 9 20 10 2 01 1 20 12
Inve
stm
ent (
US
$ bi
llion
)
Mid d le E a s t & Afric a
AME R (e xc l. U S & B ra zi l )
AS O C (e xc l. C h in a & In d ia )
B ra zi l
In d ia
E u ro p e
C h in a
U S A
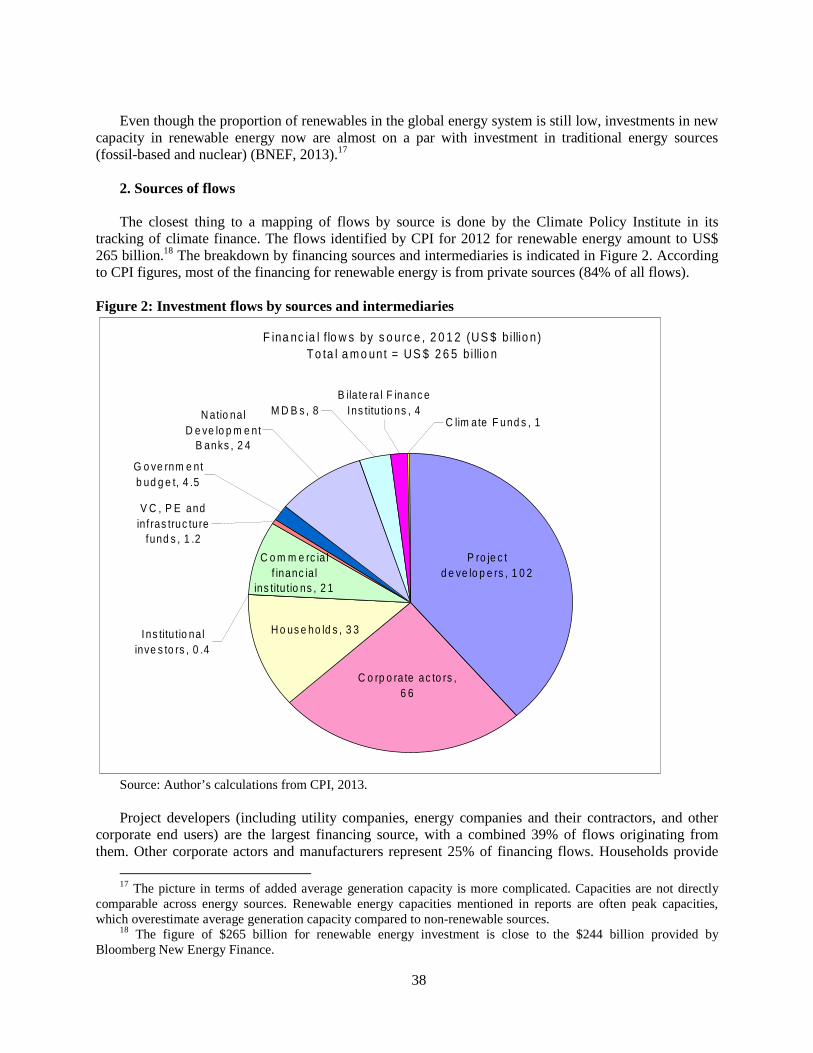
38
Even though the proportion of renewables in the global energy system is still low, investments in new
capacity in renewable energy now are almost on a par with investment in traditional energy sources (fossil-based and nuclear) (BNEF, 2013).17
2. Sources of flows The closest thing to a mapping of flows by source is done by the Climate Policy Institute in its
tracking of climate finance. The flows identified by CPI for 2012 for renewable energy amount to US$ 265 billion.18 The breakdown by financing sources and intermediaries is indicated in Figure 2. According to CPI figures, most of the financing for renewable energy is from private sources (84% of all flows).
Figure 2: Investment flows by sources and intermediaries
Source: Author’s calculations from CPI, 2013. Project developers (including utility companies, energy companies and their contractors, and other
corporate end users) are the largest financing source, with a combined 39% of flows originating from them. Other corporate actors and manufacturers represent 25% of financing flows. Households provide
17 The picture in terms of added average generation capacity is more complicated. Capacities are not directly
comparable across energy sources. Renewable energy capacities mentioned in reports are often peak capacities, which overestimate average generation capacity compared to non-renewable sources.
18 The figure of $265 billion for renewable energy investment is close to the $244 billion provided by Bloomberg New Energy Finance.
F ina nc ia l f lo w s by s o urc e , 2 0 1 2 (US $ b illio n )To ta l a m o unt = US $ 2 6 5 b illio n
P ro je c t d e ve lo p e rs , 1 0 2
C o rp o ra te ac to rs , 6 6
H o us e ho ld s , 3 3Ins titu tio na l inve s to rs , 0 .4
C o m m e rc ia l f inanc ia l
ins titu tio ns , 2 1
V C , P E and in f ras truc ture
fund s , 1 .2
G o ve rnm e nt b ud g e t, 4 .5
N atio na l D e ve lo p m e nt
B anks , 2 4
M D B s , 8B ila te ra l F inanc e
Ins titu tio ns , 4C lim ate F und s , 1

39
12% of the financing flows. Commercial financial institutions such as banks provide 8% of the flows. Other private intermediaries (asset management companies, private equity funds, infrastructure and other funds, venture capital) provide very little. In particular, and this has been noted by other reports as well (see Nelson and Pierpont, 2013), institutional investors have so far invested little in renewable energy.
Coming to public sources, government budgets (in a broad sense, including Ministries, Government
agencies, and subnational authorities) spent directly are estimated to account for 2% of the flows, whereas public flows passing through development finance institutions account for most of the rest. National development banks are the most important source among those with 9%; before multilateral development banks (3%) and bilateral development banks (2%). The contribution of climate funds is less than 1%.
Even though these figures may lead the observer to conclude that renewable energy financing is
mostly a private activity, this is not the case. Governments and development finance institutions still play an extremely important role, both through directly driving projects and through the provision of risk transfer products and subsidies. Those are not reflected in the figures presented above. In the former case for example, in China and other countries many projects are directly and indirectly piloted by governments at different levels, including through State-controlled or parastatal companies. The corresponding investment may be reflected as coming from the corporate sector. Similarly, most public subsidies are not accounted for in the figures presented here, which focus on capital investment.
Importantly, even though there are exceptions, in many contexts renewable energy is still not
competitive with fossil-fuel based energy. This has translated into important public subsidies, in addition to policy support, in order to make investment happen. Renewable energy subsidies (excluding large hydro) were estimated at $66 billion in 2010 (IEA, 2011) and $88 billion in 2011 (IEA, 2012), of which $64 billion went to electricity and the remainder to biofuels. Solar PV received more than any other renewable energy technology for electricity generation ($25 billion), followed by wind ($21 billion) and bioenergy ($15 billion).19 Commercial investment is still critically dependent on subsidies and investment decisions are made based on assurance of continued subsidies in the future.
According to CPI (2013), the large majority of renewable energy finance is domestic; that is,
investments are made in the country from which the resources originate. Using numbers from the CPI report, we estimate that 70-80% of financing flows are domestic. While most of these flows originate from the private sector, national development banks contribute a significant share of the flows, both in developed and developing countries. In the latter, the China Development Bank has played a major role.
Official Development Assistance (ODA) figures for renewable energy only are not available. As a
proxy, one can use the so-called “Rio markers” used by the OECD to track ODA flows targeted at the objectives of the Rio Conventions. Specifically, the OECD isolates “climate change mitigation” as an objective. This in theory encompasses, but is not limited to, renewable energy. These figures should be considered with caution, given the differences in scope and the data quality issues that have been identified for the Rio markers.20 Nevertheless, the range of ~$10-15 billion is compatible with other figures given in the CPI report (see below).
19 In 2011, the European Union provided the highest level of total renewable energy support in the world,
almost $50 billion, followed by the United States at $21 billion (IEA, 2012). Subsidies to biofuels were also the highest in the European Union, at $11 billion, the bulk of them going to biodiesel. In the United States, $8 billion in 2011 went to biofuels, mainly targeting ethanol (IEA, 2012).
20 For details, see http://www.oecd.org/dac/stats/rioconventions.htm.

40
Figure 3: ODA marked for climate change mitigation, 2008-2011
Source: OECD, 2013. Similarly, Foreign Direct Investment (FDI) figures for renewable energy are not available. However,
BNEF tracks “cross-border investment volumes”, which can be taken as a proxy for FDI. Available figures show a rapid increase of these cross-border investments. The bulk (70-80%) of these flows is between OECD countries (BNEF, 2013). However, North-South flows have increased as well over the period. Figure 4: Estimates of cross-border (private) investment volumes, developed and developing countries, 2004-2011
Source: BNEF, 2013.
O D A m a rk e d fo r c lim a te m itig a tio n , 2 0 0 8 -2 0 1 1
0
2000
4000
6000
8000
10000
12000
14000
16000
18000
20000
2008 2009 2010 2011
Am
ou
nt
(US
$ m
illi
on
)
O the rs
N o rw ay
F ranc e
E U ins t itu t ions
G erm any
Japan
C ro s s -b o rd e r in v e s tm e n t v o lu m e s fo r N o rth a n d S o u th
0
5
1 0
1 5
2 0
2 5
3 0
3 5
4 0
4 5
5 0
2 0 04 2 00 5 2 0 06 2 0 07 2 0 08 2 0 09 2 0 10 2 0 11
US
$ b
illi
on
North -S ou th
S ou th -S ou th
S ou th -North
North -North

41
From existing sources, it is difficult to get a consistent picture of the financial flows going from
developed to developing countries and vice-versa. On the one hand, BNEF (2013), focusing on projects and private investment, indicates US$9 billion of cross-border flows going from developed to developing countries in 2011, with $1 billion going from developing to developed countries (BNEF, 2013). Using BNEF and CPI data, it can be tentatively estimated that an additional $10-12 billion from public sources (governments, bilateral and multilateral development banks) flows from developed to developing countries. Those represent a significant amount of the total financial flows from these intermediaries (estimated by the authors from CPI data at about $16 billion altogether). Note that these flows include market-rate project debt, and thus do not comprise only ODA.
4. Channels and financial instruments Channels have already been mentioned in the previous section. In terms of financial instruments,
from the mapping done by CPI, and focusing on renewables only, the breakdown shown on Figure 5 obtains.21 Private sources provide most of the balance sheet financing and project level equity and the majority of market-rate project debt. Public intermediaries provide market-rate project debt and low-cost (including concessional) project debt in roughly similar proportions.22
Figure 5: Relative importance of financing instruments used for renewable energy investment
at the global level
Source: Authors’ calculations from CPI (2013). 5. Uses of flows within the sector The technologies that receive the most investment (among those monitored by BNEF) are solar and
wind (Figure 6). For the former, BNEF distinguishes between large, utility-scale projects (capacity above 21 CPI notes that the figure for “balance sheet financing” may be overestimated due to data problems. 22 While the share of grants seems low, it needs to be remembered that massive public support is provided
through subsidies of various sorts and risk-related financial products, see above pp. 6-7).
R e la tiv e im p o rta n c e o f fin a n c in g in s tru m e n ts
B a la nc e she e t fina nc ing , 7 3 .2 %
P ro je c t-le ve l e q uity, 4 .2 %
P ro je c t-le ve l m a rk e t ra te
d e b t, 1 3 .3 %
L o w -c o s t p ro je c t d e b t, 7 .8 % G ra nts , 1 .5 %
0% 10% 20% 30% 40% 50% 60% 70% 80% 90% 100%
S h a re (%)

42
1MW) and small projects (smaller than 1 MW) which cover in particular decentralized installation of solar PV by households and individual firms to cover part of their energy needs. Policies applying to those are often different from those applying to large-scale projects, and so are financing models.
Figure 6: New investment by technology, 2004-2012
Source: BNEF, 2013.
Whereas in the past, investment in renewable energy occurred largely in developed countries, during
the last decade investment in developing countries has risen steadily and has been unabated during the financial crisis. In 2012, total additional investment was estimated at US$112 billion in developing countries and US$ 132 billion in developed countries (BNEF, 2013). The majority of wind investment in 2012 was in developing countries (Figure 7). China has now taken over the USA as the country with the largest investment in renewables (BNEF, 2013). China has also been for some time the country with the largest capacity in solar water heating systems – a form of renewable energy that is not negligible compared to others that receive more attention such as solar PV and wind (REN 21, 2013).
0
50
100
150
200
250
300
2004 2005 2006 2007 2008 2009 2010 2011 2012
Inve
stm
ent (
US
$ bi
llion
)
Ma rin e
G e o th e rm a l
S m a ll h yd ro
B io m a s s a n d w a s te -to -e n e rg y
B io fu e ls
S o la r- s m a ll d is tr ib u te d
S o la r (la rg e p ro je c ts )
W in d
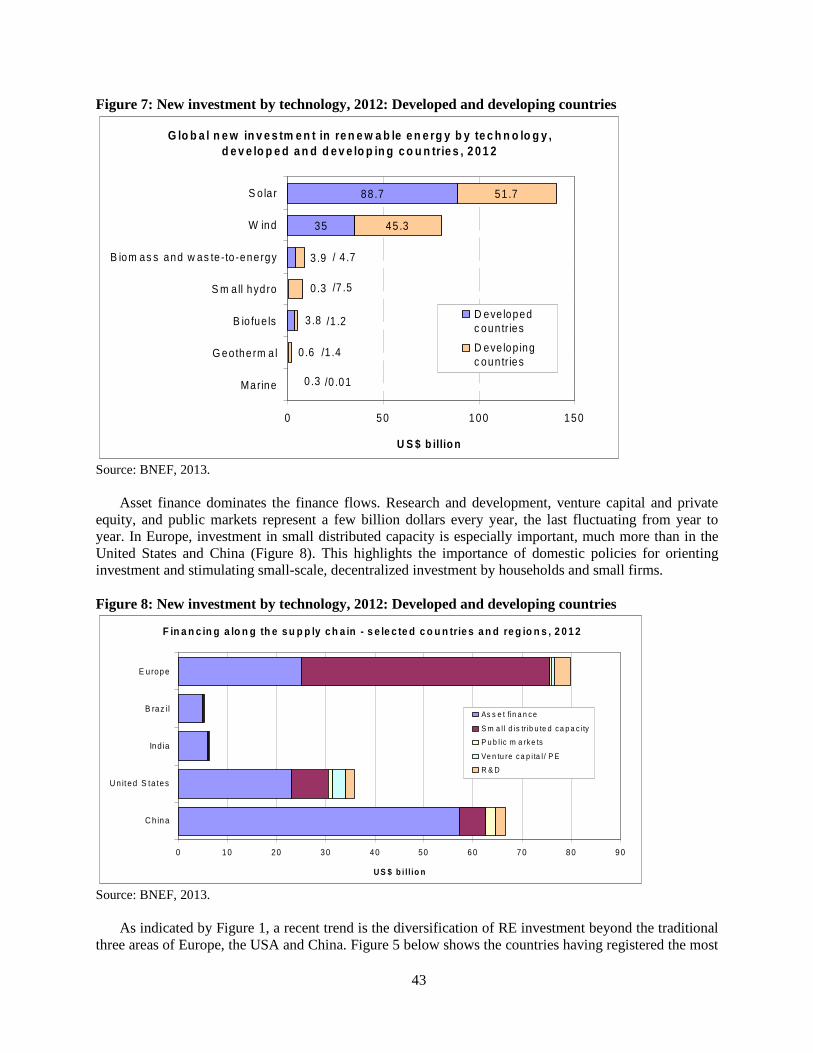
43
Figure 7: New investment by technology, 2012: Developed and developing countries
Source: BNEF, 2013.
Asset finance dominates the finance flows. Research and development, venture capital and private
equity, and public markets represent a few billion dollars every year, the last fluctuating from year to year. In Europe, investment in small distributed capacity is especially important, much more than in the United States and China (Figure 8). This highlights the importance of domestic policies for orienting investment and stimulating small-scale, decentralized investment by households and small firms.
Figure 8: New investment by technology, 2012: Developed and developing countries
Source: BNEF, 2013.
As indicated by Figure 1, a recent trend is the diversification of RE investment beyond the traditional
three areas of Europe, the USA and China. Figure 5 below shows the countries having registered the most
G lo b a l n e w in v e s tm e n t in re n e w a b le e n e rg y b y te c h n o lo g y , d e v e lo p e d a n d d e v e lo p in g c o u n trie s , 2 0 1 2
35
88 .7
45 .3
51 .7
0 .3
0 .6
3 .8
0 .3
3 .9
/0 .01
/1 .4
/1 .2
/7 .5
/ 4 .7
0 50 100 150
Marine
G eotherm a l
B io fue ls
S m all hyd ro
B iom as s and w as te -to -energy
W ind
S o la r
U S $ b illio n
D eve lopedc oun tr ies
D eve lop ingc oun tr ies
F in a n c in g a lo n g th e s u p p ly c h a in - s e le c te d c o u n trie s a n d re g io n s , 2 0 1 2
0 10 20 30 40 50 60 70 80 90
C h ina
U n ited S ta tes
Ind ia
B raz il
E u rope
U S $ b i l l io n
As s e t fin a n c e
S m a l l d is tr ib u te d c a p a c i ty
P u b l ic m a rk e ts
Ve n tu re c a p i ta l / P E
R & D

44
investment in asset finance in 2012 according to BNEF (2013). Whereas China and the USA dominate the picture, developed countries are well represented, with India, South Africa and Brazil coming in 3rd, 4th and 6th position respectively (Figure 9).
Figure 9: Net new asset finance in selected countries, 2012
Source: BNEF, 2013.
However, as shown by Figure 10, investment is still concentrated in a few countries. China in Asia,
Brazil in Latin America, and South Africa in Africa, still concentrate about or more than 50% of all asset finance net investment. Whether lesser investment elsewhere is due to smaller and less attractive markets, to capacity bottlenecks in smaller countries, to policy frameworks or to other factors that make these countries less attractive to investors, would be important to explore as substantially increased investment in renewables in the future should among other criteria locate where those have the most potential.
A s s e t fin a n c e in v e s tm e n t in re n e w a b le e n e rg y in 2 0 1 2s e le c te d c o u n trie s
0 2 4 6 8 1 0
C h in a
Un ite d S ta te s
In d ia
S o u th A fr ic a
UK
B ra zil
G e rm a n y
C a n a d a
Ja p a n
Uk ra in e
M e xic o
F ra n c e
M o ro cc o
T h a ila n d
K e n ya
Ita ly
C h ile
P e ru
U S $ b illio n

45
Figure 10: Net new asset finance in three developing regions: Breakdown by countries, 2012
Source: BNEF, 2013.
A s s e t fin a n c e in v e s tm e n t in 2 0 1 2 - A s ia(U S $ b illio n )
C hina 5 9 .1
Ind ia 6 .2
Japan, 2 .9
Tha iland , 1 .3
Ta iw an ,C h ina 0 .5
V ie tnam , 0 .3
R e s t o f A s ia 2 4
A s s e t fin a n c e in v e s tm e n t in 2 0 1 2 - A fric a a n d M id d le E a s t (U S $ b illio n )
S ou th Afr ic a 5 .7
Moroc c o 1.8
K enya1.1
E th iop ia , 0 .4
O ther Afr ic a and Midd le E as t, 2 .5
A s s e t fin a n c e in v e s tm e n t in 2 0 1 2 - L a tin A m e ric a(U S $ b illio n )
O the r L a tin A m e ric a , 1 .8
C o s ta R ic a , 0 .2
A rge n t ina , 0 .2
D o m in ic a n R e pu b lic , 0 .3
P e ru , 0 .6
C h ile , 0 .8M e xic o
1 .9
B ra zi l5 .2

46
5. Synergies and complementarities among flows To some extent, flows from different sources in the sector complement each other. First, renewable
energy has mobilized high volumes of private investment, increasingly in developing countries. If the current trends continue, developing countries should overtake developed countries in terms of new investment within a few years.
Second, private North-South financial flows in the sector are accompanied by large flows from public
sources, pointing to a useful role of public sources of finance to address needs in developing countries that the private sector may not address.
Third, over the last decade quite complex financial engineering of large projects has been achieved,
where finance from multiple public and private sources is blended. This has allowed the financing of projects which presumably would have been more difficult to finance on a private or public basis only.
However, as illustrated above, the rise in private and blended finance for renewable energy has only
started to impact countries outside the traditional areas of China, Europe and North America. Given the projected needs in all regions, private finance would clearly need to expand its reach further. Doing this will likely continue to involve work on national policy frameworks in order to mitigate both technology-specific and broader policy environment risks (Wassbein et al., 2013).
Rapidly increasing subsidies have imposed a burden on governments (taxpayers) and end users (for example through higher electricity bills), which may be an issue as investment continues to rise in the coming decades (see below). During the financial crisis, many governments revised their frameworks for financial support to renewables, sometimes abruptly ending subsidy schemes (see UNTT Working Group on Sustainable Development Financing, 2013).
6. Challenges for the future Going forward, key financing challenges in the renewable energy sector include the following. First, the projected need to increase investment in renewable energy to meet climate constraints
implies massive investments during the coming half-century. In this context, an important question relates to the impacts that national policy frameworks and strategies regarding investment in renewables may have on neighboring countries because of energy supply dependence or grid interconnections, and on suppliers in other countries. While minor when the scale of investment is small, these issues will become more important as renewables are ramped up to a scale where they become of systemic importance. Another question is where investment should or would take place, and whether the risks associated with very large projects and mega-projects can be adequately mitigated. In comparison with fossil fuel investments e.g. for electricity generation, investment in renewable technologies faces additional or increased risks, many of which are linked to policy environment that are beyond the scope of individual projects. Political risk surrounding the stability of subsidies and security of supply or transmission over time (as well as other factors related to the policy environment) are important.23 Physical risks linked with lack of availability of infrastructure to balance energy supply and demand (linked with intermittence of renewable sources) or distribution infrastructure (for biofuels) are also important added constraints. While financial instruments such as guarantees and insurance (e.g. through export financing) can transfer these
23 For example, it is worth mentioning that a mega-project like DESERTEC has been around since the 1970s,
but has not materialized so far.

47
risks to some extent, protection is not complete and this increases the additional cost of renewable energy projects.
Second, given projected increasing investment needs in the future, successfully financing those needs
will need the use of blended finance. As pointed out in background paper #4 of the UNTT working group, so far the approach of the international community has emphasized subsidies and risk transfer mechanisms more than risk mitigation. In recent blended energy projects financed with public support, the rate of subsidization can easily exceed 50% of the project costs — largely eliminating the risk to the private investors and almost guaranteed them large profits for years to come. While this approach has proven effective to demonstrate green technologies and encourage early entrant investors, it is not sustainable over the longer term and cannot promote investment at scale. Over the longer term, mechanisms that focus on risk-mitigation rather than risk sharing/compensation can more appropriately ‘crowd-in’ private sector finance. However, improvement of structural conditions for investment usually takes time – one or two decades. Thus, it may still be desirable to compensate private investors for extra risks or lower returns compared to other investment opportunities during such transition. This nevertheless should be based on a cost effective analysis of various mix of risk mitigating, risk sharing and compensation instruments (UNTT Working Group on Sustainable Development Financing, 2013).
Third, even though it is expected that renewable energy costs will continue to decline over time, the
need for public subsidies in addition to policy support is not expected to disappear. For example, the Global Energy Outlook 2012 estimates that, in 2035, subsidies would have to rise to almost $240 billion per year to achieve even a very “mild” climate scenario (IEA, 2012). Even though amounts of this order could be obtained by reallocating subsidies currently given to fossil fuels, which are estimated to have been of the order of US$ 450-550 billion in recent years (IEA, 2011), the political acceptability of large subsidies for renewables cannot be taken for granted. Finding an acceptable balance between these constraints and the need to incentivize investment will need to be carefully considered, and should be done in combination with a consideration of where subsidies are the most needed, looking at the broad energy system – including in energy efficiency, transmission and distribution infrastructure.
Fourth, it is important to distinguish clearly large-scale investments (e.g. wind farms, solar PV parks)
from small-scale, decentralized investment (e.g. solar PV on individual houses, geothermal heating/cooling systems, solar water heaters, etc.).The two clearly face very different technical and financial constraints and are best addressed through different policy frameworks and financing models. Available data suggest that small-scale, decentralized solutions have important untapped potential as part of any climate-compatible path, and are in some cases already competitive with fossil-fuel-based solutions. Thus, they should probably receive high priority. Yet, in many countries the main focus in terms of policy reforms, regulation and incentives has been on large-scale investments mostly in solar PV and wind. Differences across countries in terms of small-scale renewable capacity take-up suggest that adjustments to national policy frameworks could yield progress in that direction.
References CPI, 2013, The Global Landscape of Climate Finance, October. Frankfurt School – UNEP Centre and Bloomberg New Energy Finance, 2013, Global Trends in
Renewable Energy Investment 2013. IEA, 2011, World Energy Outlook 2011, OECD, Paris. IEA, 2012, World Energy Outlook 2012, OECD, Paris.

48
Nelson, D., and Pierpont, B., 2013, The challenge of institutional investment in renewable energy,
CPI Report, Climate Policy Initiative. OECD, 2013, DAC Statistics Database, www.oecd.org/dac/stats REN21, 2013, Renewables 2013 – Global Status Report, Paris. UNTT Working Group on Sustainable Development Financing, 2013, Public support to private
investment for sustainable development: challenges and opportunities, with emphasis on the environmental pillar, background paper #4, September, http://sustainabledevelopment.un.org/content/documents/2111Chapter%204-public%20support%20to%20private%20investment.pdf.
Wassbein, O., Y. Glemarec, H. Bayraktar, T.S. Schnmidt, 2013, Derisking Renewable Energy
investment. A Framework to Support Policymakers in Selecting Public instruments to Promote Renewable energy Investment in Developing Countries, United Nations Development Programme, New York, NY, USA.

49
Chapter 5 Mapping of financial flows to forests
The United Nations Forum on Forests (UNFF) Secretariat has led two major studies on forest-related financing – the first in 2008 and the second in 2012 – as a member of the Advisory Group on Finance (AGF) of the Collaborative Partnership on Forests (CPF). The 2008 AGF/CPF study examined the international arrangements for funding forests, while the 2012 study built on previous work and explored all types and sources of funding, for all types of forests and trees outside forests, at the national, regional and international levels. The 2012 study also examined interactions among other sectors and issues that have direct impact on forests and their financing. This brief overview of mapping financial flows to forests is largely excerpted from the 2012 AGF Study on Forest Financing.24
1. Introduction Forests provide economically valuable renewable materials including fuel and food, as well as
tangible products that can contribute to livelihoods and revenue streams. Forests also provide less tangible environmental services including biodiversity protection, climate change mitigation and carbon storage, which have been marketized both formally and informally. In forest financing, a distinction is made between “investments” and “revenues,” where common sources of “revenues” include profits and taxes from the sale of forest products, and “investments” include both soft investments (investments in improving governance, capacity, institutions, and information), as well as hard investments (investments in productive assets such as trees, machinery, etc.).
Forests contribute approximately USD 468 billion or 1% of global gross value added to GDP,
achieved through an annual investment in the forest sector of USD 64 billion. Of this, approximately 28% is spent on forest management and the rest is invested in forest product processing and trade. Forests provide development opportunities at many scales; however, the most common allocation of public and private financial resources is in large-scale commercial timber production in investments in pulp and paper and plantation development. At local and community levels, forests also provide an essential source of cash income. In many countries, non-wood forest products (NWFPs) – fruits, nuts, bushmeat, medicine – play important roles in local economies and livelihoods, and are important exports.
Limitations persist in comprehensively identifying all sources of financing to forests, including: (1)
significant differences in countries’ and organizations’ definitions of thematic coverage within the same datasets, (2) differences in reporting standards to the OECD, (3) limited information, particularly in the private sector and at the national level, and (4) the difficulty in valuating forest goods and services, including both timber and NWFPs, as these products tend to not enter formal markets. The available information on domestic flows for forest financing continues to be more limited than that of external sources. Few analyses exist on aggregate national trends in forest financing, mainly due to differences in reporting and analyses, varying national priorities in domestic forest resources, outdated data and surveys, and the fact that the information collected is often lumped together with flows to other related sectors.
In addition, identifying and following finance flows in some countries, such as low forest cover
countries (LFCCs), can be extremely difficult as there are no clearly defined structures for financing mechanisms, even in countries with an operational national forest department. In this context, it is more feasible to examine trends in data on forests that have been consistently and systematically collected and
24 http://www.un.org/esa/forests/pdf/AGF_Study_July_2012.pdf

50
reported, though they are largely external and not domestic sources of financing. These include ODA flows and to a lesser extent national information, national forest programs and other similar sources.
2. Sources of flows to sector Forest financing sources are categorized based on type (public or private) and scale (domestic or
international), with examples in the table below.
Table 1: Forest financing sources by type and scale
National International
Public • General government revenue • Revenue from state-owned forests • Forest sector fiscal revenue
• Bilateral aid agencies • Multilateral/ intergovernmental
financing institutions
Private
• Forest owners • Communities • Forest industry • Institutional and individual
investors • Philanthropic funds and donors • NGOs
• Institutional and individual investors
• Forest industry • Philanthropic funds and donors • NGOs
National Financing Flows Forest financing is heavily reliant on internal cash flows, and domestic public sector financing is the
major source of financing for forest-related activities in many countries. These flows are generally derived from general government revenue and revenues generated from state owned forests. The public sector contribution is often the only source of funding for forestry activities focused on social and environmental benefits, with close to 80% of the world’s forests publicly owned. The status and type of funding for forests vary among countries, as do funding structures and supported activities.
In many countries forestry activities also receive funds through ministries which host a range of other portfolios including rural development, wildlife, fisheries, tourism, water, nature conservation, and monuments, which tends to dilute the importance of the forest sector. Low allocations may also be partly due to the prioritization of funds for other needs such as health, social welfare and food. Revenue leakage also exacerbates this problem in some countries.
Converting public forest institutions into semi-autonomous commercial enterprises that are
empowered to retain all the revenue they generate, and establishing national forest funds as part of the national forest programs or as windows under national environment funds, are among measures that some countries have taken to enable public forest institutions to retain and manage funds effectively.

51
International Public Financing The data for international public flows are derived almost exclusively from the OECD dataset, which
provides only a partial view of the funding directed towards forests due to more stringent guidelines in reporting, including the tracking of flows to “forestry” rather than to “forests” in general. ODA disbursements are characterized by an overall 110% increase from the periods 2002-2004 and 2008-2010. While the amount of the bilateral disbursements is two times that of the multilateral disbursements, the percent change is similar for both. This significant increase in both bilateral and multilateral commitments and disbursements is due in large part to REDD+ readiness activities, as well as its pilot programs including fast-start funding.
Table 2: ODA Commitments and Disbursements
Source
2002-2004 2005-2007 2008-2010 % Change 2002-2004
to 2008-2010
% Change 2005-2007
to 2008-2010
USD millions at 2010 rates
ODA Commitments
- Bilateral 435.62 576.76 690.24 +58.45 +19.68 - Multilateral 248.90 281.98 508.84 +104.43 +80.45 Total 684.52 858.74 1199.08 +75.17 +39.63
ODA Disbursements
- Bilateral 324.39 397.06 704.84 +117.27 +77.50 - Multilateral 233.89 337.01 555.92 +137.69 +64.96 Total 558.28 734.07 1260.73 +125.82 +71.75
The OECD reports Japan and Norway as the largest disbursers of finance flows to forests, together
comprising more than half of all average disbursements, though these figures may include loans and other non-grant disbursements. In terms of multilateral flows, the World Bank, the European Investment Bank (EIB) and the Global Environment Facility (GEF) were the most significant disbursers, particularly during the financial crisis in 2008 when average annual flows remained just under USD 200 million per agency (see Appendix A).
Figure 1: ODA Disbursements to Forestry, 2008-2010

52
Private Sector Financing Private sector investments are mainly directed toward forests managed for wood production from
natural forests and from plantations. There are also private investments in non-timber forest production, but they are less significant. New investors are usually institutional investors (such as pension funds and others), Timber Investment and Management Organizations (TIMOs) and other private investors. The new investors generally come from outside the forest industry, and have little connection with the forest sector. TIMOs invest mostly in pine, eucalypt and teak plantations to sell wood in the open market. These investments are relatively easily identified and quantified, given the magnitude of resources involved.
Systematic studies related to finance flows in the private sector have begun to emerge in recent years,
particularly those related to carbon markets and other mechanisms related to the value of the services forests provide. There is still a need for extensive coordinated efforts to collect and extract national data on the private sector’s investments, as such data are not easily identified in a comprehensive manner. At the regional level, private investments contributed 64% of the total identified sources of forest financing in the Latin America and the Caribbean region and totaled an average of almost USD 4.4 billion per year between 2006 and 2011. Africa and Asia are characterized by a growing trade, most of which occurs in the informal sector and thus is rarely captured in national trade statistics.
In Africa, large private sector companies are mostly active in integrated processing industries and
plantation forests. Despite the adoption of economic liberalization polices, many countries in Africa have limited domestic large-scale formal private sector participation in forestry, particularly in the areas meaningful to sustainable forest management. A variety of microfinance institutions (MFIs) have emerged over time in Africa, with an estimated 970 MFIs serving 27 million microfinance client accounts, representing about 4% of the population.
Investment in small to medium scale forest enterprises has been promoted and directed more towards harvesting indigenous forest concessions and related timber value chains, small scale saw milling from plantation and indigenous forest ecotourism in forest protected areas. There is evidence that, with a little support and improved security of tenure, smallholder farmers can mobilize massive investment into forestry, especially regarding plantations and trees outside forests. This has already been amply demonstrated by some smallholder farmers, especially in east Africa, who are investing in woodlots and small plantations.
Philanthropic funding represents a significant source of forest financing in some countries and
regions. For example, during the period 2001-2010 the investments of the main philanthropic organizations in forest programs/projects achieved an average of USD 47 million per year in the Latin America and Caribbean region. The sustainability and predictability of philanthropic grants from the private sector are difficult to estimate, and although private philanthropy is unlikely to deliver finance at the same scale as other sources of private finance, it can be used for activities that offer no or low returns on investment.
3. Uses of flows within sector The majority of the top recipients of forestry ODA are middle-income countries, with 83% within the
range of lower-middle income, upper-middle income and even high-income classifications. Some 17% of top recipients are low-income countries. Overall, the majority of forestry ODA goes to middle-income countries with high or medium forest cover. This trend further exacerbates difficulties in financing forests in many low-income and/or low forest cover countries (LFCCs). Analysis of ODA for LFCCs and small island developing states (SIDS) shows no major change compared to what was reported in 2008; these

53
countries continue to experience decreases in forestry ODA. In addition, distribution of the limited ODA flows among these countries is highly uneven. Forestry ODA in these countries plays a catalytic role, in particular in promoting markets for non-timber forest products.
‘Far East Asia’ and ‘South and Central Asia’ have historically received the bulk of funding for forests
(see Figure below). These countries include China, Vietnam and India, as well as Brazil, as the major recipients of funding. Flows to ‘Unspecified’ recipients, mainly multilateral and regional organizations, have increased between 2002 and 2010, though there was no funding reported for regional organizations or initiatives in South Asia, the West Indies and the Middle East.
Figure 2: Recipients of Forestry ODA Disbursements, 2002-2010
Despite relatively high levels of funding in the region south of the Sahara in Africa, there are no
extraordinary recipients of funding as in Far East Asia and South & Central America. Cameroon, Central African Republic, Democratic Republic of Congo and Ghana each receive on average USD 7-12 million per year. What makes this region stand out from the others is that disbursements are not consistent from year to year (see Appendix B), and there are no large recipients overall, compared with other regions.
Figure 3: Top 10 Recipients of ODA Disbursements

54
ODA disbursements analyzed by income group indicate that middle-income countries continue to receive the most funding to forests, though for the period 2008-2010 the wide gap for both commitments and disbursements began to shrink. This period is also marked by a dramatic increase in disbursements to upper middle-income countries.
Figure 4: Forestry ODA Disbursements by Income Group, 2002-2010
Among all recipients of ODA, 27 countries reported no funding to forests between the periods 2002
and 2010. Of these countries, 40% are considered high forest cover countries, 30% medium forest cover countries, and 30% low forest cover countries. The total volume of forest ODA allocated to LFCCs decreased significantly between 2002 and 2008, with a drop observed from USD 17 to 12 million. The drop in the portion of LFCCs among forest ODA recipient countries is even sharper over the same period – from 7% to 2%. The distribution of forest ODA among LFCCs is also highly skewed, with Tunisia receiving 28% of the share, Pakistan 12% and Kenya 10%, while five other countries total 29% and the remaining 41 countries received only 21%.
ODA remains the main source of forest financing in SIDS, although levels have dropped significantly
from a yearly total of USD 8 million to USD 6 million between 2002 and 2008, with a dip to only USD 3.5 million in 2006. Over the same period, SIDS’ share of the world’s forestry ODA dropped from 3% to 1%. Moreover, ODA distribution by country is highly skewed, with Papua New Guinea receiving close to a third of all forestry ODA allocated to SIDS, another nine countries receiving 61%, while the remaining 28 SIDS together received 7%. This distribution primarily reflects countries’ forest cover.
4. Channels and financial instruments Significant resources have been made available through existing, new and emerging mechanisms to
issues that are closely connected to forests, across and within different countries and regions in recent years. The three Rio Conventions have relevant forest activities and financing initiatives, limited to the objectives and activities within those conventions. A large part of new financing initiatives that have some relation with forest-related projects, outside the private sector, are linked mainly to climate change, and then to biodiversity. Forest carbon and forests’ contribution to climate change mitigation and adaptation have been the main driving forces behind financing climate change forest-based activities

55
during recent years. The potential for REDD to contribute to forest financing is large, estimated at as much as USD 6.2 billion in 2020, and has led to unprecedented attention to the carbon potential of forests, in particular, through REDD+ schemes. Around USD 4 billion were pledged for the period 2010–2012 for measures to reduce greenhouse gas emissions from deforestation and forest degradation in developing countries. At the global level, institutions such as GEF, World Bank, UN-REDD, and REDD Partnership are active in this field.
Apart from REDD+, whose focus is on the carbon content of forests, many of the national, regional
and international carbon initiatives have no or negligible activities on forests. Carbon markets and trading schemes are still relatively new. However, there is broad optimism for their potential to provide a new revenue source for forest landowners and rights-holders, as well as employment opportunities. REDD-related initiatives are credited with much of the voluntary carbon market growth in 2009 and 2010, with a majority of suppliers from the private sector, followed by non-profit organizations and the public sector. The contribution of forests to combating land degradation and desertification also offers an important financing opportunity for many countries. Investment in these areas is attractive to national governments in that it supports sustainability of production systems that in turn benefit a large number of land users.
New developments have undoubtedly created new resources for forests, with much of the additional
funding directed to or in support of meeting the overall objectives of the three Rio Conventions namely: UNFCCC, CBD and UNCCD. These resources are of direct or significant relevance to forests and address the range of services and benefits derived from forests. This increases recognition of the significance of forests for tackling a number of global challenges and for the success of other sectoral and cross-sectoral policies and actions at the national and global levels. However, this has also led to an unintended situation in which mostly carbon, biodiversity and land services of forests are taken into account while other aspects of sustainable forest management receive no or less funding. There is still a lack of recognition of the significance of sustainable forest management as a standalone issue at the global level, and also at the national level. The huge flow of finance that targets the carbon content of forests has led to a focus only on high forest cover countries with high rates of deforestation, leaving out those high forest cover countries with lower rates of deforestation, low forest cover countries and SIDS, trees outside forests, and plantations from receiving proper funding under the relevant schemes.
New and innovative market-based sources of finance are being developed in many countries,
including PES schemes, bioprospecting, eco-tourism, greening commodities and complimentary biodiversity payments in REDD+. Many of the innovative financing mechanisms require policies for recognition and socio-economic valuation of vital environmental services that forests provide, as well as broader enabling frameworks that ensure reinvestment of monetary benefits in the forest sector.
Reviews caution against the assumption of global applicability of the PES mechanisms. The most
important source of payments for services is still international governmental and non-governmental support. Due to various national legislative frameworks and laws, PES is dealt with differently and to a different extent from one country to another. Moreover, further analyses are necessary to explore wide range of potential services and consumers of PES for forests.
5. Synergies and complementarities among flows It has been estimated that globally the required funding for sustainable forest management is between
USD 70 and 160 billion per year. Estimates of the amounts required to halve deforestation alone range from USD 20 to 40 billion per annum by 2020. Between USD 4 and 7 billion per annum would be needed by 2015 to reduce deforestation by 25%. Regional organizations and processes have significant potential in leveraging and mobilizing funds for forests, and can help countries to address sustainable forest management challenges in general, and financing of forests in particular. They should help countries to

56
catalyze the preparation of national forest financing strategies, explore forest financing opportunities, bridge gaps and help countries to ensure consistency between national and global polices on forest financing, and enhance inter-regional and intra-regional cooperation on forest financing by sharing relevant experience, knowledge and expertise.
Significant progress has been made at the national, regional and international levels in enhancing the
contribution of forests to long-term sustainable development. There is better and wider understanding of sustainable forest management, and there is now agreement on the forest instrument as a comprehensive instrument on forests containing the four global forest objectives. In addition forests have been integrated into the work of several multilateral environmental agreements.
Progress has also been made in terms of forest law enforcement, governance and related trade as well
as in applying voluntary market based mechanisms. The importance of forests in mitigating and adapting to climate change and in hosting the vast majority of terrestrial biodiversity, among other major functions, is increasingly acknowledged. Some countries provide good examples of how forests can become a centrepiece in this transition.
The full range of forest goods and services needs to be better recognized, including through payments
for ecosystem services, so that they may be internalized in GDP figures. This would strongly contribute to raising the visibility of forests and including them in the political agenda. Sustainable forest management outside protected areas also generates global public goods that need to be compensated. In some cases the term “sustainable” in SFM has come to be interpreted as a focus on only the environmental benefits of forests since Rio. By developing more substantive data on the economic and social functions of forests in the landscape, there is a stronger likelihood that the payments for those goods and services will be more effectively addressed in country budgets, and in leveraging both public and private financing.
To strengthen and mobilize resources for forests at the national level, actions have to be taken to improve policy, legislative and institutional frameworks. It is also necessary to provide a platform for engagement of various stakeholders including the private sector, and to cooperate on strengthening technical and technological capacities of countries. The development and incorporation of national forest funds into national forest financing strategies as instruments of forest policy is another effective option for addressing sector financing needs.
National forest financing strategies should work in a holistic fashion in two ways: (1) by capitalizing
on the linkages with connected sectors and programme objectives (agriculture, water, energy and climate change for example), and (2) by recognizing the importance of trees outside forests and the reciprocal relationship between those trees and forests. The reporting mechanisms under the UNFF and NFPF as well as data collection mechanisms under UNCCD and CBD can be extremely beneficial to improving access to accurate and missing data. Similarly, the Convention on Biological Diversity has an online sourcebook with information on funds related to forest biodiversity.
6. Challenges for the future Despite various initiatives and efforts to increase financial resources available for SFM, especially in
developing countries where the bulk of natural forests are found (and where there are high rates of deforestation), the resources remain insufficient. Both developed and developing countries face multiple challenges with limited resources. For developing countries, the situation is more serious. Financial resources are often insufficient to properly manage vast forest areas, and those forest areas not used for production are rarely self-financing, with subsidies and/or direct action by governments required to manage these areas properly.

57
There are several key challenges that hinder access to and mobilization of additional financing for forests from all sources. Insufficiency of data is one of the existing challenges. There is a clear need to strengthen mechanisms and processes with a focus on collecting national data on forest financing, including in the implementation of the forest instrument. A number of programmes, frameworks and tools are emerging as a basis for gathering much needed information. These would also allow a means through which analyses of gaps and opportunities within the forest sector can be identified and addressed at local and national levels.
An inadequate enabling environment is generally considered to be the primary underlying obstacle to
the mobilization of finance. Such enabling conditions are necessary for both private investment and public sector funding, in particular for attracting external funding. The elements include (1) policy and legislative frameworks, (2) knowledge, (3) national capacity development and institutions and (4) markets and private sector mechanisms and instruments.
In many countries, clear policies for allocating public funding to forests are lacking, and when
policies exist these are weak and unreliable, resulting in significant gaps between estimated resource needs and actual funding allocated. Expenditures on forests are largely pegged at a holding or maintenance level and do not provide for forest development, conservation and management.
Lack of a comprehensive approach to all services and values of forests is also a significant challenge.
In some cases the term “sustainable” in SFM has come to be interpreted as a focus on only the environmental benefits of forests since Rio. By developing more substantive data on the economic and social functions of forests in the landscape, there is a stronger likelihood that the payments for those goods and services will be more effectively addressed in country budgets, and in leveraging both public and private financing.
In addition, the forest sector is not widely understood as being relevant to achieving sustainable
development goals despite forests’ integral role in safeguarding overall landscape multi-functionality. The forest sector in some countries continues to struggle with developing and implementing coherent strategies for sector planning, leading to forest policy priorities that are poorly aligned with other sector’s priorities and broader sustainable development strategies. Significant forest governance and legality challenges continue to undermine financing mobilization efforts due to donor and investor concerns about insecure tenure, illegal activities and a variety of other risk factors.
Local and sub-national forest stakeholders are a critical element in determining the health and
condition of forests and the resources therein, yet they are frequently unable to access and secure the financing needed for SFM, enterprise development and capacity building activities. Problems associated with eligibility, extensive procedural requirements and coordination of priorities to access to external resources can create barriers to forest financing. The full range of forest goods and services needs to be better recognized, including through payments for ecosystem services, so that they may be internalized in GDP figures. This would strongly contribute to raising the visibility of forests and including them in the political agenda. Sustainable forest management outside protected areas also generates global public goods that need to be compensated.
58
APPENDIX A: EXTERNAL FINANCIAL FLOWS TO FORESTS – O DA DISBURSEMENTS
Bilateral and Multilateral Disbursements to Forests, 2002-2010*
Source
2002-2004
2005-
2007
2008-2010
Net Change Net
Change 3-year averages in USD millions at 2010 exchange rates
2002-2004 to 2008-2010
2005-2007 to 2008-2010
Share %
Share %
Share %
Bilateral Australia 9.90 3.05% 6.86 1.73% 33.16 4.70% 235.03% 383.22% Austria 0.26 0.08% 0.31 0.08% 0.42 0.06% 63.34% 34.79% Belgium 1.78 0.55% 2.73 0.69% 9.16 1.30% 413.54% 235.77% Canada 12.52 3.86% 4.63 1.17% 6.84 0.97% -45.38% 47.65% Denmark 1.46 0.45% 3.43 0.86% 3.24 0.46% 121.55% -5.57% Finland 11.43 3.52% 6.95 1.75% 27.54 3.91% 140.84% 296.02% France 4.38 1.35% 4.41 1.11% 5.00 0.71% 14.10% 13.41% Germany 57.95 17.86% 51.24 12.91% 50.26 7.13% -13.26% -1.91% Greece 0.03 0.01% 0.05 0.01% 0.00 0.00% -100.00% -100.00% Ireland 0.10 0.03% 0.00 0.00% 0.00 0.00% -100.00% -100.00% Italy 0.58 0.18% 0.57 0.14% 4.17 0.59% 615.58% 629.00% Japan 109.70 33.82% 213.25 53.71% 279.16 39.61% 154.47% 30.91% Korea 0.00 0.00% 0.88 0.22% 6.11 0.87% … 595.84% Luxembourg 1.30 0.40% 1.29 0.32% 1.31 0.19% 1.23% 2.07% Netherlands 42.00 12.95% 25.14 6.33% 20.45 2.90% -51.32% -18.68% New Zealand 0.40 0.12% 0.37 0.09% 0.50 0.07% 23.62% 33.44% Norway 8.43 2.60% 6.26 1.58% 189.87 26.94% 2153.07% 2931.35% Portugal 0.16 0.05% 0.10 0.03% 0.06 0.01% -63.71% -41.65% Spain 1.45 0.45% 1.56 0.39% 11.43 1.62% 686.05% 633.73% Sweden 6.36 1.96% 9.47 2.38% 12.79 1.81% 101.03% 35.10% Switzerland 9.80 3.02% 9.75 2.46% 13.37 1.90% 36.44% 37.06%

59
United Kingdom 35.76 11.02% 23.70 5.97% 26.94 3.82% -24.67% 13.68% United States 8.63 2.66% 24.11 6.07% 3.04 0.43% -64.75% -87.38% Subtotal 324.39 397.06 704.81 117.27% 77.50%
Multilateral
AfDF 7.08 3.03% 13.79 4.09% 4.45 0.80% -37.15% -67.74% ADB Special Funds 0.00 0.00% 0.00 0.00% 0.38 0.07% … … EIB** 6.97 2.98% 69.57 20.64% 188.39 33.89% 2603.34% 170.77% EU Institutions 7.25 3.10% 49.39 14.66% 52.72 9.48% 627.22% 6.75% GEF*** 73.52 31.43% 95.90 28.46% 97.40 17.52% 32.48% 1.56% ITTO**** 16.92 7.23% 14.53 4.31% 15.18 2.73% -10.25% 4.52% UNDP 0.52 0.22% 0.58 0.17% 0.96 0.17% 84.17% 64.36% UNECE 0.00 0.00% 0.00 0.00% 0.06 0.01% … … WFP 0.00 0.00% 0.00 0.00% 0.00 0.00% … … World Bank***** 121.64 52.01% 93.25 27.67% 196.39 35.33% 61.45% 110.61% Subtotal 233.89 337.01 555.92 137.69% 64.96%
Total 558.28 734.07 1260.73 125.82% 71.75% * Unless otherwise indicated source is OECD.Stat with data extracted on 09 May 2012 15:22 UTC (GMT). ** Source: European Investment Bank. Figures are loans. *** Source: The GEF. GEF forest projects are defined by their inclusion of one of two elements: (1) the project’s contribution to SFM (i.e. the project
addresses one or more of the seven elements of SFM adopted under the UNFF forest instrument; and (2) the project acknowledges the significance of SFM (i.e. USD 1 million or more of funding is directed towards one or more of the seven elements of SFM).
**** Source: ITTO. ***** Source: World Bank Group. Figures include commitments from IBRD/IDA, Recipient Executed A and Special Finance. The Bank uses Sector
coding to facilitate reporting of Bank activities. Sector codes indicate which part of the economy is supported by a Bank intervention. Up to five sector codes can be assigned to any Bank operation, with the proportion of the activities identified. If, for example, a project indicates 20% of a USD 50 million watershed rehabilitation project supporting the forest sector, then USD 10 million would be recorded in the total commitments to forests.