mapping mobile average revenue per user to personal income level via household income &...
TRANSCRIPT

A MODEL FOR MAPPING MOBILE
AVERAGE REVENUE PER USER
TO PERSONAL INCOME VIA HOUSEHOLD
INCOME EXPENDITURE SURVEYS
DR. ASOKA KORALE, C.ENG. MIET & MIESL

INTRODUCTION AND BACKGROUND TO MAPPING ARPU TO INCOME
Slide | 2
1. Household Income Expenditure Survey (HIES )2012-2013 conducted by the Department of Census and Statistics has provided some estimates on household expenditure on telecommunication expenses incurred by households that could be used to extract information needed for planning and programming marketing strategies.
2. The survey had revealed that the average expenditure incurred by households on communication amounts to Rs.892 /= per household. Of this expenditure Rs.567/ was spent on the use of mobile telephones. The survey had also reported that the average household size was 3,8 while the number of income receivers averaged 1.8 thus it is possible to use 2 as the average number of mobile telephone users and as 2 or more particularly in respect of higher income deciles.
3. Based on the data on total household expenditure and its components that are reported for the districts it is possible to disaggregate the estimates to derive on the expenditure incurred on telecomm services and mobile telephone usage for the districts in order to rank and select districts for the marketing campaigns.

Slide | 3
4. As should be expected there is a wide variation in the amounts spent on communication (including fixed, mobile, postage ect…) across the districts with Colombo taking the lead spot with Rs. 1807/ per household.
5. In order to examine the variation in household expenditure on communication and mobile telephones the amounts spent across the expenditure decile groups were examined. There is a close match between household expenditure and household income. The Table -1 shows that the average household expenditure by expenditure decilegroups and corresponding expenditure on communication and mobile telephone usage along with household income based on expenditure decile groups Table -2.
6. The table shows the increase in amounts spent on mobile telephone usage which has amounted to Rs135/ x 567/892= Rs. 86/- in the first expenditure decile rising to Rs2731 x 567/892 = Rs 1736/=in the 10th decile. This rise in mobile usage expenditure along with increase in household expenditure and income, makes it possible to identify users based on expenses on mobile phone usage to treat it as a proxy for estimating household income. Thus, where mobile usage expenditure can be extracted and used to derive the income profile of the income receivers then it will be possible to identify the households on the basis of household incomes and group such households into desired income categories target the those households which had expended over targeted amounts.
INTRODUCTION AND BACKGROUND TO MAPPING ARPU TO INCOME

Slide | 4
7. The form and pattern of increase of household income from the estimated mobile usage expenditure can be plotted against estimated household income using the estimates from the 10 decile values to derive the form of the curve / path and then use it derive estimates for other points along its path. Alternatively regression method using the data set can used to derive income estimates for the needed mobile phone usage expenses.
8. With four persons as the average household size as reported in the survey and with 2 income receivers per household the estimated expenses in the use of mobile telephones is estimated to increase form Rs 86/2 = Rs 43 in the lowest decile to Rs 868/ in the 10th decile/
9. A review of this data source indicates that the average / per person per household expenditure on mobile usage within the districts will also basically follow a similar pattern as that disclosed for the whole country. Thus the same regression equation / graph will provide estimates for the income variable for reported mobile phone usage expenses.
INTRODUCTION AND BACKGROUND TO MAPPING ARPU TO INCOME

Slide | 5
INTRODUCTION AND BACKGROUND TO MAPPING ARPU TO INCOME
10. The survey estimates establish the relationship between household income/ expenditure with the amounts spent on mobile phone usage. The factors that are established for the whole country, the sectoral breakdowns and the districts can be used to identify and group the subscribers based on the amounts spent on mobile phone expenses to income ranges and groups. Using other information available on geographic locality, age and sex data it will be possible to prepare marketing campaigns using better and more objective variables .

Slide | 6
AVERAGE MONTHLY HOUSEHOLD EXPENDITURE AND ON COMMUNICATION
Table - 1

AVERAGE MONTHLY HOUSEHOLD EXPENDITURE VS. INCOME
Slide | 7
Table - 2
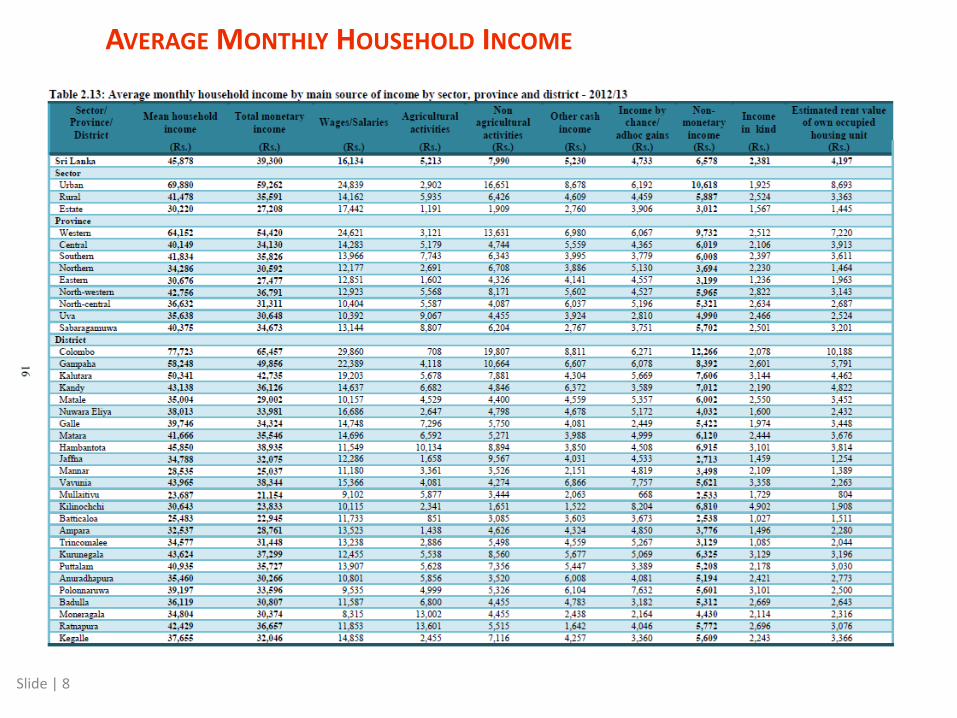
AVERAGE MONTHLY HOUSEHOLD INCOME
Slide | 8

AVERAGE MONTHLY HOUSEHOLD EXPENDITURE ON COMMUNICATION
Slide | 9

Slide | 10
BREAKDOWN OF HOUSEHOLD & PER PERSON COMMUNICATION EXPENDITURE

Slide | 11
DIALOG BLENDED ARPU AND UNADJUSTED ARPU – INCOME MAP
0 100 200 300 400 500 600 700 800 9000
20
40
60
80
100
120
140Per Inc Earner spend on Mobile vs Mean HH Income
Per Inc earner spend on mobile (ARPU)
Mean H
H I
ncom
e (
000)
300
400
500
600
700
800
Colo
mbo
Gam
paha
Mannar
Kili
nochchi
Mulla
itiv
u
Jaff
na
Vavuniy
a
Putt
ala
m
Kalu
tara
Kandy
Trincom
ale
e
Nuw
ara
Eliy
a
Mata
le
Kuru
negala
Galle
Batt
icalo
a
Badulla
Polo
nnaru
wa
Am
para
Kegalle
Monara
gala
Ratn
apura
Mata
ra
Anura
dhapura
Ham
banto
ta
• These are unadjusted values that need to be shifted to align with Mobile
ARPU in each district
• The shift amount is the difference in blended ARPU for that district and
the ARPU predicted by the survey ta the mean income level of that
district

Slide | 12
ADJUSTED ARPU – INCOME MAP - COLOMBO
• Mapping results calculated for each district and available with BI
• Result for
Colombo
calculated
by shifting
plot on
slide 11 by
247
• Required
shift
amounts
for each
district
found on
slide 13

Slide | 13
BLENDED ARPU VS. AVERAGE INCOME IN DISTRICT
So districts on the line 1, 10, 12, 19 (as are points that fall on line 20, 18, 14, 9) largely follow the mapping as their shifts are similar. Each district adjusted separately and independently of the others
The others can use a different mapping on a case by case basis or clustering close Points to determine degree of offset

Slide | 14
NOTABLE POINTS
• The proportion of fixed lines will vary from district to district so the factor of 567/892 or 146/230 used to compute the proportion of mobile expense from total communication expense will change from place to place
• The proportion of pre paid to post paid will also similarly change from district to district and as the Dialog revenues differ widely in this respect the
• It can be expected that in those districts where the fixed line penetration is very low most of the communication expense will go towards mobile
• There may also be a relationship between post paid connections and a fixed line in a household.
• There may be also be the possibility that pre paid connections are mainly prevalent in households that don’t usually have a fixed line connection.• To examine this one would have to correlate the fixed line penetration across
districts with pre and post split
• The average district spend on mobile per income-expenditure decile from the survey is a blended value• it may be possible to estimate pre and post components by studying dialog mobile
district distribution
• Due to tax and other reasons respondents to the survey may under report both income and expenditure