mapping industrial districts by using lmas: quality issues ... · agglomerazione e apertura...
TRANSCRIPT

Mapping industrial districts by using LMAs:
quality issues and spatial patterns
Silvia Lombardi and Michele D’Alò
Rome, 16.06.2017
Outline
1. Mapping Industrial districts: issues at stake
2. Objective and methodology
3. Spatial dependence and LMAs
4. Semi-parametric model – initial results
5. Conclusions and future developments
Mapping industrial districts by using LMAs: quality issues and spatial patterns. Silvia Lombardi – Rome, 16.06.2017

• The use of labour market areas (LMAs) is an issue at stake in
official statistics given their informative potential in terms of
detection of socio-economic phenomena at the territorial level.
• Mapping Industrial districts (IDs) is an application of LMAs for
the identification of meaningful territorial units in Italy in terms
of manufacturing concentrations of specialized firms.
• Such mapping has provided the quantitative evidence of the
IDs thesis which has risen the attention of policy makers on
the territorial dimension conceived as the basis for economic
and industrial local policies.
Mapping Industrial districts: issues at stake
1
Mapping industrial districts by using LMAs: quality issues and spatial patterns. Silvia Lombardi – Rome, 16.06.2017

• Economic literature has undergone a widespread debate
around the most accurate methodologies for the mapping of IDs
• Heterogeneity of results may be due to the application of
different methodologies (see, among others, Iuzzolino, 2004;
COGIS, 2005; Alampi et al, 2013; Canello and Pavone, 2015;
see an updated review in Lombardi and Lorenzini, 2017)
• The very beginning of the debate (but not the whole issue) is
whether the use of LMAs as unit of analysis is appropriate or
not:
commuting flows actually change over time, LMAs are not a
good proxy of the socio-economic space; which is the best
mechanism to define the aggregation of communities?
the underpinning of IDs theory is the interaction between
the population of firms and the community of people
2
Mapping industrial districts by using LMAs: quality issues and spatial patterns. Silvia Lombardi – Rome, 16.06.2017
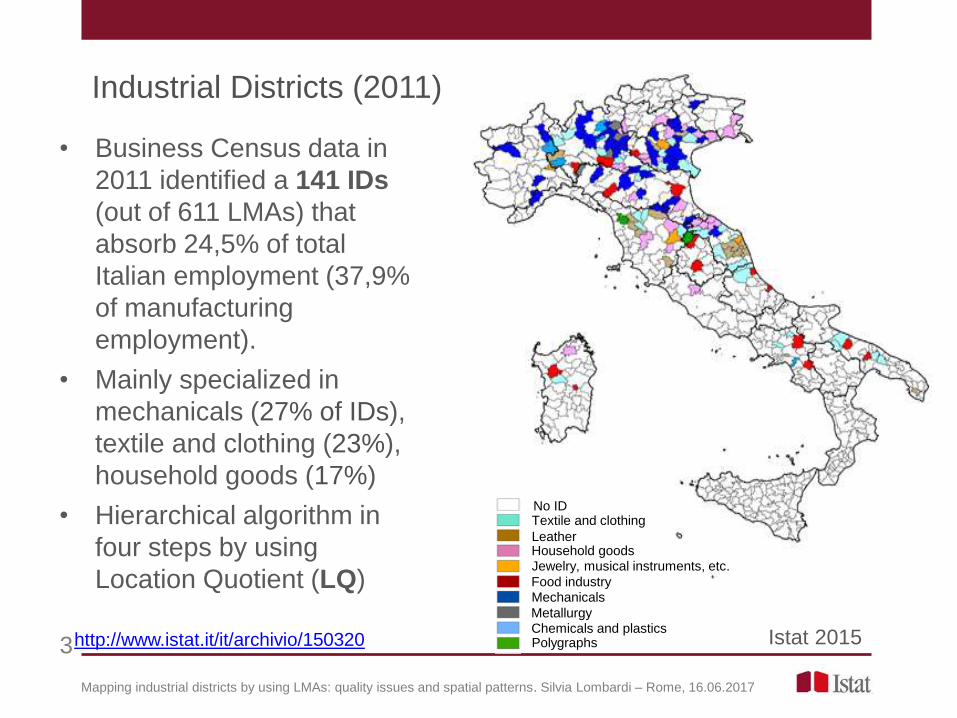
Industrial Districts (2011)
• Business Census data in
2011 identified a 141 IDs
(out of 611 LMAs) that
absorb 24,5% of total
Italian employment (37,9%
of manufacturing
employment).
• Mainly specialized in
mechanicals (27% of IDs),
textile and clothing (23%),
household goods (17%)
• Hierarchical algorithm in
four steps by using
Location Quotient (LQ)
Textile and clothing
Leather Household goods Jewelry, musical instruments, etc.
Food industry Mechanicals
Metallurgy Chemicals and plastics Polygraphs
No ID
http://www.istat.it/it/archivio/150320 Istat 2015
Mapping industrial districts by using LMAs: quality issues and spatial patterns. Silvia Lombardi – Rome, 16.06.2017
3

Objective
4
• To provide spatial statistics evidences in order to assess the
robustness of the official mapping methodology of IDs
based on LMAs as well as its capability to detect the IDs
phenomenon.
• Test for the presence of spatial dependence patterns at the
community level
Mapping industrial districts by using LMAs: quality issues and spatial patterns. Silvia Lombardi – Rome, 16.06.2017

• We take into consideration specialization patterns and spatial
dependence across communities
by using the same indicator of the official mapping
methodology, that is: Location Quotient (LQ) on manufacturing
activities
Testing for spatial autocorrelation patterns on manufacturing
activities by applying a Local index of spatial agglomeration
(LISA) in order to detect clusters of communities
• Compare results with IDs at the community level
• Apply Geo-additive model (GAM) in order to take into
consideration non linearities in the agglomeration pattern (initial
results)
• 2011 Business Census data (persons employed at the
establishment level)
Methodology and data
5
Mapping industrial districts by using LMAs: quality issues and spatial patterns. Silvia Lombardi – Rome, 16.06.2017
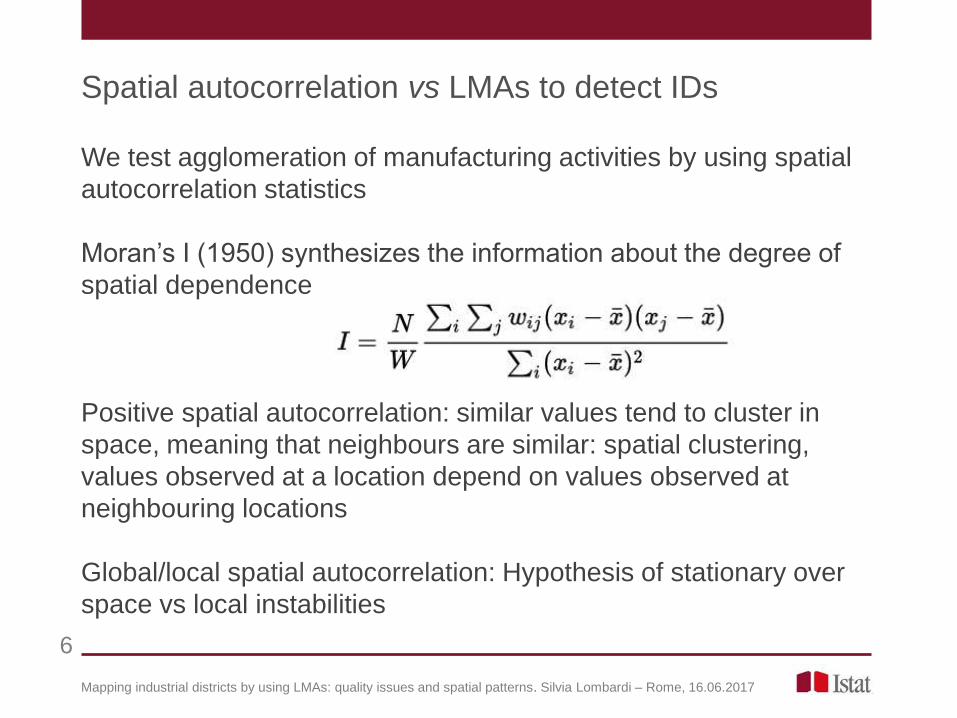
We test agglomeration of manufacturing activities by using spatial
autocorrelation statistics
Moran’s I (1950) synthesizes the information about the degree of
spatial dependence
Positive spatial autocorrelation: similar values tend to cluster in
space, meaning that neighbours are similar: spatial clustering,
values observed at a location depend on values observed at
neighbouring locations
Global/local spatial autocorrelation: Hypothesis of stationary over
space vs local instabilities
Spatial autocorrelation vs LMAs to detect IDs
6
Mapping industrial districts by using LMAs: quality issues and spatial patterns. Silvia Lombardi – Rome, 16.06.2017

Moran’s I can be decomposed into local values (Anselin, 1995): Local
Moran is a local index of spatial agglomeration (LISA) used to detects
cluster, that is areal units with similar neighbours:
Ii is calculated for each areal unit. We analyse the High-High clusters of
communities
We apply such local index of spatial agglomeration to a set of metrics:
• the share of employment in manufacturing activities
• LQ of manufacturing activities
LQm = ( LMAemp, Nace / ITAemp, Nace ) / ( LMAemp, tot / ITAemp, tot )
• LQ of specialization industries
LQind = ( LMAemp, ind / ITAemp, ind ) / (LMAemp, man / ITAemp, man )
Local Moran’s Index (1/2)
7
Mapping industrial districts by using LMAs: quality issues and spatial patterns. Silvia Lombardi – Rome, 16.06.2017

Identifying spatial weights matrix
k-Nearest neighbors vs Contiguity–based neighborhood
Data: LQ of manufacturing activities
8
Local Moran’s index (2/2)
Spatial matrix Moran’s I value Expectation P-value
Knn=5 4.30 -1.24 0.000
Knn=7 4.18 -1.24 0.000
Knn=10 0.41 -0.00 0.000
Queen 4.03 -1.24 0.000
There is positive global autocorrelation
We choose Knn=5 as performs the maximun value of Moran’s I
Mapping industrial districts by using LMAs: quality issues and spatial patterns. Silvia Lombardi – Rome, 16.06.2017

Results - Local Index of Spatial Agglomeration (LISA)
Metric IDs Communities
covered by LISA* LMAs (IDs) covered
by LISA*
v.a. % v.a. %
Manufacturing share (a) 744 33.6 106 75.2
Manufacturing LQ (b) 839 37.9 109 77.3
In common btw (a) and (b) 716 32.4 104 73.8
Textile LQ 213 46.4 30 93.8
Mechanicals LQ 269 32.8 32 84.2
Households goods LQ 86 30.6 21 87.5
Food LQ 34 19.7 7 46.7
Leather LQ 99 62.3 17 100.0
Jewelry, musical instruments, etc. LQ 35 70.0 4 100.0
Chemicals and plastics LQ 34 33.0 4 80.0
Metallurgy LQ 22 33.3 4 100.0
Polygraphs LQ 4 44.4 1 50.0
Coverage: N. of LMAs involving at least one LISA H-H community
by sector is 82.5% on average
Mapping industrial districts by using LMAs: quality issues and spatial patterns. Silvia Lombardi – Rome, 16.06.2017

Comparison between IDs communities and LISA H-H communities
459
821
281
173 159
50
103
66
9
790
817
691
869
263
86
310
102
141
213
269
86
34
99
35 34 22
4
0
100
200
300
400
500
600
700
800
900
1000
Textile andclothing
Mechanicals Householdgoods
Foodindustry
Leather Jewelry,musical
instruments, etc.
Chemicalsand plastics
Metallurgy Polygraphs
IDs communities
LISA H-H communities
INTERSECTION
Mapping industrial districts by using LMAs: quality issues and spatial patterns. Silvia Lombardi – Rome, 16.06.2017
10

IDs and LMAs containing LISA H-H communities
32
38
24
15
17
4 5
4
2
30
32
21
7
17
4 4 4
1
0
5
10
15
20
25
30
35
40
Textile andclothing
Mechanicals Householdgoods
Foodindustry
Leather Jewelry,musical
instruments, etc.
Chemicalsand plastics
Metallurgy Polygraphs
IDs ISTAT
IDs & LISA communities
Mapping industrial districts by using LMAs: quality issues and spatial patterns. Silvia Lombardi – Rome, 16.06.2017
11

IDs vs manufacturing LQ
Mapping industrial districts by using LMAs: quality issues and spatial patterns. Silvia Lombardi – Rome, 16.06.2017
12
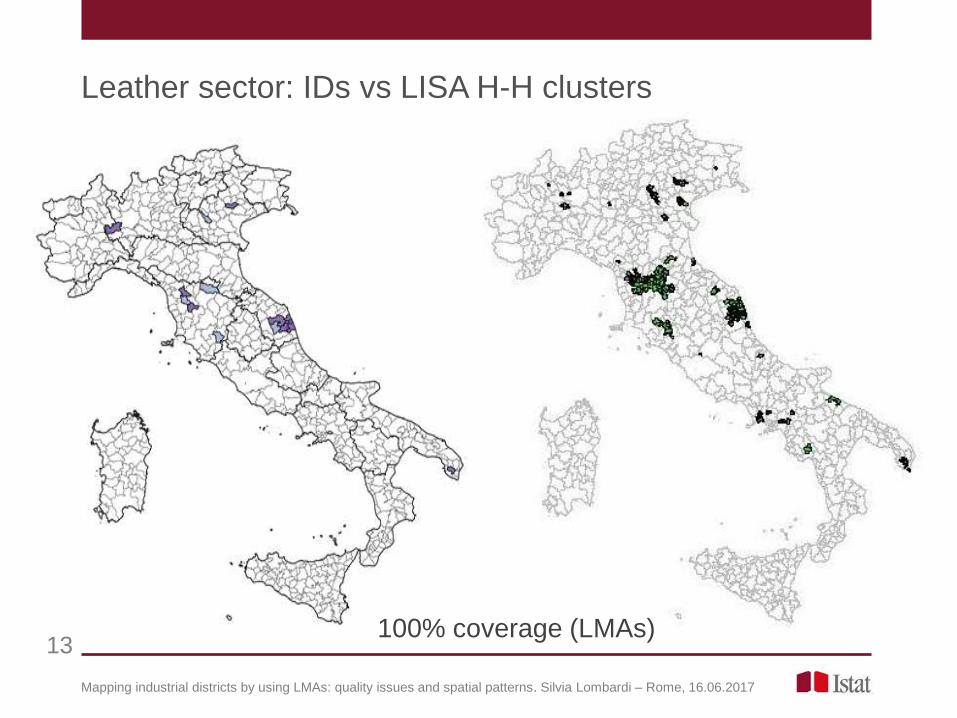
Leather sector: IDs vs LISA H-H clusters
Mapping industrial districts by using LMAs: quality issues and spatial patterns. Silvia Lombardi – Rome, 16.06.2017
13 100% coverage (LMAs)

Textile sector: IDs vs LISA H-H clusters
Mapping industrial districts by using LMAs: quality issues and spatial patterns. Silvia Lombardi – Rome, 16.06.2017
14 93.8% coverage

Mechanicals sector: IDs vs LISA H-H clusters
Mapping industrial districts by using LMAs: quality issues and spatial patterns. Silvia Lombardi – Rome, 16.06.2017
• 84.2% coverage 15

• Spatial dependency of manufacturing employment has been
also analyzed through a non parametric model
Yij= S(latitude; longitude) + εij
• The model highlights areas with higher manufacturing
propensity due to spatial dependency
• The inclusion of smooth terms in the covariates takes into
consideration non-linearities in the relationship between
covariates and manufacturing LQ
GAM – initial results (1/3)
16
Mapping industrial districts by using LMAs: quality issues and spatial patterns. Silvia Lombardi – Rome, 16.06.2017

LQij= s(ni; ei) + εij
In green:
communities where
geographical conditions
favour manufacturing
agglomeration
GAM Model (2/3)
17
Mapping industrial districts by using LMAs: quality issues and spatial patterns. Silvia Lombardi – Rome, 16.06.2017

LQij= f(employment rate; active population) +f(ei; ni) + εij
GAM Model (3/3)
18
By adding socio-
economic covariates in
addition to spatial
variable emerge other
factors correlated to
manufacturing propensity
of communities.
Preliminary results show
a slightly more
geopardized map of
manufacturing activities
Mapping industrial districts by using LMAs: quality issues and spatial patterns. Silvia Lombardi – Rome, 16.06.2017

Conclusions
19
• Results show the presence of a core of LMAs identified as
IDs and including communities detected by agglomeration
patterns applying Local Moran's I
• The analysis will be further developed by anlysing geo-sector
patterns (GAM, SAR) in relation to economic variables in
order to analyse relationship between industry structure and
agglomeration forces as derived from economic literature
Thank you for your attention!
Mapping industrial districts by using LMAs: quality issues and spatial patterns. Silvia Lombardi – Rome, 16.06.2017
References
Alampi D., Conti L., Iuzzolino G., Mele D. 2013. Le agglomerazioni industriali
italiane nel confronto internazionale. In Omiccioli M. (a cura di), 2013. I sistemi
produttivi locali. Trasformazioni fra globalizzazione e crisi. Roma: Carocci editore
Anselin, L. 1995. Local indicators of spatial association, Geographical Analysis, 27,
93–115.
Canello J., Pavone P. 2015. Mapping the Multifaceted Patterns of Industrial
Districts: A New Empirical Procedure with Application to Italian Data. Regional
Studies, DOI: 10.1080/00343404.2015.1011611
Istat, 2015. I distretti Industriali. Anno 2011. Statistiche report. Roma. 24.02.2015.
Iuzzolino G. 2004. Costruzione di un algoritmo di identificazione delle
agglomerazioni territoriali di attività manifatturiere. In: Economie locali, modelli di
agglomerazione e apertura internazionale. Roma: Banca d’Italia, Atti di convegni.
Lombardi S., Lorenzini F. 2017 (forthcoming). Mapping industrial districts: a
methodological review. Italian Journal of Regional Studies.
Moran P.A.P. 1950. Notes on continuous stochastic phenomena. Biometrika, 37:17
Mapping industrial districts by using LMAs: quality issues and spatial patterns. Silvia Lombardi – Rome, 16.06.2017
20