mapping headwater streams using lidar: finding streams … › sites › wrrc.unh.edu › files ›...
TRANSCRIPT
Mapping headwater streams using LiDAR: Finding streams
beyond the blue lines
Neil OlsonNew Hampshire Geological
Survey/Department of Environmental Services
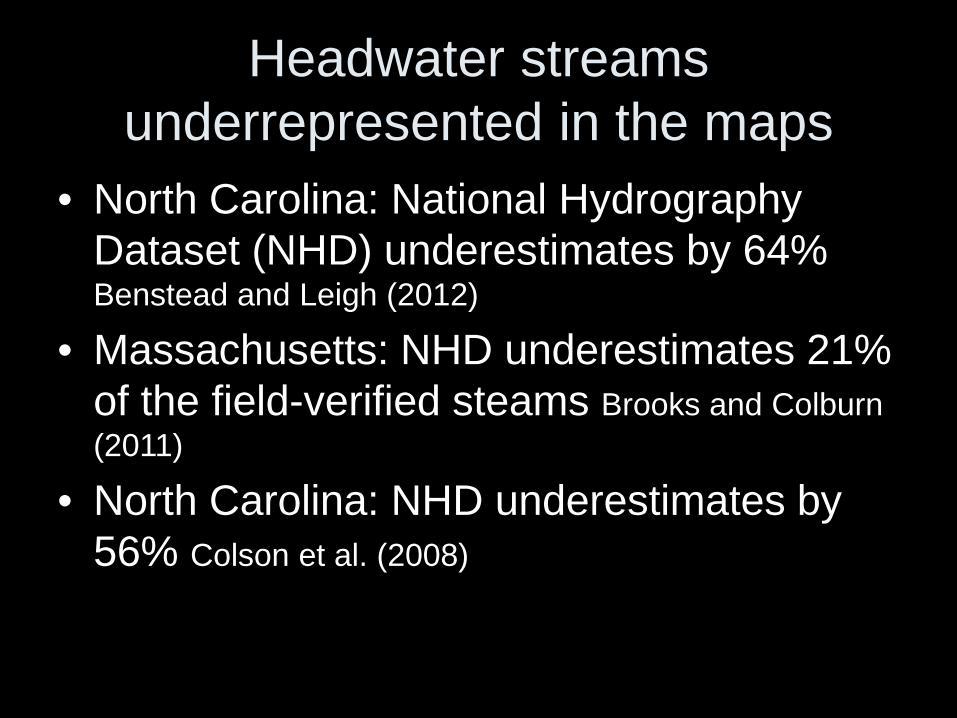
Headwater streams underrepresented in the maps
• North Carolina: National Hydrography Dataset (NHD) underestimates by 64% Benstead and Leigh (2012)
• Massachusetts: NHD underestimates 21% of the field-verified steams Brooks and Colburn (2011)
• North Carolina: NHD underestimates by 56% Colson et al. (2008)

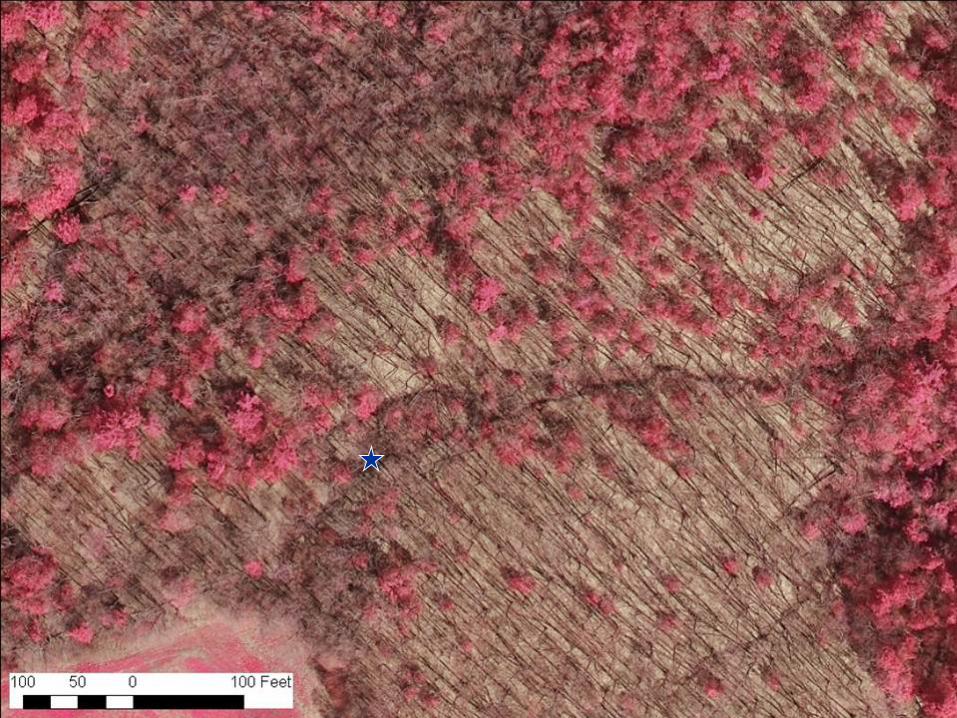
Difficulties with photo-interpretation
• New Hampshire is the most forested state in the contiguous US (88.9%) (Nowak and Greenfield 2012)
• You can’t map what you can’t see
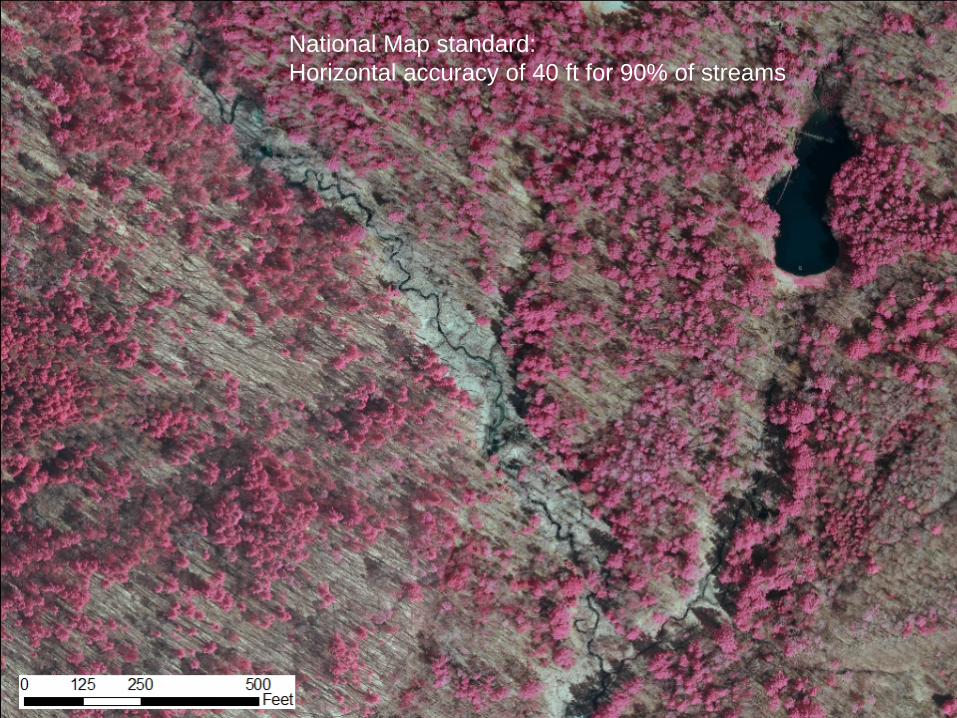
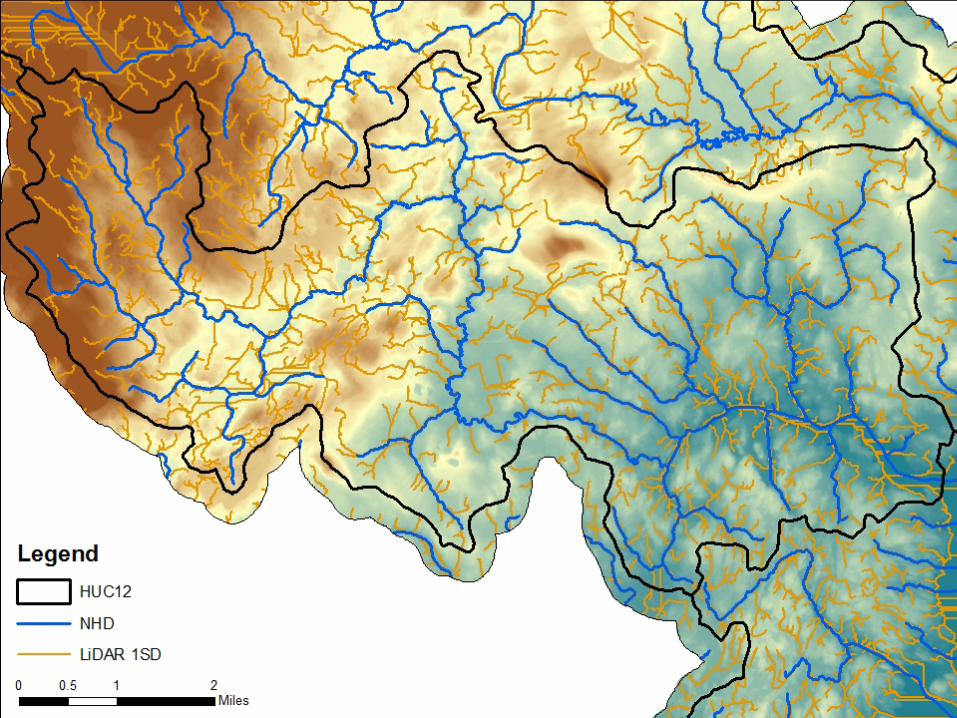
National Map standard:Horizontal accuracy of 40 ft for 90% of streams
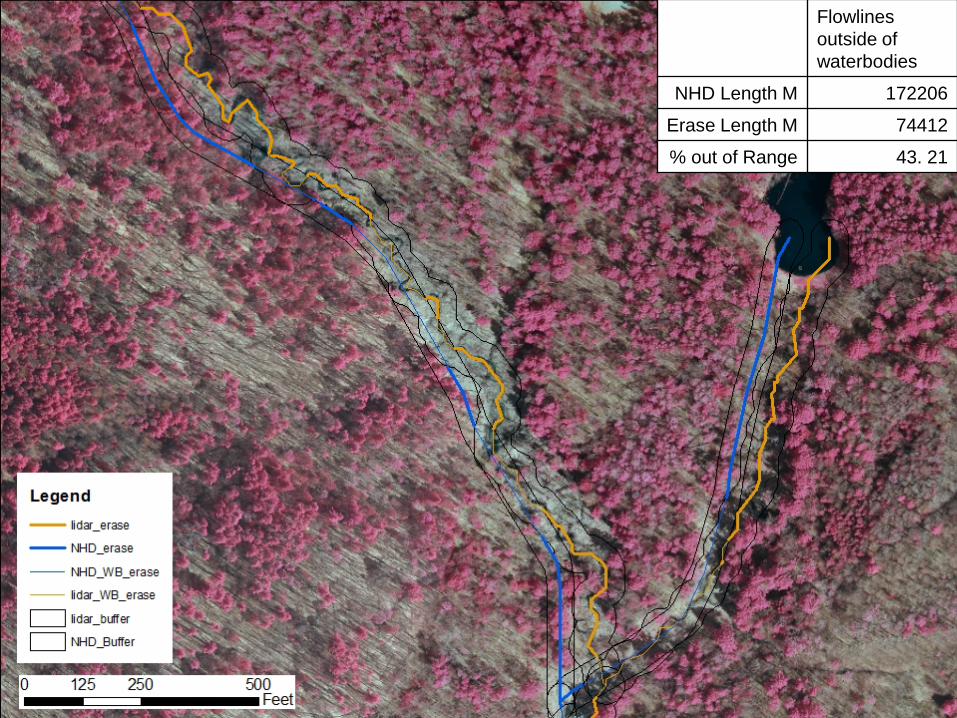
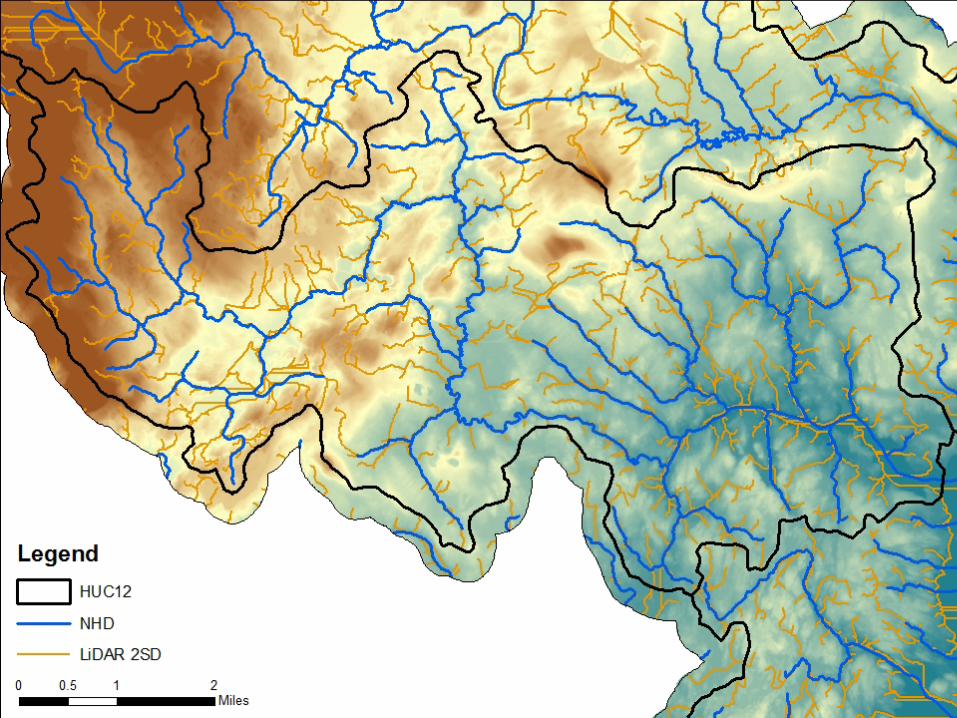
Flowlines outside of waterbodies
NHD Length M 172206
Erase Length M 74412
% out of Range 43. 21
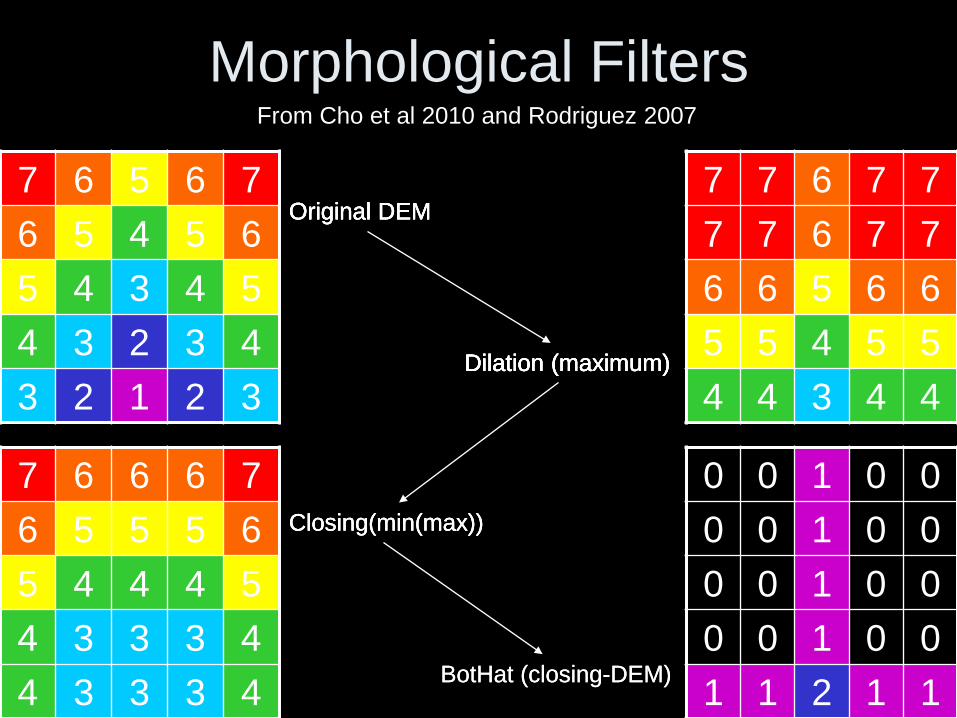
Morphological Filters
7 6 5 6 76 5 4 5 65 4 3 4 54 3 2 3 43 2 1 2 3
7 7 6 7 77 7 6 7 76 6 5 6 65 5 4 5 54 4 3 4 4
7 6 6 6 76 5 5 5 65 4 4 4 54 3 3 3 44 3 3 3 4
0 0 1 0 00 0 1 0 00 0 1 0 00 0 1 0 01 1 2 1 1
Original DEM
Dilation (maximum)
Closing(min(max))
BotHat (closing-DEM)
From Cho et al 2010 and Rodriguez 2007
Original DEM
Dilation (maximum)
Closing(min(max))
Original DEM
Dilation (maximum)
BotHat (closing-DEM)
Closing(min(max))
Original DEM
Dilation (maximum)
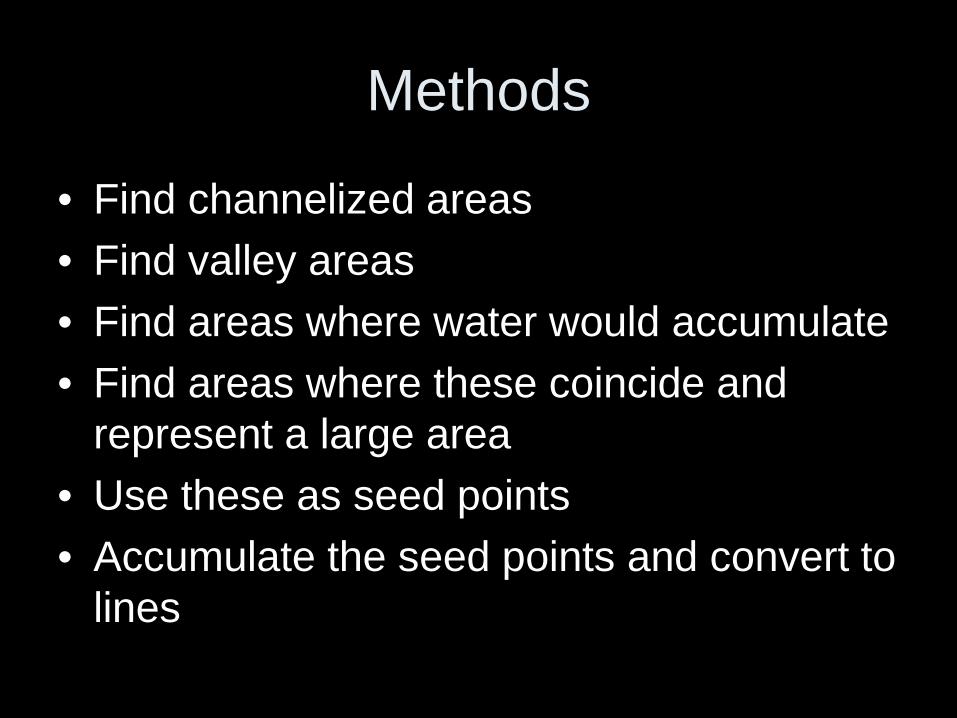
Methods
• Find channelized areas• Find valley areas• Find areas where water would accumulate• Find areas where these coincide and
represent a large area• Use these as seed points • Accumulate the seed points and convert to
lines
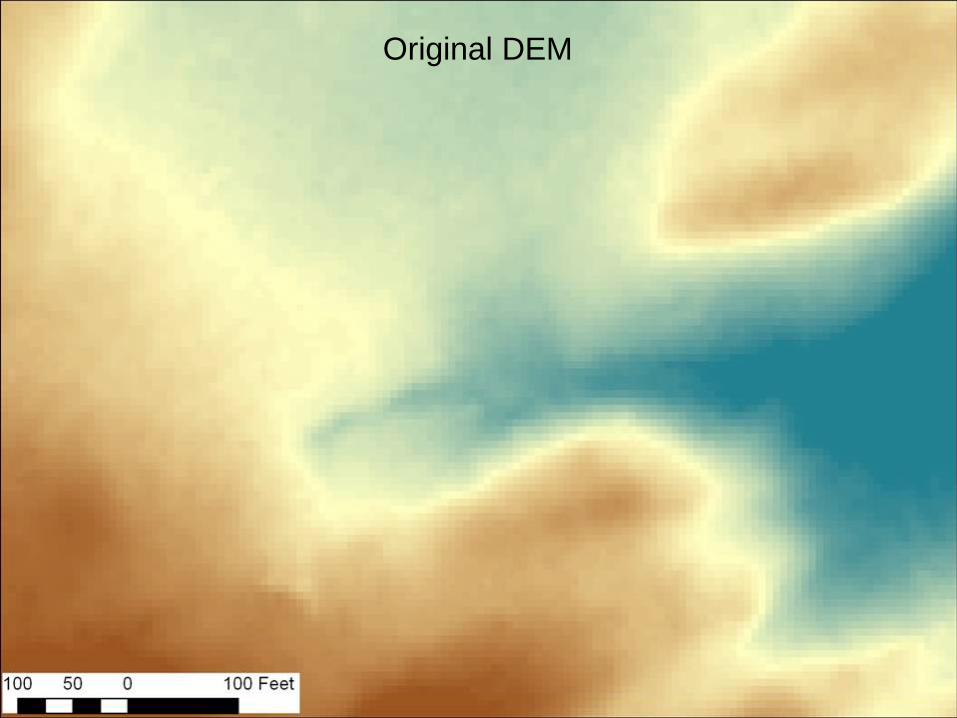
Original DEM
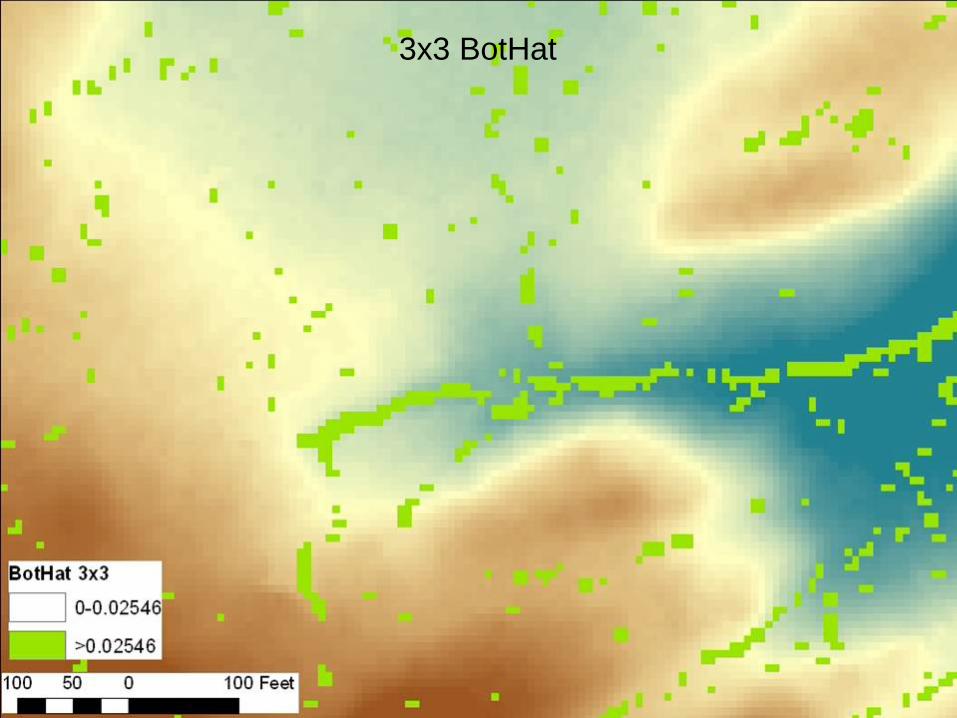
3x3 BotHat
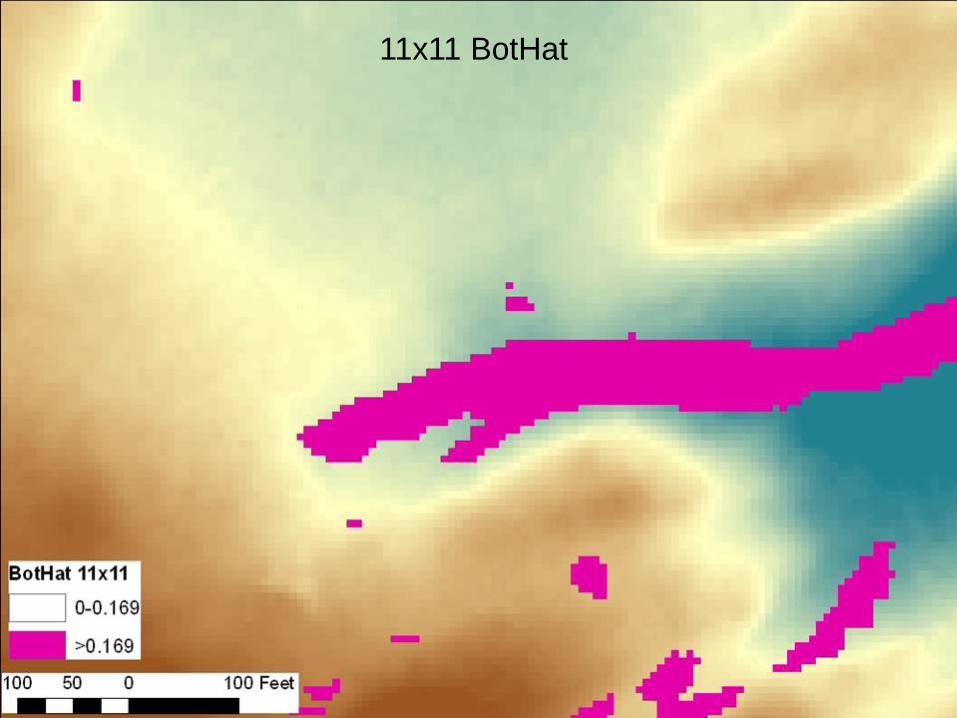
11x11 BotHat
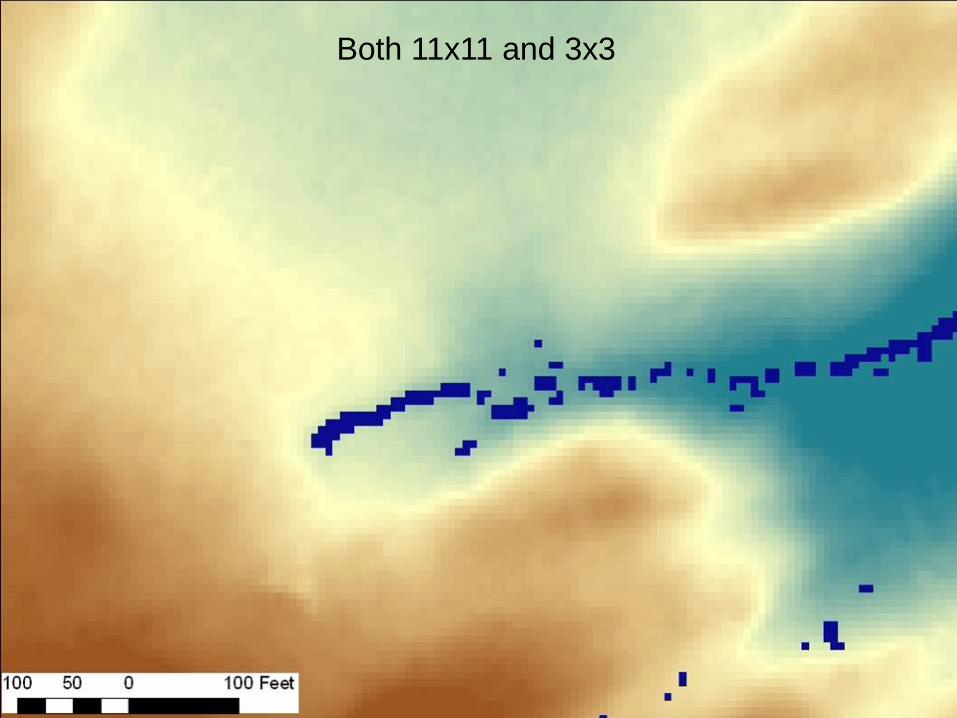
Both 11x11 and 3x3
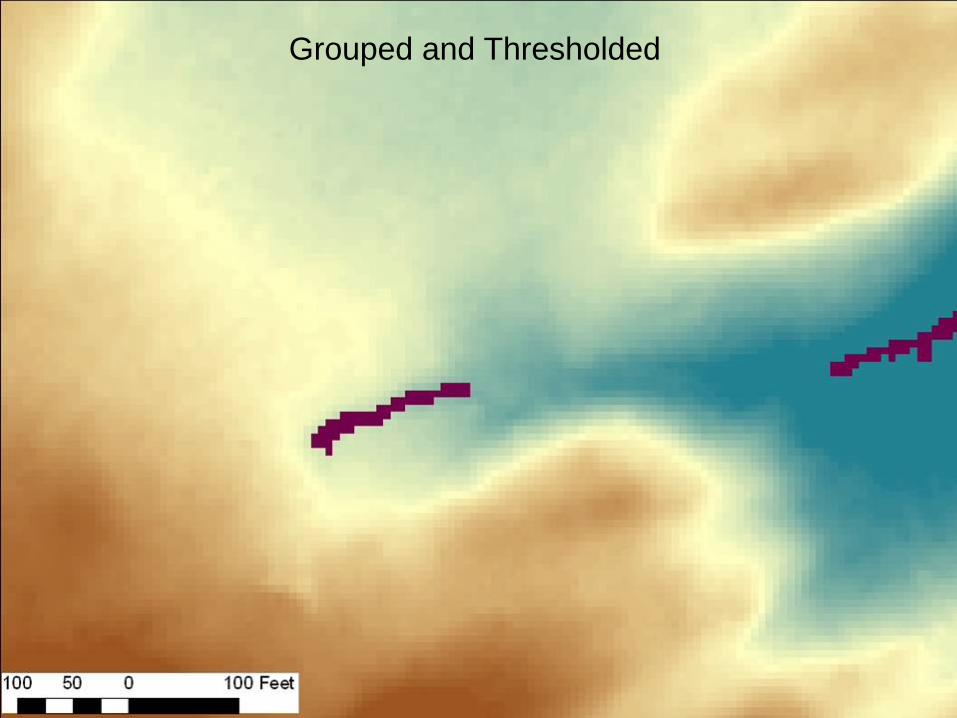
Grouped and Thresholded
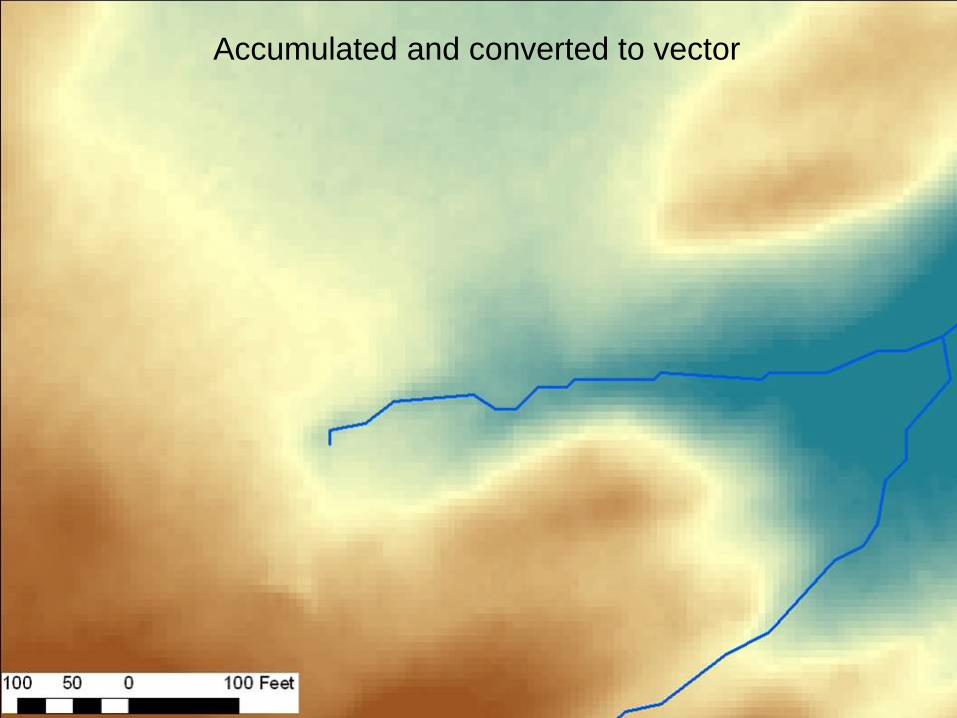
Accumulated and converted to vector
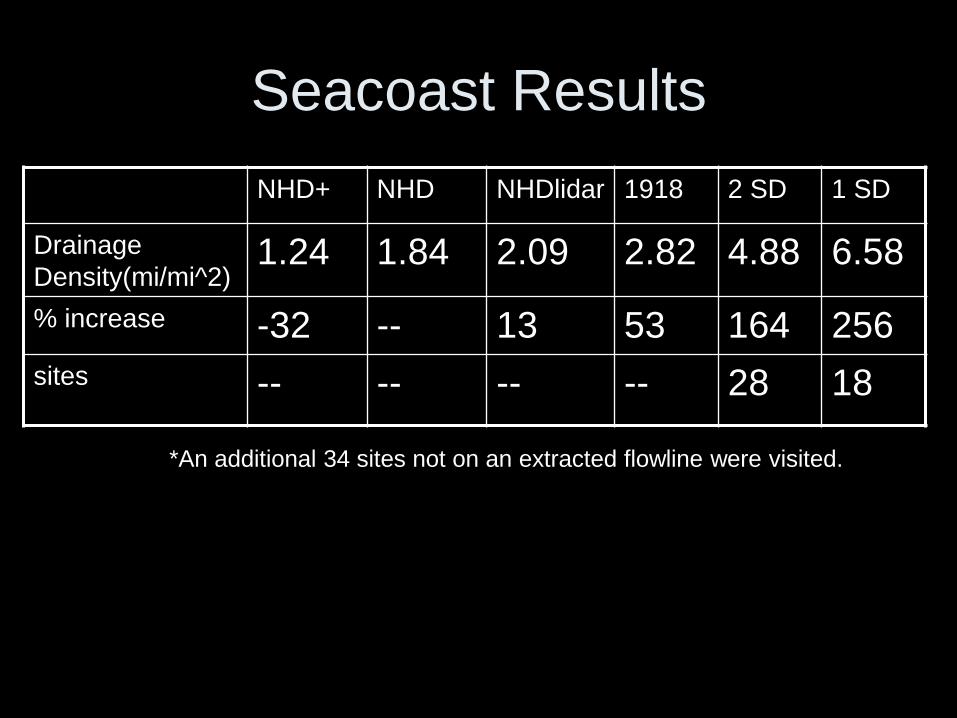
Seacoast ResultsNHD+ NHD NHDlidar 1918 2 SD 1 SD
Drainage Density(mi/mi^2)
1.24 1.84 2.09 2.82 4.88 6.58
% increase -32 -- 13 53 164 256sites -- -- -- -- 28 18
*An additional 34 sites not on an extracted flowline were visited.
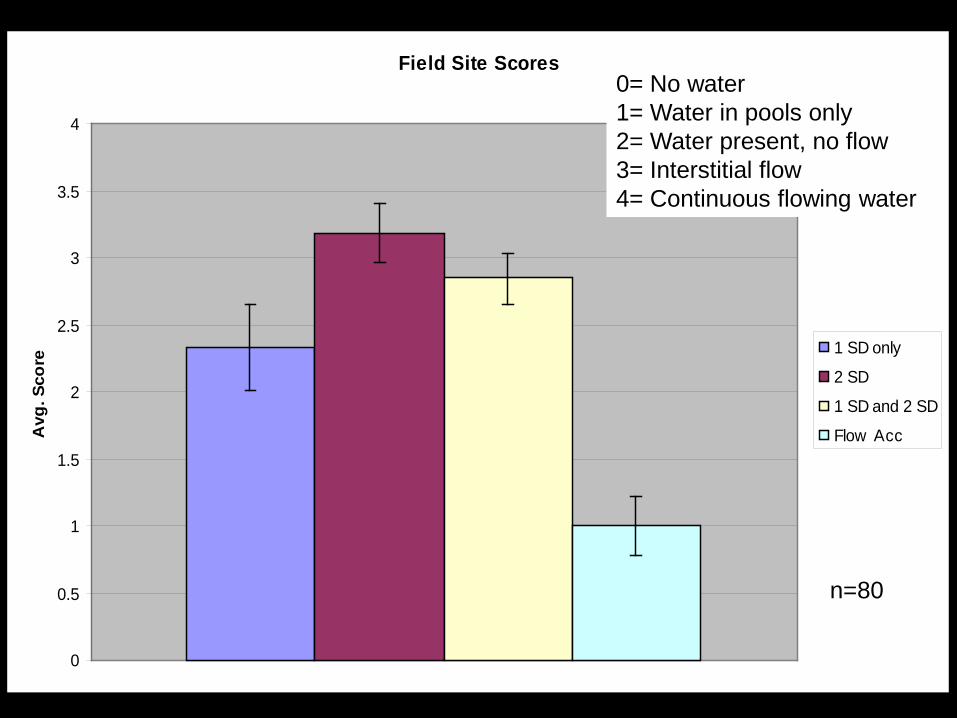
Field Site Scores
0
0.5
1
1.5
2
2.5
3
3.5
4
Avg
. Sco
re
1 SD only
2 SD
1 SD and 2 SD
Flow Acc
0= No water1= Water in pools only2= Water present, no flow3= Interstitial flow4= Continuous flowing water
n=80
n=80
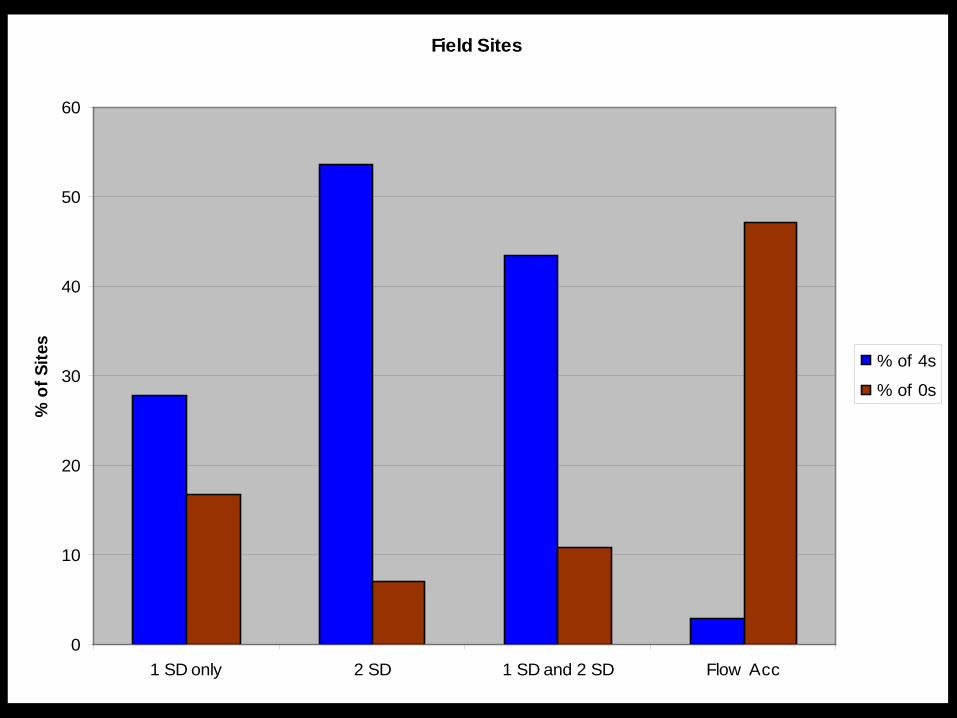
Field Sites
0
10
20
30
40
50
60
1 SD only 2 SD 1 SD and 2 SD Flow Acc
% o
f Site
s
% of 4s
% of 0s

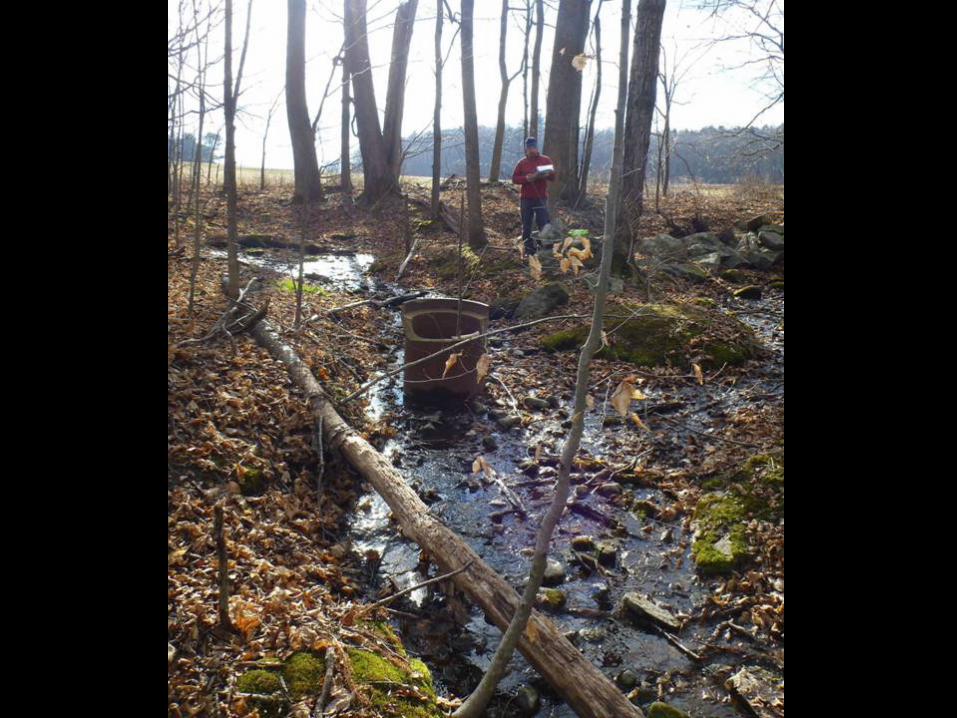
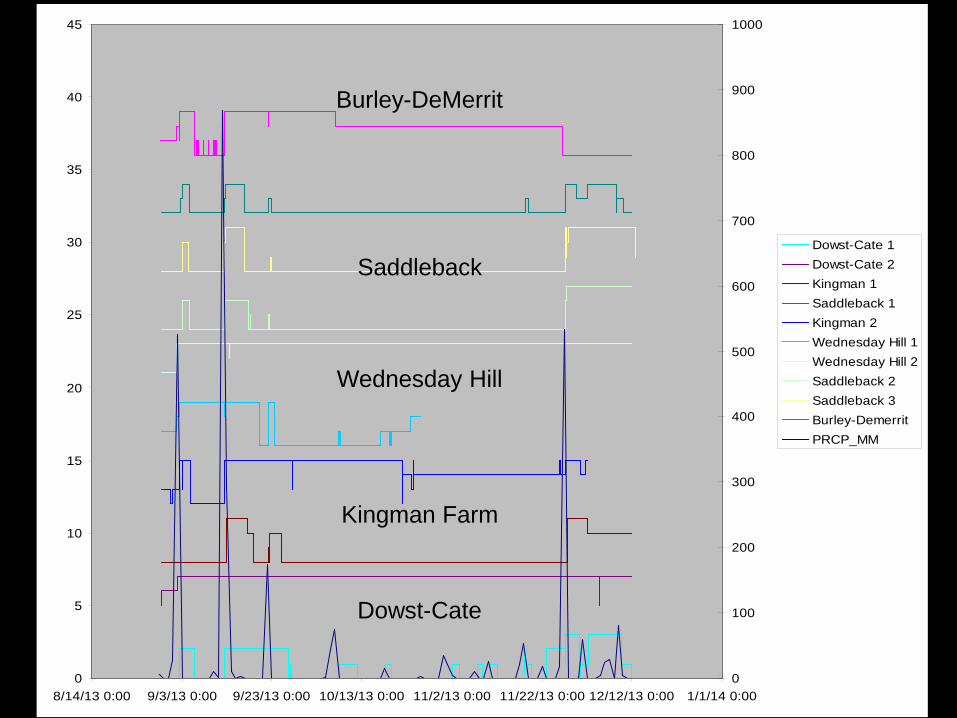
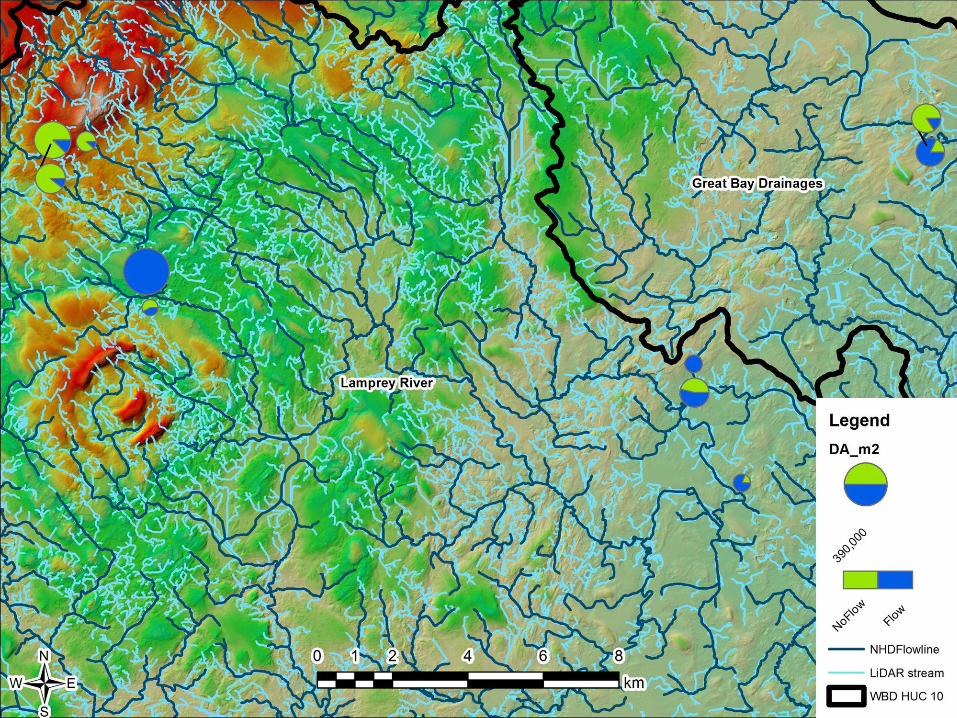
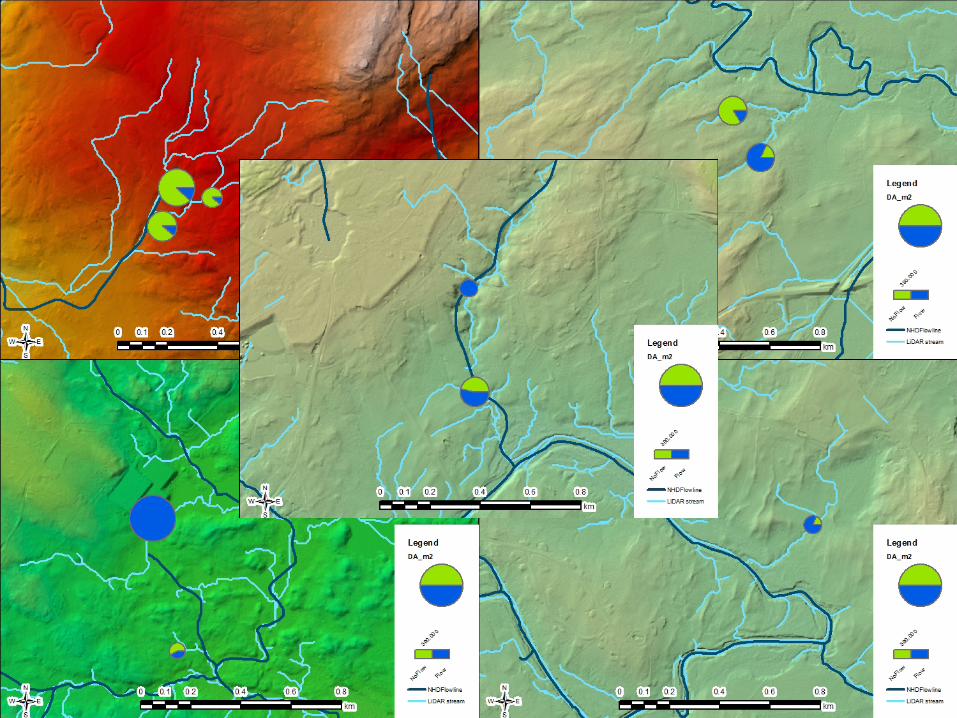
Permanance• Ten streams in the seacoast region were fitted with
simple state sensors following the design of Bhamjee and Lindsay 2011
• Streams were unmapped tributaries to 1st order NHD streams
0
5
10
15
20
25
30
35
40
45
8/14/13 0:00 9/3/13 0:00 9/23/13 0:00 10/13/13 0:00 11/2/13 0:00 11/22/13 0:00 12/12/13 0:00 1/1/14 0:000
100
200
300
400
500
600
700
800
900
1000
Dowst-Cate 1Dowst-Cate 2Kingman 1Saddleback 1Kingman 2Wednesday Hill 1Wednesday Hill 2Saddleback 2Saddleback 3Burley-DemerritPRCP_MM
Saddleback
Dowst-Cate
Wednesday Hill
Kingman Farm
Burley-DeMerrit
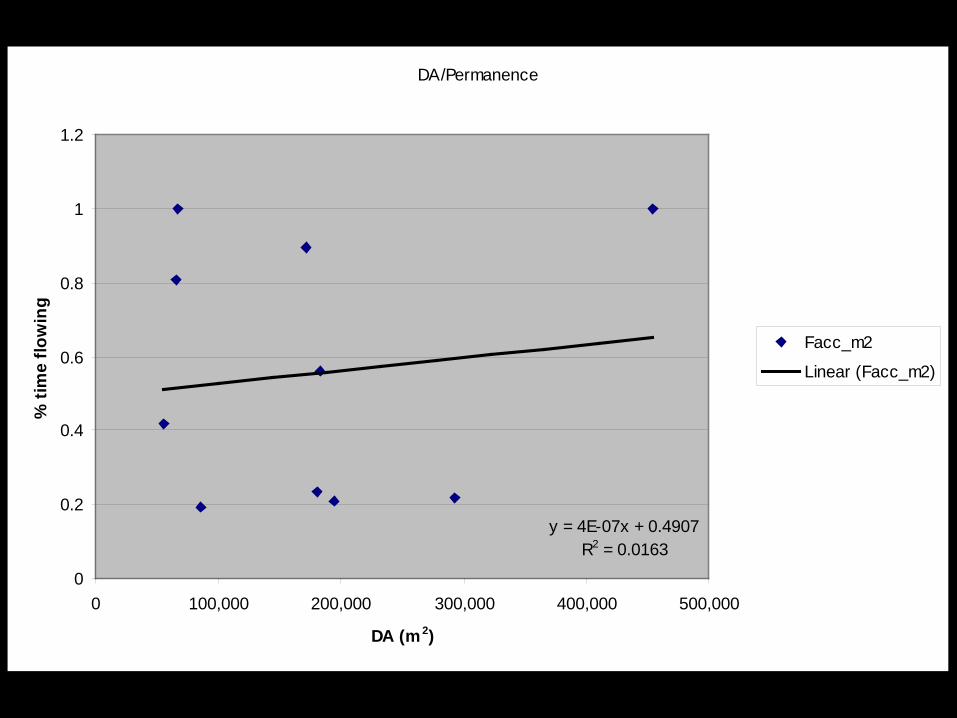
DA/Permanence
y = 4E-07x + 0.4907R2 = 0.0163
0
0.2
0.4
0.6
0.8
1
1.2
0 100,000 200,000 300,000 400,000 500,000
DA (m2)
% ti
me
flow
ing
Facc_m2
Linear (Facc_m2)
References
• Benstead, JP and Leigh, DS, 2012 An expanded role for river networks Nature Geoscience Vol 5, October 2012
• Bhamjee, R and Lindsay, JB, 2011 Ephemeral stream sensor design using state loggers. Hydrology and Earth Systems Science 15 pp1009-1021
• Brooks and Colbern 2011 Extent and Channel Morphology of Unmapped Headwater Stream Segments of the Quabbin Watershed, MA Journal of the American Water Resources Association v47 no1 pp 158-168
• Cho, H.C., Slatton, K.C., Krekeller, C.R., and Cheung, S., 2011. Morphology-based approaches for detecting stream channels from ALSM data. International Journal of Remote Sensing, v32 no.24 9571-9597
• Colson, T, Gregory, J, Dorney, J, and Russel, P 2008 Topographic and Soil Maps Do Not Accurately Depict Headwater Stream Networks. Nation Wetlands Newsletter Vol 30 no 3
• Nowak, D.J. and Greenfield, E.J. 2012 Tree and impervious cover in the United States, Landscape and Urban Planing 107 pp 21-30
• Rodriguez, F., Maire, E., Courjault-Rade, P., and Darrozes, J., 2002. The Black Top Hat Function applied to a DEM: A tool to estimate recent incision in a mountainous watershed (Estibere Watershed, Central Pyrenees), Geophysical Research Letters v29 no.6 1085
Funding provided by USGS grant G11AC20527Thanks to Jeremy Nicoletti, Rick Chormann, Shan Zuidema, Jake Seterraand Matt Davis
Questions?