mapping functional connectivity - srs.fs.usda.gov · scape remains equivocal (harris, 1984; noss,...
TRANSCRIPT

ECOLOGICAL INDICATORS 9 (2009) 64-71
available at www.sciencedirect.com
.-."" •• ; II ScienceDirect
ELSEVIER journal homepage: www.elsevier.comllocate/ecolind
Mapping functional connectivity
Peter Vogt Q,*, Joseph R. Ferrari b, Todd R. Lookingbill b, Robert H. Gardner b,
Kurt H. Riitters c, Katarzyna Ostapowicz a,d
a Joint Research Centre of the European Commission, Institute for Environment and Sustainability (IES), Land Management and Natural Hazards Unit (LMNH), T.P. 261, Via E. Fermi, 2749 1-21027 Ispra (VA), Italy b Appalachian Laboratory, University of Maryland Center for Environmental Science, Frostburg, MD 21532, USA C US Forest Service, Southern Research Station, 3041 Cornwallis Road, Research Triangle Park, NC 27709, USA d Institute of Geography and Spatial Management, Jagiellonian University, Gronostajowa 7, 30-387 Krakow, Poland
ARTICLE INFO ABSTRACT
Article history: Received 28 September 2007 Received in revised form 28 January 2008 Accepted 31 January 2008
Keywords: Functional connectivity Stepping stones Corridors Spatial pattern
An objective and reliable assessment of wildlife movement is important in theoretical and applied ecology. The identification and mapping of landscape elements that may enhance functional connectivity is usually a subjective process based on visual interpretations of species movement patterns. New methods based on mathematical morphology provide a generic, flexible, and automated approach for the definition of indicators based on the classification and mapping of spatial patterns of connectivity from observed or simulated movement and dispersal events. The approach is illustrated with data derived from simulated movement on a map produced from satellite imagery of a structurally complex, multi-habitat landscape. The analysis reveals critical areas that facilitate the movement of dispersers among habitat patches. Mathematical morphology can be applied to any movement map providing new insights into pattern-process linkages in multi-habitat landscapes.
Morphological image processing
1. Introduction
Central to our efforts to preserve and restore threatened populations in fragmented ecosystems is the understanding of how movement of organisms is affected by landscape change. Maintaining connectivity, defined as the degree to which the landscape facilitates or impedes movement among resource patches (Taylor et al., 1993), is generally regarded as an essential goal of environmental conservation (Forman and Godron, 1986; Crooks and Sanjayan, 2006). Quantifying connectivity has been problematic.
The connections in a landscape are typically quantified by its structural elements such as stepping stone patches or habitat corridors. The importance of these elements has been widely advocated in ecological theory, although empirical
• Corresponding author. Tel.: +390332 78 5002; fax: +390332 78 9803. E-mail address: [email protected] (P. Vogt).
© 2008 Elsevier Ltd. All rights reserved.
evidence that corridors improve movement across the landscape remains equivocal (Harris, 1984; Noss, 1987; Simberloff and Cox, 1987; Harrison, 1992; Hobbs, 1992; Simberloff et al., 1992; Lindenmayer and Nix, 1993; Beier and Noss, 1998). The effectiveness of potential wildlife corridors depends, for example, on the species, the quality of habitat within the corridor, the matrix that surrounds the corridor, and the width, length and redundancy of the corridor network, among other factors (Collinge, 1998; Haddad et al., 2003; Malanson, 2003; Baum et al., 2004; Bender and Fahrig, 2005). Further complicating the evaluation of structural connectors is the variety of ways in which terms such as corridor have been defined, ranging from linear landscape elements to any space that enhances the spread of biota between regions (Puth and Wilson, 2001; Hilty et al., 2006; Calabrese and Fagan, 2004).
1470-160X/$ - see front matter © 2008 Elsevier Ltd. All rights reserved. doi: 10.1016/j.ecolind.2oo8.01.011
ECOLOGICAL INDICATORS 9 (2009) 64-71 65
The assessment of functional connectivity (how species move through a landscape) would remove some of the ambiguity associated with relying solely on the physical arrangement of landscape elements (structural connectivity) to determine connectedness. Measures of functional connectivity recognize that connectivity is species-specific and explicitly consider the ability of a species to disperse between patches (Crooks and Sanjayan, 2006). Habitat patches need not be physically connected by contiguous habitat in order for organisms to move among them. A species may be capable of crossing habitat gaps, or the matrix separating patches, and thus functionally connect areas that are not structurally connected. The matrix between two patches may consist of complex ensembles of multiple land uses, some more amenable to organism movement than others. Preferred movement pathways through matrix elements are thus functional (but not necessarily structural) corridors.
In practice, the identification of functional connectors (Le., pathways for dispersal and immigration) remains an open issue due to at least two challenges: (1) the absence of observational data required to make species-specific assessments of movement potential and (2) the lack of quantitative and objective methods for analyzing the movement data in a spatial context (Lambeck, 1997; Vos et al., 2001, 2002; Lindenmayer et al., 2002). Mathematical models are available for establishing potential connectivity among patches (as defined by Calabrese and Fagan, 2004), but these methods generally provide a list of patches that are connected rather than a description of the preferred pathways used to successfully move between patches. However, it is precisely this spatially explicit mapping of functional corridors that is necessary from a management perspective in order to preserve, and, in some cases, restore connectivity.
The preferred approach for gathering data to map functional corridors is direct observation of movement, ideally in a designed experiment (e.g., Collinge, 1998; Haddad, 1999; Haddad et al., 2003; Baum et al., 2004). But direct observation of movement is impractical over broad extents or for a large number of species. Functional connectivity analysis through movement simulations (e.g., Gustafson and Gardner, 1996; Gardner and Gustafson, 2004; Hargrove et al., 2005) provides an alternative, objective evaluation of connectivity for many species in real or artificial landscapes.
Attempts to analyze movement data (whether from direct observation or simulation) include calculating the fraction of dispersers arriving at a "destination patch" from a "source patch" (e.g., Kramer-Schadt et al., 2004). The approach is equivalent to creating an adjacency matrix to define connectivity for graph analysis (e.g., Minor and Urban, 2007). Graph representations are highly useful for sensitivity analyses at the scale of network connectivity (e.g., Urban and Keitt, 2001); however, species-specific assessments of functional connectivity often require direct knowledge of inter-patch dispersal pathways. By simplifying the landscape into an adjacency matrix format, graphs do not retain the information necessary to identify the specific spatial pathways that facilitate movement within the matrix environment between patches. This information may be required for conservation management.
The objective of this paper is to demonstrate the use of mathematical morphology as a conceptual idea for identifying functional corridors and other interesting features of simulated or observed movement data. The method is robust and objective, allowing connecting elements to be identified by an unsupervised process (Vogt et al., 2007a) and can be applied to any kind of binary input map derived from, e.g., least cost surfaces (Singleton et al., 2002); dispersal or movement maps from individual-based simulation models, such as J-walk (Gardner and Gustafson, 2004) or PATH (Hargrove et aI., 2005); synthesized complex movement patterns using minimum convex hull or k-means clustering (Graves et al., 2007); or spatially explicit data of observed species movements (Revilla et al., 2004; Kramer-Schadt et al., 2004). We provide a short summary of the method; adapt the naming scheme of the resulting geometric classes to the functional nature of the input data; and suggest ideas for their interpretation, which may be beneficial for the analysis of movement data and landscape planning in general.
2. Methods
2.1. Maps of movement
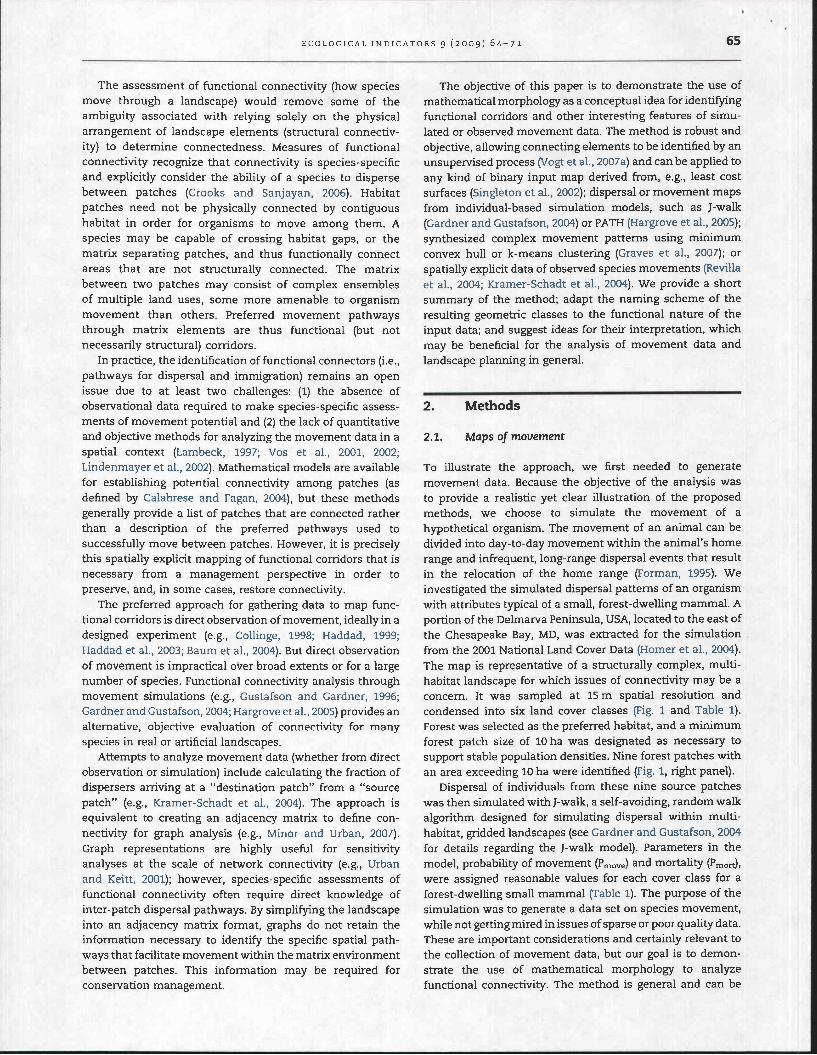
To illustrate the approach, we first needed to generate movement data. Because the objective of the analysis was to provide a realistic yet clear illustration of the proposed methods, we choose to simulate the movement of a hypothetical organism. The movement of an animal can be divided into day-to-day movement within the animal's home range and infrequent, long-range dispersal events that result in the relocation of the home range (Forman, 1995). We investigated the simulated dispersal patterns of an organism with attributes typical of a small, forest-dwelling mammal. A portion of the Delmarva Peninsula, USA, located to the east of the Chesapeake Bay, MD, was extracted for the simulation from the 2001 National Land Cover Data (Homer et al., 2004). The map is representative of a structurally complex, multihabitat landscape for which issues of connectivity may be a concern. It was sampled at 15 m spatial resolution and condensed into six land cover classes (Fig. 1 and Table 1). Forest was selected as the preferred habitat, and a minimum forest patch size of 10 ha was designated as necessary to support stable population densities. Nine forest patches with an area exceeding 10 ha were identified (Fig. 1, right panel).
Dispersal of individuals from these nine source patches was then simulated withJ-walk, a self-avoiding, random walk algorithm designed for simulating dispersal within multihabitat, gridded landscapes (see Gardner and Gustafson, 2004 for details regarding the J-walk model). Parameters in the model, probability of movement (Pmove) and mortality (Pmort),
were assigned reasonable values for each cover class for a forest-dwelling small mammal (Table 1). The purpose of the simulation was to generate a data set on species movement, while not getting mired in issues of sparse or poor quality data. These are important considerations and certainly relevant to the collection of movement data, but our goal is to demonstrate the use of mathematical morphology to analyze functional connectivity. The method is general and can be
66 ECOLOGICAL INDICATORS 9 (200g) 64-7 I
Land cover map
r.BG
• Forest • Suburban
D Agriculture • Urban
D Wetland • Water o
Movement map
N • Forest patch
D Successful dispersal 5km
Fig. 1 - (Left) Six land cover classes of the focal landscape. (Right) Grid cells visited during successful dispersal events (gray) between the nine forest patches (brown). The gray area represents the D-map. The gray area combined with the brown area represents the H-map.
applied equally to any movement data set for any species. Although the simulation output is broadly representative of movement patterns (Gardner and Gustafson, 2004), the results should not be viewed as representing a specific species.
Individual-based dispersal events were simulated with Jwalk by the release of an individual at the edge of one of the nine source forest patches. Movement was allowed until the animal either died or reached a different forest patch. For each of the nine patches, 10,000 dispersers were simulated, and summaries (including spatially explicit movement tracks) were recorded for all successful dispersers to the eight other patches.
At present, our morphological analysis can only be applied to a binary input map. To accommodate this requirement we focus only on the successful movement. We converted the Jwalk generated movement frequency map into a binary map by assigning a value of one to any pixel with at least one visitation by a successful disperser and assigning a value of zero to all other pixels. To investigate the impact of the habitat on the dispersal we selected two binary maps. In the first binary movement map, we constrain the analysis only to the
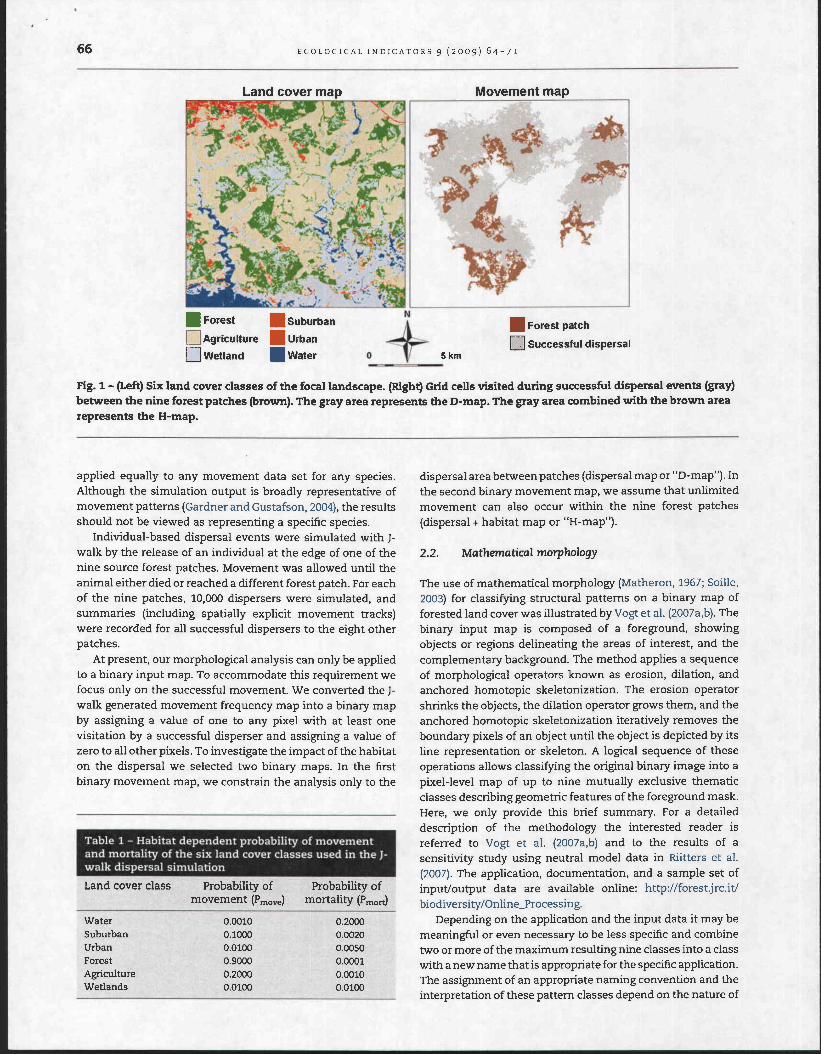
Table 1 - Habitat dependent probability of movement and mortality of the six land cover classes used in the Jwalk dispersal simulation
Land cover class Probability of Probability of movement (Pmove) mortality (PmorJ
Water 0.0010 0.2000 Suburban 0.1000 0.0020 Urban 0.0100 0.0050 Forest 0.9000 0.0001 Agriculture 0.2000 0.0010 Wetlands 0.0100 0.0100
dispersal area between patches (dispersal map or OlD-map"). In the second binary movement map, we assume that unlimited movement can also occur within the nine forest patches (dispersal + habitat map or "H-map").
2.2. Mathematical morphology
The use of mathematical morphology (Matheron, 1967; Soille, 2003) for classifying structural patterns on a binary map of forested land cover was illustrated by vogt et al. (2007a,b). The binary input map is composed of a foreground, showing objects or regions delineating the areas of interest, and the complementary background. The method applies a sequence of morphological operators known as erosion, dilation, and anchored homotopic skeletonization. The erosion operator shrinks the objects, the dilation operator grows them, and the anchored homotopic skeletonization iteratively removes the boundary pixels of an object until the object is depicted by its line representation or skeleton. A logical sequence of these operations allows classifying the original binary image into a pixel-level map of up to nine mutually exclusive thematic classes describing geometric features of the foreground mask. Here, we only provide this brief summary. For a detailed description of the methodology the interested reader is referred to Vogt et al. (2007a,b) and to the results of a sensitivity study using neutral model data in Riitters et al. (2007). The application, documentation, and a sample set of input/output data are available online: http://forest.jrc.it/ biodiversity/Online_Processing.
Depending on the application and the input data it may be meaningful or even necessary to be less specific and combine two or more of the maximum resulting nine classes into a class with a new name that is appropriate for the specific application. The assignment of an appropriate naming convention and the interpretation of these pattern classes depend on the nature of

ECOLOGICAL INDICATORS 9 (2009) 64-71 67
• Core o Perforation N
• Edge • Loop
• Branch • Bridge • Forest patch o 6km ------ --Fig. 2 - Thematic classes of the simulated movement data. (Left) Analysis of the D-map which recorded successful dispersal. (Right) Analysis of the H-map which added movement in the forest patches to the record of successful dispersal. Region 1 highlights a functional bridge between two core dispersal areas. Region 2 highlights a loop within the same core dispersal area (see white line). Regions 3 and 4 show differences in classification that result from the different input maps. White background represents portion of landscape not visited by any of the successful dispersers.
the input maps being considered. For example, for a binary input map using rivers and lakes as the foreground, the class core could be named "lake" and the area enclosed by the class perforation would be "island." Alternatively, the foreground could be a map of simulated movement data, or measured telemetry data, dispersal data, or the like. For the present application, we illustrate the generic applicability of the proposed pattern analysis vicariously on the map of successful movement between forest habitats. The nature of this input differs considerably from previous analyses of structural landscape patterns, which used binary forest cover maps as inputs (Vogt et al., 2007a,b). In this context, the class entitled patch in Vogt et al. (2007a) is not applicable here because it would correspond to an isolated small area of movement without connection to a forest habitat which, according to our definition, is not successful movement and therefore inexistent. From the remaining eight classes, we combine all branch classes into one class "branch," and amend the class naming definition to reflect the nature of movement input maps, resulting in output maps with the following six thematic classes of functional connectivity:
1. Core: area of broad movement; 2. Edge: movement in outer boundary of core area; 3. Perforation: movement in inner boundary adjacent to holes
in core area; 4. Loop: movement outside a core area that returns to the
same core area; 5. Bridge: movement outside a core area that connects to a
different core area; 6. Branch: movement outside a core, loop, or bridge area that
terminates.
In our morphological analysis, the thickness of the class edge corresponds to the size of the "structuring element" (see Vogt et al., 2007b), a pre-defined set of connected pixels similar to the kernel in image convolution. For visual clarity of the resulting classes in this study, we choose the size 5 which is equivalent to an edge thickness of five pixels or 75 m. Such an edge thickness may be considered typical for a wide range of species, but that is not critical for the purpose of this paper.
3. Results
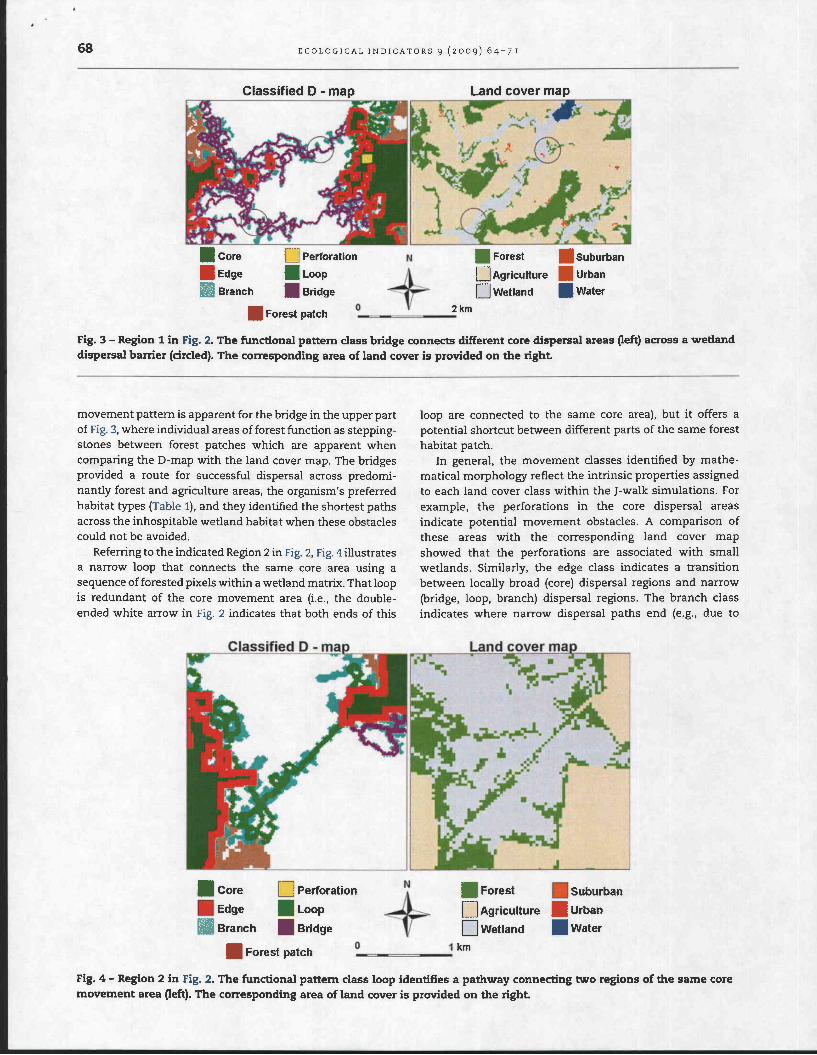
Successful movements were recorded from each patch to at least one other patch in the landscape; therefore all nine habitat patches were connected as part of one large cluster. Fig. 2 provides the output of the morphological analysis for the two input maps. Considering first the D-map of dispersal movement (Fig. 2, left), the majority of the grid cells are coded as core areas, which are connected by bridges and loops. Here, core represents broad pathways for potential dispersal among patches. The indicated Region 1 (Fig. 2) shows two bridge pathways between different core areas. These bridges are displayed with the corresponding land cover in Fig. 3. The two core areas are separated by a wetland which is a barrier to dispersal for the simulated organism (Table 1; see circles in Fig. 3).
For the bridge in the lower half of Fig. 3, and moving from the right to the left side of the map, the movement pathway follows the forested habitat until it reaches the less desirable wetland land-cover type. Movement through this less desirable habitat was only successful at locations that minimized the distance traveled across the wetland (circled). A similar
68 ECOLOGICAL INDICATORS 9 (2009) 64-7 1
Classified D - map Land cover map
o Perforation N • Forest • Suburban
• Loop o Agriculture • Urban
• Bridge o Wetland • Water o 2km • Forest patch - =--== =---
Fig. 3 - Region 1 in Fig. 2. The functional pattern class bridge connects different core dispersal areas (left) across a wetland dispersal barrier (circled). The corresponding area of land cover is provided on the right.
movement pattern is apparent for the bridge in the upper part of Fig. 3, where individual areas of forest function as steppingstones between forest patches which are apparent when comparing the D-map with the land cover map. The bridges provided a route for successful dispersal across predominantly forest and agriculture areas, the organism's preferred habitat types (Table 1), and they identified the shortest paths across the inhospitable wetland habitat when these obstacles could not be avoided.
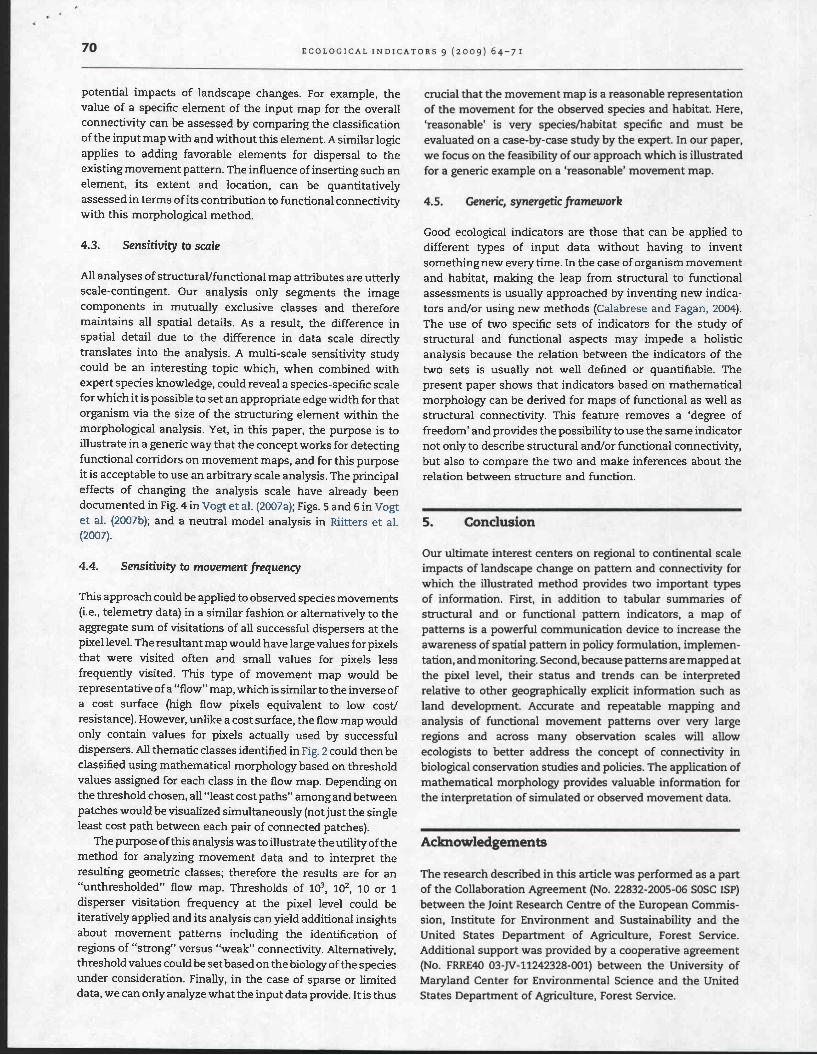
Referring to the indicated Region 2 in Fig. 2, Fig. 4 illustrates a narrow loop that connects the same core area using a sequence of forested pixels within a wetland matrix. That loop is redundant of the core movement area (i.e., the doubleended white arrow in Fig. 2 indicates that both ends of this
.... _ _ Cla~sjfied D -
II Core
II Edge
II Branch
o Perforation
II Loop
II Bridge
II Forest patch o
N
loop are connected to the same core area), but it offers a potential shortcut between different parts of the same forest habitat patch.
In general, the movement classes identified by mathematical morphology reflect the intrinsic properties assigned to each land cover class within the J-walk simulations. For example, the perforations in the core dispersal areas indicate potential movement obstacles. A comparison of these areas with the corresponding land cover map showed that the perforations are associated with small wetlands. Similarly, the edge class indicates a transition between locally broad (core) dispersal regions and narrow (bridge, loop, branch) dispersal regions. The branch class indicates where narrow dispersal paths end {e.g., due to
II Forest
D Agriculture
DWetiand
1 km
II Suburban
II Urban
II Water
Fig. 4 - Region 2 in Fig. 2. The functional pattern class loop identifies a pathway connecting two regions of the same core movement area (left). The corresponding area of land cover is provided on the right.

ECOLOGICAL INDICATORS 9 (2009) 64-7 1 69
unfavorable movement conditions) and the disperser retraces its steps.
The H-map extends the area of movement analysis by adding all forest patches (Fig. 2, right). The morphological analysis of the H-map reflects the changes in this extended input map. A comparison with the analyzed D-map illustrates the difference in classification derived from the two movement maps. For example, the indicated Region 3 in Fig. 2 contains a feature that is labeled as a branch in the D-map that becomes a bridge in the H-map. In another example, the indicated Region 4 in Fig. 2 contains features that are labeled as edge in the D-map, but become perforations in the H -map. The difference in classification is directly related to the different input maps, and the results illustrate the interpretation of spatial patterns of different types of movement such as dispersal events versus day-to-day movements.
4. Discussion
The conceptual basis of the morphological analysis is of a generic nature because it is a geometric analysis process. Consequently, any type of input data can be analyzed and the interpretation of the results is directly related to the interpretation of the input data. In this paper, the input data were derived from a dispersal simulator calibrated for a broad class of forest mammals. The application of the very same classification scheme would be equally valid for input data derived for specific species, regardless of scale, species, and even the thematic application. For example, the movement map shown in Fig. 1 could as well be the movement map of an avian species at continental scale or a group of ants at very local scale. The analysis of the input data would be identical and only the naming convention of the resulting classes and their interpretation would need to be adapted to the species under study.
4.1. Interpretation of the pattern classes
Our analysis provides classification of several feature classes of movement data. The feature class perforation is a boundary surrounding a barrier to movement. Edge represents the outer boundary of a core area, beyond which no visitations occurred. Beyond the edge the landscape may contain landscape elements favorable to movement in general (i.e., low cost), but do not contribute to the traversal of organisms among patches in a core area, or between core areas. For example, the white space between the large core regions in the D-map (Fig. 2) is primarily low resistance agriculture and forest. However the river and wetlands in the center of the landscape (Fig. 1, left) present a movement barrier. Thus a portion of the landscape surrounding these barriers may be used (e.g., for feeding or for mating purposes) but it is not part of movement pathways between patches.
Extending outward from core areas are branches, which represent regions of the matrix that are not specific pathways between any two patches but are visited by organisms during inter-patch movements. If portions of the landscape classified as branches are lost due to development or other land use change, the current inter-patch connectivity would not be
greatly affected. On the other hand, branches may be the result of corridor dissection, an event that could be detected by analyzing movement patterns at two different points in time, and noting the locations of corridors that become branches (i.e., the locations of 'broken' corridors). The classification maps would then provide the geographic locations where inter-patch connectivity can be increased with minimum effort by re-establishing physical connections or otherwise providing favorable habitat at these dissection points.
The feature class loop represents a shortcut connecting regions of a core area to itself. Shortcuts may be of consequence in analyses at the scale of the network of connected patches. For example, if the loop (Region 2, Fig. 2, left) were removed (i.e., due to urbanization) organisms would have to take a more circuitous route to span the same section of core (white line, Fig. 2, left). Such a change in network properties may be indicative of an increased graph diameter, which has implications with regards to the spread of disease or the ease of traversing a cluster of connected patches (e.g., Urban and Keitt, 2(01).
Visually, bridges and loops appear similar when looking at the classified movement data (Fig. 1), but morphological analysis differentiates their functional meaning (Figs. 3 and 4) with regard to the dispersal of the focal species. Patches embedded in a core area are connected by at least one pathway to at least one other patch within the same core area. In our analysis of the H-map, there are two core regions (Fig. 2). Connecting these regions are two bridges (Fig. 3). These bridges represent functional pathways whose maintenance is critical to sustain transfer of individuals between core areas. In essence, if these bridges were disrupted, the large cluster of nine connected patches would break into two smaller clusters of six and three connected patches. The fact that there are two bridges connecting the core areas indicates a level of redundancy in terms of how well the two cores are connected.
4.2. Implications on management policies
Morphological analysis of movement data has direct application to the decision making process faced by conservation managers. For example, if a limited amount of funding is available to purchase easements or to provide tax incentives for landowners to maintain open space, such funding could be targeted at those regions identified as being crucial for connectivity among populations. These sites could be identified through mathematical morphology as the region(s) in which the feature class bridge occurs. Managers could also target maintaining the feature class core in Fig. 2, which would maintain broad movement regions. These broad pathways are predominantly through agricultural fields that could be cultivated as a management prescription in a way that was most compatible with the dispersal dynamics of the focal organism (e.g., seasonal rotation of crops that offer lower movement resistance). Alternatively, the classes loop and bridge can be targeted for management prescriptions aimed at slowing or halting the spread of invasive species or disease vectors within or among core areas respectively.
The comparison ofthe two movement maps, D-map and Hmap, shows the sensitivity of the method to changes in the input data. This feature can be used to evaluate and measure
70 ECOLOGICAL INDICATORS 9 (2009) 64-7 I
potential impacts of landscape changes. For example, the value of a specific element of the input map for the overall connectivity can be assessed by comparing the classification of the input map with and without this element. A similar logic applies to adding favorable elements for dispersal to the existing movement pattern. The influence of inserting such an element, its extent and location, can be quantitatively assessed in terms of its contribution to functional connectivity with this morphological method.
4.3. Sensitivity to scale
All analyses of structuraVfunctional map attributes are utterly scale-contingent. Our analysis only segments the image components in mutually exclusive classes and therefore maintains all spatial details. As a result, the difference in spatial detail due to the difference in data scale directly translates into the analysis. A multi-scale sensitivity study could be an interesting topic which, when combined with expert species knowledge, could reveal a species-specific scale for which it is possible to set an appropriate edge width for that organism via the size of the structuring element within the morphological analysis. Yet, in this paper, the purpose is to illustrate in a generic way that the concept works for detecting functional corridors on movement maps, and for this purpose it is acceptable to use an arbitrary scale analysis. The principal effects of changing the analysis scale have already been documented in Fig. 4 in Vogt et a1. (2oo7a); Figs. 5 and 6 in Vogt et a1. (2oo7b); and a neutral model analysis in Riitters et a1. (2007).
4.4. Sensitivity to movement frequency
This approach could be applied to observed species movements (Le., telemetry data) in a similar fashion or alternatively to the aggregate sum of visitations of all successful dispersers at the pixel level. The resultant map would have large values for pixels that were visited often and small values for pixels less frequently visited. This type of movement map would be representative of a "flow" map, which is similar to the inverse of a cost surface (high flow pixels equivalent to low cost! resistance). However, unlike a cost surface, the flow map would only contain values for pixels actually used by successful dispersers. All thematic classes identified in Fig. 2 could then be classified using mathematical morphology based on threshold values assigned for each class in the flow map. Depending on the threshold chosen, all "least cost paths" among and between patches would be visualized simultaneously (not just the single least cost path between each pair of connected patches).
The purpose of this analysis was to illustrate the utility of the method for analyzing movement data and to interpret the resulting geometric classes; therefore the results are for an "unthresholded" flow map. Thresholds of 103 , lef, 10 or 1 disperser visitation frequency at the pixel level could be iteratively applied and its analysis can yield additional insights about movement patterns including the identification of regions of "strong" versus "weak" connectivity. Alternatively, threshold values could be set based on the biology of the species under consideration. Finally, in the case of sparse or limited data, we can only analyze what the input data provide. It is thus
crucial that the movement map is a reasonable representation of the movement for the observed species and habitat. Here, 'reasonable' is very species!habitat specific and must be evaluated on a case-by-case study by the expert. In our paper, we focus on the feasibility of our approach which is illustrated for a generic example on a 'reasonable' movement map.
4.5. Generic, synergetic framework
Good ecological indicators are those that can be applied to different types of input data without having to invent something new every time. In the case of organism movement and habitat, making the leap from structural to functional assessments is usually approached by inventing new indicators and/or using new methods (Calabrese and Fagan, 2004). The use of two specific sets of indicators for the study of structural and functional aspects may impede a holistic analysis because the relation between the indicators of the two sets is usually not well defined or quantifiable. The present paper shows that indicators based on mathematical morphology can be derived for maps of functional as well as structural connectivity. This feature removes a 'degree of freedom' and provides the possibility to use the same indicator not only to describe structural and/or functional connectivity, but also to compare the two and make inferences about the relation between structure and function.
5. Conclusion
Our ultimate interest centers on regional to continental scale impacts of landscape change on pattern and connectivity for which the illustrated method provides two important types of information. First, in addition to tabular summaries of structural and or functional pattern indicators, a map of patterns is a powerful communication device to increase the awareness of spatial pattern in policy formulation, implementation, and monitoring. Second, because patterns are mapped at the pixel level, their status and trends can be interpreted relative to other geographically explicit information such as land development. Accurate and repeatable mapping and analysis of functional movement patterns over very large regions and across many observation scales will allow ecologists to better address the concept of connectivity in biological conservation studies and policies. The application of mathematical morphology provides valuable information for the interpretation of simulated or observed movement data.
Acknowledgements
The research described in this article was performed as a part of the Collaboration Agreement (No. 22832-2005-06 SOSC ISP) between the Joint Research Centre of the European Commission, Institute for Environment and Sustainability and the United States Department of Agriculture, Forest Service. Additional support was provided by a cooperative agreement (No. FRRE40 03-]V -11242328-001) between the University of Maryland Center for Environmental Science and the United States Department of Agriculture, Forest Service.
ECOLOGICAL INDICATORS 9 (2009) 64-7 I 71
REFERENCES
Baum, K.A, Haynes, K.J., Dillemuth, F.P., Cronin, J.T., 2004. The matrix enhances the effectiveness of corridors and stepping stones. Ecology 85, 2671-2676.
Beier, P., Noss, R.F., 1998. Do habitat corridors provide connectivity? Conserv. BioI. 12, 1241-1252.
Bender, D.J., Fahrig, L., 2005. Matrix structure obscures the relationship between interpatch movement and patch size and isolation. Ecology 86, 1023-1033.
Calabrese, J.M., Fagan, W.F., 2004. A comparison-shopper's guide to connectivity metrics. Frontiers Ecol. Env. 2, 529-536.
Collinge, S.K., 1998. Spatial arrangement of habitat patches and corridors: clues from ecological field experiments. Landscape Urban Plann. 42, 157-168.
Crooks, K.R., Sanjayan, M., 2006. Connectivity Conservation. Cambridge University Press, New York.
Forman, R.T.T., Godron, M., 1986. Landscape Ecology. John Wiley and Sons, New York, NY.
Forman, R.T.T., 1995. Land Mosaics: The Ecology of Landscapes and Regions. Cambridge University Press, Cambridge, England.
Gardner, R.H., Gustafson, E.J., 2004. Simulating dispersal of reintroduced species within heterogeneous landscapes. Ecol. Modell. 171, 339-358.
Graves, T.A, Farley, S., Goldstein, M.I., Servheen, C., 2007. Identification of functional corridors with movement characteristics of brown bears on the Kenai Peninsula Alaska. Landscape Ecol. 22, 765-772. '
Gustafson, E.J., Gardner, R.H., 1996. The effect of landscape heterogeneity on the probability of patch colonization. Ecology 77, 94-107.
Haddad, N.M., 1999. Corridor and distance effects on interpatch movements: a landscape experiment with butterflies. Ecol. Appl. 9, 612-622.
Haddad, N.M., Bowne, D.R., Cunningham, A, Danielson, B.J., Levey, D.J., Sargent, S., Spira, T., 2003. Corridor use by diverse taxa. Ecology 84, 609-615.
Hargrove, W.W., Hoffman, F.M., Efroymson, R.A, 2005. A practical map-analysis tool for detecting potential dispersal corridors. Landscape Ecol. 20, 361-373.
Harris, L.D., 1984. The Fragmented Forest. The University of Chicago Press, Chicago, IL.
Harrison, R.L., 1992. Toward a theory of inter-refuge corridor design. Conserv. BioI. 6, 293-295.
Hilty, J.A, Lidicker, W.Z., Merenlender, AM., 2006. Corridor Ecology: The Science and Practice of Linking Landscapes for Biodiversity Conservation. Island Press, Washington, DC.
Hobbs, R.J., 1992. The role of corridors in conservation: solution or bandwagon? Trends Ecol. Evol. 7,389-392.
Homer, C., Huang, C., Yang, L., Wylie, B., Coan, M., 2004. Development of a 2001 national land-cover database for the United States. Photo gram metric Eng. Remote Sensing 70, 829-840.
Kramer-Schadt, S., Revilla, E., Wiegand, T., Breitenmoser, U., 2004. Fragmented landscapes, road mortality and patch connectivity: modelling influences on the dispersal of the Eurasian lynx. J. Appl. Ecol. 41,711-723.
Lambeck, R.J., 1997. Focal species: a mUlti-species umbrella for nature conservation. Conserv. BioI. 11, 849-856.
Lindenmayer, D.B., Nix, H.A, 1993. Ecological principles for the design of wildlife corridors. Conserv. BioI. 7, 627-631.
Lindenmayer, D.B., Manning, AD., Smith, P.L., Possingham, H.P., Fischer, J., Oliver, I., McCarthy, M.A, 2002. The focalspecies approach and landscape restoration: a critique. Conserv. BioI. 16, 338-345.
Malanson, G.P., 2003. Dispersal across continuous and binary representations of landscapes. Ecol. Modell. 169, 17-24.
Matheron, G., 1967. Elements Pour une Theorie des Milieux Poreux. Masson, Paris.
Minor, E.S., Urban, D.L., 2007. Graph theory as a proxy for spatially explicit population models in conservation planning. Ecol. Appl. 7, 1771-1782.
Noss, R.F., 1987. Corridors in real landscapes: a reply to Simberloff and Cox. Conserv. BioI. 1, 159-164.
Puth, L.M., Wilson, K.A, 2001. Boundaries and corridors as a continuum of ecological flow control: lessons from rivers and streams. Conserv. BioI. 15, 21-30.
Revilla, E., Wiegand, T., Palomares, F., Ferreras, P., Delibes, M., 2004. Effects of matrix heterogeneity on animal dispersal: from individual behavior to metapopulation-Ievel parameters. Am. Nat. 164, 130-153.
Riitters, K.H., Vogt, P., Soille, P., Kozak, J., Estreguil, C., 2007. Neutral model analysis of landscape patterns from mathematical morphology. Landscape Ecol. 22, 1033-1043.
Simberloff, D., Cox, J., 1987. Consequences and costs of conservation corridors. Conserv. BioI. 1,63-71.
Simberloff, D., Farr, J.A, Cox, J., Mehlman, D.W., 1992. Movement corridors: conservation bargains or poor investments? Conserv. BioI. 6, 493-504.
Singleton, P.H., Gaines, W.L., Lehmkuhl, J.F., 2002. Landscape permeability for large carnivores in Washington: a geographic information system weighted-distance and least-cost corridor assessment. Research Paper 549. United States Department of Agriculture Forest Service, Pacific Northwest Research Station.
Soille, P., 2003. Morphological Image Analysis: Principles and Applications. Springer Verlag, Berlin.
Taylor, P.D., Fahrig, L., Henein, K., Merriam, G., 1993. Connectivity is a vital element of landscape structure. Oikos 68, 571-573.
Urban, D.L., Keitt, T.H., 2001. Landscape connectivity: a graphtheoretic perspective. Ecology 82, 1205-1218.
Vogt, P., Riitters, K.H., Iwanowski, M., Estreguil, C., Kozak, J., Soille, P., 2oo7a. Mapping landscape corridors. Ecol. Indicators 7, 481-488.
Vogt, P., Riitters, K.H., Estreguil, C., Kozak, J., Wade, T.G., Wickham, J.D., 2007b. Mapping spatial patterns with morphological image processing. Landscape Ecol. 22, 171-177.
Vos, C.C., Verboom, J., Opdam, P.F.M., Ter Braak, C.J.F., 2001. Toward ecologically scaled landscape indices. Am. Nat. 183, 24-41.
Vos, C.C., Baveco, H., Grashof-Bokdam, C.J., 2002. Corridors and species dispersaL In: Gutzwiller, K.J. (Ed.), Applying Landscape Ecology in Biological Conservation. Springer Verlag, New York, NY, pp. 84-104.