mapping and characterization of salt-affected and ... · and specialized in the soil survey,...
TRANSCRIPT
Page 1 of 17
GEOINFORMATICS | RESEARCH ARTICLE
Mapping and characterization of salt-affected and waterlogged soils in the Gangetic plain of central Haryana (India) for reclamation and managementA.K. Mandal
Cogent Geoscience (2016), 2: 1213689
Mandal, Cogent Geoscience (2016), 2: 1213689http://dx.doi.org/10.1080/23312041.2016.1213689
GEOINFORMATICS | RESEARCH ARTICLE
Mapping and characterization of salt-affected and waterlogged soils in the Gangetic plain of central Haryana (India) for reclamation and managementA.K. Mandal1*
Abstract: IRS LISS III Resource SAT data (2005–07) were integrated with ground truth and soil studies for delineation and characterization of salt-affected and wa-terlogged soils in the Indo-Gangetic plain of central Haryana. The quality appraisal for salty ground water was also conducted prior to its use for irrigation. Such studies are useful for planning reclamation and management of salt-affected soils and poor quality ground water. Strongly sodic soils were easily identified based on the white to yellowish white tones, high spectral and low NDVI values. Waterlogged areas (surface ponding) were detected based on higher absorption in infrared range. Sodic soils with poor quality ground water showed higher reflectance from dry salts during June and freshly precipitated moist salts in March and October. Sodic soils irrigated with normal ground water showed higher cropping density and higher NDVI values. Moderately and slightly sodic soils showed mixed spectral signatures for salt crusts, moderate cropping density and surface wetness. Soil profile studies indicated higher moisture content at sub-surface depths. The presence of iron and manganese mottles indicated the incidences of water stagnation. Soils with high pHs, ESP, and SAR values and show-ing the dominance of carbonate and bicarbonates of sodium in the saturation extract indicated sodic nature. Significant presence of CaCO3 concretions at 1 m depth, low organic carbon contents, clay illuviation at sub-surface depth are typical features in sodic soil profiles. Water samples with high pH and SAR values and at places high RSC (Residual Sodium Carbonate) content indicated their sodic nature. Gypsum application is recommended for the reclamation of sodic soils and sodic water.
*Corresponding author: A.K. Mandal, Department of Soil and Crop Management, Central Soil Salinity Research Institute, Karnal 132001, Haryana, India E-mail: [email protected]
Reviewing editor:Paolo Paron, UNESCO-IHE Institute for Water Education, Netherlands
Additional information is available at the end of the article
ABOUT THE AUTHORA.K. Mandal has been working in the central Soil Salinity research Institute Karnal India 132001 for the last 25 years as Scientist and currently working in the position of Principal Scientist (Soil Science—Pedology) in the Soil and Crop Management Division of the institute. He has been engaged in the resource inventory of salt-affected soils using remote sensing and geo-informatics and specialized in the soil survey, characterization and mapping for soil salinity classification, land reclamation, soil and water management, and land use planning.
PUBLIC INTEREST STATEMENTThe submitted paper highlighted the potential of remote sensing data for natural resource inventory for salt-affected soils and poor quality ground water in the arid and semiarid regions and also used geo-informatics for decision-making and planning in the land reclamation, soil and water management and sustainable land use planning in the Gangetic plain of India.
Received: 23 March 2016Accepted: 13 July 2016First Published: 25 July 2016
© 2016 The Author(s). This open access article is distributed under a Creative Commons Attribution (CC-BY) 4.0 license.
Page 2 of 17
A.K. Mandal
Page 3 of 17
Mandal, Cogent Geoscience (2016), 2: 1213689http://dx.doi.org/10.1080/23312041.2016.1213689
Subjects: Earth Sciences; Environment & Agriculture; Environmental Studies & Management
Keywords: sodic soil; poor quality water; remote sensing; reclamation; management; gypsum
1. Introduction
1.1. Global and national distributionSalt-affected soils are commonly distributed in arid and semiarid climatic zones and covered 1,307 M ha at global scale (FAO/IIASA/ISRIC/ISS-CAS/JRC, 2008). The largest areas of salt-affected soils are in Australia followed by North and Central Asia, South America and South and West Asia. An estimated area of 6.73 M ha salt-affected soils are in India, of which 2.5 M ha is in the Indo-Gangetic plain (Mandal, Obi Reddy, & Ravisankar, 2011; Mandal & Sharma, 2006; National Remote Sensing Agency, 2008; Saxena, Sharma, Verma, Pal, & Mandal, 2004). In central Haryana, four districts Karnal, Kurukshetra, Panipat and Sonepat, were worst affected, showing 52% of the geographical area (TGA) under salt-affected soils (Mandal & Sharma, 2005). Interpretation of Landsat images showed old levees, relict flood plain and poorly drained low-lying flats are common topographic zones with salt infestation along the Gangetic alluvial plain (Manchanda & Iyer, 1983). The introduc-tion of canal irrigation from Western Yamuna Canal (WYC) in Haryana during the 1950s accentuated upward movement of salt by rising water table (Singh, Bundela, Sethi, Lal, & Kamra, 2010). Due to the over use of irrigation water in poorly drained areas, waterlogging and secondary salinization ap-peared and caused losses in productivity for rice (42%), wheat (38%) and sugarcane (61%) crops (Samra, Singh, & Ramakrishna, 2006). Due to the use of salty ground water (60–70% of TGA) for ir-rigation, secondary salt enrichment in soil profiles occurred along the Ghaggar and Markanda river plains (Gupta, 2010; Manchanda, 1976; Phogat, Satyavan, & Sharma, 2011).
1.2. Modern tools and techniques for diagnosis and assessment of salt-affected soilsBecause of the large spectral coverage and discreet bands, remote sensing data have been used for mapping and monitoring salt-affected and waterlogged soils in a time and cost-effective manner (Dwivedi, 2006; Mandal & Sharma, 2013; Rao et al., 1998; Saxena, 2003; Shrestha, 2006). Mougenot, Pouget, and Epema (1993) easily identified barren, salt-affected soils by high reflectance in the visi-ble range, while studies conducted in thermal, infrared and microwaves ranges were used to charac-terize hygroscopic characteristics of salts and vegetation-covered soils, respectively. Howari (2003) and Howari, Goodell, and Miyamoto (2002) used spectro-radiometry as a remote sensing tool in vis-ible and near infrared bands to quantify spectral ranges for salt-affected soils with variable salt com-position. Khan, Rastoskuev, Sato, and Shiozawa (2005) used ratio indices, spectral properties and digital image classification for mapping hydro-saline land degradation in the Indus basin of Pakistan.
1.3. Traditional methods for ground estimation and characterization of degraded soilsStudies conducted by Metternicht and Zinck (1997) showed different approaches for mapping sodi-um and salt-affected soils, combining digital analysis with field observations and laboratory analy-sis. They concluded that the main causes of spectral confusions, masking different soil salinity-alkalinity degrees, were the type and abundance of salt-tolerant vegetation cover, topsoil texture and other field properties. Joshi and Sahai (1993), Sharma, Saxena, and Verma (2000) and Verma, Saxena, Barthwal, and Deshmukh (1994) used a similar approach combining remote sensing, ground truth and soil analysis data for mapping coastal salt-affected soils in Saurashtra (Gujarat State) and inland salt-affected soils of Uttar Pradesh State. Such methods are laborious and need concerted efforts for image analysis, collection of ground truth and laboratory analysis of soil and water to integrate for mapping, but produce results and classified outputs of salt-affected soils with higher accuracies. Classification of soils for salinity/alkalinity classes such as slight, moderate and strong, is useful for deciding precise soil reclamation and management options.
Page 4 of 17
Mandal, Cogent Geoscience (2016), 2: 1213689http://dx.doi.org/10.1080/23312041.2016.1213689
1.4. Justification and objectivesThe complexity of soil salinity, alkalinity and waterlogging problems in central Haryana and the Gangetic Plain of India were reported by several authors (Gupta, 2010; Mandal & Sharma, 2005; Raj kumar, Ghabru, Singh, Ahuja, & Sharma, 2010; Singh et al., 2010) and is a primary concern for recla-mation and management. The complex surface properties of salt-affected and waterlogged soils varied in seasonal imageries causing low mapping accuracies (Sharma, Saxena, Verma, & Mandal, 2008; Verma, Saxena, & Bhargava, 2007). Field validation is therefore necessary for spatial charac-terization of salinized areas followed by the chemical characterization of soil samples to assess de-grees of limitations required for reclamation and management. Keeping in view the use of poor quality ground water for irrigation and its impact on soil degradation (salt enrichment) and reduced crop production (Gupta, 2010), chemical characterization of ground water is also necessary before its use in irrigation. To address these issues, the present study is aimed at the delineation and char-acterization of degraded (salt-affected and waterlogged) soils, and appraisal of ground water qual-ity in central Haryana useful for planning reclamation and management.
2. Methodology
2.1. Study areaThe study area (29°52′58.32″N to 30°15′34.42″N latitude and 76°25′31.31″ to 77°21′19.19″E longi-tude) covered administrative boundary of Kurukshetra district of central Haryana (1,530 km2) and lies 253 m above mean sea level. The average annual rainfall is 608 mm, mean winter temperature is 12.7°C and mean summer temperature is 38.5°C. The landform is alluvial under the Gangetic al-luvium. The area is drained by the Yamuna, Ghaggar and its tributaries Markanda, Saraswati, Chautang, Tangri and other seasonal streams Sahibi, Dohan and Krishnawati that originate from the Aravalli Hills. The primary source of irrigation is the WYC and Bhakra canal. In the absence of canal irrigation supply ground water from tube wells is commonly used for irrigation. Prolonged irrigation altered the moisture regime and chemical characteristics of soils leading to salt infestations, water-logging and low productivity (Singh, 2009).
2.2. Data, software, tools, and equipment used
(1) IRS 1C LISS III (Resource SAT) data (www.nrsc.gov.in) for March 2005 (pre-monsoon), June 2006 (summer) and October 2007 (post-monsoon) seasons. The specifications are shown in Table 1.
(2) Survey of India topographical maps at 1:50,000 scale (www.surveyofindia.gov.in) showing ad-ministrative boundaries, infrastructure (roads/railways), irrigation/drainage (canal/river) and settlements (state/district HQ, villages).
(3) Software: ILWIS (ver. 3.3), MS Office-Excel (2007), ERDAS IMAGINE, ARC GIS.
(4) Legacy data: Salt-affected soil maps at 1:250,000 scale (National Remote Sensing Agency, 1997), water quality and soil mineralogy data (Gupta, 2010; Kapoor et al., 1981; Manchanda, 1976; Verma et al., 2012) and Soil map of Haryana (Sachdev, Lal, Rana, & Sehgal, 1995).
(5) Soil sampling tools: color chart, auger, spade, knife etc.
(6) GPS (Lawrence global) for collecting location-data for soil profiles and soil sampling sites, water samples and tube wells.
Table 1. Particulars of satellite imageries in Kurukshetra district, Central Haryana, IndiaSensor Spectral resolution Spatial resolution Image no. and scale PeriodIRS-IB LISS III B1 0.52–0.59 nm (Green) 23.5 m 53 C/01, 05, 09, 13 FCC
B2 0.62–0.68 nm (Red) Swath 140 km 53 B/04, 08, 12, 16 March 2005
B3 0.77–0.86 nm (NIR) No. of pixel/ha 43 F/4, 53 G/1 June 2006
B4 1.55–1.70 nm (SWIR) 18.11 Scale 1: 50,000 scale October 2007
Page 5 of 17
Mandal, Cogent Geoscience (2016), 2: 1213689http://dx.doi.org/10.1080/23312041.2016.1213689
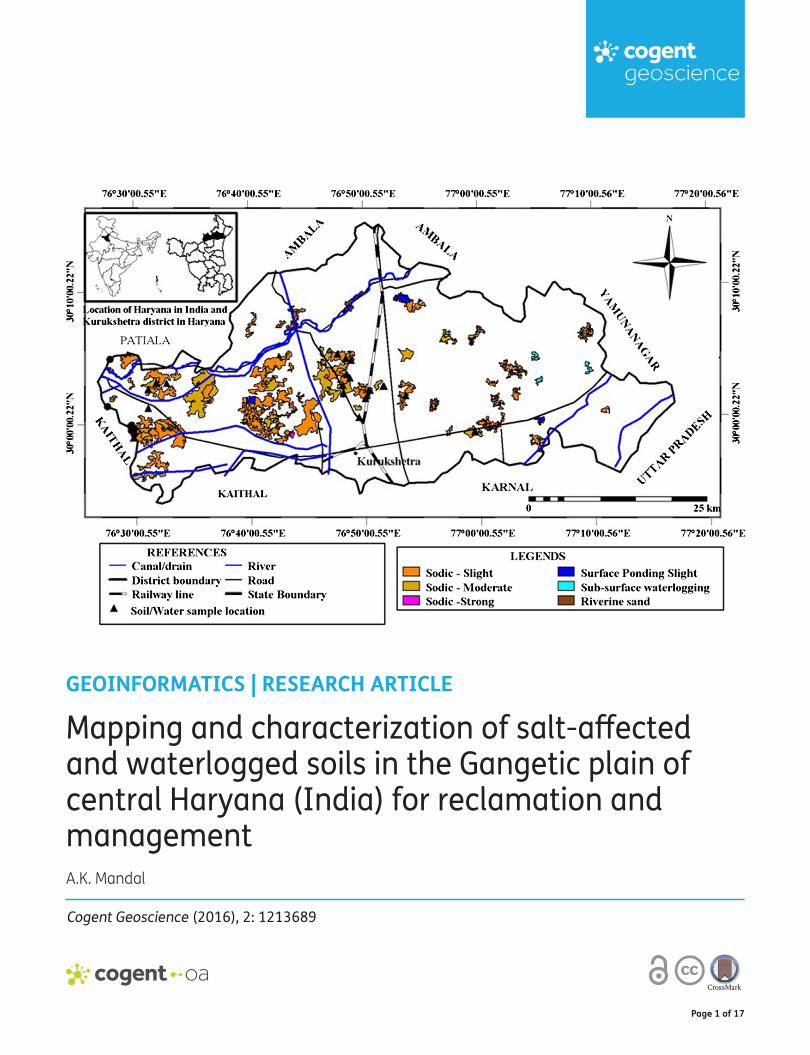
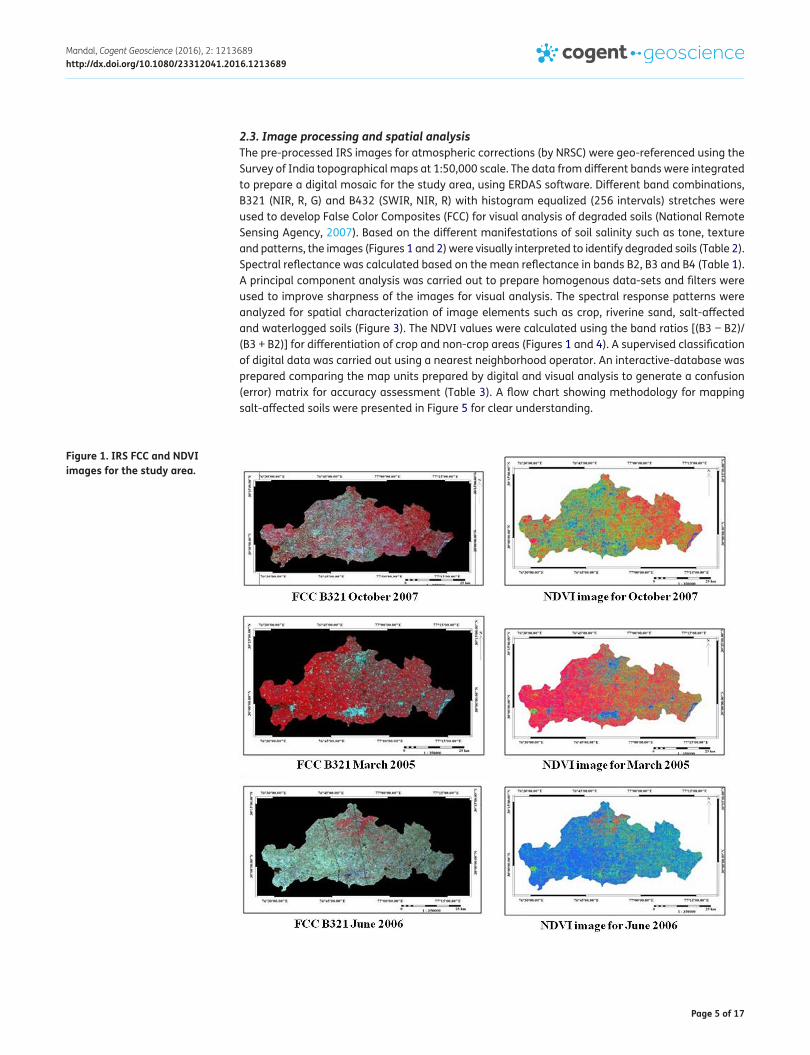
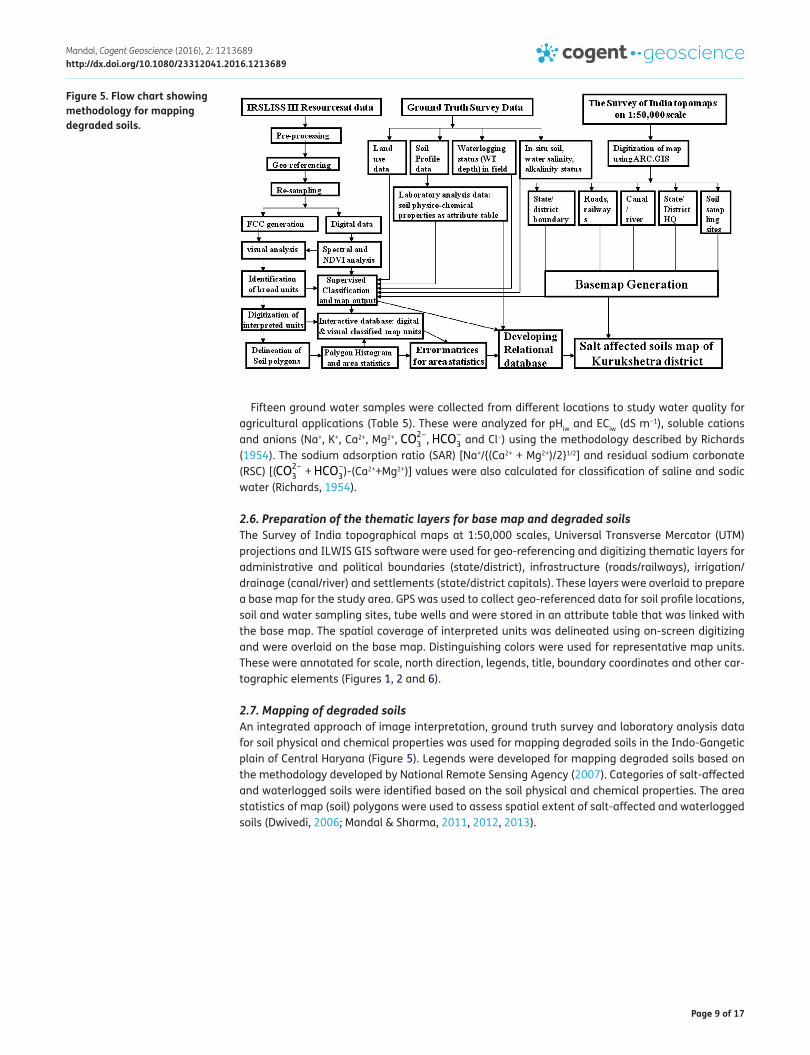
2.3. Image processing and spatial analysisThe pre-processed IRS images for atmospheric corrections (by NRSC) were geo-referenced using the Survey of India topographical maps at 1:50,000 scale. The data from different bands were integrated to prepare a digital mosaic for the study area, using ERDAS software. Different band combinations, B321 (NIR, R, G) and B432 (SWIR, NIR, R) with histogram equalized (256 intervals) stretches were used to develop False Color Composites (FCC) for visual analysis of degraded soils (National Remote Sensing Agency, 2007). Based on the different manifestations of soil salinity such as tone, texture and patterns, the images (Figures 1 and 2) were visually interpreted to identify degraded soils (Table 2). Spectral reflectance was calculated based on the mean reflectance in bands B2, B3 and B4 (Table 1). A principal component analysis was carried out to prepare homogenous data-sets and filters were used to improve sharpness of the images for visual analysis. The spectral response patterns were analyzed for spatial characterization of image elements such as crop, riverine sand, salt-affected and waterlogged soils (Figure 3). The NDVI values were calculated using the band ratios [(B3 − B2)/(B3 + B2)] for differentiation of crop and non-crop areas (Figures 1 and 4). A supervised classification of digital data was carried out using a nearest neighborhood operator. An interactive-database was prepared comparing the map units prepared by digital and visual analysis to generate a confusion (error) matrix for accuracy assessment (Table 3). A flow chart showing methodology for mapping salt-affected soils were presented in Figure 5 for clear understanding.
Figure 1. IRS FCC and NDVI images for the study area.

Page 6 of 17
Mandal, Cogent Geoscience (2016), 2: 1213689http://dx.doi.org/10.1080/23312041.2016.1213689
2.4. Ground truth studies for soil profile and water qualityA ground truth survey was conducted during March (pre-monsoon) and October (post-monsoon) 2005–07 seasons to authenticate interpreted units in the field and locate salt-affected and water-logged areas. The areas showing salinity emergence in different topographic zones and land uses such as crop and non-crop areas were studied and the data on status, condition and types of vegeta-tion tolerant, partially tolerant and non-tolerant crops were also recorded. The salinity status at surface and sub-surface depths were obtained from soil profile studies. The field salinity/alkalinity status of soil samples was measured by portable pH and EC meters. The ground truth observations sites, soil profiles/soil and water sampling sites and topographical data on slope, aspects, contours, and related ground control points were collected during the ground truth study and were marked on the topographical maps. Water table depths data were also collected in waterlogged areas under canal irrigation to 1.5 m depth below the surface. Ground water samples were collected from tube wells for detailed chemical analysis. Ground water table depths were also recorded to relate with geology data.
Representative soil profiles (1.5 m depth) were studied to assess status and distribution of soil salin-ity and alkalinity at 24 sites covering the study area. Soil morphological properties such as soil mois-ture content, texture, color, structure and drainage were recorded from soil profile studies. Soil samples were collected at representative depths up to 1.2 m and properly stored in polythene and cloth bags to minimize moisture loss and changes in salt composition. These were further air-dried, processed to pass through <2 mm sieve and stored for physical and chemical properties (Table 4).
2.5. Studies for physical and chemical properties of soil and water samplesIn the laboratory, soil samples were analyzed for physical and chemical properties such as soil reac-tion (pHs) and electrical conductance (ECe, dS m−1); salt composition for soluble Na+, K+, Ca2+, Mg2+, CO
2−
3, HCO−
3 and Cl−, me L−1; CaCO3 (<2 mm size, %) and organic carbon (%); cation exchange capacity
(CEC, c mol (p+) kg−1) and Exchangeable Sodium percentage (ESP, %) and soil separates for sand, silt and clay percentages (Jackson, 1986). Based on soil pHs, electrical conductivity (ECe) and ESP values, soils are classified as saline, sodic and saline-sodic with degrees of soil salinity and sodicity classed as slight, moderate and strong (Richards, 1954). Waterlogged areas were classified as permanent waterlogged for surface ponding and sub-surface waterlogging as a result of high water table depth (<1.5 m) close to the surface (National Remote Sensing Agency, 2007).
Figure 2. FCC (B432) showing salt-affected soils and waterlogged areas.
Page 7 of 17
Mandal, Cogent Geoscience (2016), 2: 1213689http://dx.doi.org/10.1080/23312041.2016.1213689
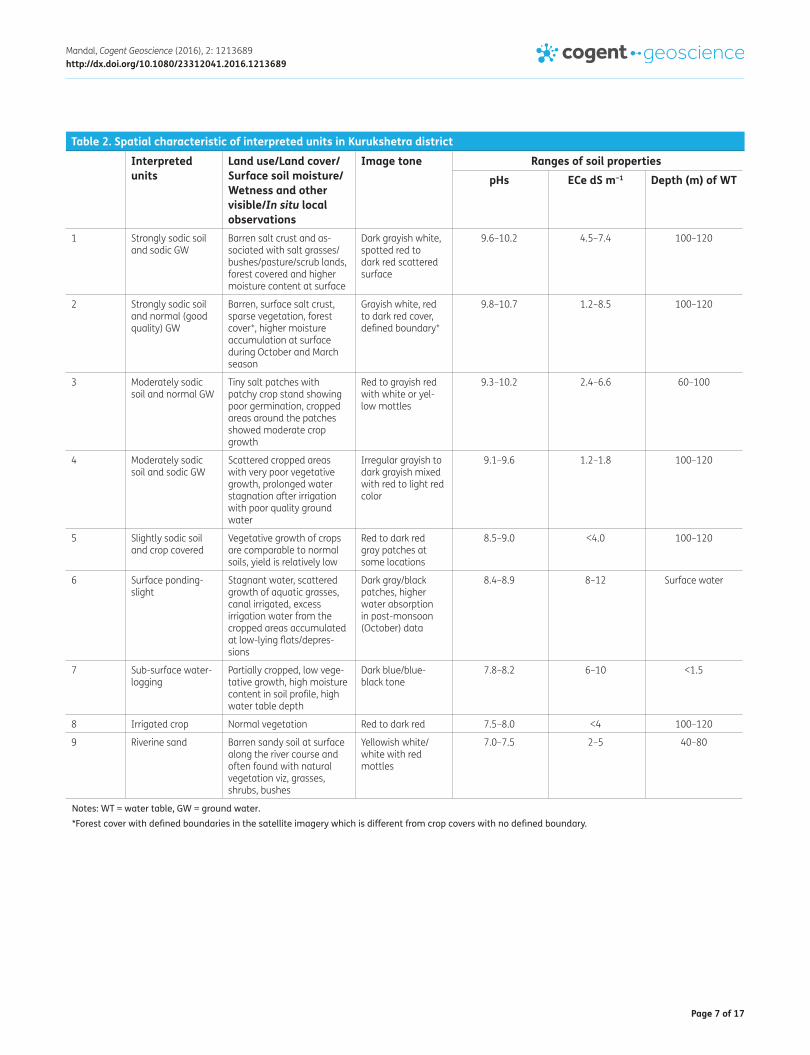
Table 2. Spatial characteristic of interpreted units in Kurukshetra district
Notes: WT = water table, GW = ground water.*Forest cover with defined boundaries in the satellite imagery which is different from crop covers with no defined boundary.
Interpreted units
Land use/Land cover/Surface soil moisture/Wetness and other visible/In situ local observations
Image tone Ranges of soil propertiespHs ECe dS m−1 Depth (m) of WT
1 Strongly sodic soil and sodic GW
Barren salt crust and as-sociated with salt grasses/bushes/pasture/scrub lands, forest covered and higher moisture content at surface
Dark grayish white, spotted red to dark red scattered surface
9.6–10.2 4.5–7.4 100–120
2 Strongly sodic soil and normal (good quality) GW
Barren, surface salt crust, sparse vegetation, forest cover*, higher moisture accumulation at surface during October and March season
Grayish white, red to dark red cover, defined boundary*
9.8–10.7 1.2–8.5 100–120
3 Moderately sodic soil and normal GW
Tiny salt patches with patchy crop stand showing poor germination, cropped areas around the patches showed moderate crop growth
Red to grayish red with white or yel-low mottles
9.3–10.2 2.4–6.6 60–100
4 Moderately sodic soil and sodic GW
Scattered cropped areas with very poor vegetative growth, prolonged water stagnation after irrigation with poor quality ground water
Irregular grayish to dark grayish mixed with red to light red color
9.1–9.6 1.2–1.8 100–120
5 Slightly sodic soil and crop covered
Vegetative growth of crops are comparable to normal soils, yield is relatively low
Red to dark red gray patches at some locations
8.5–9.0 <4.0 100–120
6 Surface ponding-slight
Stagnant water, scattered growth of aquatic grasses, canal irrigated, excess irrigation water from the cropped areas accumulated at low-lying flats/depres-sions
Dark gray/black patches, higher water absorption in post-monsoon (October) data
8.4–8.9 8–12 Surface water
7 Sub-surface water-logging
Partially cropped, low vege-tative growth, high moisture content in soil profile, high water table depth
Dark blue/blue-black tone
7.8–8.2 6–10 <1.5
8 Irrigated crop Normal vegetation Red to dark red 7.5–8.0 <4 100–120
9 Riverine sand Barren sandy soil at surface along the river course and often found with natural vegetation viz, grasses, shrubs, bushes
Yellowish white/white with red mottles
7.0–7.5 2–5 40–80
Page 8 of 17
Mandal, Cogent Geoscience (2016), 2: 1213689http://dx.doi.org/10.1080/23312041.2016.1213689
Figure 3. Spectral response patterns of degraded soils.
Figure 4. Seasonal NDVI values of study area
Table 3. Confusion matrix and accuracy estimates of classified image
Notes: A = canal, B = surface ponding-slight, C = surface ponding-moderate, D = sub-surface waterlogging, E = normal field crop, F = reserve forest, G = road, H = river, I = sodic-slight, J = sodic-slight under forest, K = sodic-moderate, L = sodic-moderate under forest, M = sodic-strong, N = riverine sand, O = urban settlements.
A B C D E F G H I J K L M N O AccuracyA 0 0 0 0 0 0 0 0 0 0 0 0 0 0 0 0
B 927 559 0 1,117 103 41 715 7 633 277 577 873 0 45 691 0.09
C 0 0 0 0 0 0 0 0 0 0 0 0 0 0 0 0
D 137 79 0 1,019 64 277 248 0 548 106 307 838 0 46 42 0.27
E 0 0 0 0 0 0 0 0 0 0 0 0 0 0 0 0
F 0 0 0 0 0 0 0 0 0 0 0 0 0 0 0 0
G 0 0 0 0 0 0 0 0 0 0 0 0 0 0 0 0
H 0 0 0 0 0 0 0 0 0 0 0 0 0 0 0 0
I 3,975 2,500 0 18,889 56,153 2,575 4,365 76 63,603 3,146 18,286 8,294 0 1,948 4,394 0.34
J 0 0 0 0 0 0 0 0 0 0 0 0 0 0 0 0
K 1,824 1,275 0 9,748 28,589 1,096 1,866 26 33147 1,648 11411 7,976 0 1,762 2,711 0.11
L 0 0 0 0 0 0 0 0 0 0 0 0 0 0 0 0
M 3 9 0 4 0 15 0 13 73 0 430 5 0 56 49 0
N 224 94 0 134 20 109 10 13 318 4 1,162 288 0 1,033 402 0.27
O 0 0 0 0 0 0 0 0 0 0 0 0 0 0 0 0
Reliability 0 0.12 0 0.03 0 0 0 0 0.65 0 0.35 0 0 0.21 0
Page 9 of 17
Mandal, Cogent Geoscience (2016), 2: 1213689http://dx.doi.org/10.1080/23312041.2016.1213689
Fifteen ground water samples were collected from different locations to study water quality for agricultural applications (Table 5). These were analyzed for pHiw and ECiw (dS m−1), soluble cations and anions (Na+, K+, Ca2+, Mg2+, CO2−
3, HCO−
3 and Cl−) using the methodology described by Richards
(1954). The sodium adsorption ratio (SAR) [Na+/{(Ca2+ + Mg2+)/2}1/2] and residual sodium carbonate (RSC) [(CO2−
3 + HCO−
3)-(Ca2++Mg2+)] values were also calculated for classification of saline and sodic
water (Richards, 1954).
2.6. Preparation of the thematic layers for base map and degraded soilsThe Survey of India topographical maps at 1:50,000 scales, Universal Transverse Mercator (UTM) projections and ILWIS GIS software were used for geo-referencing and digitizing thematic layers for administrative and political boundaries (state/district), infrastructure (roads/railways), irrigation/drainage (canal/river) and settlements (state/district capitals). These layers were overlaid to prepare a base map for the study area. GPS was used to collect geo-referenced data for soil profile locations, soil and water sampling sites, tube wells and were stored in an attribute table that was linked with the base map. The spatial coverage of interpreted units was delineated using on-screen digitizing and were overlaid on the base map. Distinguishing colors were used for representative map units. These were annotated for scale, north direction, legends, title, boundary coordinates and other car-tographic elements (Figures 1, 2 and 6).
2.7. Mapping of degraded soilsAn integrated approach of image interpretation, ground truth survey and laboratory analysis data for soil physical and chemical properties was used for mapping degraded soils in the Indo-Gangetic plain of Central Haryana (Figure 5). Legends were developed for mapping degraded soils based on the methodology developed by National Remote Sensing Agency (2007). Categories of salt-affected and waterlogged soils were identified based on the soil physical and chemical properties. The area statistics of map (soil) polygons were used to assess spatial extent of salt-affected and waterlogged soils (Dwivedi, 2006; Mandal & Sharma, 2011, 2012, 2013).
Figure 5. Flow chart showing methodology for mapping degraded soils.
Page 10 of 17
Mandal, Cogent Geoscience (2016), 2: 1213689http://dx.doi.org/10.1080/23312041.2016.1213689
Tabl
e 4.
Phy
sico
-che
mic
al c
hara
cter
istic
s of
soi
ls in
Kur
uksh
etra
dis
tric
t
Not
e: G
W =
gro
und
wat
er.
Horiz
onDe
pth
(cm
)pH
sEC
e (d
S m
−1)
Na+
(me
L−1)
K+ (m
e L−1
)Ca
2+ +
Mg2+
(m
e L−1
)CO
− 3 + HCO
− 3
(me
L−1)
Cl−
(me
L−1)
SAR
OC
(%)
CaCO
3 (%
)ES
P (%
)CE
C (c
mol
kg
−1)
Sand
(%
)Si
lt (%
)Cl
ay
(%)
Text
ure
P1 2
9°59
′54.
3″ N
76°
25′4
1.3″
E st
rong
ly so
dic
soils
(sod
ic h
aplu
step
t) an
d so
dic
GW, G
hagg
ar p
lain
, Kika
r, Pr
osop
is ju
liflor
a pl
anta
tion
A10–
149.
67.
498
.70.
94.
017
.031
.049
.30.
082.
4549
.613
.171
.214
.913
.7sl
AB14
–40
10.0
5.5
80.0
0.2
4.0
21.0
18.0
40.0
0.06
2.45
51.8
8.8
61.9
21.6
16.3
sl
B21t
40–8
210
.14.
670
.40.
13.
028
.515
.040
.60.
030.
9876
.911
.158
.820
.021
.0sc
l
B22t
82–1
0910
.25.
383
.90.
13.
027
.512
.048
.40.
021.
4754
.113
.958
.618
.622
.6sc
l
C10
9–13
99.
84.
575
.80.
13.
018
.511
.543
.80.
022.
8543
.29.
563
.220
.116
.7sl
P2 2
9°59
′02.
7″ N
76°
59′3
7.6″
E st
rong
ly so
dic
(sod
ic h
aplu
step
t), g
ood
qual
ity (n
orm
al) G
W, Y
amun
a pl
ain,
fore
stry
pla
ntat
ions
A10–
129.
81.
211
.50.
11.
015
.73.
511
.50.
171.
346
.821
.659
.023
.018
.0sl
B21t
12–2
810
.75.
354
.00.
11.
530
.212
.544
.10.
111.
056
.526
.353
.022
.025
.0sc
l
B22t
28–5
810
.66.
260
.60.
11.
027
.510
.560
.60.
172.
051
.822
.052
.024
.024
.0sc
l
B23t
58–9
910
.77.
667
.10.
11.
031
.512
.067
.10.
113.
350
.021
.252
.027
.021
.0sc
l
Ck99
–142
10.5
8.5
75.4
0.1
1.0
35.5
12.5
75.4
0.11
4.9
55.0
21.0
53.0
28.5
18.5
sl
P3 3
0°02
′33.
6″ N
76°
51′4
0.7″
E m
oder
atel
y so
dic
soil
(sod
ic h
aplu
step
t), c
ropp
ed (r
ice)
, goo
d qu
ality
(nor
mal
) GW
, Mar
kand
a pl
ain
Ap0–
159.
32.
428
.60.
23.
05.
025
.016
.50.
185.
350
.013
.251
.325
.123
.4sc
l
AB15
–39
9.7
2.6
33.0
0.1
2.0
4.0
20.0
23.3
0.08
1.7
94.6
15.5
43.9
31.1
24.8
l
Bw1
39–7
610
.14.
053
.90.
12.
010
.025
.038
.10.
081.
394
.215
.947
.326
.825
.8sc
l
Bw2
76–1
0510
.25.
996
.70.
22.
012
.530
.068
.30.
081.
783
.118
.448
.124
.727
.0sc
l
Bw3
105–
149
10.0
6.6
99.5
0.2
2.0
15.5
32.0
70.3
0.05
1.9
89.7
16.8
46.2
25.8
28.0
scl
P4 3
0°08
′56.
3″ N
76°
25′3
7.2″
E st
rong
ly so
dic
soil
(typi
c na
trus
talf)
, rec
laim
ed a
t sur
face
, par
tially
cro
pped
, sod
ic G
W, G
hagg
ar p
lain
Ap0–
189.
11.
213
.30.
11.
55.
05.
010
.80.
64.
453
.119
.247
.128
.124
.8sc
l
AB18
–41
9.6
1.4
15.7
0.1
1.0
6.0
4.0
15.7
0.2
8.1
66.7
16.8
48.5
24.8
26.7
scl
B21t
41–6
89.
71.
618
.50.
11.
07.
04.
518
.50.
15.
269
.020
.038
.023
.338
.8cl
B22t
68–1
059.
61.
719
.50.
12.
56.
03.
012
.30.
29.
558
.521
.235
.929
.734
.5cl
B23k
105–
156
9.8
1.8
22.0
0.1
4.5
10.0
8.5
10.3
0.1
14.5
65.8
22.0
36.8
35.5
27.7
l
Page 11 of 17
Mandal, Cogent Geoscience (2016), 2: 1213689http://dx.doi.org/10.1080/23312041.2016.1213689
3. Results and discussion
3.1. Results
3.1.1. Image interpretation and ground truth studies of degraded soilsThe spatial characteristics of salt-affected and waterlogged soil; natural vegetation and field crops were presented with soil chemical properties and ground water data (Table 2). The strongly sodic soils (white to yellowish white tone in B321, irregular shape), normal crops (bright red tone, continuous), waterlogged (surface ponding, dark blue to black tone, irregular shape) soils and riverine sands (yel-lowish white with definite shape along the river bed) were easily detected based on their strong sig-natures from the visible and infrared bands in IRS data (Figures 1 and 2). The seasonal data showed higher extents of moist salt-affected soils and waterlogged areas (irrigated) during March and October (Figure 1) and dry salts (salt crust) during June. This may possibly be due to similar reflectance of salt
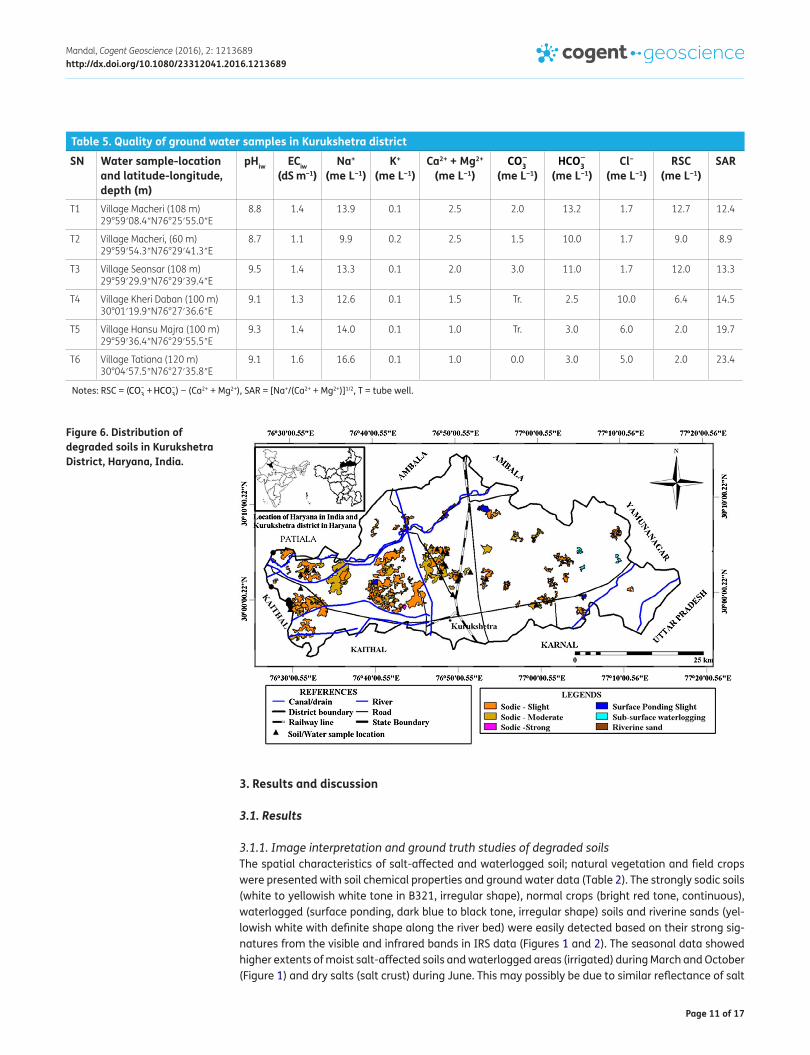
Table 5. Quality of ground water samples in Kurukshetra district
Notes: RSC = (CO−
3 + HCO−
3) − (Ca2+ + Mg2+), SAR = [Na+/(Ca2+ + Mg2+)]1/2, T = tube well.
SN Water sample-location and latitude-longitude, depth (m)
pHiw ECiw (dS m−1)
Na+ (me L−1)
K+ (me L−1)
Ca2+ + Mg2+ (me L−1)
CO−
3
(me L−1)HCO
−
3
(me L−1)Cl−
(me L−1)RSC
(me L−1)SAR
T1 Village Macheri (108 m) 29°59′08.4″N76°25′55.0″E
8.8 1.4 13.9 0.1 2.5 2.0 13.2 1.7 12.7 12.4
T2 Village Macheri, (60 m) 29°59′54.3″N76°29′41.3″E
8.7 1.1 9.9 0.2 2.5 1.5 10.0 1.7 9.0 8.9
T3 Village Seonsar (108 m) 29°59′29.9″N76°29′39.4″E
9.5 1.4 13.3 0.1 2.0 3.0 11.0 1.7 12.0 13.3
T4 Village Kheri Daban (100 m) 30°01′19.9″N76°27′36.6″E
9.1 1.3 12.6 0.1 1.5 Tr. 2.5 10.0 6.4 14.5
T5 Village Hansu Majra (100 m) 29°59′36.4″N76°29′55.5″E
9.3 1.4 14.0 0.1 1.0 Tr. 3.0 6.0 2.0 19.7
T6 Village Tatiana (120 m) 30°04′57.5″N76°27′35.8″E
9.1 1.6 16.6 0.1 1.0 0.0 3.0 5.0 2.0 23.4
Figure 6. Distribution of degraded soils in Kurukshetra District, Haryana, India.
Page 12 of 17
Mandal, Cogent Geoscience (2016), 2: 1213689http://dx.doi.org/10.1080/23312041.2016.1213689
and sand and the absence of vegetative cover during the dry season. The normal cropped areas were identified by the distinct (bright) red tones at different growth stages, while stressed vegetation was identified by lighter red tones, patchy occurrence and patchy white tones for salt crust in the saline and moist surface in waterlogged areas (Mandal & Sharma, 2010). Riverine sands were identified by the yellowish white tone and spotted natural vegetation along the river course (Figure 1).
Field studies indicated prominent salt crusts, scanty vegetation, scattered salt-tolerant natural vegetation, scrub and pastures in strongly sodic soils and in places, intercepted with forestry planta-tions for biological reclamation. Moderate and slightly sodic soils appeared as mixed red and gray tones in irrigated areas, the ground truth studies showing patchy salts, scattered crop cover, moist soil surface, low permeability and absence of natural drainage. In dry areas, strongly sodic soils ap-peared as white patches of barren salt crust underlain by sodic ground water. Moderately sodic soils appeared as tiny white patches and red to dark red tones for crops irrigated with good quality ground water (Mandal & Sharma, 2011). Partially reclaimed sodic soils showed moderate crop cover and intermittent salt patches in low lying flats and depressions (Mandal, 2012). Slightly sodic soils showed good to very good crop and vegetative covers (Howari, 2003), though the field study re-ported low productivity due to crop damages in the maturity stage.
In irrigated areas, permanent waterlogged soils (surface ponding) were in the low-lying flats/de-pressions and appeared as gray to dark gray tones in all seasons (Figure 2). Mixed red and reddish gray tones were identified in the irrigated areas supporting vegetation. Field studies indicated high water table depth (sub-surface waterlogging, WT < 1.5 m depth), crop cover and secondary soil sa-linization during the post-monsoon season (Mandal & Sharma, 2001, 2010). However, using moder-ate spatial and spectral resolution of IRS data, the segregation of mixed signatures of water and crop in sub-surface waterlogged areas was difficult (Singh et al., 2010). It was authenticated on the strength of ground truth.
3.1.2. Digital analysis of remote sensing data for spectral properties of degraded soilsSpectral analysis of IRS data identified prominent energy absorption for waterlogged areas (surface ponding, SP_S) during October (B3 > B4 > B2) and March (B3 > B4 > B2) (Mandal & Sharma, 2001). The NDVI values were low (0.1–0.3) as a result of low crop cover (Mandal & Sharma, 2011). In irrigated areas, spectral values ranging from 60 to 148 in B3 and 58 to 66 in B4 indicated high water table depth or sub-surface waterlogging SSW (Mandal & Sharma, 2011). The NDVI values (0.24–0.34) indi-cated the presence of stressed vegetation (Dwivedi & Sreenivas, 2002; Joshi, Toth, & Sari, 2002).
Strongly sodic soils (SS_SGW) with poor quality ground water showed higher reflectance (80–110) of dry salts during June (B2 > B3 > B4) and the reflectance (40–90) of freshly precipitated moist salt surfaces during March (B3 > B4 > B2) and October (B4 > B2 > B3). NDVI values (0.28–0.37) indicated scattered and poor vegetative cover due to high soil sodicity (Figure 3 and 4). Strongly sodic soils with normal ground water showed high reflectance of B3 from salty (carbonate type) surface during October (B3 > B4 > B2), March (B3 > B4 > B2) and June (B3 > B2 > B4) respectively. These areas showed low NDVI values (0.18–0.29) due to poor to very poor crop cover (Figures 3 and 4). Moderately sodic soils irrigated with normal (MS_NGW) and poor quality ground water (MS_SGW) showed similar trends of spectral reflectance (B3 > B4 > B2) during October and March (Mandal & Sharma, 2001). NDVI values (Figure 4) were low (0.18–0.52) for cropped areas irrigated with poor quality ground water and higher (0.48–0.52) in normal ground water zone. Slightly sodic soils also showed higher reflectance of B3 followed by B4 and B2 (Figure 3). Similar data were also reported by Coleman, Agbu, Montgomery, and Prasad (1991).
Matured winter crops showed higher reflectance of B3 during March (B3 > B4 > B2) while crops in moist soil surface showed higher values of B4 during October. NDVI values showed similar trends during March and October, respectively. The spectral reflectance of riverine sand was high (60–100) due to bare surface (Figure 3) and low NDVI values (−0.04 to 0.04) which indicated scanty vegetative cover (Figure 4).
Page 13 of 17
Mandal, Cogent Geoscience (2016), 2: 1213689http://dx.doi.org/10.1080/23312041.2016.1213689
Principal component analysis was performed to homogenize digital data and achieve higher ac-curacy in classification. The principal component coefficients (PC) showed significant relationship between B1 and PC1 (0.524); B2 and PC4 (0.831); B3 and PC1 (0.707); and PC2 (0.683); B4 and PC3 (0.670). PC1 showed 93.5% variance while PC2, 3 and 4 showed 5.91, 0.30 and 0.09% variance, re-spectively. An average (AVG 3 × 3) filter was used to enhance sharpness of the images for visual analysis and to reduce noises prior to multi-band image classification. The nearest neighboring nine pixels were calculated to assign the values for central pixel to reduce noises and enhanced interpre-tation of the images.
Digital classification was performed using a supervised classification based on maximum likeli-hood classifier. Ground truth, laboratory analysis and land use data (field crop, forestry, urban set-tlement, road, natural water for pond, river and canal) were included as training sets for digital classification. Legacy data such as digitized maps of salt-affected soils, water table depth and qual-ity and other collateral data including topographical maps of the Survey of India were also used as supporting data (Saxena, 2003; Verma, Singh, Sreenivas, Dwivedi, & Mathur, 2004). The salt-affected soils map at 1:250,000 scale was also consulted as supporting data. Clusters of pixels showing aver-age reflectance for B1–B4 in March data were assigned a class name and the sample statistics (fea-ture space) of the training set was generated to provide a visual overview of the separation of classes for the training pixels using a scatter plot for two bands. The feature spaces for B1 and B2, B1 and B4, and B2 and B4 indicated positive relation while B1 and B3, B2 and B3, and B3 and B4 showed partial or null relationships. An interactive (cross) database was prepared using maps prepared from visual analysis and digital classification. A confusion (error) matrix was prepared to assess the ac-curacy of digital classification (Table 3). The data showed an overall accuracy of 25.4%, average accuracy of 18.0% and reliability 10.5%, respectively. The highest accuracy was shown for slightly sodic soil (34%, reliability 65%) followed by sub-surface waterlogging (27%, reliability 3%), riverine sand (27%, reliability 21%) and moderately sodic soil (11%, reliability 35%), respectively.
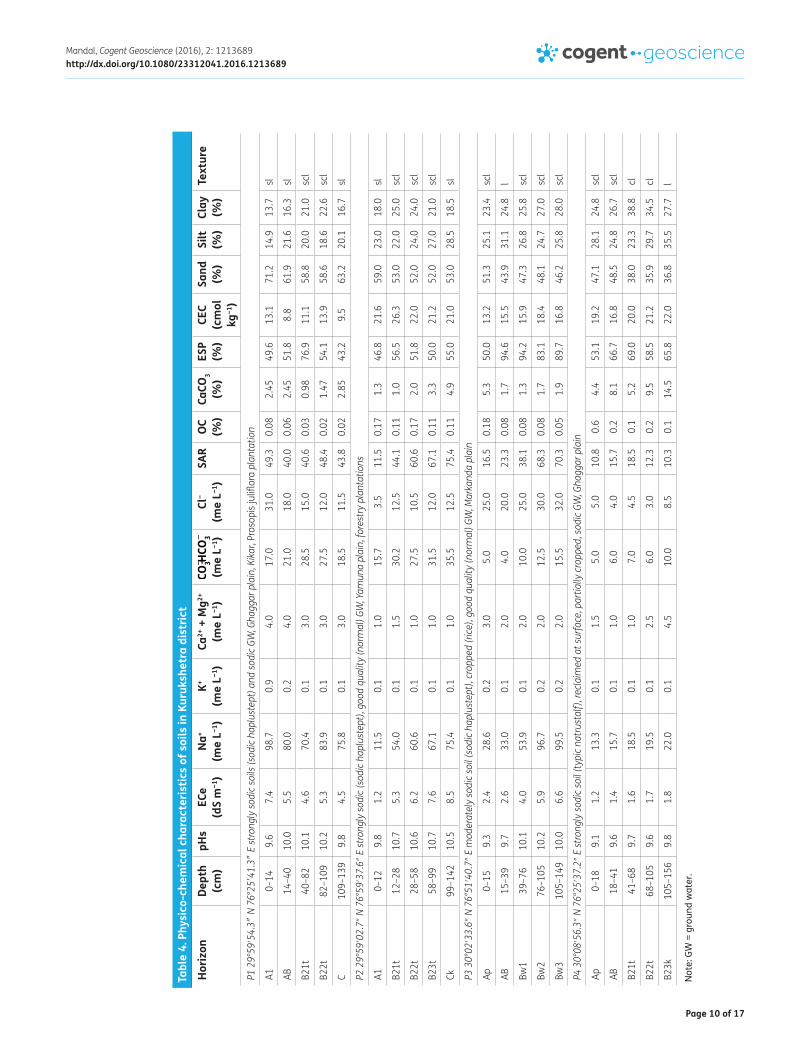
3.1.3. Physical and chemical characteristics of salt-affected soils and watersThe field morphological characteristics of four representative soil profiles ranges from deep to very deep, pale brown to dark yellowish brown, sandy loam to sandy clay loam/clay loam texture, medi-um to strong, coarse to fine angular/sub-angular blocky structure, sticky, plastic to very sticky, very plastic consistency, presence of few to abundant CaCO3 nodules and moist to wet sub-surface hori-zons. A few iron and manganese mottles were also found in sub-surface (50 cm) layers of P3 (Markanda plain) and P4 (Ghaggar plain), due to prolonged saturation with water. CaCO3 concretions (2–5 cm, 10–30%) were found at 1 m depth in P2 and P4. The textural changes occurred from sandy loam to sandy clay loam and sandy clay loam to clay loam at P1, P2, and P4 apparently due to clay illuviation. The silt and clay contents were higher than sand content in P3 and P4 possibly due to lower topographic position.
Soil physical and chemical properties of four representative soil profiles are presented in Table 4. The pHs value ranges from 9.1 to 10.7 indicating alkaline reaction. The depth distribution of ECe values of P1 (4.5–7.4 dS m−1) and P3 (2.4–6.6 dS m−1) indicated moderate soil salinity while P2 (1.2–8.5 dS m−1) showed higher salinity at sub-surface depth and soil salinity in P4 (1.2–1.8 dS m−1) is low in general. The carbonate plus bicarbonate content is high in P1 (17.0–28.5 me L−1) and P2 (15.7–35.5 me L−1) and low in P3 (5.0–15.5 me L−1) and P4 (5.0–10.0 me L−1). A significant content of CaCO3 (calcretes) was noted at 99 and 105 cm depths in P2 (1.3–4.9%) and P4 (4.4–14.5%) which caused restricted drainage and caused low permeability. CEC values were low in P1 (8.8–13.1 c mol (p+) kg−1) and P3 (13.2–18.4 c mol (p+) kg−1) due to coarse texture. The higher ESP values in P1 (49.6–76.9), P3 (50.0–94.6), P2 (46.8–56.5), and P4 (53.1–69.0) favored higher alkalinity.
Chemical properties such as pH (8.7–9.5), RSC (9.0–12.7 me L−1), and SAR (12.4–23.4) water sam-ples are presented in Table 5. Among the anions CO2−
3 (1.5–3.0 me L−1), and HCO−
3(2.5–13.2 me L−1)
and cations Na+ (9.9–16.6 me L−1) and Ca2+ + Mg2+ (1.0–2.5 me L−1) and Cl− (1.7–10.0 me L−1) were dominant. RSC values range from 2.0 to 12.7 me L−1 and are critical in T1 (12.7 me L−1), T3 (12.0 me L−1),
Page 14 of 17
Mandal, Cogent Geoscience (2016), 2: 1213689http://dx.doi.org/10.1080/23312041.2016.1213689
T2 (9.0 me L−1) and T4 (6.0 me L−1) respectively (Richards, 1954). SAR values are higher (>10) in general.
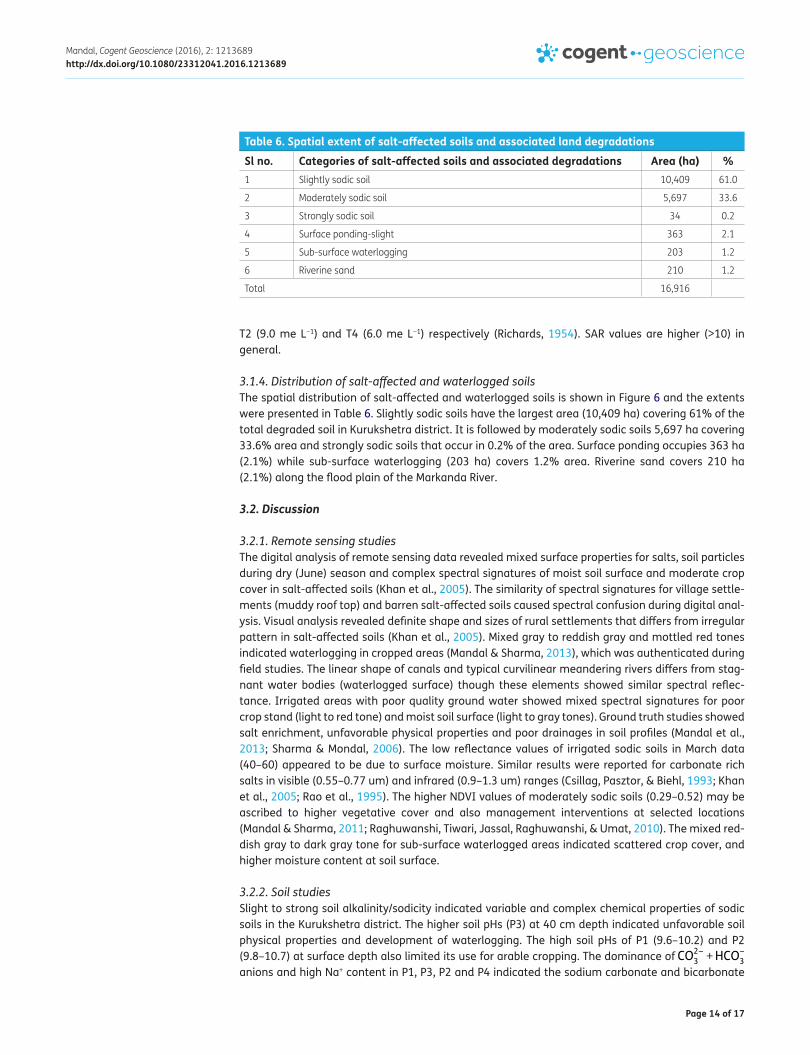
3.1.4. Distribution of salt-affected and waterlogged soilsThe spatial distribution of salt-affected and waterlogged soils is shown in Figure 6 and the extents were presented in Table 6. Slightly sodic soils have the largest area (10,409 ha) covering 61% of the total degraded soil in Kurukshetra district. It is followed by moderately sodic soils 5,697 ha covering 33.6% area and strongly sodic soils that occur in 0.2% of the area. Surface ponding occupies 363 ha (2.1%) while sub-surface waterlogging (203 ha) covers 1.2% area. Riverine sand covers 210 ha (2.1%) along the flood plain of the Markanda River.
3.2. Discussion
3.2.1. Remote sensing studiesThe digital analysis of remote sensing data revealed mixed surface properties for salts, soil particles during dry (June) season and complex spectral signatures of moist soil surface and moderate crop cover in salt-affected soils (Khan et al., 2005). The similarity of spectral signatures for village settle-ments (muddy roof top) and barren salt-affected soils caused spectral confusion during digital anal-ysis. Visual analysis revealed definite shape and sizes of rural settlements that differs from irregular pattern in salt-affected soils (Khan et al., 2005). Mixed gray to reddish gray and mottled red tones indicated waterlogging in cropped areas (Mandal & Sharma, 2013), which was authenticated during field studies. The linear shape of canals and typical curvilinear meandering rivers differs from stag-nant water bodies (waterlogged surface) though these elements showed similar spectral reflec-tance. Irrigated areas with poor quality ground water showed mixed spectral signatures for poor crop stand (light to red tone) and moist soil surface (light to gray tones). Ground truth studies showed salt enrichment, unfavorable physical properties and poor drainages in soil profiles (Mandal et al., 2013; Sharma & Mondal, 2006). The low reflectance values of irrigated sodic soils in March data (40–60) appeared to be due to surface moisture. Similar results were reported for carbonate rich salts in visible (0.55–0.77 um) and infrared (0.9–1.3 um) ranges (Csillag, Pasztor, & Biehl, 1993; Khan et al., 2005; Rao et al., 1995). The higher NDVI values of moderately sodic soils (0.29–0.52) may be ascribed to higher vegetative cover and also management interventions at selected locations (Mandal & Sharma, 2011; Raghuwanshi, Tiwari, Jassal, Raghuwanshi, & Umat, 2010). The mixed red-dish gray to dark gray tone for sub-surface waterlogged areas indicated scattered crop cover, and higher moisture content at soil surface.
3.2.2. Soil studiesSlight to strong soil alkalinity/sodicity indicated variable and complex chemical properties of sodic soils in the Kurukshetra district. The higher soil pHs (P3) at 40 cm depth indicated unfavorable soil physical properties and development of waterlogging. The high soil pHs of P1 (9.6–10.2) and P2 (9.8–10.7) at surface depth also limited its use for arable cropping. The dominance of CO2−
3 + HCO−
3
anions and high Na+ content in P1, P3, P2 and P4 indicated the sodium carbonate and bicarbonate
Table 6. Spatial extent of salt-affected soils and associated land degradationsSl no. Categories of salt-affected soils and associated degradations Area (ha) % 1 Slightly sodic soil 10,409 61.0
2 Moderately sodic soil 5,697 33.6
3 Strongly sodic soil 34 0.2
4 Surface ponding-slight 363 2.1
5 Sub-surface waterlogging 203 1.2
6 Riverine sand 210 1.2
Total 16,916
Page 15 of 17
Mandal, Cogent Geoscience (2016), 2: 1213689http://dx.doi.org/10.1080/23312041.2016.1213689
parent materials that favored sodicity development in soils (Bhargava, Sharma, Pal, & Abrol, 1980; Sharma, Mandal, Singh, & Singh, 2011). The low contents of Ca2+ + Mg2+ are due to precipitation of calcium carbonates in an alkaline medium (Bhargava & Bhattacharjee, 1982). The texture analysis of P4, P3, P1 and P2 indicated higher clay contents in sub-surface layers that caused restricted drain-age and favored waterlogging. Higher CEC values in P2 and P4 is attributed due to higher clay con-tent. The high ESP values showed significant saturation with exchangeable Na+ that favored alkali soil formation. The high CaCO3 contents caused drainage congestion. The soil physical and chemical properties indicated variable alkalinity dominated by alkaline earth metals and poor drainage caused low permeability (Raghuwanshi et al., 2010).
The high pH, RSC and SAR values of water samples indicated their sodic nature dominated by the presence of CO2−
3, HCO−
3 and Na+ while the presence of Ca2+ + Mg2+ and Cl− is also noted. Higher SAR
values indicated dominance of Na+ ion, causing soils unsuitable for agriculture (Richards, 1954). The critical limits of RSC in T1, T3, T2 and T4 indicated the need for treatment with amendments for irri-gation in field crops. Treatment with gypsum is required for water samples with high RSC (T1–T4). Samples with moderate alkalinity (T5 and T6) may be used for the growing salt-resistant varieties.
3.3. Reclamation and use potential of salt-affected and waterlogged soilsSodic soils of the Gangetic plain in Central Haryana are rich in sodium carbonate and bicarbonate salts and showed high ESP and variable soil texture. Strongly sodic soils (P1 and P2) containing high Na2CO3 and NaHCO3 salts, coarse soil texture and sodic ground water needs gypsum application @ 8–10 t ha−1 to reduce alkalinity in soil and water followed by leaching of excess soluble salts. Moderately sodic soil (P3) containing soluble Na2CO3 and NaHCO3 salts and fine soil texture can be reclaimed by addition of 4–6 t ha−1 gypsum. Due to high clay content and presence of CaCO3 concre-tions, P4 (slightly sodic soil) showed drainage restrictions and waterlogging. It may be used for growing salt-tolerant rice and wheat crops. The addition of FYM in soils and cultivation of Dhaincha (Sesbania sp.) is suggested to improve physical properties, drainage conditions and reduce waterlogging.
4. ConclusionsVisual and digital analysis of IRS LISS III multi-temporal data was used for identification and deline-ation of sodic soils and waterlogged areas in the Gangetic plain of Central Haryana. Field validation and laboratory analysis for physical and chemical properties facilitated development of map leg-ends. High values for spectral reflectance were observed from salty surfaces, and higher energy absorption in visible and infrared bands suggested the identification of strongly sodic soils and sur-face waterlogging. The mixed spectral signatures for salt, scattered crop covers and waterlogging were authenticated by field investigation. Saturation of Na2CO3 and NaHCO3 salts in soil and ground water caused alkalization and low soil productivity. Fine soil texture and the presence of concretion-ary calcium carbonate layer at sub-surface depths tended to produce waterlogging. Sodic soils and sodic water can be reclaimed with suitable amendments such as gypsum or pyrite.
AcknowledgmentsThe author thanks Director and Head, Soil and Crop Management Division CSSRI Karnal for necessary support and guidance to carry out the work. Sincere thanks are also due to technical personnel involved in soil analysis and cartographic works. Thanks are also due to NRSC Hyderabad for providing satellite images and other analytical supports for image analysis and technical guidance for database generations.
FundingThe authors received no direct funding for this research.
Author detailsA.K. Mandal1
E-mail: [email protected] Department of Soil and Crop Management, Central Soil
Salinity Research Institute, Karnal 132001, Haryana, India.
Citation informationCite this article as: Mapping and characterization of salt-affected and waterlogged soils in the Gangetic plain of central Haryana (India) for reclamation and management, A.K. Mandal, Cogent Geoscience (2016), 2: 1213689.
Cover imageSource: Author.
ReferencesBhargava, G. P., Sharma, R. C., Pal, D. K., & Abrol, I. P. (1980).
A case study of the distribution and formation of salt affected soils in Haryana state. In Proceedings of the International Symposium on Salt Affected Soils (pp. 83–91). Karnal: CSSRI.
Bhargava, G. P., & Bhattacharjee, J. C. (1982, February, 8–16). Morphology, genesis and classification of salt affected
Page 16 of 17
Mandal, Cogent Geoscience (2016), 2: 1213689http://dx.doi.org/10.1080/23312041.2016.1213689
soils. In Review of Soil Research in India, 12th International Congress of Soil Science (pp. 508–528). New Delhi: Indian Society of Soil Science.
Coleman, T. L., Agbu, P. A., Montgomery, O. L., & Prasad, S. (1991). Spectral band selection for quantifying selected properties in highly weathered soils. Soil Science, 151, 355–361. http://dx.doi.org/10.1097/00010694-199105000-00005
Csillag, F., Pasztor, L., & Biehl, L. L. (1993). Spectral band selection for the characterization of salinity status of soils. Remote Sensing of Environment, 43, 231–242. http://dx.doi.org/10.1016/0034-4257(93)90068-9
Dwivedi, R. S., & Sreenivas, K. (2002). The vegetation and waterlogging dynamics as derived from spaceborne multispectral and multitemporal data. International Journal of Remote Sensing, 23, 2729–2740. http://dx.doi.org/10.1080/01431160110076234
Dwivedi, R. S. (2006). Study of salinity and waterlogging in Uttar Pradesh (India) using remote sensing data. Land Degradation & Development, 5, 191–199.
FAO/IIASA/ISRIC/ISS-CAS/JRC. (2008). Harmonized world soil database (version 1.0). Rome: FAO.
Gupta, S. K. (2010). Management of alkali water (Technical Bulletin CSSRI/Karnal/2010/01, p. 62). Karnal: Central Soil Salinity Research Institute.
Howari, F. M. (2003). The use of remote sensing data to extract information from agricultural land with emphasis on soil salinity. Australian Journal of Soil Research, 41, 1243–1253. http://dx.doi.org/10.1071/SR03033
Howari, F. M., Goodell, P. C., & Miyamoto, S. (2002). Spectral properties of salt crust on saline soils. Journal of Environment Quality, 31, 1453–1461. http://dx.doi.org/10.2134/jeq2002.1453
Jackson, M. L. (1986). Advanced soil chemical analysis. New Delhi: Prentice Hall of India.
Joshi, M. D., & Sahai, B. (1993). Mapping of salt-affected land in Saurashtra coast using Landsat satellite data. International Journal of Remote Sensing, 14, 1919–1929. http://dx.doi.org/10.1080/01431169308954012
Joshi, D. C., Toth, T., & Sari, D. (2002). Spectral reflectance characteristics of na-carbonate irrigated arid secondary sodic soils. Arid Land Research and Management, 16, 161–176. http://dx.doi.org/10.1080/153249802317304459
Kapoor, B. S., Singh, H. B., Goswami, S. C., Abrol, I. P., Bhargava, G. P., & Pal, D. K. (1981). Weathering of micaceous minerals in some salt affected soils. Journal of the Indian Society of Soil Science, 29, 486–492.
Khan, N. M., Rastoskuev, V. V., Sato, Y., & Shiozawa, S. (2005). Assessment of hydrosaline land degradation by using a simple approach of remote sensing indicators. Agricultural Water Management, 77, 96–109. http://dx.doi.org/10.1016/j.agwat.2004.09.038
Manchanda, H. R. (1976). Quality of ground waters in Haryana (p. 160). Hisar: Haryana Agriculture University.
Manchanda, M. L., & Iyer, H. S. (1983). Use of Landsat imagery and aerial photographs for delineation and categorization of salt-affected soils of part of North-West India. Journal of the Indian Society of Soil Science, 31, 263–271.
Mandal, A. K. (2012). Delineation and characterization of salt affected and waterlogged areas in the Indo-Gangetic plain of central Haryana (District Kurukshetra) for reclamation and management. Journal of Soil Salinity and Water Quality, 4, 21–25.
Mandal, A. K., & Sharma, R. C. (2001). Mapping of waterlogged areas and salt affected soils in the IGNP command area. Journal of the Indian Society of Remote Sensing, 29, 229–235. http://dx.doi.org/10.1007/BF02995728
Mandal, A. K., & Sharma, R. C. (2005). Computerized database on salt affected soils in Haryana State. Journal of the Indian Society of Remote Sensing, 33, 447–455.
Mandal, A. K., & Sharma, R. C. (2006). Computerized database on salt affected soils for agro-climatic regions in the Indo-Gangetic plain of India using GIS. Geocarto International, 21, 47–57. http://dx.doi.org/10.1080/10106040608542383
Mandal, A. K., & Sharma, R. C. (2010). Delineation and characterization of waterlogged and salt Affected areas in IGNP command, Rajasthan for reclamation and management. Journal of the Indian Society of Soil Science, 58, 449–454.
Mandal, A. K., & Sharma, R. C. (2011). Delineation and characterization of waterlogged salt affected soils in IGNP using remote sensing and GIS. Journal of the Indian Society of Remote Sensing, 39, 39–50. http://dx.doi.org/10.1007/s12524-010-0051-5
Mandal, A. K., & Sharma, R. C. (2012). Description and characterization of typical soil monoliths from salt affected areas in Rajasthan. Journal of the Indian Society of Soil Science, 60, 299–303.
Mandal, A. K., & Sharma, R. C. (2013). Mapping and characterization of waterlogged and salt Affected soils in Loonkaransar area of Indira Gandhi Nahar Pariyojona for reclamation and management. Journal of the Indian Society of Soil Science, 61, 29–33.
Mandal, A. K., Sethi, M., Yaduvanshi, N. P. S., Yadav, R. K., Bundela, D. S., Chaudhari, S. K., … Sharma, D. K. (2013). Salt affected soils of Nain experimental farm: Site characteristics, reclaimability and potential use (Technical Bulletin: CSSRI/Karnal/2013/03, p. 34). Karnal: Central Soil Salinity Research Institute (CSSRI).
Mandal, A. K., Obi Reddy, G. P., & Ravisankar, T. (2011). Digital database of salt affected soils in India using geographic information system. Journal of Soil Salinity and Water Quality, 3, 16–29.
Metternicht, G., & Zinck, J. A. (1997). Spatial discrimination of salt- and sodium-affected soil surfaces. International Journal of Remote Sensing, 18, 2571–2586. http://dx.doi.org/10.1080/014311697217486
Mougenot, B., Pouget, M., & Epema, G. F. (1993). Remote sensing of salt affected soils. Remote Sensing Reviews, 7, 241–259. http://dx.doi.org/10.1080/02757259309532180
National Remote Sensing Agency. (1997). Salt affected soils. Hyderabad: Author.
National Remote Sensing Agency. (2007). Manual: Nationwide mapping of land degradation using multi-temporal satellite data. Hyderabad: Author.
National Remote Sensing Agency. (2008). Mapping salt-affected soils in India (p. 54). Hyderabad: Author.
Phogat, V., Satyavan, K. S., & Sharma, S. K. (2011). Effects of cyclic and blending uses of saline andgood quality waters on soil salinization and crop yields under pearl millet-wheat rotation. Journal of the Indian society of Soil Science, 59, 94–96.
Raj kumar, Ghabru, S. K., Singh, N. T., Ahuja, R. L., & Sharma, B. D. (2010). Origin of salinity in the Indus plains of sub-continent. Journal of Soil Salinity and Water Quality, 2, 24–33.
Raghuwanshi, S. R. S., Tiwari, S. C., Jassal, H. S., Raghuwanshi, O. P. S., & Umat, R. (2010, October 8–10). Clay mineralogy study of salt affected soils of Bhind district, Madhya Pradesh (p. 29). National Seminar on “Issues of Land Resource Management: Land Degradation, Climate Change, and Land Use Diversification”, Nagpur.
Rao, B. R. M., Sharma, R. C., Ravi Sankar, T., Das, S. N., Dwivedi, R. S., Thammappa, S. S., & Venkataratnam, L. (1995). Spectral behaviour of salt-affected soils. International Journal of Remote Sensing, 16, 2125–2136. http://dx.doi.org/10.1080/01431169508954546
Page 17 of 17
Mandal, Cogent Geoscience (2016), 2: 1213689http://dx.doi.org/10.1080/23312041.2016.1213689
© 2016 The Author(s). This open access article is distributed under a Creative Commons Attribution (CC-BY) 4.0 license.You are free to: Share — copy and redistribute the material in any medium or format Adapt — remix, transform, and build upon the material for any purpose, even commercially.The licensor cannot revoke these freedoms as long as you follow the license terms.
Under the following terms:Attribution — You must give appropriate credit, provide a link to the license, and indicate if changes were made. You may do so in any reasonable manner, but not in any way that suggests the licensor endorses you or your use. No additional restrictions You may not apply legal terms or technological measures that legally restrict others from doing anything the license permits.
Cogent Geoscience (ISSN: 2331-2041) is published by Cogent OA, part of Taylor & Francis Group. Publishing with Cogent OA ensures:• Immediate, universal access to your article on publication• High visibility and discoverability via the Cogent OA website as well as Taylor & Francis Online• Download and citation statistics for your article• Rapid online publication• Input from, and dialog with, expert editors and editorial boards• Retention of full copyright of your article• Guaranteed legacy preservation of your article• Discounts and waivers for authors in developing regionsSubmit your manuscript to a Cogent OA journal at www.CogentOA.com
Rao, B. R. M., Dwivedi, R. S., Sreenivas, K., Khan, Q. I., Ramana, K. V., Thammappa, S. S., & Fyzee, M. A. (1998). An inventory of salt-affected soils and waterlogged areas in the Nagarjunsagar Canal Command Area of southern India, using space-borne multispectral data. Land Degradation & Development, 9, 357–367. http://dx.doi.org/10.1002/(ISSN)1099-145X
Richards, L. A. (Ed.). (1954). Diagnosis and improvement of saline and alkali soils. Washington, DC: United States Department of Agriculture.
Sachdev, C. B., Lal, T., Rana, K. P. C., & Sehgal, J. (1995). Soils of Haryana for optimizing land use (Vol. 44, p. 59). Nagpur: National Bureau of Soil Survey and Land Use Planning.
Samra, J. S., Singh, G., & Ramakrishna, Y. S. (2006). Drought management strategies in India (p. 277). New Delhi: ICAR.
Saxena, R. K. (2003). Application of remote sensing in soils and agriculture. Journal of the Indian Society of Soil Science, 51, 431–447.
Saxena, R. K., Sharma, R. C., Verma, K. S., Pal, D. K., & Mandal, A. K. (2004). Salt affected soils, Etah district (Uttar Pradesh) (Vol. 108, p. 85). Nagpur: NBSS-CSSRI Publ., NBSS&LUP.
Sharma, R. C., Mandal, A. K., Singh, R., & Singh, Y. P. (2011). Characteristics and use potential of sodic and associated soils in CSSRI experimental farm, Lucknow, Uttar Pradesh. Journal of the Indian Society of Soil Science, 59, 381–387.
Sharma, R. C., & Mondal, A. K. (2006). Mapping of soil salinity and sodicity using digital image analysis and GIS in irrigated lands of the Indo-Gangetic plain. Agropedology, 16, 71–76.
Sharma, R. C., Saxena, R. K., & Verma, K. S. (2000). Reconnaissance mapping & management of salt affected soils using satellite images. International Journal of Remote Sensing, 21, 3209–3218. http://dx.doi.org/10.1080/014311600750019831
Sharma, R. C., Saxena, R. K., Verma, K. S., & Mandal, A. K. (2008). Characteristics and reclaimability of sodic soils
in the alluvial plain of Etah district, Uttar Pradesh. Agropedology, 18, 76–82.
Shrestha, R. P. (2006). Relating soil electrical conductivity to remote sensing and other soil properties for assessing soil salinity in northeast Thailand. Land Degradation & Development, 17, 677–689. http://dx.doi.org/10.1002/(ISSN)1099-145X
Singh, G. B. (2009). Salinity-related desertification and management strategies: Indian experience. Land Degradation & Development, 20, 367–385. http://dx.doi.org/10.1002/ldr.v20:4
Singh, G. B., Bundela, D. S., Sethi, M., Lal, K., & Kamra, S. K. (2010). Remote sensing and geographical information system for appraisal of salt-affected soils in India. Journal of Environment Quality, 39, 5–15. http://dx.doi.org/10.2134/jeq2009.0032
Verma, D., Singh, A. N., Sreenivas, K., Dwivedi, R. S., & Mathur, A. (2004, February 9–14). Evaluation of image fusion techniques on IRS multi-sensor data for delineation of sodic lands. In International Conference on “Sustainable Management of Sodic Lands- Extended Summaries (p. 553). Lucknow: Uttar Pradesh Council of Agricultural Research (UPCAR).
Verma, K. S., Saxena, R. K., Barthwal, A. K., & Deshmukh, S. N. (1994). Remote sensing technique for mapping salt affected soils. International Journal of Remote Sensing, 15, 1901–1914. http://dx.doi.org/10.1080/01431169408954215
Verma, K. S., Saxena, R. K., & Bhargava, G. P. (2007). Anomalies in classification of salt affected soils under USDA Soil Taxonomy. Journal of the Indian Society of Soil Science, 55, 1–9.
Verma, T. P., Singh, S. P., Gopal, R., Dhankar, R. P., Rao, R. V. S., & Lal, T. (2012). Characterization and evaluation of soils of Trans-Yamuna area in Etawah district, Uttar Pradesh for sustainable land use. Agropedology, 22, 26–34.