mapinfo - gemapping.com portfolio of solutions from mapinfo. as you will discover in the following...
TRANSCRIPT

MapInfo8 Geodemographic Fundamentals 11 Leveraging the Target Marketing Cycle 19 Industry Focus: Financial Services
W W W . M A P I N F O . C O M / M A G A Z I N E
TH
E
QU
AR
TE
RL
Y
MA
GA
ZI
NE
F
OR
P
RO
VI
DE
RS
O
F
LO
CA
TI
ON
I
NT
EL
LI
GE
NC
E
M A G A Z I N E2 0 0 4 • V o l u m e 8 , N u m b e r 1
®
STORY PAGE 4
and the
Solution
Marketing ChallengeT H E
PSYTE U.S. Advantage

M A P I N F O M A G A Z I N E
www.mapinfo.com/magazine
2
contents:
technical16 Tech Tips: Weighting of Profiles
By Steve Bourgault
VICE PRESIDENT, SALES & MARKETING
Gavin Lennox
EDITOR- IN-CHIEF
Terry Keenan
MANAGING EDITOR
Gavin O’Hara
CORPORATE OFFICERS
Mark P. CattiniPresident and Chief Executive Officer
Michael HickeyChief Operating Officer
Wayne McDougallExecutive Vice President and Chief Financial Officer
George MoonChief Technology Officer
Bert C. TobinExecutive Vice President,Human Resources
Jason W. Joseph, Esq.Corporate Counsel
SEND COMMENTS TO
MapInfoMagazine
MapInfo Corporation
One Global View
Troy, New York 12180-8399 USA
DESIGN
Tessa Koby
249 Green Street
Schenectady, New York 12305-1447 USA
departments3 A Letter to MapInfo
Magazine Readers
5 VIEWPOINT: Latin America
10 CASE STUDY: Ekornes USA
13 VIEWPOINT: Asia-Pacific
14 In the News
18 MapInfo User Groups
19 INDUSTRY FOCUS: Financial Services
features4 Cover Story:
The Marketing Challenge and thePSYTE U.S. Advantage SolutionBy Chris Michels
8 Geodemographic Fundamentals: in Support of Neighborhood Level DataBy Chris Michels
11 Leveraging the Target Marketing Cycle to Grow and Strengthen Your BusinessBy Paul Thompson
VOLUME 8, NUMBER 1
MapInfoM A G A Z I N E
®

Dear Readers:
The launch of PSYTE U.S. Advantage—MapInfo’s newly re-engineered neighbor-
hood segmentation system—marks a significant milestone for MapInfo and,
more importantly, for our customers. The new PSYTE Advantage is a cornerstone
and foundation data offering to the site selection, market potential and target
marketing portfolio of solutions from MapInfo.
As you will discover in the following pages, PSYTE Advantage offers the kind
of incredible insight you need to drive important business decisions. The breadth
and depth of demographic, consumer and lifestyle information that is built into
PSYTE Advantage can effect a rapid return on investment. Hallmarks of the PSYTE
Advantage solution include precise targeted direct mail that zeroes in on those most
likely to respond, pinpoint real estate selection that identifies sites with the highest
potential for sales and clear-cut market and product potential metrics that guide
merchandise mix and promotion. PSYTE Advantage customers can reap compelling
revenue rewards from the informed marketing intelligence provided by this solution.
PSYTE Advantage is simply the most accurate snapshot of American neighborhoods
available today. It is the culmination of decades of expertise, and is also the fruit of
two MapInfo acquisitions: Compusearch and, more recently, Thompson Associates.
In fact, we are so confident in the superior performance of our clusters that we
have challenged those in the marketplace to test PSYTE Advantage—for free.
See www.psyte.net for details.
MapInfo is focused on partnerships that can improve our customers’ profitability
by enabling more strategic location, marketing and merchandising decisions.
World-class solutions such as PSYTE Advantage address the unique needs of
our clients, combining our vast expertise with superior technologies, research,
data and consulting services. We hope you enjoy this issue of MapInfo Magazine.
Sincerely,
Kevin Antram
Vice President and General Manager
MapInfo Corporation
The breadth
and depth of
demographic,
consumer
and lifestyle
information that
is built into
PSYTE Advantage
can effect a
rapid return on
investment.
M A P I N F O M A G A Z I N E
www.mapinfo.com/magazine
3
A L E T T E R T O M A P I N F O M A G A Z I N E R E A D E R S

M A P I N F O M A G A Z I N E
www.mapinfo.com/magazine
4
C O V E R S T O R Y By Chris Michels
and the
Solution
Marketing ChallengeT H E
PSYTE U.S. Advantage

M A P I N F O M A G A Z I N E
www.mapinfo.com/magazine
5
By Ricardo Sahagun
When marketing consultants with a background in U.S. consumer segmenta-tion systems undertake projects in LatinAmerica, they are immediately struck by three harsh realities:
• There are no commercially available segmentation system solutions for theLatin American markets as there are for the U.S. and Europe
• There is little, if any, commercially available secondary data that can be used for serious lifestyle segmentation projects
• The data that is available is typically outdated, inaccurate, incomplete,painfully overpriced and/or even illegallysourced. While a few multinational firms such as BSBW have made seriousattempts at developing global lifestylesegmentation systems, these remainhighly conceptual, extremely generic,potentially biased and of limited practical application
Why is it so difficult to find commercialsegmentation system solutions in LatinAmerica? While the greater majority ofLatin American countries are extremelyefficient and effective in generating population census data, the information is limited in scope and content. Unlikemore developed economies, a significantpart of the population does not use creditor debit cards, have checking accounts,own a car or use insurance—all of which are secondary data sources at the transaction level. In addition, somecountries limit the sale of customer databases. And firms that commission surveys to develop in-house segmentationsystems are extremely reluctant to shareor resell their segmentation data.
The situation for marketers in LatinAmerica is difficult, but by no means hopeless. As an example, the Associationof Mexican Market Research and PublicOpinion Agencies (AMAI) promotes withinits membership the use of a classificationsystem for market research that segmentsconsumers into seven socio-economicgroups, or levels, based on income, educa-tion, housing characteristics, ownership of consumer goods, use of banking orinsurance services and entertainment
continued on page 7
Segmentation Systems in Latin America
viewpoint: LATIN AMERICA
MapInfo PSYTE® U.S. Advantage—the next-generation neighborhood cluster system from MapInfo—builds upon proven best practices and introduces new levels of accuracyand insight to market analysis. Clustersegmentation vastly improves yourability to uncover and focus on thetraits and characteristics that drivemarket success. Loyalty programs,point-of-sale data, warranty cards, subscriptions, account details and evencustomer surveys can capture manyuseful data elements for analytical and marketing purposes. However, acomprehensive market understandingcan be more difficult to come by and answers to important questions—“What does the market potential forProduct A look like? Why is Store Xunder-performing? Where should Iopen my next outlet?”—can oftenremain elusive.
That’s where PSYTE comes in. PSYTEU.S. Advantage is a mélange of dataelements—solid geodemographics and indicative metrics of consumerbehavior—specifically built to addressthe complex and sometimes obscuremarketing challenges of today. As households and individuals areincreasingly bombarded by both targeted and mass marketing multi-media messages, the marketing challenge has evolved not only into
hitting that “prime target” but also to relating to that preferred potentialcustomer in a meaningful and relevantmanner that will promote optimalcampaign response. PSYTE U.S.Advantage helps you answer key questions: “Who are my customers?Where do they come from? How can I attract and find more just like them?”
Marketing challenges go beyond targetmarketing and customer acquisitionissues. Market potential and site location analysis efforts make use ofclusters in determining merchandisemix, defining category managementconsiderations based on consumer type and identifying prime real estateoptions based on market profiles andlocation intelligence.
The most accurate snapshots of American neighborhoods
PSYTE U.S. Advantage is a uniquecombination of MapInfo’s location-enhanced lifestyle and consumer data, geodemographics and clusteringtechniques that result in the industry’smost accurate snapshot of Americanneighborhoods. PSYTE U.S. Advantagecharacterizes America via 72 mutuallyexclusive “clusters,” or neighborhoodtypes. Each cluster is unique in termsof key demographics, consumer behavior, media preferences, lifestyleand location.
H O W H AV E M A P I N F O C U S T O M E R S W O R L D W I D E G A I N E D
A SUSTAINABLE COMPETITIVE ADVANTAGE? BY ABSORBING AN INTIMATE KNOWLEDGE
AND UNDERSTANDING OF THEIR BEST CUSTOMERS, MARKETS AND SITES; ENGAGING
IN APPROPRIATE AND MARKET-DRIVEN MERCHANDISE MARKETING AND PLACEMENT ;
AND IMPLEMENTING RESULTS-DRIVEN TARGET-MARKETING CAMPAIGNS. AND WHAT IS
THE CORNERSTONE THAT CONTRIBUTES TO THIS SUCCESS? CLUSTER SEGMENTATION.
The Marketing Challenge and the PSYTE U.S. Advantage Solutioncontinued

The Marketing Challenge and the PSYTE U.S. Advantage Solutioncontinued
M A P I N F O M A G A Z I N E
www.mapinfo.com/magazine
6
PSYTE U.S. Advantage is a proven and versatile predictive analytic tool,enabling a wide range of market analysisapplications. Segmentation addressesthese key marketing challenges:
Customer acquisition and target marketing
A clear and detailed understandingof customers and markets
The selection of effective targetsbased on business needs
The creation of media messages andimages most likely to trigger response
Cost-effective media placement
Market and product potential
Identification of high potentialuntapped markets and sites
Analysis of product performance in any neighborhood
Determination of location sales performance benchmarks and objectives
Site location
Analysis of high potential retail sites,service centers and communicationsnetworks
Determination of merchandise mix and location “focus” based onneighborhood profile
Site profitability analysis by locationand cluster profile
PSYTE U.S. Advantage defines andpredicts consumer behavior. It drivesaccurate analysis of neighborhoods and consumers through core geodemo-graphics and insightful measures oflifestyle and behavior. Markets andcustomers are profiled on informationsuch as financial portfolios, productusage, recreational activities and vehicle choices. Clusters enable theidentification of consumers most likely to frequent sushi bars, have
a satellite dish, drive a Japanese SUV,vote Republican, have children underthe age of five, incur big debt or listen to contemporary jazz. Imaginehaving access to this tremendousinsight into the marketplace and your potential customers.
MapInfo cluster build infrastructure: an industry first
With the introduction of PSYTE U.S. Advantage in September 2003,MapInfo successfully took the “blackbox” out of clustering and took a steptowards demystifying its sometimescloudy and subjective development history. An extensive, scientificallyengineered and systematic approach to cluster development was built from the ground up. The PSYTE development team took a step backfrom the array of current cluster products and methods and built ahigh-tech segmentation developmentenvironment from scratch. This refinedapproach has resulted in a powerfulnew descriptive and predictive segmen-tation system built to perform anddrive our customers’ analytical
requirements in market potential, site selection, customer acquisition and, of course, target marketing.
The cluster build infrastructure presents MapInfo and its customerswith revolutionary new analyticalopportunities to assist market intelli-gence, growth and expansion andresponsive marketing campaigns—from client-specific custom clusters to vertical-specific clusters to interna-tional segmentation opportunities.
For the first time, a major cluster system is entirely customizable. PSYTE U.S. Advantage is built withatoms, or small groupings of very
The PSYTE U.S. Advantage system uses new clustering intellectual property developedby MapInfo segmentation experts that combines the “best of the best” clusteringmethods and, above all, accuracy.

that Williams-Sonoma uses MapInfoAnySite® for market research and realestate planning efforts on their keyretail brands (e.g., Williams-Sonomaand Pottery Barn)?
did you know…
M A P I N F O M A G A Z I N E
www.mapinfo.com/magazine
7
similar block groups. The atoms can also be assembled in an infinitenumber of ways to create custom systems. The addition of proprietarydata to the atom clustering processrepresents a compelling custom clustering option. A system that isenhanced with real transaction dataand/or lifestyle attributes specific to a business can represent a tremendousadvantage in conquering both the market and the competition.
PSYTE U.S. Advantage was built in a multi-stage process that considereddemographics, location, access to select amenities and resources, lifestyleelements and settlement context. ThePSYTE U.S. Advantage system usesnew clustering intellectual propertydeveloped by MapInfo segmentationexperts that combines the “best of thebest” clustering methods, techniquesand algorithms with special attentionto spatial context and relevance, quality of data ingredients and, aboveall, accuracy.
Strength of ingredients
An effective and results-driven segmen-tation system must be built using themost accurate and reliable ingredients.It also must be utilized at the most reliable and statistically relevant levelsof geography. Anything less would be a disservice to those that use it. PSYTEU.S. Advantage is a neighborhood cluster system that classifies blockgroups into clusters, the most accurateand steadfast level of geography forgeodemographic analysis. The systememploys only the highest quality datainputs — census demographics, streetlayers, land-use information, retailbusiness locations, mall locations and size, measures of commercial activity, settlement context measures,lifestyle data, actual consumer spend-ing information and highly influentialauto ownership data.
PSYTE U.S. Advantage and the foundational cluster build infrastruc-ture technology is a key componentand intelligence ingredient in the overall Predictive Analytical solution.PSYTE U.S. Advantage is integratedinto the suite of MapInfo software and service offerings.
The competitive business environmentdemands marketing strategies thatmaximize results. Every organizationrequires a significant return on everypromotional dollar it invests, anduntargeted mass marketing techniqueshave not been viable for years.
In order to succeed, companies need more intelligent and affordable alternatives that fully enable the analysis of consumer behavior and the development of targeted marketingefforts to gain new customers, retainthe loyal and bring back the former. In pursuit of these goals, the PSYTEU.S. Advantage neighborhood segmentation system is the mostproven, comprehensive solution on the market today.
MapInfo PSYTE Advantage fine-tunesyour sales and marketing campaignsfor optimal outcomes, delivering the highest possible ROI. PSYTE U.S. Advantage creates vivid, precise profiles of your core customers, then literally maps out the preciseneighborhoods where you’ll find others just like them—consumersalready inclined to respond favorablyto your messages.
With PSYTE U.S. Advantage, youwon’t wonder whether you’re reachingyour target market. You’ll knowyou’ve honed in on it with every communication you generate.
Chris Michels is MapInfo Corporation’s ProductManager, Geodemographic Data.
preferences. While relatively basic, it is fairly consistent and widely used by marketing firms and departmentsthroughout the country.
Via its premier data partnership withgedas Mexico (MapInfo’s “Latin AmericanPartner of the Year” for 2002 and 2003),MapInfo Corporation offers data productsfor Mexico that incorporate the AMAIsocio-economic segmentation system.These products provide socio-economiclevel classification at the city block levelfor numerous Mexican cities.
Further examples abound. In Brazil, the work developed by Ion InformationNetwork and Multispectral/Cognatis is worth noting. The former is a firm specializing in geomarketing research, services and MapInfo-based solutions that has developed basic consumer segmentation and profiling systems forspecific customer projects. Their clientsinclude McDonald’s, Blockbuster andCitibank. Multispectral/Cognatis is a business unit of Multispectral—MapInfo’sData Partner for Brazil— that specializesin predictive analytics, customer profilingand geomarketing solutions for retail banking, consumer electronics and other sectors. In Chile, Pampa Bytes hasimplemented MapInfo-based customer segmentation systems for such clients as BankBoston and Grupo Santander.
Although there might be challenges to yourconsumer segmentation projects in LatinAmerica or other areas around the world,MapInfo Corporation has the products, services, partnerships and resources to help you successfully overcome them.Difficult? Sometimes. Impossible? Never!
Ricardo Sahagun is Sales DevelopmentManager of MapInfo Corporation’s SoutheastU.S. and Latin America Operations.
viewpoint: Latin Americacontinued
WHILE THE GREATER MAJORITY OF LATIN
AMERICAN COUNTRIES ARE EXTREMELY
EFFICIENT AND EFFECTIVE IN GENERATING
POPULATION CENSUS DATA, THE INFORMATION
IS LIMITED IN SCOPE AND CONTENT.
The Marketing Challenge and the PSYTE U.S. Advantage Solutioncontinued
M A P I N F O M A G A Z I N E
www.mapinfo.com/magazine
8
ccuracy. Statistical reliability.Personal information privacy. Effectiveness.
Return on investment. Support. When it comes to the selection of andinvestment in market analysis datatools, one must not only consider all of these requirements but fully satisfythem. Products built on a foundationof geodemographic fundamentals meet and exceed these requirements.Built on decades of demographicmethodology development, MapInfodata clearly illustrates that geodemo-graphics provide the most accuratefoundation and measure of theAmerican demographic landscape.
Geodemography is the disciplinedcombination of “geography” and“demography.” (Here, geography is defined as the science of location,spatial systems and settlement charac-teristics. Demography is defined as the study of human population patterns, characteristics and socio-economic trends.) MapInfo recognizesthat adherence to a set of proven “geodemographic fundamentals” in the development of data informationproducts benefits our customers viaaccurate market analysis, pinpoint site selection and greater depth of customer understanding and insight.
In every post-census period, the mar-ketplace is flooded with new demo-graphic products and claims of thenext best market analysis solution.“Miracle” products designed to solvethe complex business problems of the day at rates previously unthinkableattempt to push aside previous incarna-tions, methods and proven products.However, it is important to note thatmany new demographic products—including household and postal data—lack the basic, solid foundations and geodemographic fundamentalsrequired to accurately and adequatelyaddress market and customer analyticalrequirements. Products, solutions, techniques and methodologies thathave been honed for decades do notstop working overnight.
The amount of misinformation deliv-ered with the release of new productsis staggering; many claims cause moreharm than good in the marketplace.Creative “marketing spin” in particularcauses significant confusion. Newproducts often add little in terms
of new value and, in the worst case,can deceive customers into investingheavily in something that effects littleor no return on their investment.
Many unproven data products actuallyobscure the value of the appropriateand fundamentally correct applicationof geodemographic data in the analysisand detailed understanding of markets,sites and customers. Unfortunately,essential considerations concerning the quality, accuracy, reliability andmethodologies of data products andmarket analysis tools are often lost inthis confusion—becoming secondarydecision-driving requirements.
In order to make effective and insight-ful business decisions regarding thenext optimal markets in which toexpand—or how best to relate to yourcustomers through the media—it isnecessary to possess accurate, provengeodemographic information and adevelopment team of demographersthat fully understand the marketplaceand geographic concepts. Marketing
A
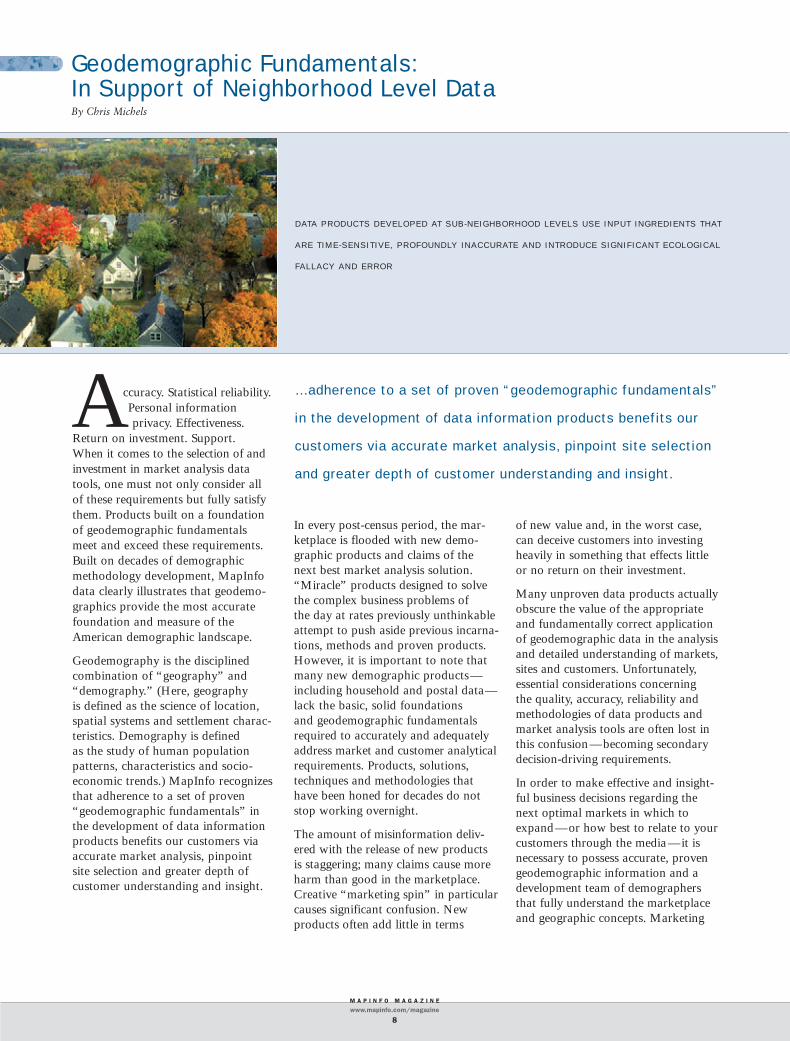
Geodemographic Fundamentals: In Support of Neighborhood Level DataBy Chris Michels
DATA PRODUCTS DEVELOPED AT SUB-NEIGHBORHOOD LEVELS USE INPUT INGREDIENTS THAT
ARE TIME-SENSITIVE, PROFOUNDLY INACCURATE AND INTRODUCE SIGNIFICANT ECOLOGICAL
FALLACY AND ERROR
…adherence to a set of proven “geodemographic fundamentals”
in the development of data information products benefits our
customers via accurate market analysis, pinpoint site selection
and greater depth of customer understanding and insight.

that Polk, a large multinationalcompany in the automobile industry,uses the PSYTE® segmentation systemfor the U.S. and Canada? PSYTE, combined demographic estimates and projections, aids car companies in determining who buys what cars.
did you know…
M A P I N F O M A G A Z I N E
www.mapinfo.com/magazine
9
spin may suggest that household andpostal data products have “pinpointaccuracy,” but when the rubber hitsthe road these products miss the targetdue to their inaccuracy and unreliabledisparate inputs, not to mention theirinvasion of household privacy.
MapInfo geodemographic products are built with statistically reliable census and other key data sets that are tied \to true spatial scales. (That is, Block Groups in the USA andDissemination Areas in Canada.) It is important to note that data products such as cluster segmentationdeveloped at sub-neighborhood level (e.g., households and/or postalcodes) use input ingredients such as consumer-based surveys that aretime-sensitive, profoundly inaccurateand introduce significant ecologicalfallacy and error.
Claims and facts
In pursuit of sound geodemographicfundamentals, we urge our customersand prospects to consider claims versusfacts when making decisions that willaffect the strategic and fiscal health of their organizations. The followingclarifies some of the misconceptionsand claims about sub-neighborhoodhousehold level data products.
> CLAIM: “Smaller is better.” Householdand postal data products better reflectdemographic reality.
> FACT: MapInfo staff work with household and postal level data inresearch, services and development and have concluded that geographicunits smaller than a Block Group can only be effectively clustered whenaccurate and comprehensive client data are available as an input. The fact is, there are no commercially available, complete, relevant, high-quality, statistically reliable data relating to postal codes, households or individuals. The use of consumersurvey data from numerous and disparate sources and assumptive infillmodeling to build generic householdand postal code-based products is
subject to inadequate sample size and is deficient of key and accurateindicators such as income, age, race,etc. In addition, more than 40 millionAmericans move each year. Families,couples, singles and students move in and out of dwellings, rendering the temporal stability of household or postal data a significant issue.
> CLAIM: Neighborhood level data doesnot produce greater homogeneity orbetter target marketing. It producesgreater error.
> FACT: Greater error is introduced in target marketing by assumptivemodeling that arbitrarily assigns demographics and socio-economiccharacteristics to households andpostal levels at which there is no such accurate and statistically reliableinformation available.
> CLAIM: The more households yougroup together in a neighborhood, the more you increase the differencesbetween households.
> FACT: Basic statistics reveal that thelarger the sample, the more statisticallyvalid and the less erratic differenceseffect the norm. For this reason, neighborhood level data is far less susceptible to the erratic differences in socio-economics when comparedwith the households in a ZIP+4.
> CLAIM: Variation of households andpostal levels within a neighborhoodaffect the accuracy of analytical results.
> FACT: To achieve accuracy in targetmarketing, one needs to use the moststatistically valid and reliable informa-tion available. There are no accurateand reliable sources of demographicsbelow the block group. Household andpostal level data are poorly informedand erroneous. Bad data = bad results.
> CLAIM: Household and postal leveldata enables accurate targeting.
> FACT: Household and postal level targeting misses the intended target.The practice of forcing neighborhoodlevel demographic characteristics downto sub-neighborhood units is overlysimplistic and very problematic.
In an era of heightened personal information privacy concerns and legislation, neighborhood level geode-mographic data products remain fullyeffective and more relevant than ever.Designed to explain patterns of groupbehavior, neighborhood level data arecreated and function without violatingindividual or household privacy. This is an important feature thatallows marketers to effectively targethouseholds most likely to respond to campaigns while providing con-sumers with a high level of personalinformation protection.
The bottom line? At MapInfo, webelieve that ‘off-the-shelf’ householdand postal code level data on the market today contains and producesserious analytical problems. Significantinaccuracies are common in demo-graphic data products at the sub-neigh-borhood level. Market analysis usingthese products can only lead compa-nies to make bad decisions, therebycosting them time and money.
MapInfo is often engaged to contribute,support and consult on expensive market and customer analysis projects.Our clients heavily rely upon our dataproducts in these analyses. MapInfostands behind the accuracy, methods,effectiveness and information privacy ofour geodemographic data products.
Chris Michels is MapInfo Corporation’s ProductManager, Geodemographic Data.
To achieve accuracy in target
marketing, one needs to use
the most statistically valid and
reliable information available.
Geodemographic Fundamentals: In support of neighborhood level datacontinued

The company had been struggling tofigure out how to fairly evaluate dealerperformance. But in order for Ekornesexecutives to know which dealers wereunderperforming and which were overperforming, the company first had to pinpoint who its best customerswere and where they lived.
MapInfo used Ekornes USA sales datato create a customer model, or profile,that helped the company study thelocation of existing dealers relative to market potential—and to betterunderstand where they might have too many dealers serving a market or where they might need additionaldealers to service untapped potential.
Using the PSYTE segmentation system,MapInfo helped Ekornes pinpoint who their target customers were. The PSYTE target was characterized by couples between the ages of 45-65whose children no longer live at homeand who have a median family incomeof $75,000 and above. They lead anactive, affluent lifestyle and vacation
MapInfo’s client management teamworked on-site with Ekornes USA staff to lead them through the processof turning customer data into usableinformation. Using MapInfo TargetPro®
and PSYTE, Ekornes was able to createa profile of their various customergroups and compare it to the profile of the trade area around each Ekornesretailer. The end result is a model that Ekornes USA uses to study performance against potential, to trackwhich distributors are meeting theirpotential, to see where potential forvarious products is exceeded and toidentify pockets of untapped potential.
With on-site training and support in the form of technical expertise andmentoring, MapInfo gave Ekornes aready-made, customizable solution to a complicated problem.
Gavin O’Hara is Editor of MapInfo Magazine.
Ekornes USA is the American subsidiary of a Norwegian furniture manufacturer that
distributes through retailers in dozens of countries. The company sells through a
network of approximately 375 dealers with 550 outlets scattered across the United
States and Canada. Ekornes USA sales in 2002 were approximately $50 million.
case studyby Gavin O’Hara
Ekornes USA
often, especially abroad. They go to thetheatre and read more than the averageperson. As an age group, they tend to act and feel as though they are 10years younger than they are. Ekornesalso learned that 1 out of 3 purchasersbought the chairs and sofas for healthreasons. This was an important insightinto how the company should marketits products, and it profoundly affectedhow it distributed resources and spentadvertising dollars.
Ekornes executives expect the MapInfosolution to have a significant impact on ROI, and they expect the improvedtargeting and more efficient dealer net-work to double sales within three years.
M A P I N F O M A G A Z I N E
www.mapinfo.com/magazine
10

M A P I N F O M A G A Z I N E
www.mapinfo.com/magazine
11
n the 1980s, the major televisionnetworks held 92% of the primetime audience, but in the
’90s that share fell to 67% and in the 2000s it has continued to decline. As a result, the effectiveness of massmarketing has fallen on hard times as a smaller and smaller percentage of thepopulation is exposed to mass-market-ed media messages. If businesses hopeto reach the right people, they need to be more targeted in their messagesbecause the consumer pool is becomingmore heterogeneous all the time.
In response to increasing consumerdiversity, many companies have made target marketing a priority. The concept is simple, but the solutionis more complicated. The fact is, target marketing should be viewed as a cycle that is consistently updated based on changing market conditions.The Target Marketing Cycle is thefoundation for running a successfulbusiness, but many still fail to see the importance of it. This article willdiscuss each aspect of the cycle.
The ability of a business to analyze its target groups of customers is predicated on the wealth of customerdata it collects. Transactional data,which links customers to each transac-tion and is usually obtained at thepoint of purchase, is among the bestpossible data sources. In addition,some businesses collect demographicdata such as customer age, gender,
address, etc. A variety of techniquescan be used for collecting both types of customer data—instituting a cus-tomer loyalty program, performingintercept/exit surveys, offering a
special discount or promotional deal in connection to obtaining their information or even using gift withpurchase items. Many companies gather both types of information
I If businesses hope to reach the right people, they need to
be more targeted in their messages because the consumer
pool is becoming more heterogeneous all the time.
1 Collect
2Identify
3Sim
plify
4
Image
5Message
6Reach
7Lo
cate
8Ex
ecut
e
9 Evaluate
TA R G E T M A R K E T I N G C Y C L E
Leveraging the Target Marketing Cycle to Grow and Strengthen Your BusinessBy Paul Thompson
THE CONSUMER POPULATION IS BECOMING MORE AND MORE FRAGMENTED.
NEW TECHNOLOGIES, SPECIALTY CABLE AND SATELLITE CHANNELS, INTERNET
RADIO BROADCAST AROUND THE WORLD AND INCREASING RACIAL DIVERSIFICATION
HAVE CREATED NICHE COMMUNITIES OF CONSUMERS.

by encouraging customers to fill out an application for a credit card in their store at the point of purchase. By doing this, they can obtain demo-graphic and transactional informationbecause the purchase is usually put on the credit card immediately.
Collecting data from customers pre-sents an issue mainly for retailers whoalready have minimal involvementwith their customers. This includesmany customers who pay cash for convenience items. Retailers that lackcustomer information need not despair.Mediamark Research Inc. (MRI) in the USA, Print Measurement Bureau(PMB) in Canada and other syndicatedsurvey companies have captured awealth of information on consumerattitudes, lifestyles and product prefer-ences that any company can use.
Once the customer data is in hand, the next step in the cycle is to identifythose groups of customers or clustersthat have the highest index or likeli-hood of purchasing or using a particu-lar product. At MapInfo, we do this by grouping customers according to neighborhood characteristics asdefined by the PSYTE AdvantageNeighborhood Segmentation System.For example, the figure above showsan index of drinkers who purchaseimported beer in the Toronto market.
In order to understand this informa-tion, it is important to point out thatany cluster that indexes above 100 isconsidered to have a high propensity to use a particular product. An indexless than 100 means the cluster has abelow-average propensity to use theproduct compared to the benchmark.From this analysis, you can see twodistinct target groups—one older andmore affluent and the other youngerand well-educated. This is called identifying your target customers.
The next step involves simplifying the world into only your customers.While we would all like to speak toeach of our customers and be able tooffer each a unique product or service,this is impossible. There are very few retailers who actually deal withcustomers consistently on a one-to-onebasis. Instead, we have to look at customers as target groups. Refer to the import beer profile and target
groups above for an example. The reason for creating target groups isbecause businesses and particularlymarketing professionals can’t developcreative advertising campaigns for 60groups of customers. Most marketingcampaigns will involve only a few relatively homogeneous target groupsthat are susceptible to that business’product. Many marketers will have a mix of conservative and strategicmarketing goals to go along with this concept.
There is a conservative approach thatdeals with marketing to only those target groups that already have a highpenetration and index. On the otherhand, strategic marketing deals withtargeting high-potential, low-indexing
groups, hoping not only to increase the sales of your business’ existing customer base but also to attract a new group of patrons.
Armed with clearly defined targetgroups and a plan to market to them,the next step is to image each targetgroup to better understand the otherproducts that they like to buy, theactivities they enjoy, the types of music they listen to, how they vote,their methods of transportation andeven their reading material. Imagingwill help you create an appropriatemessage by utilizing symbols that are easily identified by your targetedcustomers. If this is done correctly,your business will successfully reachyour target audience and the end result will be increased sales.
M A P I N F O M A G A Z I N E
www.mapinfo.com/magazine
12
0 10 20 30 40 50 60 70 80 90 100 111 125 143 167 200 250 333 500 1000 INF
0 10 20 30 40 50 60 70 80 90 100 111 125 143 167 200 250 333 500 1000 INF
01 Canadian Establishment (U1)02 The Affluentials (U1)04 Urban Gentry (U1)03 Suburban Executives (S1)06 Mortgaged in Suburbia (S1)07 Technocrats & Bureaucrats (S1)09 Asian Heights (S1)05 Boomers & Teens (S2)08 Stable Suburban Families (S2)15 Small City Elite (S2)16 Old Bungalow Burbs (S2)10 Suburban Nesters (S3)12 Brie & Chablis (S3)17 Aging Erudites (S3)14 Satellite Suburbs (S4)23 Kindergarten Boom (S4)13 Blue Collar Winners (T1)19 Town Boomers (T1)27 Old Towns’ New Fringe (T1)18 Participaction Quebec (S5)24 New Quebec Rows (S5)30 Quebec Melange (S5)32 Traditional French Canadian Families (S5)11 Northern Lights (R1)22 The New Frontier (R1)26 Rustic Prosperity (R1)34 Pick-ups & Dirt Bikes (R1)37 Quebec’s Heartland (R1)38 Grain Belt (R1)21 Europa (U2)25 Asian Mosaic (U2)41 High Rise Melting Pot (U2)28 Conservative Homebodies (U3)33 High Rise Sunsets (U3)20 Young Urban Professionals (U4)29 Young Urban Mix (U4)36 Young Urban Intelligentsia (U4)40 University Enclaves (U4)51 Young City Singles (U4)56 Urban Bohemia (U4)31 Old Leafy Towns (T2)35 Town Renters (T2)39 Nesters & Young Homesteaders (T2)44 Young Grey Collar (T2)46 Quiet Towns (T2)43 Argrarian Blues (R2)47 Rod & Rifle (R2)49 Down, Down East (R2)50 Big Country Families (R2)52 Quebec Rural Blues (R2)55 Old Canadian Rustics (R2)42 Euro Quebec (U5)45 Old Quebec Walkups (U5)53 Quebec Town Elders (U5)54 Aging Quebec Urbanites (U5)57 Quebec’s New Urban Mosaic (U5)48 Struggling Downtowns (U6)58 Aged Pensioners (U6)59 Big City Stress (U6)60 Old Grey Towers (U6)
P S Y T E P R O F I L E : B E E R — I M P O R T V S . T O R O N T O H O U S E H O L D S
Leveraging the Target Marketing Cycle to Grow and Strengthen Your Businesscontinued

that Irving Oil uses MapInfo Market-Math®, TargetPro® and PSYTE®? Irving Oil produces 250,000 barrels of oil per day, accounting for 35 percentof Canada’s total petroleum exports.MapInfo uses demographic analysis tohelp Irving Oil determine why certainlocations under-perform. Irving Oil alsouses MapInfo products to decide whatservices to provide and where to locatenew stations or close old ones.
did you know…
M A P I N F O M A G A Z I N E
www.mapinfo.com/magazine
13
Now that your business has identifiedthe appropriate target group and formulated the right message based on their image, it is time to focus onreaching your target group. Part of the equation is using the appropriatemedia vehicle to stimulate their atten-tion. You can have the best message in the world, but if your target audi-ence does not have access to it, yourmoney will be wasted. So first youmust understand the media preferencesof your target audience. This meansknowing whether to advertise on abroadcast network or a shopping network, during a golf tournament ora football game, in the business sectionor the lifestyle section of the paper.Each of the many forms of mediareaches different groups of target customers—needless to say, you willwant to choose a media that reachesyour customers.
Locate, the next step in the TargetMarket Cycle, is one of the keystrengths of MapInfo. MapInfo canfind the markets and neighborhoodsthat have the highest penetration ofyour target customers, then help youmarket to them. MapInfo harnesses the power of location.
Everything boils down to the final step in the target marketing cycle: execution. Analysis has to provideyour business with insight that enablesyou to grow and strengthen your sales. The information provided byMapInfo through each stage of theTarget Marketing Cycle can arm
both your real estate and marketingdepartments with the insight they need to support a variety of activities.This includes new store openings,building awareness in a new or existing market, supporting new product introductions, acquiring new customers through strategic targeting and helping to retain existing customers through consistentand repeated communications.
The last step in the cycle is to evaluateyour performance every quarter orevery year to make sure you are meeting your strategic and tacticalgoals. MapInfo can partner with yourbusiness to help anticipate changes inexisting markets and help your retailor financial concept evolve and growto new and undiscovered heights.
Paul Thompson is a Client Manager for MapInfo Corporation.
By Ian Mosley and Tom Exter
The power of culture is its ability to unite a people around a common set of valuesand attitudes. Yet, like all contemporaryurban societies, cosmopolitan Japan faces a global influence that can speed up the rate of change in people’s lives and challenge the common threads of culture. Capturing that change anddescribing emerging social “categories” is a forte of MapInfo’s new PSYTEAdvantage technology.
At the request of a MapInfo partner inJapan, MapInfo corporate researchersrecently applied PSYTE Advantage technology to create a prototype clustersystem for Japan. The test was significantgiven the subtleties and nuances ofJapanese society, which is generally perceived to be ethnically and culturallyhomogeneous.
One underlying principle of geodemo-graphic clustering is that, at some level, neighborhoods “capture” similar individuals, even if every individual is fundamentally different. Such factors as age, family structure, educationalattainment, occupational preferences and, of course, location can combine in countless ways to create clusters. The key is to find the optimal combinationthat makes sense to a wide audience and provides the marketing communitywith a practical advantage.
Clustering a different country is both statistically and perceptually challenging.The researcher must comprehend the “foreign” data sources and come to terms with a new social-geography. As an outside observer, the researchermust take special care to recognize any potential biases that may artificiallyaffect the process.
Fortunately, the initial development of the PSYTE Advantage system for theUnited States involved establishing scientific criteria for success— accuracyand reliability—a methodology thatrequired much less “art” than has historically been part of geodemographicefforts. The PSYTE Advantage system was created to provide objective solutionsgiven any proper set of data. This systemwas directly leveraged to create thePSYTE Japan prototype.
continued on page 15
The Clustering of Japan
viewpoint: ASIA-PACIFICIf imaging is done correctly, your business will successfully
reach your target audience and the end result will be
increased sales.
that ADT Security Systems is armedwith MapInfo? ADT uses MapInfoProfessional® to pre-determine thenumber of technicians they’ll need as a result of an acquisition, saving themfrom over-staffing and consequentlyoverpaying in salaries.
did you know…
Leveraging the Target Marketing Cycle to Grow and Strengthen Your Businesscontinued

PSYTE Finds Where the GasGuzzlers Roam and Who is Behind the Wheel
An analysis of PSYTE clusters,MapInfo’s leading demographic data,shows that some neighborhoods arefeeling a big pinch from soaring gasprices because of the automobiles they drive.
Up-country environs
Families
Non-metro areas
Western United States (California,Colorado, parts of Arizona)
Typical cars: Ford Explorer, GMC Yukon,Isuzu Rodeo.
Since none of these SUV’s can delivereven close to 20 miles per gallon onthe highway, this cluster’s dual incomeis invaluable when paying at the pump.
Tuxedo trails
Activities include boating, fine dining and country clubs
High income
Most live in Upstate New York and“upstate” Minnesota, Oregon andWashington
Typical cars: Cadillac, GMC Yukon,Mercedes Benz CLK
Farm and factory
Family-oriented farming communities
Midwest and Northeast dairy belts
Significant manufacturing presence
Typical cars: Chevy Silverado, Ford Bronco,Pontiac Grand Prix
For the Young-at-Heart, PSYTEHelps Find Summer Fun atAmusement Parks
Last summer, during the peak seasonfor visiting amusement parks, theMapInfo Predictive Analytics teamuncovered some interesting demo-graphic facts and trends related to theparks and their visitors.
America’s everyman and woman
In 2002, more than 300 million people amusement parks, taking in more than
1.5 billion rides
Everyone loves the amusement
Cities and suburbs
The top five metropolitan areas withthe highest population of people whoare likely to have visited an amusement
park this year: San Francisco, Los Angeles, Denver, Houston andWashington D.C.
Most people who visit amusementparks are from right outside the city in suburban neighborhoods
It’s a small, small world
Most popular amusement park is Disney World
Second most popular park is Disneyland
People visit not only Magic Kingdom butUniversal Studios and SeaWorld
Taking a break from the spinning teacups
Typical amusement park visitors like to spend time watching golf and baseball on TV, shopping for bargains,attending movies and purchasing lottery tickets
MapInfo Identifies Where College Graduates Live and What Jobs Attract Them
In a study of residents with bachelor’sdegrees, MapInfo uncovered interestingdemographic trends about the country’s top metropolitan areas.
in the news
M A P I N F O M A G A Z I N E
www.mapinfo.com/magazine
14
PSYTE Clusters and Target MarketingPSYTE U.S. ADVANTAGE ENABLES MARKETERS TO IDENTIFY AND TARGET THEIR CUSTOMERS MORE ACCURATELY. THE SOLUTION
INTEGRATES MORE THAN 250 DEMOGRAPHIC AND CONSUMER BEHAVIORAL VARIABLES—SIGNIFICANTLY MORE THAN ANY OTHER
SEGMENTATION SYSTEM—FROM A MYRIAD OF DATA-RICH INPUT SOURCES. THROUGH THIS DATA, PSYTE USERS CAN PINPOINT TARGET
CUSTOMERS AND MARKETS VIA 72 MUTUALLY EXCLUSIVE NEIGHBORHOOD TYPES, OR “CLUSTERS.” THESE CLUSTERS CAN BE USED
TO IDENTIFY NEW POTENTIAL MARKETS OR UNTAPPED AREAS WITHIN EXISTING MARKETS.
IN RECENT MONTHS, MAPINFO DEMOGRAPHERS HAVE UNCOVERED INTERESTING DEMOGRAPHIC INSIGHTS RELATED TO A NUMBER
OF TIMELY TOPICS.

that Royal LePage, a real estate firm,uses PSYTE® profiles to determineappropriate neighborhoods for relocating executives?
did you know…
that IntraWest, a $1 billion ski and golf resort, uses PSYTE® profiles to create “attitude-specific” mailings thathelp generate resort condominium sales and more than 80 million skiervisits per year?
did you know…
Connecticut’s cream of the crop
Highest percentage of affluent individuals
Highest percentage of residents with bachelor’s degrees
Graduates attracted by financial servicesindustries
Includes insurance, finance and real estate(2.2 million residents employed)
From Big Apple to Garden State
Middlesex-Somerset-Hunterdon is the 10th-largest metro area
Industries such as pharmaceuticals attractgraduates seeking white collar jobs awayfrom nearby New York City
Closer to employee’s homes, reducingstressful commutes
Trading in the surfboard for an SUV
California has five of top 10 metros
San Jose and San Francisco have the largest number of college-educated Asians
Typical car is an SUV
Often members of their college alumniassociations
MapInfo Analyzes WhereAmerican Moms Live, Work and Have Children
Using PSYTE, MapInfo demographersidentified Illinois as home to the highest percentage of married womenand California as State with most children under age 19.
Where are the women?
California is home to the greatest numberof women of child-bearing age
Several cities in Virginia (Radford,Williamsburg, Harrisonburg andCharlottesville) rank high in percentage offemales 18-44 and percentage of kids 15-19
Other U.S. cities with the highest count ofwomen: Los Angeles; Cook County,Illinois; Harris County, Texas
Married in Illinois
Illinois has three of the top 10 U.S. counties for married females
More than 76 percent of women inSangamon, Henderson and Williamsoncounties are married
Multi-generational
Hawaii households are more than twice as likely as other U.S. households to bemulti-generational
California households are 50 percent more likely than average households to be multi-generational
Hispanic birth rates
Hispanic women account for 1 in 5 birthsnationwide
Hispanic birth rate has gone from 14.5 percent in 1990 to 20.1 percent in 2001
Where are the kids?
California, New York, Texas and Floridahave the highest population of kids 19 or younger
Los Angeles and New York City have the highest population of kids ages 19 and under
Industry reports indicate that spending byU.S. tweens (8-12) will reach $41 billion in 2005
Well-fed babies
Metropolitan New York tops the list for potential household expenditures onbaby food
Provo-Orem, Utah tops the list for highestgrocery spending on baby food at morethan 30% above the national average
Grocery spending on baby food is $123million more in New York metropolitanarea than in any other metro area
With care not to prejudice the Japan clusters with North American perceptions,the entire data selection process wasdetermined through univariate statisticsand Principle Components Analysis(PCA). Then, following PSYTE Advantage
methodology, atoms were created fromabout 100 base variables, includingJapanese census demographics. Theatoms—an intermediate cluster solu-tion—were created using proprietaryNeural Network pattern recognition software. Finally, the principal componentsof demography, settlement context, consumption and business infrastructurewere “overlaid” to hierarchically group the atoms into 62 clusters.Driven by an established methodology, the PSYTE Japan prototype was executedwithin a few weeks—and without worry of subjective interference. Usingtime-tested scientific principles, MapInforesearchers provided the client with anefficient and realistic cluster system thatuniquely pinpointed several interestingJapanese sociological segments. Japanesesociety may indeed change at a slowerrate than many others, but some of theinsights from this application of PSYTEAdvantage could provide a bullet train to the future.
Ian Mosley is Data Systems R&D Specialistand Tom Exter is Director, Data Developmentfor MapInfo Corporation’s PredictiveAnalytics Group.
viewpoint: Asia-Pacificcontinued
THE KEY IS TO FIND THE OPTIMAL COMBINATION
THAT MAKES SENSE TO A WIDE AUDIENCE AND
PROVIDES THE MARKETING COMMUNITY WITH A
PRACTICAL ADVANTAGE.
M A P I N F O M A G A Z I N E
www.mapinfo.com/magazine
15
in the newscontinued

M A P I N F O M A G A Z I N E
www.mapinfo.com/magazine
16
By digging deeper, more informationcan be extracted from your databaseby focusing on targeted subsets of yourcustomers or by using sales informationto weight each individual.
Basic Segmentation functionalityallows users to create profiles of theircustomers (counts of customers bycluster) and usually allows for anassignment of a base profile. A baseprofile can be thought of as an out of profile. For instance, you have 140customers from the “Life’s a Peach”cluster, out of a possible 482 “Life’s aPeachers” defined by your trade area.
This is a great setting in which to begin understanding your customers. It is easy to determine both the highly represented clusters and the highly penetrated clusters, i.e., those clusterswhere the ratio of customers to basecounts is high. Users can calculate market potential in new areas for direc-tion in site location and correlate theircustomer profiles against syndicatedsurveys to identify behavioral prefer-ences for marketing campaign design.
For the next level of segmentationanalysis, you can isolate a particularsubset of your customers. TargetGroups are one means to accomplishthis task, while another is through a filter. Using a filter, the analyst identifies the criteria that a 4recordmust satisfy in order to be included inthe profile. This might include informa-tion like “The customer must reside inAlabama” or “The user spent between$100 and $500 in our stores.” Thissubset of your customers provides amore focused look at a specific group.
Weighting of ProfilesPSYTE ADVANTAGE PROVIDES USERS WITH UNPARALLELED INSIGHT INTO CUSTOMER DATABASES. KNOWING WHICH CUSTOMERS
PURCHASE PARTICULAR PRODUCTS OR RESPOND TO PARTICULAR ADVERTISING CAMPAIGNS IS INVALUABLE INFORMATION THAT CAN
HELP YOUR ORGANIZATION DEVELOP MARKETING CAMPAIGNS OR LOCATE NEW SITES.
tech tipsby Steve Bourgault
FIGURE 1
Finally, if sales information is includedwithin your customer database, youmight want to use this information to weight your profile. For example,you might have a high count of customers from “Cruisin’ Couples”and also a 90% penetration. Thissounds like an ideal target to look forgrowth opportunities, but it might bethat these customers only spend anaverage of $20 in your stores. Whenyou examine the “New Neighbors,”they have a lower count of customersand a reasonable penetration rate of30%, but a much higher than average
spending threshold of $1,500 in yourstore. Perhaps your marketing or sitelocation campaign takes a differentturn with this information, as youmight focus on quality of customer (in terms of dollars) rather than purecustomer volume.
It’s easy to add this capability to youranalysis using the PSYTE AdvantageClusters in TargetPro 4.6. On the nextpage, we outline the necessary steps tocreate filtered and weighted profiles,along with a way to gain insight intonew markets and compare monetary profiles against behavioral information.

that MapInfo’s ‘Out of PSYTE’ social trend press release on education hit the June issue of mainstream publication Women’s Wear Daily? Our data identified the top 10 metropolitan areas with the highestpercentage of bachelor’s degrees.
did you know…
M A P I N F O M A G A Z I N E
www.mapinfo.com/magazine
17
First, use TargetPro’s Data Manager to import your record file and (a) create a profile and register a PSYTEAdvantage Code and (b) register anyvariables that you wish to use foreither weighting or filtering. In ourcase, we will filter on state code andcreate a weighted profile based uponsales information, so we will register the data appropriately.
To create the filtered profile, go toProfile Manager and click on theFilter/Weight Profiles button. You willbe presented a list of point files thatyou have registered with TargetProthat have been PSYTE Coded. Choosethe appropriate file and click Next. (figure 1)
The next step is to establish the filtering criteria. For our example, we will filter based upon our state code and only select customers fromCalifornia. To add additional criteriato the filtering process, we could simply click on “+”. Logical and/oroptions are available. (figure 2)
Moving to the next screen, we have the opportunity to create a weightedprofile. A list of registered numericfields is displayed. In our case, we willselect our sales information. (You canselect as many as you like.) Click Next.
We now have an opportunity to review our choices. TargetPro will provide default names for our profilesthat indicate the dataset, filter criteriaand weight used. You can overridethese names by typing new ones at thistime. (You can also rename profileslater through Profile Manager if youchoose.) (figure 4 & 5)
Now that the process of creating theprofiles is complete, we will view a few reports that take advantage of theinformation. First, we will examine the Consumption Detail Report for our Sales Profile. This will provide us information regarding the count of customers from each cluster, alongwith the sales weight (consumption).(figure 6)
A second report that details potentialin new areas—in terms of both cus-tomers and dollar amounts based onthe profiles generated—can also berun. It is desirable to look for areas of high volume and high customercounts. (figure 7 & 8)
Finally, we can run a correlation reportthat compares our sales-weighted pro-file to a variety of media preferences so we can learn how best to reach ourmost profitable customers. (figure 9)
Steve Bourgault is a Product Manager forMapInfo Corporation.
FIGURE 2
FIGURE 4
FIGURE 5
FIGURE 6
FIGURE 3
FIGURE 9
FIGURE 8
FIGURE 8
Tech Tips: Weighting of Profilescontinued

user groupsMapInfo offers a variety of online and regional user groups.
MapInfo
ASIA PACIFIC
Asia Pacific User GroupKristy Bryan and Hanna LundgrenMapInfo Corporation+61.2.8925.7323Email: [email protected]
CANADA
British ColumbiaVancouver User GroupArnaud Granoux604.888.2079E-mail: [email protected]
Montreal User GroupGuillaume GenestConsortech Inc.888.276.0543E-mail: [email protected]
Ottawa User GroupChris BradleyConsortech, Inc.613.224.3050E-mail: [email protected]
Quebec User GroupLouis RobinConsortech, Inc.888.276.0543E-mail: [email protected]
Vancouver User GroupDavid Spira604.697.8198E-mail: [email protected]
EMEA (EUROPE,
MIDDLE EAST, AFRICA)
Denmark User GroupOle Gregor+45.8662.3300
MapInfo User Group Meeting–SwedenMatthew SpencerE-mail: [email protected]
Russian User Group (Moscow)Alexei Prossianov+7.095.241.5732E-mail: [email protected]
Russian User Group (St. Petersbourg)Mr. Alexey M. Pokrovsky+7.812.242.2574E-mail: [email protected]
South Africa MapInfo User GroupHentie ViviersAfricon02711.394.6436E-mail: [email protected]
Swedish User GroupTommy Sahlsten+46 31 7690665E-mail: [email protected]
UK and Ireland User GroupJac CartwrightPortsmouth City Council+44 (0) 23 9283 4255E-mail:[email protected]
Ukrainian User GroupAlexander Dyshlyk or Maxim KalytaRDC “Geomatica”+380 44 5587507E-mail: [email protected]
LATIN AMERICA
There are currently no user groups for this region.
UNITED STATES
CaliforniaSacramento User GroupTracy WalkletTerraNOVA925.299.6833E-mail: [email protected]
San Francisco/San Jose User GroupTracy WalkletTerraNOVA925.299.6833E-mail: [email protected]
ColoradoRocky Mountain User GroupGuy LarsonPrimus Geographics, Inc.720.200.4488 x102E-mail: [email protected]
ConnecticutConnecticut User GroupBen HirschMapInfo Corporation518.285.7109E-mail: [email protected]
District of ColumbiaWashington, D.C. Metropolitan
User GroupErin RubioSpatial Insights, Inc.703.891.1008E-mail: [email protected]
FloridaFlorida User GroupKen TozierInternational Computer Works813.988.0434E-mail: [email protected]
IllinoisChicago User GroupAlex MachinisEmpower Geographics, Inc.847.299.6952E-mail: [email protected]
LouisianaSouth Louisiana User GroupJennifer A. MontanoMapInfo Corporation512.630.5702E-mail: [email protected]
MassachusettsBoston User GroupMapInfo Corporation518.285.6000E-mail: [email protected]
MinnesotaMinneapolis User GroupChuck CollinsNuComm612.591.0820E-mail: [email protected]
North CarolinaCarolinas User GroupJim HenryJCH GeoInfo Solutions, Inc.919.493.9339E-mail: [email protected]
New YorkNew York Capital District User GroupPaul CulliganMapInfo Corporation518.285.7220E-mail: [email protected]
New York City (Metro) User GroupCarole SteppTeqnical Services, Inc.866.874.6277E-mail: [email protected]
OhioCleveland User GroupBob SullivanRSC MAnagement Group, Inc.330.929.1353E-mail: [email protected]
Columbus User GroupBob SullivanRCS Management Group, Inc.800.897.9807
OklahomaTulsa User GroupJeff DavisIntelleVue918.250.5561E-mail: [email protected]
OregonPortland User GroupJohn C. LoweJohn C. Lowe & Associates, Inc.503.761.6832E-mail: [email protected]
PennsylvaniaPhiladelphia and Pittsburgh
User GroupsMapInfo Corporation518.285.6000E-mail: [email protected]
TennesseeEast Tennessee User GroupReid GryderBonjour865.220.9531E-mail: [email protected]
TexasArkla-Tex User GroupJerry HowardMicro Applications CorporationE-mail: [email protected]
Austin User GroupJennifer A. MontanoMapInfo Corporation518.630.5702E-mail: [email protected]
Houston User GroupJennifer A. MontanoMapInfo Corporation512.630.5702E-mail: [email protected]
San Antonio User GroupJennifer A. MontanoMapInfo Corporation512.630.5702E-mail: [email protected]
WashingtonSeattle User GroupJohn SchlosserSchlosser Geographic Systems, Inc.206.224.0800E-mail: [email protected]
M A P I N F O M A G A Z I N E
www.mapinfo.com/magazine
18
Online User Groups: These educational forums provide tips and tricks, product news, customer stories and more. These meetings are hostedfrom the United States and are open to all licensed MapInfo customers in all regions. For more information —or to get on a group mailinglist—send an email to the appropriate address below:
• MapInfo Professional Online User Group (MIPUG) [email protected]• Government Online User Group [email protected]• Predictive Analytics Online User Group [email protected]
Regional User Groups: Business leaders in the U.S. and around the world are gathering to talk about how they are making MapInfo toolswork for them. Join your local MapInfo user group — or start one of your own — and learn valuable technical tips; share knowledge aboutapplications, data, and services; and meet other leading professionals from a wide range of fields.
To join an existing group in your area, please contact a group leader from the list below. For information on starting a new group in the United States, call 518.285.7312 or send an email to [email protected]. For additional information, go to http://mapinfo.com/support/user_groups/index.cfm.

/ M A P I N F O M A G A Z I N E
www.mapinfo.com/magazine
19
By Chris Michels, Chuck Drummond and Alan Beery
What can the experiences of the world’sleading retailers teach banks and otherfinancial institutions about branch networkoptimization? “Plenty,” says ChuckDrummond, director of sales for MapInfoFinancial Services team. “Historically, it has been the major store and restaurantchains who have led the way in effectivesite selection and market optimization. They can’t afford not to—competition in theretailing world is as fierce as it gets.”
Banks, on the other hand, have traditionallyinvested less in high-end optimization studies. “Even today,” Drummond says,“many banks select markets and sites moreby gut feel than scientific analysis.”
Yet, as Drummond notes, the competitivebanking environment is changing rapidly and the most progressive banks are actingincreasingly from a retail-like perspective.“Recently more than one banking executivehas told us, practically in these words:‘We’ve got to stop thinking like a traditionalbank. We have to think like retailers whenwe formulate our branching strategies.’”
Today, leading banks including BankNationale, Chase, CIBC, Desjardins, Fleet Bank, Scotia Bank, Wachovia/First Union, Royal Bank, TD-Canada Trustand Wells Fargo are turning to MapInfo for sophisticated location, customer andmarket research. They have applied MapInfo solutions to answer business-critical questions such as these:
• Where and how should we expand our current branch network?
• What type of branch concept and productoffering is most appropriate for this market?
• How do we identify and react to gaps in the present branch and ATM network?
• What level of cannibalization can weexpect from a new branch deployment?
• What projected balance levels, by product, can be expected at each proposed new branch?
• What types of customers are drawn tovarying branch types, and what products are they purchasing?
CUSTOM SOLUTIONS
Bank network planners especially appreciateMapInfo’s customized research approach,according to Alan Beery, MapInfo manager of analytics. “It’s not a ‘one size fits all’ system,” he says. “We don’t settle for off-the-shelf assumptions and limited modelingtechniques.”
Instead, MapInfo looks deep into the bank’s business. “We combine the latestmarket data with the bank’s own customertransaction data, then add our superior modeling and unmatched experience,”Beery says. “The result is an end-to-endstrategic branching solution customized to the bank’s specific needs and long-termrevenue objectives.”
MapInfo is able to utilize geodemographicdata from its own catalogue, in addition to a financial institutions proprietary customerand market data, in the application ofadvanced models to solve complex location,product mix and target marketing challenges.For example, when a bank, brokerage orinsurance agency network maintains multiplebranches in diverse communities, it becomescrucial to obtain an intimate understanding of the consumers in those communities inorder to offer the most locally appropriatemix of products and services. MapInfo’sPSYTE U.S. Advantage cluster segmentationdelivers this level of understanding, improv-ing customer acquisition and retention by enabling these organizations to focus, for example, on no-minimum checkingaccounts in college neighborhoods or whole-life insurance in affluent suburbs.
PSYTE U.S. Advantage also helps financialinstitutions locate the clusters of customerscontaining high numbers of preferredaccount holders and pursue similar new customers in those markets. It allows them to identify best practices by compar-ing how branches serve the same clusters in different neighborhoods. It suggests themost profitable combinations of services to offer new customers based on successfulcross-sales to existing customers. Finally,PSYTE U.S. Advantage enables financial service firms to make decisions based on aggregate consumer information ratherthan on groups of individual financialrecords, thereby enhancing and protectingcustomer privacy.
I N D U S T R Y F O C U S :
FINANCIAL SERVICES
Banks learning to “think like retailers”
Optimization Solutions for Financial Institutions
This handy guide is now available fromMapInfo. It concisely outlines our analyses,models, software and research offerings in these areas:
MARKET & SITE INTELLIGENCE
• Identify high-growth markets and high-potential locations
• Predict customer retention and cannibalization
• Decide whether to retain, relocate or close branches and ATMs
CUSTOMER & PRODUCT STRATEGIES
• Match customer segments to productlines for profitability
• Profile high-value/high-risk customers for retention
• Measure customers’ awareness, perceptions and preferences
Call 734.302.9300 for your free copy of the guide. Or download a PDF atwww.mapinfo.com/financial/optimizationguide.
Chris Michels is MapInfo Corporation’sProduct Manager, Geodemographic Data.Chuck Drummond is MapInfo Corporation’sDirector of Sales and Alan Beery is MapInfoCorporation’s Client Manager.
“What if…?” With insight from MapInfo models, bankmanagement can quickly identify the best new marketsand branch locations. They also gain intelligence on market segments, market share and other key measures—all in support of critical business decisions.

Corporate Headquarters/Americas
One Global ViewTroy, New York 12180-8399 USA
main: +1.518.285.6000+1.800.327.8627
fax: +1.518.285.6070
Asia-Pacific /Australia
main: +61.2.9437.6255fax: +61.2.9439.1773
Canada
main: +1.416.594.5200+1.800.268.3282
fax: +416.594.5201
Europe / United Kingdom
main: +44.1753.848.200fax: +44.1753.621.1401
2004 MapInfo Corporation. All Rights Reserved. MapInfo, the MapInfo Meridian logo, MapInfo Professional, AnySite, TargetPro, PSYTE and MarketMath are trademarks or registered trademarks of MapInfo Corporation and/or its affiliates. 85075 1/04
www.mapinfo.com