map showing the association of linear … · department of the interior u.s. geological survey to...
TRANSCRIPT

DEPARTMENT OF THE INTERIOR U.S. GEOLOGICAL SURVEY
TO ACCOMPANY MAP I-2050-B
MAP SHOWING THE ASSOCIATION OF LINEAR FEATURES WITH METALLIC MINES AND PROSPECTS IN THE BUTTE lox 2° QUADRANGLE, MONTANA
By
L.C. Rowan, C.M. Trautwein, and T.L. Purdy
INTRODUCTION
This study was undertaken as part of the Conterminous U.S. Mineral Assessment Program (CUSMAP). The purpose of the study was to map linear features on Landsat Multispectral Scanner (MSS) images and a proprietary side-looking airborne radar (SLAR) image mosaic and to determine the spatial relationship between these linear features and the locations of metallic mineral occurrE-nces. The results show a close spatial association of linear features with metallic mineral occurrences in parts of the quadrangle, but in other areas the association is less well defined.
Linear features are defined as distinct linear and slightly curvilinear elements mappable on MSS and SLAR images. The features generally represent linear segments of streams, ridges, and terminations of topographic features; however, they may also represent tonal patterns that are related to variations in lithology and vegetation. Most linear features in the Butte quadrangle probably represent underlying structural elements, such as fractures (with and without displacement), dikes, and alignment of fold axes. However, in areas underlain by sedimentary rocks, some of the linear features may reflect bedding traces. This report describes the geologic setting of the Butte quadrangle, the procedures used in mapping and analyzing the linear features, and the results of the study. Relationship of these features to placer and non-metal deposits were not analyzed in this study and are not discussed in this report.
General Geologic Setting and Mineral Occurrences1
The Butte 1 o x 2° quadrangle, in west-central Montana, is one of the most mineralized and productive regions in the United States. Mining districts in the quadrangle, including the worldfamous Butte or Summit Valley district, have produced a variety of metallic and nonmetallic mineral commodities worth more than $6.4 billion. Because of its importance as a mineral-producing region, the Butte quadrangle was selected by the U.S. Geological Survey (USGS) as a CUSMAP. These studies, including geologic mapping, geochemical and geophysical surveys, and geochronologic and remote sensing investigations, were also supported, in part, by funding from the Geologic Framework and Synthesis and Wilderness Programs.
The Butte quadrangle is bounded by latitudes 46° and 47o N. and longitudes 112° and 114° W. The city of Butte is in the southeastern part; Helena, the capital of Montana, is located on the eastern edge; and Missoula is located near the northwestern comer
1This section taken from Elliott and others (1987) with minor modifications.
of the quadrangle. Granite, Powell, Lewis and Clark, and Jefferson Counties occupy most of the quadrangle and Missoula, Ravalli, Deer Lodge, and Silver Bow Counties occupy smaller parts. The quadrangle includes a number of major and minor mountain ranges separated by intermontane valleys. The continental divide trends nearly north-south through the eastern part of the quadrangle to a point near Butte, then trends generally west near the southern boundary of the quadrangle west of Butte. East of the divide, drainages are tributaries of the Missouri River, and west of the divide, drainages are tributaries of the Clark Fork, which heads in the southern part of the Deer Lodge Valley.
Igneous rocks and sedimentary rocks and deposits range in age from Proterozoic to Quaternary in the Butte quadrangle. Sedimentary rocks of Middle Proterozoic, Paleozoic, and Mesozoic age are widespread, and Cretaceous and Tertiary plutonic rocks form the cores of most mountain ranges. Intermontane basins are filled by Tertiary and Quaternary sedimentary rocks and deposits. Volcanic and volcaniclastic rocks of Cretaceous and Tertiary ages occur on the flanks of most mountain ranges and in valleys of the eastern and northern parts of the quadrangle.
The oldest sedimentary rocks were deposited during Middle Proterozoic time when the Belt basin occupied the area of the Butte quadrangle; about 16,000 m of clastic and carbonate rocks of the Belt Supergroup occur in the quadrangle as a result of this deposition. Mafic dikes and sills were intruded into Middle Proterozoic sedimentary rocks, probably during Late Proterozoic time. Paleozoic time was dominated by periodic incursion of near-shore and shallow-water deposits that formed carbonate and carbonatebearing clastic rocks that reached a total thickness of about 2,400 m; the resulting rocks occur mainly in the north, central, and northeastern parts of the quadrangle. Mesozoic sedimentary rocks were deposited in a foreland basin that accumulated about 6, 700 m of clastic and carbonate strata in the central part of the quadrangle, and about 2,400 m of clastic and carbonate strata in the northeastern part of the quadrangle.
In the quadrangle, numerous stocks and several batholiths were emplaced at mesozonal and epizonal depths during the widespread plutonism of Late Cretaceous time. The Boulder, Idaho, Sapphire, and Philipsburg batholiths, composed of monzogranite and granodiorite, and numerous diorite, granodiorite, and monzogranite stocks were intruded during the Late Cretaceous. Hydrothermal activity occurred during and following the waning stages of magmatism, forming a variety of mesothermal and epithermal mineral deposits in the quadrangle. The Elkhorn Mountains Volcanics, of Late Cretaceous age, forms roof pendants in the Boulder batholith and borders the margins of the Boulder batholith; these volcanic

rocks probably represent early extrusive phases of the magma that later formed the Boulder batholith.
During Tertiary time, volcanism and sedimentation formed extensive deposits in intermontane valleys. Extensive volcanism during early and middle Tertiary time formed the Lowland Creek Volcanics, and formed volcanic fields in the Gamet Range, in the area east of Lincoln, and in the northeastern part of the Boulder Mountains. Lake, marsh, and terrestrial deposits accumulated in intermontane valleys during mid- to late-Tertiary time. During late Tertiary time, extensive pediments formed, and gravels, some of which contain valuable placer deposits of gold, were deposited on pediment surfaces.
Quaternary time was dominated by glacial events that resulted in extensive alpine glaciation in most of the ranges in the quadrangle; icecaps occupied areas of high elevation in the Hint Creek and Anaconda Ranges and the Boulder Mountains. Four glacial events have been identified in the Flint Creek Range and multiple glacial events probably occurred in the other ranges. A series of glacial lakes formed during the last glacial event in the northeastern and western parts of the quadrangle. Post-glacial events were dominated by erosion and alluvial deposition in modem stream channels.
The principal structural elements of the Butte quadrangle are the Sapphire and Rattlesnake thrust plates, the southern end of the Montana disturbed belt, and strike-slip faults of the Lewis and Clark line. The Sapphire thrust plate, which consists of flat thrust sheets that were later folded, and a border of imbricate thrust faults occupies much of the western and central parts of the quadrangle. The Rattlesnake thrust plate, in the northwestern part of the quadrangle, consists of widely spaced northwest-trending imbricate thrust faults. The Montana disturbed belt extends into the northeastern part of the quadrangle where the widely spaced thrust faults abut steeper strike-slip faults of the Lewis and Clark line. The Lewis and Clark line consists of a broad zone of east-southeast- to southeast-trending strike-slip and dip-slip faults that extend across the west-central and northeastern parts of the quadrangle. Although steep faults of the Lewis and Clark line may have originated during Proterozoic time during deposition of the Belt rocks, most faulting and folding occurred during late Mesozoic time, during a period of widespread compressional events that formed a regional foreland basin while thrust plates moved generally from west to east. Most of the pre-Tertiary sedimentary rocks in the quadrangle have been moved to their present positions by thrust and strike-slip faults. The most intense deformation occurred during Late Cretaceous time when laterally extensive thrust faults, zones of imbricate thrusts, and common tight and overturned folds were formed. Most of the Late Cretaceous magmatism postdates the thrust and strike-slip faulting; thus, the faulted terrane was welded into a substantial buttress that resisted continued compression. During early Tertiary time most of the present mountain ranges and drainage systems were formed by erosion and by normal faulting along some ranges. Some normal faulting continued into Middle Tertiary time along the eastern side of Deer Lodge Valley and north of Elliston. Minor Quaternary faulting may be related to continued activity along some normal faults and along some strike-slip faults of the Lewis and Clark line.
The Butte quadrangle has had a long, productive, and colorful mining history and has produced a variety of metallic and nonmetallic mineral commodities. The most important mining district, the Butte or Summit Valley, is one of the richest and most productive mining districts in the world; the value of metals produced from this district alone (more than $6 billion) is far greater than the
2
combined total (about $400 million) of the rest of the quadrangle. The two most important types of deposits that have been mined in the quadrangle are hydrothermal vein and replacement deposits of base and precious metals and placer gold deposits. Other important deposit types are porphyry and stockwork copper and molybdenum; skarn gold, copper, silver, and tungsten; vein and replacement manganese, tungsten, barite, and fluorite; and strata-bound phosphate deposits.
Copper is the most important commodity produced from the quadrangle, mainly from the Butte district. This district has also been an important producer of silver, zinc, manganese, lead, gold, cadmium, bismuth, molybdenum, selenium, tellurium, and sulfuric acid. Many other districts in the quadrangle have also been important producers of gold, silver, lead, zinc, and copper. The Philipsburg district was a leading producer of manganese, as well as an important producer of precious and base metals.
Mineral deposits and occurrences of many types and ages occur within the Butte quadrangle. The oldest mineral occurrences of potential economic significance are strata-bound copper and silver minerals in sedimentary units of the Belt Supergroup of Middle Proterozoic age. Some of these, such as those in quartzite of the Mount Shields Formation, are similar to deposits at Troy, in northwestern Montana, that are presently being mined. The most important period of geologic time for the formation of ore deposits in the quadrangle was the Late Cretaceous, when most of the productive hydrothermal vein and replacement deposits were formed. These are temporally and spatially related to plutonic rocks of Late Cretaceous age. Other types of hydrothermal deposits, such as porphyry-stockwork and skarn deposits, also formed during the Late Cretaceous. Some hydrothermal deposits, however, occurred later and are related to Eocene volcanism. A notable example is the Montana Tunnels mine (Elliott and others, 1987), a large low-grade diatreme-hosted gold-silver deposit that is related to the Lowland Creek Volcanics.
Linear features were mapped by Rowan on ~pproximately 1:300,000-scale, contrast-enhanced Landsat MSS band 5 (0.6-0. 7 micrometers) and band 7 (0.8-1.1 micrometers) images and on a 1:250,000-scale MSS color-infrared composite image. The MSS scene (no. 2553-27331) was recorded July 28, 1976. Rowan and Purdy mapped linear features on the 1:250,000-scale SLAR image mosaic; only those features not mapped on the MSS images were mapped on the SLAR mosaic to eliminate redundant data. The SLAR data were recorded during December 1979 with X-band frequency (2.4-3.8 em), 20-45 degree depression angle, and westward illumination. Because of the low depression angle, some linear features are obscured by extensive shadows on west-facing slopes in high-relief areas. Shadows occur on northwest-facing slopes in the MSS images, but they obscured fewer linear features than SLAR images. Interpretation of illuminated areas on the SLAR mosaic provided information not available in the MSS images because the 10-meter resolution of the SLAR image is substantially higher than the 79-meter resolution of • the MSS images. In addition, use of the SLAR mosaic helped alleviate the sun angle (solar elevation and azimuth) bias that has been noted in MSS linear feature data (Rowan and Purdy, 1984, 1985). To facilitate further analysis, linear and curvilinear features were digitized, and most of the analysis was done on the combined set of linear features mapped on the MSS and SLAR images.
ANALYSIS OF LINEAR FEATURES
Methods of analyzing linear features mapped in satellite and airborne images may be placed into two general categories: visual

and digital. The visual method has been used by many workers because the human pattern-recognition ability permits rapid and inexpensive delineation of conspicuous lineaments (O'Leary and others, 1976), circular and oval features, and areal density variations. For example, in the MSS and SLAR linear features map of the Butte quadrangle the lineaments located at A-A', B-B', and C-C', as well as others, can be delineated readily; likewise, areas of high and low areal density are evident. However, the patternrecognition ability of analysts is variable, especially for subtle features. Consequently, the visual method is subjective and the results are difficult to reproduce. Digital methods of linear feature analysis are used because they permit quantitative analysis that yields objective, reproducible results. The principal attributes of linear features-orientation, length, and distribution-can be analyzed numerically, either individually or in groups of features. However, these methods are more expensive than visual methods because digitizing and computer facilities are required. Digital, rather than visual, methods are used in this study to evaluate the spatial association of linear features and metallic mineral occurrences.
Most digital methods use strike-frequency analysis to identify statistically significant azimuth ranges of linear features (Raines, 1978; Sawatzky and Raines, 1981; Knepper, 1983; Rowan and Purdy, 1984, 1985; Marrs and Raines, 1984). Two factors that have important effects on most strike-frequency analyses are (1) biased sampling of the linear feature population, and (2) structural complexity that results in highly variable strike-frequency distributions within the study area. A third factor that is relevant to mineral assessment studies is the spatial relationship between mineral occurrences and linear features with respect to strike-frequency.
In scanner images, such as MSS and SLAR products, the most important sources of bias that effect linear feature strike-frequency distribution are illumination direction, scan-line direction, and spatial resolution. In MSS strike-frequency plots, low frequencies occur commonly at and near the solar illumination direction, even where prominent regional faults are colinear with this direction, whereas high frequencies occur in the approximately orthogonal direction (Rowan and Purdy, 1984, 1985). The Butte MSS linear features strike-frequency plot exhibits minima at N. 1 o E., N. 59° W., and N. 32° W., and a broad maximum at N. 37° E. (fig. 1A); the solar azimuth of the scene used is N. 57o W. The frequencies of linear features in MSS images that generally parallel the solar illumination direction are depressed because of the lack of topographic shading; conversely, the frequency of orthogonally oriented linear features is enhanced.
The SLAR linear features strike-frequency plot of the Butte quadrangle (fig. 1B) is bimodal with maxima at N. 43° W. and N. 52° E. and is probably due to illumination and topographic conditions. The east-west minimum is coincident with the SLAR illumination direction, and the broad low centered at N. 2° W. is attributed to obscuration of linear features in extensive shadows in the SLAR mosaic. The geographic distribution of shadows within the mosaic is variable, but they are extensive in the Flint Creek and Anaconda Ranges due to steep topography.
Scan lines may obscure linear features where they coincide because linear features and scan lines cannot be distinguished. The east-west scan-line direction of the SLAR system may contribute to the east-west minimum in the strike-frequency plot (fig. 1B). The N. 79o W. MSS scan-line orientation is nearly coincident with a locally low frequency interval in the MSS strike-frequency plot (fig. 1A).
3
Spatial resolution causes biased sampling where linear features are below the resolution of the images analyzed. Analysis of the linear features in the Butte quadrangle suggests that some narrow, but important, east-west-trending linear features were not mapped because of the 79-meter resolution limit of the MSS system and the westerly illumination of the SLAR system.
Inadequate sampling of the linear feature population because of illumination conditions, scan-line orientation, and spatial resolution results in a biased data set. However, by combining the MSS and SLAR linear features, the east-west minimum observed in the SLAR linear features strike-frequency plot is eliminated (fig. 1C). The relatively low frequencies that are still observed near N. 60° W. in the MSS plot (figs. 1A and 1C) may be representative of the actual distribution of linear features or due to undersampling of the population because of sampling bias. Because the linear features data are biased, we developed a method to analyze the spatial relation of linear features to metallic mineral occurrences that evaluates all classes of linear feature orientations, regardless of relative frequencies. Although the higher spatial resolution of the SLAR image mosaic results in incorporating shorter and narrower linear features than are in the MSS linear feature data set, length and width of features are not analyzed in this study. This method does not compensate for biased sampling, but it avoids exclusion of important trends of low frequency. The combined MSS and SLAR linear features are analyzed throughout the remainder of this study.
Definition of Geologic Domains
Geologic domains were defined within the quadrangle because comparison of the spatial distribution of linear features to that of metallic mineral occurrences exhibited considerable variation in the spatial association of linear features with metallic mineral occurrences. For example, within and to the north of the Frog Pond Basin district in the southwestern part of the quadrangle, northeasttrending linear features form lineament A-A' within which most of the mines and prospects occur, but in the Big Foot district in the southeastern part, east-northeast-trending features are spatially associated with the mines and prospects along lineament D-D'. In the Scratchgravel Hills mining area near the northeastern margin of the quadrangle, north-northwest-trending linear features are dominant and the mineral occurrences appear to be spatially associated with these features. These and other variations in the spatial association show that the quadrangle is not homogeneous with respect to the spatial arrangement of linear features and metallic mineral occurrences.
Determining relations of all classes of linear features to metallic mineral occurrences requires separation of domains within which trends of linear features are consistently associated with mineral occurrences. Initially, the quadrangle was divided into six geologic domains (Roman numerals I through VI) and the spatial association within each domain was examined visually. Subsequently, sixteen subdomains were delineated visually on the basis of the spatial association of linear features and metallic mineral occurrences, linear feature trends and density, and geologic factors, including composition and age of rock units, faults, and folds. The principal results of this study were derived from a quantitative analysis of the spatial relationship of all linear features and metallic mineral occurrences within the sixteen subdomains.
Domain I is located north of the Sapphire thrust plate, and the southern boundary is the Bald Butte fault and a line that generally corresponds to Hoffman Gulch. The selection of this part of the boundary, instead of the remainder of the Bald Butte fault, will be

discussed in a subsequent section. This domain consists mainly of Middle Proterozoic and Cretaceous sedimentary rocks that have been intruded by Tertiary and Cretaceous plutons; Tertiary volcanic rocks partially cover these rocks. The density of mapped faults is low relative to most of the quadrangle (Wallace and others, 1986). The southern part of the Montana Disturbed belt is included in the eastern part of the area.
Domain II consists of the Boulder batholith and pre- and post-batholithic volcanic, and volcaniclastic rocks. The boundaries of this domain include the major plutons as well as the majority of the Cretaceous and Tertiary volcanic rocks in the vicinity of the Boulder batholith. The northeast trend of faults in this domain contrasts with dominantly northwest trends in most of the quadrangle.
Domain III coincides with the Deer Lodge Valley near the center of the quadrangle; this area is an intermontane basin filled with Tertiary and Quaternary lake, marsh, and alluvial deposits.
Domain IV includes the Aint Creek and Anaconda Ranges and lies entirely within the Sapphire thrust plate. The western boundary of domain IV generally corresponds to the western limit of Paleozoic and Mesozoic sedimentary rocks. Most of the Paleozoic and Mesozoic sedimentary rocks south and east of the Clark Fork lie within this domain. The northwest-trending faults, which are very prominent to the west of domain IV, are uncommon within domain IV.
Domain V contains most of the Sapphire and John Long Mountains, and it lies entirely within the Sapphire thrust plate. The northern boundary of the area is a northwest-trending normal fault in the southern part of the Mt. Sentinel fault zone that is traced into Boulder Creek in the Flint Creek Range. Domain V corresponds to the thrust-sheet terrane, a structural subdivision of the Sapphire plate that lies to the west of the thrust fault near Philipsburg.
Domain VI is a northwest-trending area that covers the Garnet Range and the northern parts of the Sapphire and John Long Mountains. The north and south borders of this domain parallel the trend of and include the northern edge of the Sapphire thrust plate, and this domain includes the Rattlesnake thrust plate. This domain is bounded on the northeast by the Bald Butte fault and shares common boundaries of domains V and VI. The largest plutons are elongate with northeast trends, in contrast to subcircular outlines of plutons in domain V and generally northwest and northeast patterns of plutons in domain I.
Definition of Subdomains
We divided the six geologic domains into subdomains to examine, at a smaller scale, correspondence between linear features and known deposits. This was done because comparison of the geographic distribution of linear features to metallic mineral occurrences in the domains showed excellent local correspondence (with respect to density), but the degree of correspondence (with respect to trend) is variable. The principal basis for subdividing the domains into subdomains was the spatial relationship between linear features and metallic mineral occurrences. Mineral occurrences are typically clustered, and the degree of apparent spatial association between them and linear features with certain azimuthal trends commonly changes from one cluster to another. Subdomain boundaries were selected to delineate areas with uniform linear feature-mineral occurrence patterns. Location of subdomain boundaries is also based on the areal distribution of linear features and lithologic and structural information shown on the generalized geologic map (Wallace and others, 1986). The
4
analytical procedure used and the criteria established for each of the sixteen subdomains shown on the map are described below.
Analytical Procedure
A computer-based geographic information system (GIS) was used at the EROS Data Center, Sioux Falls, S.D., to quantitatively evaluate spatial relationships between linear features, their intersections, and metallic mineral occurrences within each subdomain of the quadrangle. Initially, each set of variables (linear features, intersections, metallic mineral occurrences, subdomains) was numerically encoded with unique identifiers and transformed into 559 x 775 grid-cell arrays that corresponded to a Transverse Mercator map projection. In this format, any point (intersection or mineral occurrence), line (linear feature), or polygon (subdomain) is stored as is illustrated in figure 2A. Each geographically referenced grid cell of each array represents a 200 m by 200 m area on the ground.
After creation of the data base, the GIS was used to generate a set of proximity maps for linear features in each azimuthal range, and a set of proximity maps for intersections of linear features in different azimuthal ranges. The following azimuthal ranges, which correspond to broad high frequency areas in the strike-frequency plot (fig. 1 C), were selected for analysis in each of the sixteen subdomains: N. 0°-29° E., N.30°-59o E., N. 60°-90° E., N. 0°-29° W., N. 30°-59° W., and N. 60°-89° W.; for convenience, hereafter we have abbreviated these ranges in general terms, such as NNE (N. 0°-29° E.), NE (N. 30°-59° E.), or ENE (N. 60°-90° E.). The proximity maps were coded so that cells containing linear features and intersections had a value of zero and cells surrounding features and intersections had integer values equal to their cell distances from the nearest feature or intersection as is shown in figure 2B.
The GIS was used to determine three statistical parameters from the proximity maps of linear features and intersections within the entire quadrangle and within each of the subdomains: (1) cumulative percentages of metallic mineral occurrences within increasing grid-cell distances from the linear features and intersections; (2) cumulative percentages of area within increasing grid-cell distances from the linear features and intersections; and (3) the ratio of parameters 1 and 2, which is the normalized density of mineral occurrences with respect to their proximity to a feature or intersection. These parameters were determined for features in each azimuthal range and intersection set for grid-cell distances increasing by 0.2 km from 0 (coincident) to 2.0 km. Compilation of cumulative percentages permitted rapid calculation of normalized density within each area described by a specified grid-cell distance. For the quadrangle as a unit, the percentage of metallic mineral occurrences (n=871) that is within the area described by each grid-cell distance was computed by overlaying the occurrence map with each of the linear feature trend and intersection proximity maps. The percentage area covered by the linear feature trends and intersection set was also determined for each grid-cell distance for the entire quadrangle. Cumulative percentage of metallic mineral occurrences and cumulative percentage or area values were used to determined normalized density for each linear feature trend and intersection at increasing grid-cell distances. For example, the area within a 0.8 km proximity of NNW linear features includes 32.8 percent of the metallic mineral occurrences in the quadrangle and is 24.5 percent of the total quadrangle area, which yields a normalized density of 1.34 (see linear feature, quadrangle, subdomain Ia, table 1). Thus, high normalized density indicates a close spatial association because the percentage of occurrences is high relative to the percentage of area within the specified grid-cell
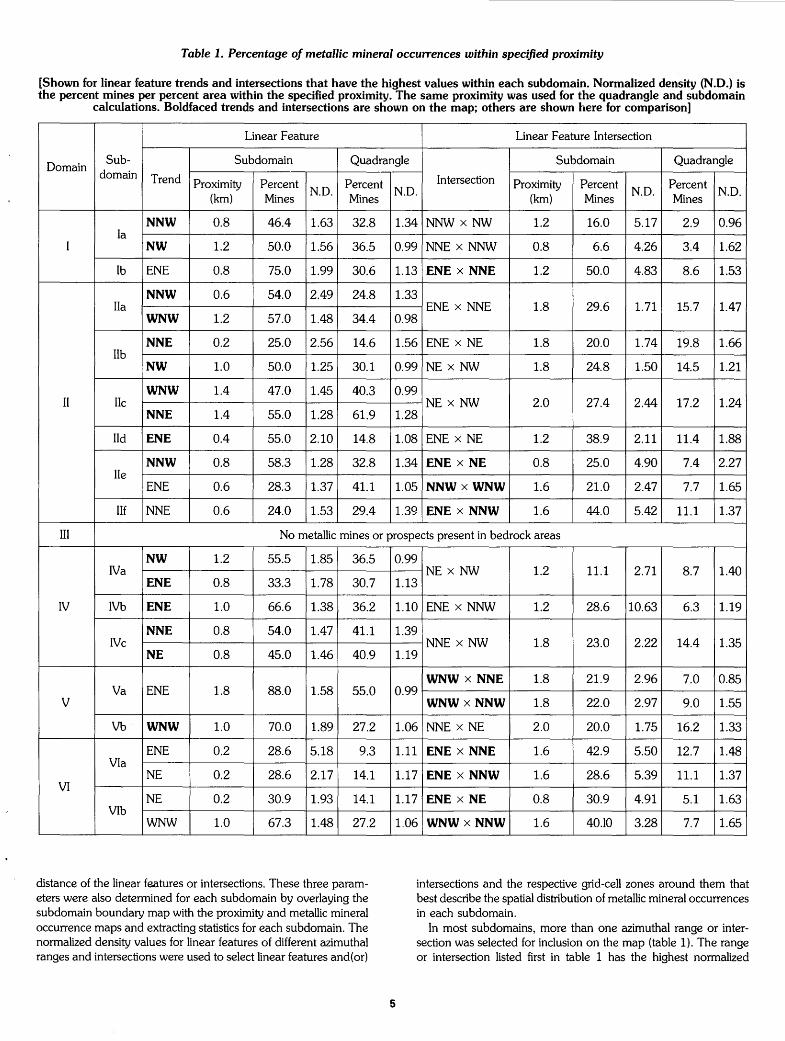
Table 1. Percentage of metallic mineral occurrences within specified proximity
[Shown for linear feature trends and intersections that have the highest values within each subdomain. Normalized density (N.D.) is the percent mines per percent area within the specified proximity. The same proximity was used for the quadrangle and subdomain
calculations. Boldfaced trends and intersections are shown on the map; others are shown here for comparison]
Linear Feature Linear Feature Intersection
Domain Sub- Subdomain Quadrangle Subdomain Quadrangle
domain Trend Intersection Proximity Percent N.D.
Percent N.D.
Proximity Percent N.D.
Percent N.D. (km) Mines Mines (km) Mines Mines
NNW 0.8 46.4 1.63 32.8 1.34 NNW x NW 1.2 16.0 5.17 2.9 0.96 Ia
I NW 1.2 50.0 1.56 36.5 0.99 NNE x NNW 0.8 6.6 4.26 3.4 1.62
Ib ENE 0.8 75.0 1.99 30.6 1.13 ENE x NNE 1.2 50.0 4.83 8.6 1.53
NNW 0.6 54.0 2.49 24.8 1.33 II a ENE x NNE 1.8 29.6 1.71 15.7 1.47
WNW 1.2 57.0 1.48 34.4 0.98
NNE 0.2 25.0 2.56 14.6 1.56 ENE x NE 1.8 20.0 1.74 19.8 1.66 lib
NW 1.0 50.0 1.25 30.1 0.99 NE x NW 1.8 24.8 1.50 14.5 1.21
WNW 1.4 47.0 1.45 40.3 0.99 II lie NE x NW 2.0 27.4 2.44 17.2 1.24
NNE 1.4 55.0 1.28 61.9 1.28
lid ENE 0.4 55.0 2.10 14.8 1.08 ENE x NE 1.2 38.9 2.11 11.4 1.88
NNW 0.8 58.3 1.28 32.8 1.34 ENE x NE 0.8 25.0 4.90 7.4 2.27 lie
ENE 0.6 28.3 1.37 41.1 1.05 NNWxWNW 1.6 21.0 2.47 7.7 1.65
IIf NNE 0.6 24.0 1.53 29.4 1.39 ENE x NNW 1.6 44.0 5.42 11.1 1.37
III No metallic mines or prospects present in bedrock areas
NW 1.2 55.5 1.85 36.5 IVa
ENE 0.8 33.3 1.78 30.7
IV IVb ENE 1.0 66.6 1.38 36.2
NNE 0.8 54.0 1.47 41.1 IVc
NE 0.8 45.0 1.46 40.9
Va ENE 1.8 88.0 1.58 55.0 v
Vb WNW 1.0 70.0 1.89 27.2
ENE 0.2 28.6 5.18 9.3 VIa
NE 0.2 28.6 2.17 14.1 VI
NE 0.2 30.9 1.93 14.1 Vlb
WNW 1.0 67.3 1.48 27.2
distance of the linear features or intersections. These three parameters were also determined for each subdomain by overlaying the subdomain boundary map with the proximity and metallic mineral occurrence maps and extracting statistics for each subdomain. The normalized density values for linear features of different azimuthal ranges and intersections were used to select linear features and( or)
0.99 NE x NW 1.2 11.1 2.71 8.7 1.40
1.13
1.10 ENE x NNW 1.2 28.6 10.63 6.3 1.19
1.39 NNE x NW 1.8 23.0 2.22 14.4 1.35
1.19
WNW x NNE 1.8 21.9 2.96 7.0 0.85 0.99
5
WNWxNNW 1.8 22.0 2.97 9.0 1.55
1.06 NNE x NE 2.0 20.0 1.75 16.2 1.33
1.11 ENE x NNE 1.6 42.9 5.50 12.7 1.48
1.17 ENE x NNW 1.6 28.6 5.39 11.1 1.37
1.17 ENE x NE 0.8 30.9 4.91 5.1 1.63
1.06 WNWxNNW 1.6 40.10 3.28 7.7 1.65
intersections and the respective grid-cell zones around them that best describe the spatial distribution of metallic mineral occurrences in each subdomain.
In most subdomains, more than one azimuthal range or intersection was selected for inclusion on the map (table 1). The range or intersection listed first in table 1 has the highest normalized

density for the subdomain indicated. In some subdomains, additional azimuthal ranges and intersections were selected because they have moderately high normalized densities and describe occurrences that are not in proximity to the azimuthal range or intersection having the highest density.
The percentage of occurrences and normalized densities of linear features in the six azimuthal ranges were evaluated first; linear feature intersections were analyzed subsequently. The percentage of occurrences and normalized density for each trend in each subdomain was compared to values computed for the entire quadrangle using the same grid-cell distances. The main objective was to identify the trends and intersections for each subdomain that have high values relative to the entire quadrangle and are consequently more descriptive of occurrences within the subdomain. In most subdomains, the percentage of occurrences and normalized density of some trends is substantially higher than for the entire quadrangle (table 1). The map shows the selected linear features and intersections with their appropriate grid-cell zone, and table 1lists the percentage of metallic mineral occurrences, grid-cell distance (proximity) and normalized density for each trend and intersection set in the subdomains and the quadrangle. For comparison, values are also listed (table 1) for trends and intersection sets that were considered because of their moderately high spatial association with occurrences, but were not selected for inclusion on the map.
The percentage of metallic mineral occurrences and normalized density were evaluated for the fifteen sets of intersections involving two linear feature trends. Given the same grid-cell distance, intersections inherently occupy a smaller area than linear feature trends. Therefore, cells surrounding an intersection set that contain a few mines generally yield high normalized density values, but a low percentage of encompassed mineral occurrences (table 1). Normalized density and percentage of encompassed occurrences were evaluated together to choose between intersection sets and trends within each subdomain. Comparisons of the normalized density and percentage of occurrences for the six trends and fifteen intersections are facilitated by plotting the differences between subdomain and quadrangle values (fig. 3). For example, in subdomain Ilf, the normalized density and percentage of occurrences for NNE linear features are low (table 1, fig. 3A), and values for intersections of ENE and NNW features are high (table 1, fig. 3B). These plots are divided into three equal ranges of normalized density differences that are used to rate the relative degree of spatial correspondence between linear feature trends (fig. 3A) and linear feature intersection sets (fig. 3B) that are incorporated on the map; linear feature trends and intersection sets listed in table 1 but not shown on the map were not considered in establishing these ranges.
Domain I
Subdomain Ia
Domain I was ~ubdivided into two subdomains because of differences in the areal density of mineral occurrences and linear features, the spatial relationship of the linear features with the metallic mineral occurrences, and the distribution of intrusive rocks. Subdomain Ia has over 90 documented metallic mineral occurrences, primarily near Cretaceous and Tertiary intrusive bodies along a generally northwest-trending oriented belt; in contrast, only four ~etallic mineral occurrences are present in subdomain lb, and the only intrusive bodies are Cretaceous latite and monzogranite and gabbroic sills of Late Proterozoic age.
6
The boundary that separates subdomains Ia and lb corresponds, for most of its length, to the northwest-trending rightlateral strike-slip St. Mary's-Helena Valley fault. East of Lincoln, we drew the boundary so that Tertiary volcanic rocks lie within subdomain Ia. On the west, the boundary between subdomains Ia and Vlb and part of the boundary between subdomains Ia and VIa correspond to the Bald Butte fault. Initially, part of subdomain Ia was included in subdomain VIa with a common boundary along the Bald Butte fault. However, analysis of the linear features indicated similarities between the spatial relationship of the mineral occurrences in the Ophir and Austin districts with those of subdomain Ia. The boundary was modified, therefore, to include these occurrences within subdomain Ia. This area has more geologic similarity to subdomain Ia, such as the occurrence of the Cretaceous intrusive rocks, than to subdomain VIa. The remainder of the southern boundary of subdomain Ia follows the Little Blackfoot River to Elliston and then borders the northern margin of the Boulder batholith, Cretaceous volcanic rocks, and pre-batholithic sedimentary rocks.
Areas within 0.8 km of NNW linear features are most closely associated with the mines and prospects in subdomain Ia, yielding a normalized density of 1.63 (table 1), which is the average for all the linear feature trends shown on the map. These linear features describe 46.4 percent of the metallic mineral occurrences within subdomain Ia, which is also about average (51.4 percent) for trends shown on the map. Coincidence of NNW linear features with occurrences is especially conspicuous in the Scratchgravel Hills area. The differences between the densities and percentages of subdomain Ia and of the entire quadrangle are slightly below the average of the trends (18 percent) incorporated on the map (fig. 3A); the normalized density difference is in the moderate range (fig. 3A.).
Areas within 1.2 km of NW linear features account for 50 percent of the metallic mineral occurrences within subdomain Ia and have a normalized density of 1.56; 20.7 percent of these mines are not described by NNW features. The difference between the subdomain Ia normalized density and the quadrangle density is in the low range; the subdomain and quadrangle percentages of occurrence difference is below the figure 3A average. NNW and NW features are incorporated on the map and constitute the data base for mineral resource assessment using linear features in this subdomain. Areas within 1.0 km of NE linear features show an apparent coincidence with mineralized sites in the Marysville district and Seven-up Pete Gulch area, but the density of 0. 78 was too low to include this trend for the entire subdomain.
Intersection sets that have the highest normalized densities are formed by NNW x NW and NNE x NNW linear features (table 1). Although the intersection of NNW x NW features have high normalized density relative to the quadrangle (fig. 3B), areas within 1.2 km include few mines and prospects and are redundant with respect to the occurrences associated with the NNW linear features. The NNE x NNW feature intersections describe only 6.6 percent of the mines and prospects, and together these two intersections account for only 22.6 percent of the occurrences (table 1). Consequently, these intersections are not shown on the map.
Subdomain Ib
The relationship between linear features and metallic mineral occurrences is difficult to evaluate in subdomain lb due to the paucity of mines and prospects. The areal density of linear features is generally higher in this subdomain than in subdomain Ia, and the association of linear features with mineral occurrences here

appears to be markedly different than in subdomain Ia. NNW and NW linear features describe only one mine (25 percent) in subdomain lb, compared to 67.1 percent in subdomain Ia (table 1), when the same grid-cell distance is used.
Areas within 0.8 km of ENE linear features account for 75 percent of the mines and prospects and yield a normalized density of 1.99 (table 1). However, areas within 1.2 km of intersections of ENE x NNE features have a normalized density of 4.83 and include 50 percent of the mineralized sites. The high density value reflects the small area described by cells around these intersections. Because these cells contain a high percentage of occurrences and consequently have a high normalized density relative to the entire quadrangle (fig. 3B), the ENE x NNE feature intersection was selected, rather than ENE linear features (table 1). The normalized density difference for this intersection is 3.30, which is in the high range (fig. 3B).
Domain II
Domain II, which consists of plutonic rocks of the Boulder batholith and volcanic rocks, shows enough areal variations in the spatial relationship between the linear features and the mineralized sites to be divided into six subdomains. Delineation of the subdomain boundaries is based on lithologic and structural information, as well as on the distribution of linear features.
Subdomain Ila
The southern boundary of subdomain Ila is the northern limit of a zone of NW to WNW linear features that characterizes subdomain lib (fig. 4). The northern boundary of subdomain Ila is the projected extension of the Bald Butte fault, and the western boundary is the limit of the Cretaceous plutonic and volcanic rocks.
Twenty-eight metallic mineral occurrences are present within this subdomain. Mines and prospects are common in the Helena district, in the northern part of the Clancy district, and in the Stemwinder Hill area. Most mineral deposits in the eastern part of subdomain Ila are vein and replacement occurrences, whereas those in the northern part include both skarn deposits and vein and replacement deposits (Elliott and others, 1987). Woodward (1986) shows dominantly northeast- to east-northeast-trending veins in the eastern and southern parts of the subdomain.
Analysis of linear features in the six azimuthal ranges shows that areas within 0.6 km of NNW features contain 54 percent of the mines and prospects and yield the second-highest normalized density (2.49) for linear feature trends in the six subdomains of domain II (table 1). The difference between this normalized density and the quadrangle density for this trend is also high (fig. 3A).
Areas within 1.2 km of WNW linear features include 57 percent of the mineralized sites, but the normalized density is lower (1.48) than for NNW features (table 1); the normalized density difference between this subdomain and the quadrangle is moderate (fig. 3A). Areas within 0.8 km of ENE and NE linear features include 50 and 64 percent of the mines, respectively; however, their normalized densities (1.34 and 1.10, respectively) are low because of the large areas described where mines are not present. Areas within 1.4 km of NNE linear features account for 79 percent of the mines and prospects, but the normalized density is 1.31. Therefore, we selected the NNW and WNW features for inclusion in this part of the quadrangle for subsequent mineral resource assessment.
All intersections exhibit low normalized density values in subdomain Ila. The highest normalized density and percentage of occurrence values are 1. 71 and 29. 6, respectively, for intersections
7
of ENE x NNE features (table 1). Compared to the entire quadrangle, these values are low (fig. 3B).
Subdomain lib
The northwest-oriented zone of NW to WNW linear features (fig. 4) that distinguishes subdomain lib from subdomain Ila to the north and subdomain lie to the south is coincident with a conspicuous similarly trending aeromagnetic gradient (W.F. Hanna, USGS, written commun., 1987). Although the zone of linear features continues northwestward, the western boundary of subdomain lib was chosen to coincide with the western limit of the batholithic and volcanic rocks and the eastern limit of the sedimentary rocks. Hydrothermally altered rocks mapped by Rowan and Segal (1989) are more abundant in subdomain lib than subdomain Ila, but are roughly equivalent to their distribution in subdomain lie.
In subdomain lib, areas within 0.2 km of NNE linear features account for 25 percent of the total (105) metallic mineral occurrences (table 1); the 2.56 normalized density is the highest for trends of linear features in the six subdomains of domain II (table 1). The coincidence of these features with mineralized sites is displayed best in the Elliston and Rimini districts.
Areas within 1.0 km of NW features encompass 50 percent of the mineralized sites. Although the 1.25 normalized density and density difference are low (fig. 3A), these linear features account for 15 percent of the sites that are not described by any other linear features, and 39 percent that are not described by NNE linear features. Areas described by the NNE and NW linear features contain 51 percent of the metallic mines and prospects without redundancy.
Woodward (1986) shows that the dominant orientation of veins within subdomain lib are east-northeast to northeast and westnorthwest to northwest. Within the southern part of the Basin district many of the NW linear features are generally coincident with the veins shown by Woodward. In the Amazon mining district these linear features correspond closely to the vein locations, but the veins trend east-northeast here (Woodward, 1986).
Intersection sets have low normalized density values in subdomain lib. Although intersections of ENE x NNE linear feature account for 20 percent of the occurrences and have a 1. 7 4 density value, these values are similar to those for the entire quadrangle (fig. 3B, table 1). Intersections of NE x NW features describe 24.8 percent of the mineralized sites, but the density difference is low (table 1, fig. 3B).
Subdomain lie
This subdomain is located south of subdomain lib and consists of similar lithologic units, although Tertiary volcanic rocks are more widespread in the western part of subdomain lie. As in subdomain lib, known mineral deposits and hydrothermally altered rocks are more abundant in the eastern part. The southeastern boundary of this subdomain corresponds, in part, to a northwest-trending concealed fault.
WNW linear features in this subdomain account for 47.0 percent of the 113 mineralized sites, but the normalized density difference between the subdomain and quadrangle is moderate (table 1, fig. 3A). These linear features account for only 6. 7 percent more sites in subdomain lie than for the entire quadrangle (fig. 3A).
NNE linear features account for 55.0 percent of the mineralized sites with a 1.28 normalized density (table 1); 39 percent of the included sites are not associated with WNW features, and 14.2 percent are not described by linear features having other orienta-

tions. However, the 1.28 normalized density is equivalent to the quadrangle density for areas within 1.4 km of NNE linear features, and 6.9 percent fewer sites are described in this subdomain (fig. 3A). Nevertheless, NNE linear features are included on the map because of the high percentage of sites that are not described by WNW features. The low normalized density and percentage differences (fig. 3A) result mainly from numerous NNE and WNW linear features in the western part of the subdomain where volcanic rocks are widespread and mines and prospects are sparse. According to Woodward (1986), the dominant orientation of mineralized veins within the area of subdomain lie are west-northwest and northeast to north-northeast.
Linear feature intersections do not appear to be closely associated with the mines and prospects in subdomain lie. Areas within 2.0 km of intersections of NE x NW features contain 27.4 percent of the mines and prospects and yield a 2.44 density (table 1). Nearly all these sites are accounted for by the two linear feature trends.
Subdomain lid
Evaluation of contour maps of the areal density of linear features in all six azimuthal ranges, major geologic features, and the distribution of mines and prospects supports subdivision of the southern part of domain II into three subdomains. Subdomain lid, located in the southeastern corner of the quadrangle, is bordered to the northwest by a concealed normal fault (Wallace and others, 1986). This subdornain is underlain by plutonic rocks of the Boulder batholith, Elkhorn Mountain Volcanics, and Quaternary surficial deposits.
ENE linear features appear to be closely associated with the 18 mineralized sites, especially in the Big Foot district. Areas within 0.4 krn of these features contain 55.0 percent of the mines and prospects and yield a 2.10 density (table 1). This value is much higher than what the ENE features yield for the entire quadrangle (table 1, fig. 3A).
NNE linear features are prominent in subdomain lid and form lineament F-F' that extends from the southern margin of the subdomain through the Big Foot district. For areas within 0.6 km, 39.0 percent of the mineralized sites are accounted for, and the normalized density is 1.55. Because these values are low relative to the ENE values, NNE linear features are not included on the map in this subdomain. According to Woodward (1986), mineral vein orientation ranges broadly from NE through WNW.
Linear feature intersections do not exhibit a close spatial relationship with mineralized sites in this subdomain. Areas within 1.2 km of ENE x NE feature intersections yield a 2.11 normalized density and contain 38.9 percent of the sites (table 1). However, the difference between this density and the quadrangle density is 0.23, which is the second smallest difference in figure 3B.
Subdomain lie
This subdomain consists of Cretaceous plutonic rocks of the Boulder batholith, Eocene volcanic rocks, and Tertiary and Quaternary sedimentary rock deposits in domain II. The northwestern margin is coincident with normal faults that separate Eocene volcanic rocks to the east from plutonic rocks of subdomain Ilf to the west. Fa:.1lts trending northeast, north-northwest, east, and northeast are numerous (Wallace and others, 1986). In subdomain lie, 120 mines and prospects occur, and most of these sites are located in the Butte (Summit Valley) mining district. Unfortunately, development within and around the city of Butte has obscured many linear features.
8
Areas within 0.8 km of NNW linear features contain 58.3 percent of the mines and prospects in this subdomain (table 1). Although the 1.28 normalized density is relatively low (table 1) and is slightly lower than the density for the quadrangle (fig. 3A), 25.5 percent more mines are described by this trend within this subdomain than for the entire quadrangle (fig. 3A). Areas within 0.6 km of ENE features account for 12.8 percent less mines than result for the entire quadrangle (table 1) and are not shown on the map.
Intersections of ENE x NE features yield a 4. 90 normalized density and account for 25.0 percent of the mineralized sites in subdomain lie (table 1). Because these values are substantially higher than the values for the entire quadrangle, this intersection set is incorporated on the map and rated moderate (fig. 3B). NNW x WNW linear feature intersections are also included on the map for this subdomain because the normalized density and percentage of sites are higher than the quadrangle values (fig. 3B, table 1) and some of the sites are not described by ENE x NE feature intersections or NNW features. However, because of the 0.82 density difference, this intersection is rated low (fig. 3B).
Meyer and others (1968) noted that the longest and widest mineralized veins in the Butte mining district trend ENE and NW; NE veins are less well developed and mineralized. As previously mentioned, the areal density of linear features in most of the Butte district is low due to obscuration by cultural development. Only a few east-trending linear features were mapped in the MSS and SLAR images, but NE and WNW to NW features are numerous in the western and northern parts where cultural development is not extensive. The lack of west-trending linear features in these parts of the district may be due to the west-illumination of the SLAR image mosaic and low resolution of the MSS images.
Subdomain Ilf
Subdomain Ilf consists dominantly of Cretaceous plutonic rocks, but Cretaceous and Tertiary volcanic rocks are exposed locally. A northeast-trending normal fault that separates plutonic rocks and the volcanic rocks in subdomain lie to the east may be offset by west-northwest- to northwest-trending normal faults (Wallace and others, 1986). The northeast-trending fault is the southeastern boundary of subdomain Ilf and the other boundaries are contacts between the igneous rocks and Tertiary sedimentary deposits of the Deer Lodge Valley at the edge of domain III.
Individual linear features are not closely associated with the nine mines and prospects in this subdomain. Areas within 0.6 km of NNE linear features have the highest normalized density (1.53) but contain only 14.0 percent of the mineralized sites (table 1). The 0.14 difference between the normalized density for the subdomain and the entire quadrangle, and the 5.4 percent fewer mines and prospects described by these linear features in this subdomain reflect a low spatial association (fig. 3A).
In contrast to the low spatial correlation of individual linear features, intersections of ENE x NNW linear features describe 44.0 percent of the mineralized sites, and the 5.42 normalized density is one of the highest in table 1. Areas within 1.6 km of this intersection are incorporated on the map for subdomain Ilf because these values are markedly higher than result for the entire quadrangle (table 1, fig. 3A).
Domain III
No metallic mineral occurrences have been documented within domain III, except for placer deposits. Therefore, this area was not evaluated in this study.

Domain IV
Subdomain IVa
Domain IV was divided into three subdomains using areal changes in the spatial relationship between linear features and metallic mineral occurrences and the distribution of lithologic units. Subdomain IVa, which is located along the southern margin of the quadrangle, consists mainly of Middle Proterozoic sedimentary rocks and Late Cretaceous to early Tertiary granodioritic to monzogranitic intrusive rocks of the Anaconda Range. In subdomains IVb and IVc to the north, the plutonic rocks are dominantly of Cretaceous age. Paleozoic and Mesozoic sedimentary rocks occur in subdomain IVa but are less abundant than in the other two subdomains. Tertiary volcanic rocks are present in the eastern part of subdomains IVa and IVb but are absent in subdomain IV c. Only nine mines and prospects are present in this subdomain, but hydrothermally altered rocks are common and widespread (Rowan and Segal, 1989).
Areas within 1.2 km of NW linear features contain 55.5 percent of the mineralized sites and have a 1.85 normalized density (table 1). This normalized density is 0.86 higher than the density for the entire quadrangle, which is in the high range (fig. 3A). Within the subdomain, 19-percent more sites are accounted for by this trend than within the entire quadrangle (fig. 3A).
Areas within 0.8 km of ENE linear features contain 33.3 percent of the mines and prospects and yield a 1. 78 normalized density (table 1). Although the 0.65 normalized density difference between this density value and the density for the entire quadrangle is slightly higher than the subdomain average (0.54) and lies in the moderate range, only 2.6 percent more sites are accounted for within the subdomain (table 1, fig. 3A). However, none of the three sites described by ENE features are accounted for by NW features. Therefore, both trends are incorporated on the map.
Although intersections of NW x NE linear features have a moderately high 2.71 normalized density, only 11.1 percent of the mines and prospects within the subdomain (1 occurrence) is accounted for (table 1), which is only slightly higher than for the entire quadrangle (fig. 3B). This occurrence is also accounted for by NW linear features.
Subdomain IVb
This subdomain is a small area located north of subdomain IVa and have similar lithologic units, except that plutonic rocks are less abundant. Mineralized sites (21) are more numerous in subdomain IVb than in subdomain IVa.
Areas within 1.0 km of ENE linear features contain 66.6 percent of the mineralized sites. Although this value is much higher than the number for the entire quadrangle, the 1.38 normalized density is only slightly higher than the quadrangle density for ENE features (table 1, fig. 3A).
Areas within 1.2 km of the intersections of ENE x NNW features yield a normalized density of 10.63, which is the highest density in table 1, and include 28.6 percent of the mineralized sites. However, all of these sites are described by the ENE linear features (table 1; fig. 3B). Therefore, only the ENE features are shown on the map, but the low difference between the subdomain and quadrangle density places this trend in the relatively low range (fig. 3B).
Subdomain IVc
This subdomain, the largest of the domain IV subdomains, consists of Cretaceous plutonic rocks, mainly granodiorite and
9
monzogranite and sedimentary rocks that range in age from Middle Proterozoic to Cretaceous. Tertiary and Quaternary rocks and deposits cover the lower slopes of the northern and eastern parts of the range (Wallace and others, 1986). Thrust faults, mainly north northeast to north northwest trending, are numerous; locally, northwest-trending, steeply-dipping faults are prominent. The boundaries of subdomain IVc correspond to those of domain IV, except in the south where subdomains IVa and IVb occupy domain IV. Subdomain IVc is one of the most mineralized areas and contains 213 mines and prospects.
Areas within 0.8 km of NNE linear features contain 54.0 percent of the mineralized sites in this subdomain (table 1). However, the 1.47 normalized density is relatively low (table 1), as indicated by the low difference (0.8) between this value and the density for the entire quadrangle (table 1, fig. 3A). The low normalized density appears to result from a large number of NNE features that are related to the orientation of sedimentary strata, especially in the northern parts of the subdomain that contain few mines and prospects.
NE linear features account for 45.0 percent of the mineralized sites, and approximately half of these are not described by linear features with other orientations (table 1). The normalized density is moderately low (1.46), and the differences between the subdomain and quadrangle percentage of mines and density are low (fig. 3A). Nevertheless, the NNE and NE linear features appear to be most closely associated with the subdomain's mines and prospects and, therefore, are included on the map.
Some linear feature trends that are not incorporated on the map are important because they occur locally near mineralized sites. In the Philipsburg district, east-trending features, as well as NNE and NE features, are prominent. NW linear features are numerous in the Princeton district and Maxville area.
Linear feature intersections do not exhibit a close spatial association with the mineralized sites in this subdomain. Intersections of NNE x NW features accounted for 23.0 percent of the sites and yield a normalized density value of 2.22 (table 1). These values are only slightly higher than those for the entire quadrangle (table 1, fig. 3B).
Domain V
Domain V is dominated by Middle Proterozoic sedimentary and Cretaceous and Tertiary plutonic rocks (Wallace and others, 1986). It was subdivided into two subdomains on the basis of a long WNW to ENE lineament (B-B'), a conspicuously higher areal density of NNE linear features in the northern part (subdomain Vb), and different associations of known mineral occurrences with linear features than in adjacent subdomains.
Subdomain Va
Mines and prospects are fairly sparse (32) in subdomain Va compared to most other parts of the Butte quadrangle. Areas within 1.8 km of ENE linear features contain 88.0 percent of the mineralized sites, but because of the large area described for these linear features, the normalized density is 1.58 (table 1). The difference between the density of the subdomain and entire density of the quadrangle is moderate, but the percentage of included sites is substantially higher for the subdomain than for the entire quadrangle (table 1, fig. 3A).
Areas within 1.8 km of the intersections of WNW x NNE linear features include 21.9 percent of the mines and prospects and have a normalized density of 2.96 (table 1). Intersections of WNW x NNW features produce nearly identical values (table 1), but these

intersections account for several metallic mineral occurrences that are not described by the WNW x NNW linear feature intersections. The density and percentage of mineral occurrences are moderately higher than the quadrangle values (table 1, fig. 3B). Because the total area within 1.8 km of these intersections is substantially less than for ENE linear features where the area is sparsely mineralized, the intersections were selected for inclusion on the map.
Subdomain Vb
Subdomain Vb is also sparsely mineralized; it contains only 30 mines and prospects. However, WNW linear features show a close spatial association with the mineralized sites. Areas within 1.0 km of these linear features include 70.0 percent of the mineralized sites and have a 1.89 normalized density. These values are among the highest in table 1 and are substantially higher than the quadrangle values for this trend (fig. 3A).
Intersections of NNE x NE linear features account for only 20.0 percent of the mines and prospects, and the 1. 75 normalized density is low relative to other subdomains (table 1). Therefore, only WNW features are included on the map.
Domain VI
Domain VI was subdivided into two subdomains because of the higher areal density of linear features, more numerous and larger Cretaceous plutons, and larger number of mines and prospects in subdomain Vlb than in VIa; Paleozoic and Mssozoic sedimentary rocks and Tertiary volcanic rocks are more widespread in subdomain VIa than in subdomain Vlb.
Subdomain VIa
The eastern part of the northern boundary of subdomain VIa is the Bald Butte fault and its extension to the northwest. The western part is generally coincident with a set of prominent WNW linear features that form lineament E-E'. The boundary between this subdomain and subdomain Vb to the south is a northwest-trending right-lateral strike-slip fault (D.J. Lidke, USGS, oral commun., 1986). The remainder of the southern boundary follows Flint Creek and the Clark Fork River, thereby placing the Flint Creek Range south of subdomain VIa. The eastern boundary is the western limit of the Cretaceous plutonic and volcanic rocks of subdomain IVb.
Only seven metallic mineral occurrences have been documented in subdomain VIa, but areas with hydrothermally altered rocks are abundant, especially where Paleozoic and Mesozoic sedimentary rocks are exposed (Rowan and Segal, 1989). Areas within 0.2 km of ENE linear features contain 28.6 percent of the mines, and the normalized density value is 5.18, which is the highest value for individual trends (table 1). Although the difference between this density and the density of the entire quadrangle is also the largest for the trends listed in table 1, the difference for percentage of sites is about average (table 1, fig. 3A).
Areas within 0.2 km of NE linear features also include 28.6 percent, (2), of the sites; and these sites are not within 0.2 km of ENE linear features (table 1). The NE linear features have a normalized density of 2.17, which is considerably higher than the density for the entire quadrangle (fig. 3A); 14.5 percent more sites are included within the subdomain than within the entire quadrangle. Combined, these linear feature trends describe 57.2 percent of the mines and prospects in subdomain VIa.
Intersections of ENE x NNE and of ENE x NNW linear features also exhibit close spatial relationships with the mineralized sites. ENE x NNE linear feature intersections describe 42.9 percent of
10
the sites and the 5.50 normalized density is the second highest for intersections (table 1). ENE x NNW linear feature intersections describe 28.6 percent of the sites and have a 5.39 density (table 1). Areas within 1.6 km of both intersections have substantially higher density and percentage values than result for the entire quadrangle (table 1, fig. 3B). We selected these intersections for inclusion on the map because they account for a higher percentage of the mineralized sites in a smaller area than required for the trends, which is consistent with the sparse mineral occurrences in this subdomain.
Subdomain Vlb
Subdomain Vlb is located in the northwestern part of the Butte quadrangle. The Rattlesnake thrust plate occupies the northwestern corner of this subdomain, and numerous northwest-trending normal and strike-slip faults transect this subdomain. The western part of the southern boundary is the extension of the strike-slip fault that separates subdomains Vb and VIa. The eastern boundary generally follows the valley occupied by Douglas Creek, and the northeastern boundary separating this subdomain from subdomain Ia is a strike-slip fault that may be the extension of the Bald Butte fault. Most of the 55 mineralized sites in this subdomain are located near Cretaceous plutons.
Areas within 0.2 km of NE linear features contain 30.9 percent of the sites and yield a 1.93 normalized density (table 1). This density is 0.83 higher than the density for the entire quadrangle, which is above the table 1 average for linear feature trends, but only 16.8 percent more sites are accounted for within the subdomain than for the entire quadrangle (table 1, fig. 3A). Areas within 1.0 km of WNW linear features contain 67.3 percent of the mines and prospects and have a 1.48 density (table 1). Although 40.2 percent more sites are accounted for within the subdomain than for the quadrangle, the 0.32 difference between the densities for subdomain and the entire quadrangle density values is below average (table 1, fig. 3A).
Areas within 0.8 km of intersections of ENE x NE linear features, which are the smallest intersection areas used, include 30.9 percent of the mines and prospects and have a relatively high 4.91 normalized density. Compared to the entire quadrangle, the normalized density and percentage of mineralized sites is much higher within subdomain Vlb (table 1, fig. 3B).
Areas within 1.6 km of intersections of WNW x NNW features include 40.0 percent of the mineralized sites and have a 3.28 normalized density (table 1). The difference between the subdomain and quadrangle densities is in the moderate range (fig. 3B), and 32.3 percent more sites are described within the subdomain than in the entire quadrangle (table 1, fig. 3B). Together, these intersection areas contain 70.9 percent of the mines and prospects and, therefore, are incorporated on the map.
DISCUSSION AND SUMMARY
The spatial association of linear features with metallic mineral occurrences in the Butte quadrangle shows considerable variation. Based on normalized density differences (fig. 3), subdomains lb, lid, llf, Vb, and VIa exhibit high spatial correspondence of linear features and mineral occurrences (table 2). Subdomains IVb and IVc appear to have low spatial correspondence; the remaining subdomains range from moderately low to moderately high spatial correspondence (table 2).
This variation appears to be caused by several factors, and their degree of influence varies from one subdomain to another. The most important factors appear to be lack of homogeneity of the

Table 2. Rating of linear feature trends and intersections based on normalized density differences (fig. 3) and summary rating for subdomains.
eastern parts would increase the normalized density difference of NNE features because of the concentration of
[Abbreviations used: H, high; M, medium; L, low] mineral occurrences and these features
Domain Subdomain Trend, Rating Intersection, Rating
NNW,M Ia
I NW,L
lb ENE x NNE, H
NNW,H II a
WNW,M
NNE,H lib
NW,L
WNW,M II lie
NNE,L
lid ENE,H
ENE x NE, M lie NNW,L
NNW x WNW,L
Ilf ENE x NNW, H
NW,H IVa
ENE,M
IV IVb ENE,L
NNE,L - IVc
NE,L
WNW x NNE, M Va
v WNW x NNW,M
Vb WNW,H
ENE x NNE, H VIa
ENE x NNW, H VI
ENE x NE, H Vlb
WNW x NNW,M
linear feature-mineral occurrence relationship within a subdomain, inclusion of hnear features that represent bedding traces rather than fractures, and undersampling due to instrument limitations and cultural development. Selected subdomains are discussed below to illustrate these problems.
In subdomain lie, NNE linear features were selected because they describe a large number of mines that are not accounted for by other selected linear features, which trend WNW (table l). However, the normalized density difference of the NNE features is zero, and the percentage occurrence difference is -6.9 (fig. 3A). The low difference values are due to the abundance of these features in the western part of the subdomain where mineralized sites are sparse. Subdivision of subdomain lie into western and
11
Summary Rating
Moderately low
High
Moderately high
Moderate
Moderately low
High
Moderately low
High
Moderately high
Low
Low
Moderate
High
High
Moderately high
in the eastern area. The density difference would decrease in the western part, probably eliminating this trend from this area. The concentration of mineralized sites in the east appears to be related to the presence of batholithic host rocks; volcanic rocks dominate the western part. Thus, this subdomain illustrates the importance of source rocks in defining subdomains that are homogeneous with respect to the linear feature and mineral occurrence relationship.
The distribution of WNW linear features in subdomain lie appears to indicate that MSS and SLAR instrument limitations caused undersampling of these features, especially in the eastern part where several important veins are west-northwest-oriented (Woodward, 1986). The largest concentration of WNW features in subdomain lie is in the Emery district in the western part of the subdomain. Analyses of Landsat Thematic Mapper (TM) and high altitude color-infrared stereoscopic photographs show the presence of numerous narrow WNW fractures, some of which contain mineralized veins. The paucity of WNW features in this area are evidence of the inadequacy of the MSS 79-meter resolution and the SLAR west-illumination for detecting these features. The normalized density for WNW features would be substantially higher in subdomain lie if these features were included in the linear f2ature data set.
Subdomain lie may also be nonuniform with respect to the spatial relationship between linear features and mineral occurrences. Of the 120 metallic mineral occurrences in that subdomain, approximately 70 percent are located in the Butte mining district. Therefore,
determination of linear feature trends and intersections that correspond to mineral occurrences are controlled mostly by the Butte district. Relationships defined in the Butte district, which is complicated by cultural development, may not apply to the much larger remainder of subdomain He. In future studies, which will incorporate linear features mapped in TM images, subdomain lie will be subdivided, probably treating the Butte district as an individual subdomain.
Subdomains that consist largely of layered rocks are problematical because linear features that reflect layering and fractures are difficult to distinguish. Where faults are colinear with layering, such as in subdomain IVc, all linear features must be considered, even though some may not represent fractures. The low normalized

density differences of NNE and NE features in subdomain IVc are probably due to the dominantly NNE to NNW orientation of bedding in the sedimentary rocks. Because most of the traces of the thrust faults and many steeply dipping faults have this general orientation, all the linear features were included in the analysis. However, low normalized densities result from the presence of these linear features where mineral occurrences have not been documented. Consideration of other factors, such as host rock composition, might alleviate this problem, but it may be the most difficult of the problems discussed above.
A more objective method of defining homogeneous domains is needed to improve the results of analysis of the association of linear features with mineral occurrences. Visual evaluation of linear features, mineral occurrences, and geologic map data used here is subjective and results in heterogeneity.
REFERENCES CITED
Elliott, J.E., Loen, J.S., Wise, K.K., and Blaskowski, M.J., 1987, Mines and prospects of the Butte 1 o x 2o quadrangle, Montana: U.S. Geological Survey Open-File Report 86-632, scale 1:250,000.
Knepper, D.H., Jr., 1983, Summary of some analysis techniques for linear features with examples from the Cascade Range, in International Geoscience and Remote Sensing Symposium Digest, 1983: Institute of Electrical and Electronic Engineers, v. 2, sec. FP-6, pp. 6.1-6.5.
Marrs, R.W., and Raines, G.L., 1984, Tectonic framework of the Powder River Basin, Wyoming and Montana interpreted from Landsat imagery: American Association of Petroleum Geologists Bulletin, v. 68, no. 11, pp. 1718-1731.
Meyer, C., Shea, E.P., Goddard, C.C., Jr., and staff, 1968, Ore deposits of Butte, Montana, in Ridge, J.D., ed., Ore deposits of the United States 1933-1967 (Graton-Sales vol.): New York, American Institute of Mining, Metall. Petroleum Engineers, v. 2, pp. 1362-1416.
12
O'Leary, D.W., Friedman, J.D., and Pohn, H.A., 1976, Lineament, linear, lineation; some proposed new standards for old terms: Geological Society of American Bulletin, v. 87, pp. 1463-1469.
Raines, G.L., 1978, A porphyry cooper exploration model for northern Sonora, Mexico: U.S. Geological Survey Journal of Research, v. 6, no. 1, pp. 51-78.
Rowan, L.C., and Purdy, T.L., 1984, Map of the Walker Lake 1 o x 2o quadrangle, California and Nevada showing the regional distribution of linear features: U.S. Geological Survey Miscellaneous Field Studies Map MF-1382-P, scale 1:250,000.
---1985, Map showing analysis of linear features in the Wallace 1 o x 2o quadrangle, Idaho-Montana: U.S. Geological Survey Miscellaneous Field Studies Map MF-1453-H, scale 1:250,000.
Rowan, L.C., and Segal, D.B., 1989, Map showing locations of exposures of limonitic rocks and hydrothermally altered rocks in the Butte 1 o x 2o quadrangle, Montana: U.S. Geological Survey Miscellaneous Investigations Series Map 1-2050-A, Scale 1:250,000.
Ruppel, E.T., Wallace, C.A., Schmidt, R.G., and Lopez, D.A., 1981, Preliminary interpretation of the thrust belt in southwest and west-central Montana and east-central Idaho: Tucker, T.E., ed., Montana Geological Society Field Conference and Symposium Guidebook to Southwest Montana, pp. 139-160.
Sawatzky, D.L. and Raines, G.L., 1981, Geologic uses of linear features maps derived from small-scale images, in Proceedings of the Third International Conference on Basement Tectonics, Durango, Colorado, May 15-19, 1978, Basement Tectonics Committee, Inc., pp. 91-100.
Wallace, C.A. and others, 1986, Preliminary geologic map of the Butte, Montana 1 o x 2° quadrangle: U.S. Geological Survey Open-File Report 86-292, scale 1:250,000.
Woodward, L.A., 1986, Tectonic origin of fractures for vein emplacement in the Boulder Batholith and adjacent rocks, Montana: Economic Geology, v. 81, pp. 1387-1395.
•