eprints.uwe.ac.ukeprints.uwe.ac.uk/28320/1/bite manuscript accepted.docx · web viewin addition to...
TRANSCRIPT

MICROALGAE AS SUBSTRATE IN LOW COST TERRACOTTA-BASED MICROBIAL FUEL CELLS:
NOVEL APPLICATION OF THE CATHOLYTE PRODUCED
M. J. Salar-García1, I. Gajda2, V. M. Ortiz-Martínez1, J. Greenman2, M. M. Hanczyc3, A.P. de los
Ríos4, I. A. Ieropoulos2,*
(1) Polytechnic University of Cartagena, Chemical and Environment Engineering Department, Campus
Muralla del Mar, C/Doctor Fleming S/N, E-30202 Cartagena, Murcia.
(2) Bristol BioEnergy Centre, Bristol Robotic Laboratory, Block T, UWE, Bristol, Coldharbour Lane,
Bristol BS16 1QY, UK
(3) University of Trento, Laboratory for Artificial Biology, Via Sommarive Nº9, E: 38123 Povo, Trento,
Italy
(4) University of Murcia, Chemical Engineering Department, Campus de Espinardo, E-30071 Murcia,
Spain
Corresponding author: E-mail: [email protected]
HIGHLIGHTS
Novel application of the catholyte produced in ceramic MFCs to lyse microalgae.
Microalgae as a potential low cost co-substrate for MFCs. Light/dark cycle assisted microalgae digestion in the presence of catholyte.
ABSTRACT
In this work, the by-product generated during the operation of cylindrical MFCs, made
out of terracotta, is investigated as a feasible means of degrading live microalgae for
the first time. In addition to the low cost materials of this design, the reuse of the
solution produced in the cathode renders the technology truly green and capable of
generating bioenergy. In this study, the effect of a light/dark cycle or dark conditions
only on the digestion of live microalgae with the catholyte is investigated. The results
1
1
2
3
4
6
7
8
9
10
11
12
13
14
15
16
17181920
21
22
23
24
25
26
27
12

show that a combination of light/dark improves the degradation of algae and allows
them to be used as substrate in the anode. The addition of 12.5 mL of a 1:1 mix of
catholyte and microalgae (pre-digested over 5 days under light/dark) to the anode,
increases the power generation from 7 µW to 44 µW once all the organic matter in the
anode have been depleted.
GRAPHICAL ABSTRACT
Keywords: Microbial fuel cells; ceramic membrane; catholyte; microalgae; bioenergy.
1. INTRODUCTION
The ongoing energy crisis and global warming have challenged the scientific
community to develop alternative sources of energy [Creutzig et al., 2015; Guo et al.,
2015; Heinimö & Junginger 2009; Mao et al., 2015]. A wide range of materials has
been investigated to produce bioenergy such as industrial or crop waste [Deublein &
Steinhauser, 2008; Ho et al., 2014]. However, algae have received increased attention
in recent years as an alternative option to conventional materials. The use of algae
2
28
29
30
31
32
33
34
35
36
37
38
39
40
41
42
34

presents many advantages due to their high growth rates in relatively confined spaces,
compared to other terrestrial plants. Algae can be grouped into two large categories:
microalgae and macroalgae. The main characteristic of microalgae is that they are
unicellular green plants that contain proteins, lipids and carbohydrates in different
proportions, depending on the strain but not cellulose or lignin. Moreover, they are
rich in chlorophyll and can be used for feeding aquatic organisms [Schenk et al., 2008;
Velasquez-Orta et al., 2009]. On the other hand, macroalgae do not contain lignin but
have low values of cellulose, which makes them more resistant to some predators.
They mainly consist of polysaccharides and unsaturated fatty acids [Velasquez-Orta et
al., 2009; Vergara-Fernández et al., 2008]. Microalgae and macroalgae can be
cultivated in different aqueous environments such as rivers, seas or wastewater, and
both types have been studied for the production of energy, via different pathways:
macroalgae have been used in the production of methane and microalgae are more
suitable for producing a wide range of energy products, such as bio-oil, methane,
methanol, hydrogen or even electricity. The main drawback is the need for a resource-
intensive infrastructure to support the transformation of microalgal biomass into
electricity (storage, transport and processing) [Bahadar & Khan 2013; Velasquez-Orta
et al., 2009]. In this regard, microbial fuel cells (MFCs) have played a key role in recent
years as a technology that can directly produce electricity from different sources of
organic waste, and perhaps algae. MFCs use microorganisms to degrade organic
matter contained in different types of waste, producing electrons and protons. The
electrons go through an external circuit to the cathode while protons go through a
separator, usually a proton exchange membrane, to reach the cathode. In the cathode,
3
43
44
45
46
47
48
49
50
51
52
53
54
55
56
57
58
59
60
61
62
63
64
65
56

incoming electrons and protons react with oxygen to produce water [Hernández-
Fernández et al., 2015; Oliveira et al., 2013; Potter 1911].
Many advances have been achieved in terms of new materials and designs in the field
of MFCs to improve their performance and reduce the cost [Hernández-Fernández et
al., 2015]. The use of ceramic materials as a separator is amongst the most important
since commercial membranes like Nafion® are expensive [Ghadge & Ghangrekar 2015;
Winfield et al., 2013]. Ceramics have been previously reported as membrane/electrode
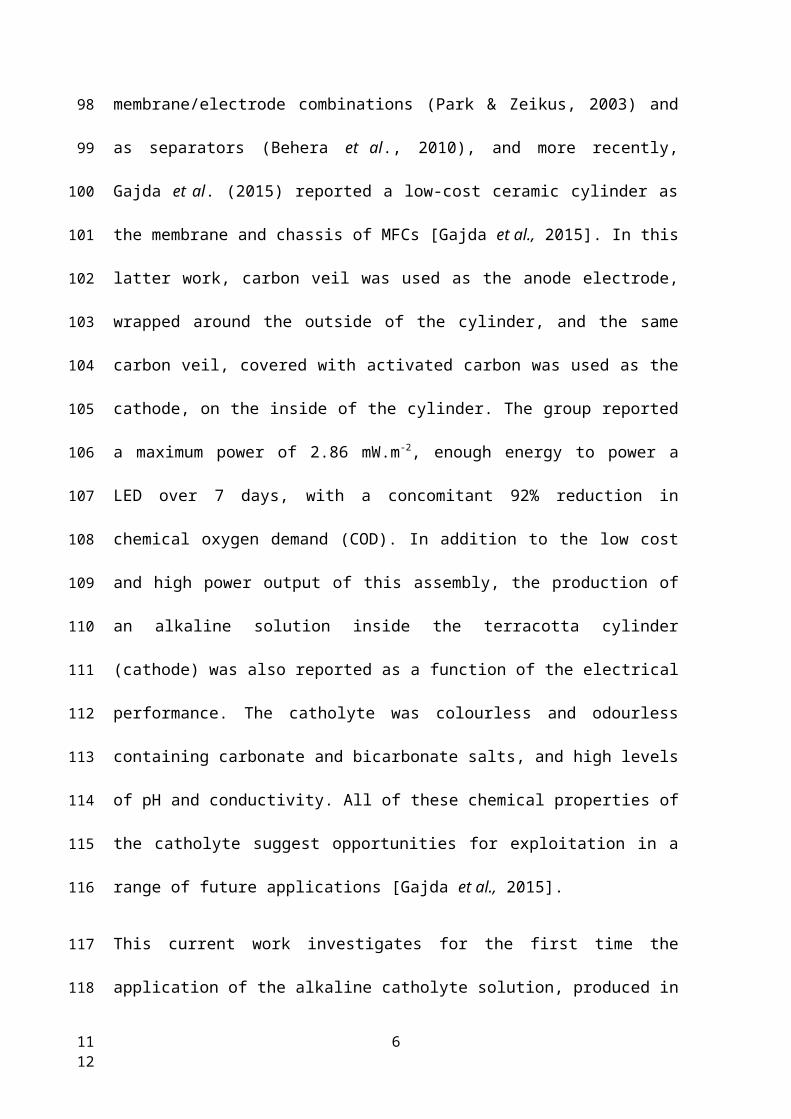
combinations (Park & Zeikus, 2003) and as separators (Behera et al., 2010), and more
recently, Gajda et al. (2015) reported a low-cost ceramic cylinder as the membrane
and chassis of MFCs [Gajda et al., 2015]. In this latter work, carbon veil was used as the
anode electrode, wrapped around the outside of the cylinder, and the same carbon
veil, covered with activated carbon was used as the cathode, on the inside of the
cylinder. The group reported a maximum power of 2.86 mW.m -2, enough energy to
power a LED over 7 days, with a concomitant 92% reduction in chemical oxygen
demand (COD). In addition to the low cost and high power output of this assembly, the
production of an alkaline solution inside the terracotta cylinder (cathode) was also
reported as a function of the electrical performance. The catholyte was colourless and
odourless containing carbonate and bicarbonate salts, and high levels of pH and
conductivity. All of these chemical properties of the catholyte suggest opportunities for
exploitation in a range of future applications [Gajda et al., 2015].
This current work investigates for the first time the application of the alkaline catholyte
solution, produced in the aforementioned cylindrical terracotta MFCs, to lyse live
microalgae and then feed the lysed cells as substrate, in the anode for the microbes.
4
66
67
68
69
70
71
72
73
74
75
76
77
78
79
80
81
82
83
84
85
86
87
88
78

This takes advantage of the chemical potential produced by the MFC by using the
alkaline catholyte as an external digester to provide organics to the anode microbes
that would be difficult or impossible for them to break down directly. The performance
of these MFCs is then compared with that from MFCs using live non-lysed microalgae.
This study shows a novel and promising application of the by-product generated during
the operation of ceramic MFCs, which opens up further avenues for exploration and
exploitation.
2. MATERIALS AND METHODS
Microbial fuel cell configuration
The microbial fuel cells used consist of a 10 cm tall terracotta cylinder sealed at the
bottom with an internal and external diameter of 3.5 cm and 4 cm, respectively
(Weston Mill Pottery, Nottinghamshire, UK). This structure acts as separator between
the anodic and cathodic chamber. The anode is made out of carbon veil (20 g.m -2)
folded and wrapped around the outside surface of the terracotta cylinder. A nickel-
chromiun wire is used to hold this electrode in place and also serves as the current
collector and connection point. The cathode is formed by the same carbon veil (90 cm2,
substratum/diffusion layer) coated with a mixture of (conductive layer) activated
carbon and polytetrafluoroethylene (PTFE 30%V/V). It is placed inside the terracotta
cylinder with the conductive layer facing the separator. The cathode electrode is held
against the inner wall of the cylindrical ceramic body, using a plastic ring and the
cathode compartment is open to the air, in order to allow the oxygen reduction
reaction to take place. Finally, an external resistance of 100 Ω is used to load the circuit
5
89
90
91
92
93
94
95
96
97
98
99
100
101
102
103
104
105
106
107
108
109
110
910
and two stainless steel crocodile clips connect both electrodes to the data logger.
Figure 1 describes the main components of the MFCs studied.
Figure 1. Main components of the MFCs studied.
Analytical Method
A 16-channel ADC-24 Picolog recorder data logger (Pico Technology Ltd,
Cambridgeshire, UK) was used to monitor the voltage vs. time. The polarisation and
power curves were measured by changing the external resistive loads, from 999999 to
0 Ω (including open circuit voltage), for 3 minute intervals for each load, using an
automatic resistorstat tool [Degrenne et al., 2012]. Data sampling (i.e. recording
capacity) during the polarisation run was 30 second intervals.
The catholyte and anolyte solutions were characterised by measuring pH and
conductivity during the experiment with a handheld pH meter (Hanna 8424, Hanna
Instrument, UK) and 470 Jenway conductivity meter (Camlab, UK), respectively.
6
111
112
113
114
115
116
117
118
119
120
121
122
123
124
125
126
1112

Operation Mode
The terracotta cylinders were placed inside a plastic container, which serves as the
anode chamber, and filled with 170 mL of substrate. The fuel is a solution consisting of
10%V/V of sludge provided by Wessex Water Scientific Laboratory (Cam Valley, Saltford,
UK), 90%V/V of deionised water and supplemented with sodium acetate anhydrous
(Fisher Chemical, Loughborough, UK) with a final concentration of 20 mM. Prior to
starting the experiments, the MFCs were matured during 14 days using a solution
composed of sludge supplemented with 100 mM acetate as the substrate. At this
starting point, the cathode chamber was completely empty and dry, in order for
catholyte to be actively produced, as a direct result of the MFC operation. During this
process, MFCs generated sufficient amount of catholyte to be subsequently used for
microalgal lysis. MFCs were studied in batch mode under the 4 different conditions
detailed below. Each one was carried out in triplicate and they were applied
sequentially in the same reactors in the following order:
Condition A: Following the maturing of the MFCs, the anodes were filled with
170 mL of substrate (20 mM of acetate and 10%V/V of sludge). The power increased
initially due to the bacterial metabolism, then stabilised and finally started to decrease
due to the depletion of the organic matter. When the power is below 10 µW, 12.5 mL
of substrate (10% of the volume at that moment) is removed and replaced by 12.5 mL
of a 1:1 mix consisting of microalgae and deionised water, to maintain the liquid
volume of the reactor. The microalgae culture was collected from a pond at Frenchay
Campus (University of the West of England, Bristol, UK) and grown in the laboratory in
the cathodic chamber of a separate MFC. It is a wild mixed algal culture with an optical
7
127
128
129
130
131
132
133
134
135
136
137
138
139
140
141
142
143
144
145
146
147
148
149
1314

density of 1.77 (4.8 g.L-1), which was measured using a Jenway 6300
spectrophotometer (Wolflabs, UK) at a wavelength of 678 nm. The effect of adding the
catholyte/deionised water solution in the systems was evaluated in terms of power
generation.
Condition B: Following the completion of Condition A, the MFCs were rinsed
and carefully cleaned with deionised water. Then, they were filled with 170 mL of the
same substrate as described for Condition A, but with the 12.5 mL added, consisting of
catholyte and deionised water (1:1) as a control, to investigate the effect on power
production. The catholyte is an alkaline solution that mainly contains carbonate and
bicarbonate, and traces of chloride, phosphate and sulphate (data not shown).
Condition C: Following the completion of Condition B, and before feeding, the
MFCs were cleaned with deionised water again. When the power reached a value
below 10 µW, 12.5 mL of a solution made from microalgae and catholyte (1:1) digested
over a period of 5 days under natural cycles of day and night, were added to the
anode.
Condition D: In this case, the procedure followed is the same as for the
previous conditions, but the 12.5 mL of mix added consisted of microalgae and
catholyte (1:1) but the micro-algal digestion occurred over 5 days in total darkness.
3. RESULTS AND DISCUSSION
This work shows a novel application of the catholyte generated in ceramic tubular
MFCs. This catholyte is a colourless and odourless liquid with high values of pH and
conductivity. The amount of catholyte produced is a function of power performance
for this type of MFCs; in other words, the higher the performance of the microbial fuel
8
150
151
152
153
154
155
156
157
158
159
160
161
162
163
164
165
166
167
168
169
170
171
172
173
1516

cells, the higher the production of catholyte and the higher the pH and conductivity
levels [Gajda et al., 2015]. The catholyte used in this study had a pH of 12.5 and a
conductivity of 24.5 mS.cm-1. As mentioned above, the main purpose of this work is to
reuse the catholyte produced to lyse algae in such a way that the mixture can be used
as low cost substrate for anodic microorganisms.
Figure 2 shows the power and polarisation curves from each group of three MFC
replicates, once they become stable and before applying the Conditions described
above. A maximum power of 230 µW was recorded by the four groups of MFCs. Then,
the four types of assay were carried out under Conditions A-D.
Figure 2. Power and polarisation curves of the three MFC replicates of each condition
before adding the co-substrate mix.
Figure 3 shows the evolution of the average power produced by each group of
microbial fuel cell triplicate vs. time. The decay in the power curves indicates the
precise time point at which the solution investigated as a substrate is added to the
9
174
175
176
177
178
179
180
181
182
183184185
186
187
188
189
1718

anodic chamber, indicated by the red arrows in the figure. As can be seen in Figure 3A,
when the solution of algae/deionised water was added, the power of the MFCs
continued decreasing. This suggests that the microorganisms are not able to directly
utilise this type of algal mixture.
In Figure 3B, a peak of approximately 50 µW was recorded, when 12.5 mL of
catholyte/deionised water (1:1) were added in the anode solution. However, this was a
short spike, since power decreased within 3 hours. The power increase is due to the
high conductivity of the catholyte although this effect disappears very quickly when
the charges are balanced between the cathode and the anode. This would imply that
the mixture added, does not contain bio-available compounds for the microorganisms
to utilise.
Figure 3C shows a higher increase, after adding the solution containing algae/catholyte
digested over 5 days under a light/dark cycle (natural diurnal). In contrast with the
previous cases, the power continued increasing for 33 hours until a maximum of 44
µW was reached. This result suggests that perhaps the bacteria in the anode chamber
could degrade better the substrate. This would mean that a natural cycle of light/dark
(16:8 hours) may be necessary to lyse algae in the presence of the synthesised
catholyte. Previous research shows that microalgae need light and darkness for
growth, since they use the light for photochemical reactions (generating adenosine
triphosphate (ATP), coenzymes, nicotinamide adenine dinucleotide phosphateoxidase
(NADPH)) and the darkness for synthesising essential molecules by biochemical
reactions (Calvin Cycle) [Al-Qasmi et al., 2012]. This cycle is used by the photosynthetic
cells to transform the inorganic carbon into organic carbon using the energy stored in
10
190
191
192
193
194
195
196
197
198
199
200
201
202
203
204
205
206
207
208
209
210
211
212
1920

the molecules synthesized during the light cycle, such as ATP. Some of the
photosynthesised organic compounds are excreted into the media as dissolved organic
carbon (DOC) that anodic microorganisms could degrade and use as carbon-energy
source. The rate of decomposition depends on the identity of the microbial species
present in the community, their affinity to the dissolved carbon source and their
growth kinetics [Kouzuma & Watanabe 2015]. In this case, the mix of algae/catholyte
was digested under a light/dark cycle, which allows microalgae to carry out the
photochemical and biochemical reactions, and excrete a wider range of organic
compounds into the media. On the other hand, during the growth process, algae will
neutralise the alkaline pH of the catholyte. In order to buffer the external pH,
microalgae also release acidic extracellular metabolites. These metabolites along with
DOC enrich the media. It is therefore assumed that a combination of these factors
renders the added mixture a better carbon-energy source that could be more readily
degradable by the anodic microorganisms, thereby improving the performance of the
MFCs.
11
213
214
215
216
217
218
219
220
221
222
223
224
225
226
227
228
2122

Figure 3. Power output of each MFC under the conditions studied. A) Condition A: Algae+Deionised water; B) Condition B: Catholyte+Deionised water; C) Condition C: Algae digested with catholyte under a cycle of light/darkness; D) Condition D: Algae
digested with catholyte under darkness.
Finally, Figure 3D shows an immediate increase in power, when the mix of
algae/catholyte digested under darkness was added. The magnitude of this peak is
similar to that recorded in Figure 3B, when catholyte/deionised water was added. This
implies that the increase in the power generated is caused by the high conductivity of
the catholyte but perhaps not by the algal degradation itself. In this case, the mix was
kept under dark conditions, so that algae could neither carry out their normal cycle of
photochemical/biochemical reactions, nor adapt to the new conditions of the media
(pH>12). This implies that they would not produce ATP or NADPH, which are required
in the Calvin cycle to synthesise organic compounds necessary for their growth, such as
sugars or starch. Hence, all the available biochemical material would be consumed for
their survival. When this liquid mix is added into the MFC anode, it appears that there
is not sufficient carbon-energy for the anodic microorganisms to consume [Kouzuma &
12
229
230231232233
234
235
236
237
238
239
240
241
242
243
244
245
246
2324

Watanabe 2015], apart perhaps from any lysed algae, which is results in the relatively
longer duration, of increased power, compared to Fig. 3B.
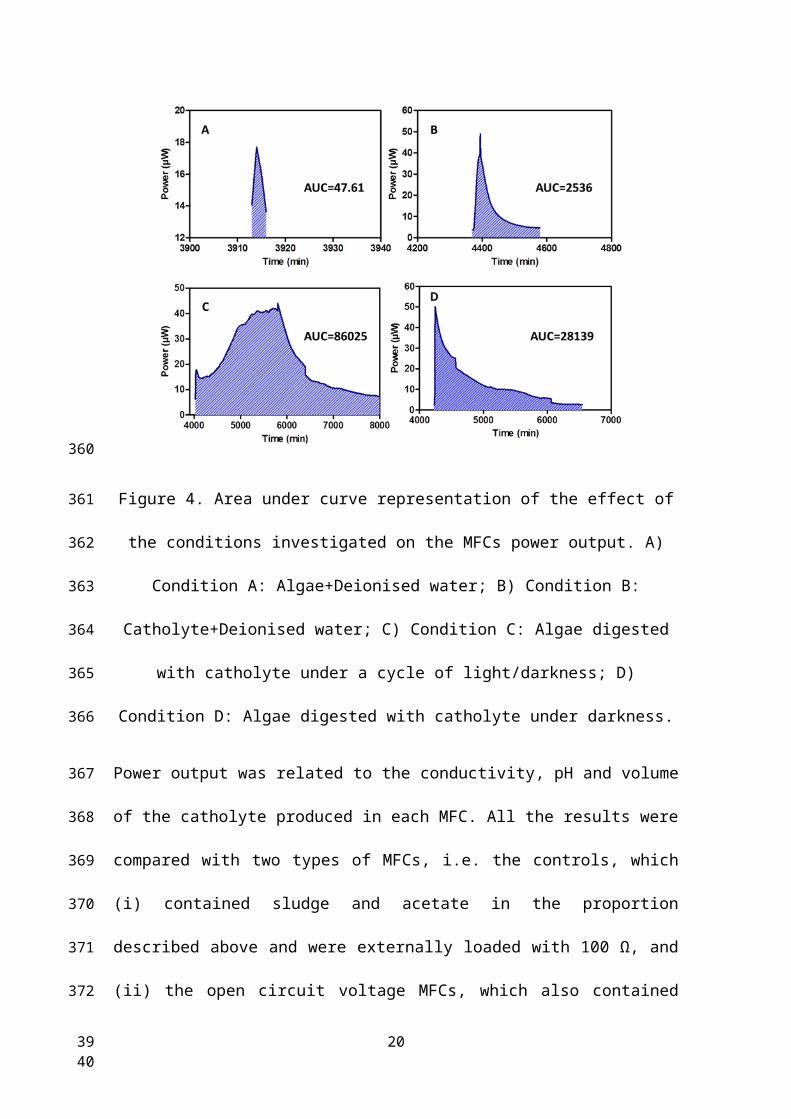
Figure 4 shows the area under curve of the power output (AUC) representation caused
by the addition of the substrates analysed. The energy produced by the addition of the
solution investigated was also determined and found to be: 0.003, 0.152, 5.162 and
1.688 Joules for Conditions A, B, C and D, respectively. As can be observed, the use of
algae digested with catholyte under light/darkness shows the highest effect on power
output, both in terms of magnitude and length (see Figure 4C). It is three times higher
than the effect caused when the digestion is performed under dark (Fig. 4D). 34 times
higher than the result after feeding with catholyte and deionised water (Fig. 4B) and
1.8 times higher than the power generated when the MFCs were fed with microalgae
and de-ionised water (Fig. 4A).
13
247
248
249
250
251
252
253
254
255
256
257
258
259
2526

Figure 4. Area under curve representation of the effect of the conditions investigated
on the MFCs power output. A) Condition A: Algae+Deionised water; B) Condition B:
Catholyte+Deionised water; C) Condition C: Algae digested with catholyte under a cycle
of light/darkness; D) Condition D: Algae digested with catholyte under darkness.
Power output was related to the conductivity, pH and volume of the catholyte
produced in each MFC. All the results were compared with two types of MFCs, i.e. the
controls, which (i) contained sludge and acetate in the proportion described above and
were externally loaded with 100 Ω, and (ii) the open circuit voltage MFCs, which also
contained sludge and acetate at the same concentrations, but were not externally
loaded (no electrons transfer).
As can be seen in Figure 5, the better the MFCs perform, the higher the values of these
parameters for the catholyte. Figures 5A and 5B show the conductivity and pH
differences between the anolyte and catholyte for each set of conditions investigated.
These results reveal that the conductivity and the pH of the catholyte increased with
higher MFC performance, while decreasing in the anolyte. Moreover, the
catholyte/anolyte ratio is higher for the MFCs that worked better (MFCs loaded and
MFCs with algae and catholyte digested under a light/darkness cycle). In terms of
volume of catholyte produced, the trend is the same (see Figure 5C). As previously
mentioned, the volume of the catholyte is directly proportional to the level of MFC
performance, since it is the result of oxygen reduction reaction, electro-osmotic drag
and passive osmosis. In this regard, the MFCs with algae and catholyte digested under
a cycle of light/darkness, resulted in the highest values of conductivity, pH and volume
of catholyte, followed by the MFCs with algae and catholyte digested in dark
14
260
261
262
263
264
265
266
267
268
269
270
271
272
273
274
275
276
277
278
279
280
281
282
2728

conditions, which was followed by the MFCs with catholyte and deionised water, the
MFCs with algae and deionised water and finally by the MFCs under open circuit
conditions. These results are in line with those obtained by Gajda et al. 2015, who
related high MFC performance to high values of pH and conductivity of the catholyte
and high volumes of catholyte produced in terracotta-based MFCs.
Figure 5. Physico-chemical parameters for the conditions investigated: A) conductivity levels in the catholyte and anolyte; B) pH levels in the catholyte and anolyte; C) volume
of catholyte produced.
The results show that the unique properties of the MFC-generated catholyte such as
the high values of pH and conductivity allow for a wild culture of microalgae to be
lysed in five days under a natural cycle of light/dark in a kind of self-produced external
15
283
284
285
286
287
288289290291
292
293
294
295
296
2930

digester. A mix of 12.5 mL (1:1) of catholyte/microalgae resulted in a 6-fold power
increase – from 7 µW to 44 µW. These values could be explained by the light/dark
conditions (i.e. natural rhythm of algae) and the specific properties of the catholyte,
acting as an algal lyser. Moreover, higher power output led to higher values of pH,
conductivity and volume of the catholyte generated, and in this context the MFCs
using algae digested with catholyte under a cycle of light/darkness outperformed the
rest of the test conditions. Higher power output was also quantified as area under
curve, which revealed a significant improvement from feeding the MFCs with the
catholyte/microalgae mixture.
The main advantages of the process described above are the low cost of the materials
and the reuse of the by-product generated. Unlike previous work, the assembly
studied uses a terracotta cylinder as exchange membrane instead of a commercial
membrane, activated carbon as conductive layer in the cathode instead of platinum
and live algae from a natural habitat, in a way alluding to algal bloom reduction [Rashid
et al., 2013; Velasquez-Orta et al., 2009]. All of these materials reduce the cost of the
MFC mitigating the main drawback for the scaling up process of these systems.
4. CONCLUSIONS
This work reveals a novel application of the catholyte produced during the operation of
a terracotta tubular MFC. These results show great promise since they demonstrate
that algae can be used as natural carbon source in terracotta-based MFCs when
16
297
298
299
300
301
302
303
304
305
306
307
308
309
310
311
312
313
314
315
316
317
318
319
3132

treated with the catholyte that has been synthesised in-situ. Further work is required
to better understand the lysing mechanisms as well as the process of nutrient
extraction optimise the catholyte and algal biomass ratio and improve the operating
conditions from batch to continuous flow.
ACKNOWLEDGEMENTS
This work was funded by the Ministry of Science and Innovation of Spain (MICINN), ref.
CICYT ENE2011-25188, and the Séneca Foundation Ref. 18975/JLI/13. M.J. Salar-García
and V.M. Ortiz-Martínez thank the Ministry of Economy and Competitiveness and the
Ministry of Education for supporting their doctoral theses (Ref: BES-2012-055350 and
FPU12/05444, respectively) and the mobility grants received (Ref. EEBB-I-15-10446
and PMPDI-UPCT-2015, respectively) which made possible the collaboration between
Polytechnic University of Cartagena and University of the West of England. Ioannis
Ieropoulos is supported by an EPSRC New Directions award, grant no. EP/L002132/1.
REFERENCES
[1] Al-Qasmi M,Member Nr, IAENG, Talebi S, Al-Rajhi S, Al-Barwani T., 2012. A review
of effect of light on microalgae growth. Proceeding of the world congress on
engineering 1, 4-6.
[2] Bahadar A and Khan MB., 2013Progress in energy from microalgae: A review.
Renew Sust Energ Rev. 27, 128-148.
17
320
321
322
323
324
325
326
327
328
329
330
331
332
333
334
335
336
337
338
339
3334

[3] Behera M, Jana P.S, More T.T., Ghangrekar M.M. Rice mill wastewater treatment in
microbial fuel cells fabricated using proton exchange membrane and earthen pot at
different pH, Bioelectrochemistry 79, 2010, 228–233.
[4] Creutzig F, Ravindranath NH, Berndes G, Bolwig S et al., 2015. Bioenergy and
climate change mitigation: an assessment. Glob Change Biol Bioenergy. 7(5), 916-944.
[5] Degrenne N, Buret F, Allard B, Bevilacqua P., 2012. Electrical energy generation
from a large number of microbial fuel cells operating at maximum power point
electrical load. J Power Sources 205, 188-193.
[6] Deublein D and Steinhauser A., 2008. Biogas from waste and renewable resources.
Wiley-VCH, Weinheim, 57–79.
[7] Gajda I, Greenman J, Melhuish C, Ieropoulos I., 2015. Simultaneous electricity
generation and microbially-assisted electrosynthesis in ceramic MFCs.
Bioelectrochemistry 104, 58-64.
[8] Ghadge AN and Ghangrekar MM., 2015. Development of low cost ceramic
separator using mineral cation exchanger to enhance performance of microbial fuel
cells. Electrochim Acta 166, 320-328.
[9] Guo M, Song W and Buhain J., 2015. Bioenergy and biofuels: History, status, and
perspective. Renew Sust Energ Rev 42, 712-725.
[10] Heinimö J and Junginger M., 2009. Production and trading of biomass for energy –
An overview of the global status. Biomass Bioenerg 33(9), 1310–1320.
18
340
341
342
343
344
345
346
347
348
349
350
351
352
353
354
355
356
357
358
359
3536

[11] Ho DP, Ngo HH and Guo W., 2014. A mini review on renewable sources for biofuel.
Bioresource Technol 169, 742–749.
[12] Hernández-Fernández FJ, de los Ríos AP, Salar-García MJ, Ortiz-Marínez VM,
Lozano-Blanco LJ, Godínez C, Tomás-Alonso F, Quesada-Medina J., 2015. Recent
progress and perspectives in microbial fuel cells for bioenergy generation and
wastewater treatment. Fuel Processing Technol 138, 284–297.
[13] Kouzuma A and Watanabe K., 2015. Exploring the potential of algae/bacteria
interactions. Curr Opin Biotech 33, 125-129.
[14] Mao GZ, Liu X, Du HB, Zuo J, Wang LY., 2015. Way forward for alternative energy
research: A bibliometric analysis during 1994-2013. Renew Sust Energ Rev 48, 276-286.
[15] Oliveira VB, Simões M, Melo LF, Pinto AMFR., 2013. Overview on the
developments of microbial fuel cells. Biochem Eng J 73, 53–64.
[16] Park D.H. and Zeikus J.G. Improved fuel cell and electrode designs for producing
electricity from microbial degradation, Biotechnol. Bioeng. 81, 2003, 348–355.
[17] Potter MC., 1911. Electrical effects accompanying the decomposition of organic
compounds. Proc. R. Soc B, 84, 260–276.
[18] Rashid N, Cui YF, Saif Ur Rehman M, Han JI., 2013. Enhanced electricity generation
by using algae biomass and activated sludge in microbial fuel cell. Sci Total Environ,
456-457, 91-94.
19
360
361
362
363
364
365
366
367
368
369
370
371
372
373
374
375
376
377
378
3738
[19] Schenk P, Thomas-Hall S, Stephens E, Marx U, Mussgnug J, Posten C, Kruse O,
Hankamer B., 2008. Second generation biofuels: High efficiency microalgae for
biodiesel production. Bioenergy Res, 1(1), 20–43.
[20] Velasquez-Orta SB, Curtis TP and Logan BE., 2009. Energy from algae using
microbial fuel cells. Biotechnol Bioeng, 103(6), 1068-1076.
[21] Vergara-Fernández A, Vargas G, Alarcón N, Velasco A., 2008. Evaluation of marine
algae as a source of biogas in a two-stage anaerobic reactor system. Biomass Bioenerg,
32(4), 338–344.
[22] Winfield J, Chambers LD, Rossiter J, Ieropoulos I., 2013. Comparing the short and
long term stability of biodegradable, ceramic and cation exchange membranes in
microbial fuel cells. Bioresource Technol, 148, 480-486.
20
379
380
381
382
383
384
385
386
387
388
389
3940