manure management in canada
TRANSCRIPT
Manure Managementin Canada 2004, Vol. 1, No. 2
by Martin S. Beaulieu
Agricultural DivisionJean Talon Building, 12th floor, Ottawa, K1A 0T6
Telephone: 1 800-465-1991
This paper represents the views of the author and does not necessarily reflect the opinions of Statistics Canada.
Catalogue no. 21-021-MIE — No. 002
ISSN: 1708-1939
ISBN: 0-662-37067-8
Research Paper

How to obtain more information Specific inquiries about this product and related statistics should be directed to Client Services, agricultural Division, Statistics Canada at 1 800 465 – 1991 or by email: [email protected]. For information on the wide range of data available from Statistics Canada, you can contact us by calling one of our toll-free numbers. You can also contact us by e-mail by visiting our Web site. National inquiries line 1 800 263-1136 National telecommunications device for the hearing impaired 1 800 363-7629 E-mail inquiries [email protected] Web site www.statcan.ca Ordering and subscription information Farm Environmental Management in Canada, Catalogue no. 21-021-MIE, is available on the internet free of charge. Users can obtain copies at http://www.statcan.ca/english/freepub/21-021-MIE/free.htm. A free catalogue of products and services is available upon request. Standards of service to the public Statistics Canada is committed to serving its clients in a prompt, reliable and courteous manner and in the official language of their choice. To this end, the Agency has developed standards of service which its employees observe in serving its clients. To obtain a copy of these service standards, please contact Statistics Canada toll free at 1 800 263-1136. The publication Farm Environmental Management in Canada includes a series of articles aimed at publishing comprehensive results of the 2001 Farm Environmental Management Survey. It was prepared under the direction of: Editor:Robert Koroluk Survey Manager: Zoltan Somogyi Author: Martin S. Beaulieu Special thanks: Neil Rothwell Funding and assistance in the preparation of this publication were provided primarily by Agriculture and Agri-Food Canada under the National Agri-environmental Health Analysis and Reporting Program (NAHARP). This program is part of the environmental component of the Agriculture Policy Framework (APF).

Manure Management in Canada
2004, Vol. 1, No. 2
Statistics Canada Agriculture Division
Published by authority of the Minister responsible for Statistics Canada. © Minister of Industry, 2004 All rights reserved. No part of this publication may be reproduced, stored in a retrieval system or transmitted in any form or by any means, electronic, mechanical, photocopying, recording or otherwise without prior written permission from Licence Services, Marketing Division, Statistics Canada, Ottawa, Ontario, Canada K1A 0T6. June 2004 Catalogue no. 21-021-MIE ISSN: 1708-1939 ISBN: 0-662-37067-8 Frequency: Irregular Ottawa La version française de cette publication est disponible sur demande (n° 21-021-MIF au catalogue). Note of appreciation Canada owes the success of its statistical system to a long-standing partnership between Statistics Canada, its businesses, governments and other institutions. Accurate and timely statistical information could not be produced without their continued cooperation and goodwill.

Symbol Legend
The following standard symbols are used in Statistics Canada publications:
. not available for any reference period
.. not available for a specific reference period
… not applicable
0 true zero or a value rounded to zero
0s value rounded to 0 (zero) where there is ameaningful distinction between true zero and the value that was rounded
p preliminaryr revised
x suppressed to meet the confidentiality requirementsof the Statistics Act
E use with caution
F too unreliable to be published

Table of Contents
Page
Highlights…………………………………………………………………………… …...8 Introduction………………………………………………………………………… ……9 Manure Management Practices……...………………………………...…………….10 Seasonal application of manure …………..……………………………………….….10 Manure incorporation into soil………………………………………………................17 Treatment of stored manure…………………………………………………….……...22 Feeding strategies to reduce manure nutrient content……………..................... ...23 Control of odours from livestock buildings…………………….…….…………….….26 Development of formal manure management plans………………………………...29 Adoption of beneficial management practices for manure management……… ....32 Summary…………………………… ………………………………………………….35 Appendix A: Manure Production Coefficients......…………………………………..37 Appendix B: Statistical Tables………………………………………………………..39

Farm Environmental Management in Canada Article 2: Manure Management in Canada, June 2004 Catalogue no. 21-021-MIE
- 7 -
Manure Management in Canada Manure Management in Canada presents information on various characteristics of manure management as practised on Canadian farms. This analysis is based on results of the 2001 Farm Environmental Management Survey (FEMS) and discussion focuses mainly on farms raising some level of livestock, irrespective of the major commodities produced.
Canadian farmers are actively involved in environmental initiatives and are adopting farming practices that minimize pollution risks to air, water and soil, while contributing to the conservation of biodiversity. FEMS results provide useful information for measuring the adoption of environmentally sound practices and for assisting governments, farmers and non-governmental organizations in the promotion and development of new farm environmental programs and practices. FEMS results show that there are differences between provinces with respect to manure management practices.
Note to readers: Readers should be aware that FEMS data alone, though providing a wealth of information, are insufficient to assess environmental risks. The FEMS data are meant to provide an overall picture of various farming practices that may have an impact on the environment. To have a full appreciation of farmers’ adoption of environmental management practices and of their impacts (positive or negative) on the environment, additional information and more comprehensive analysis is required. Thus, readers are advised to use caution when interpreting these data.
A previous survey, the 1995 Farm Input Management Survey (FIMS), collected similar information on manure management in Canada. However, FIMS and FEMS data cannot be readily compared because of differences in survey design, sample size and questions asked.
Farm Environmental Management in Canada Article 2: Manure Management in Canada, June 2004 Catalogue no. 21-021-MIE
- 8 -
Highlights
The 2001 FEMS data show that nationally:
• Most manure was applied to the land during the fall and spring months respectively, while only a very small proportion of manure was applied during the winter months;
• Beef, dairy and hog production all showed seasonal differences in quantities of manure applied, though there was little difference in the seasonal application of manure between farms with smaller or larger herds;
• Almost half (47.1%) of the manure produced in 2001 was left on the field surface or incorporated into the soil more than a week after it was spread on the field while 17.7% of manure was injected into the soil or incorporated the same day it was applied to the land;
• More than half (53.3%) of beef cattle manure was left on the surface or incorporated into the soil after more than a week while 38.5% of hog manure was injected or incorporated into the soil the same day it was spread on the field; farms with larger herds had the largest proportions of manure injected or incorporated into the soil without delay;
• Most farms did not use feed additives or feeding strategies to reduce nutrient content of manure, though almost half (40.4%) of the largest hog farms used feed additives or rations to reduce manure nutrient content;
• About one-quarter of the farms used some method to control odours associated with livestock buildings. The highest share of livestock buildings with odour control methods were found on hog farms;
• About one-quarter of manure produced was on farms that had formal manure management plans required by government regulations, nutrient management plans or plans developed because of concerns for the environment;
• 32.6% of manure was on farms that had fully implemented beneficial management practices (BMPs) related to manure management while 15.9% of manure was on farms having partially implemented BMPs;
• 41.7% of manure was produced on farms where the respondents reported that they were unfamiliar with BMPs for manure in their region.

Farm Environmental Management in Canada Article 2: Manure Management in Canada, June 2004 Catalogue no. 21-021-MIE
- 9 -
1. Introduction Manure Management in Canada is the second article in a series of studies collectively called Farm Environmental Management in Canada. The objective of this series is to publish the results of the 2001 Farm Environmental Management Survey (FEMS).1 The series presents information about the farming practices used on Canadian farms as they relate to a number of agri-environmental topics such as manure handling, water management, chemical inputs and sustainable land management practices.
Agricultural activities by their very nature have a significant impact on the environment. Tillage practices alter natural landscapes, agricultural inputs enter ecosystems and animal by-products influence ecological balances. Because of environmental concerns, Canadian farmers are at the frontlines as stewards of the environment. Farmers are actively involved in environmental programs and are adopting farming practices that minimize pollution risks to air, water and soil, while contributing to the conservation of biodiversity. FEMS results provide useful information for measuring the adoption of environmentally-sound practices and assisting governments, farmers and non-governmental organizations in the promotion and development of farm environmental initiatives.
Manure Management in Canada provides information on the key livestock manure management practices that Canadian farmers followed in 2001. To assess the importance of
1 FEMS was conducted in March 2002 by Statistics Canada for Agriculture and Agri-Food Canada. The survey provides a broad coverage of farm management practices that are related to the environment in all sectors of Canadian agriculture.
these practices, results are often best presented on the basis of the amount of manure produced on farms rather than by the number of farms. The number of farms alone does not always give a full appreciation of the significance of the adoption of specific practices, in terms of potential affects on the environment. Practices on many small farms may not have the same environmental impact as the same practices on a few very large farms because of relatively lower production intensities. Conversely, the number of farms provides valuable information on the extent to which the farm community is aware of and has adopted farming practices that are more environmentally sound. The following analysis focuses more specifically on manure management practices used for the production of beef cattle, dairy cattle and hogs, which together generate the largest amount of manure on Canadian farms.2 Although the focus of this analysis is mainly at the national level, some highlights about manure management are also presented on a provincial basis.
The topics covered comprise most of the key characteristics of manure management.3 Topics include seasonal application of manure to the land, delay in incorporating manure into soil, treatment of stored manure, use of feeding strategies to reduce manure nutrient content, options used to control odours, implementation of manure management plans and adoption of beneficial management practices.
2 This article does not examine manure management practices on poultry and other livestock production due to data limitations. 3 The first article in this series, Manure Storage in Canada, addresses issues related specifically to manure storage systems. Readers can find this article on Statistics Canada’s web site at http://www.statcan.ca/english/freepub/21-021-MIE/free.htm .
Farm Environmental Management in Canada Article 2: Manure Management in Canada, June 2004 Catalogue no. 21-021-MIE
- 10 -
2. Manure management practices 2.1 Seasonal application of manure Though practices vary, livestock manure is ultimately disposed of by applying it to farmland. Manure application occurs at different times during the year, though usually from spring to fall. The timing of application depends on various factors such as weather conditions, stage of crop growth, labour availability and manure storage capacity. Manure storage capacity is an important factor, as storage facilities tend to be full after the winter months and require emptying. Furthermore, livestock producers need to ensure sufficient storage capacity is present in the fall for the coming winter months. Farmers raising livestock under confined conditions, in operations such as beef feedlots and dairy, hog and poultry barns, usually store manure until it can be conveniently applied to land. This is preferably done at a time when crops can benefit most from the nutrients in manure and when environmental risks from application are at a minimum. According to beneficial management practices, manure should be applied to land outside of the frost season.
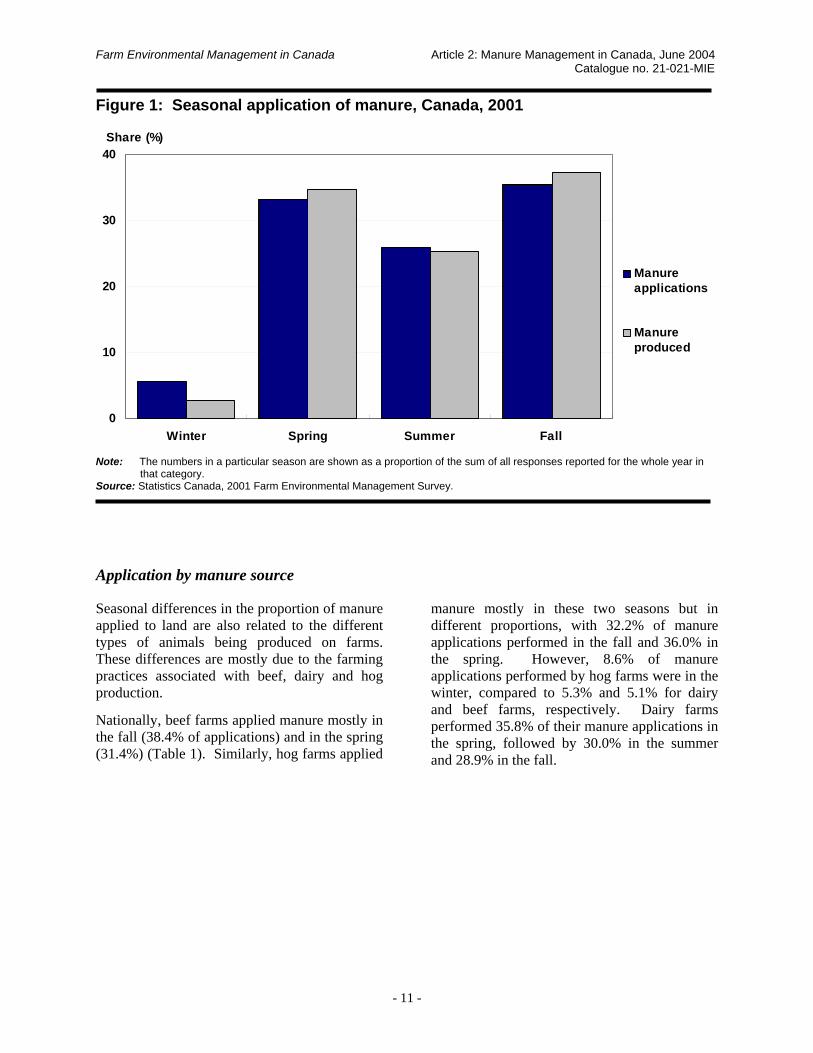
Nationally, FEMS results show that farms applied manure mostly in the fall (35.4% of applications), followed closely by applications in the spring (33.2%), as shown in Figure 1. About one-quarter (25.9%) of manure applications were performed in the summer months. In comparison, 5.5% of manure applications, by far the lowest proportion, were in winter, generally considered an unfavourable time because of the potential for run-off due to frozen ground. It should be noted that the figures quoted above were generated by using the sum of all the responses given for each season as the denominator.
During the survey, Canadian farmers reported the percentage of the manure produced on their farms in 2001 that was applied in each season. Annual manure production, as-excreted, was estimated for each farm on the basis of livestock inventories on farms as reported on the 2001 Census of Agriculture.4 FEMS results show that nationally 37.3% of manure was applied in fall, 34.7% was applied in the spring and 25.3% in the summer. A smaller proportion (2.7%) of manure was applied during the winter months.
4 FEMS results have been combined with estimated manure production coefficients and 2001 Census of Agriculture livestock numbers to estimate annual manure production, helping to illustrate the significance of the many survey results. (For details on the methodology used to calculate manure production, see Appendix 1.) Throughout the article, we will refer to these extended calculations as FEMS results.
Farm Environmental Management in Canada Article 2: Manure Management in Canada, June 2004 Catalogue no. 21-021-MIE
- 11 -
Figure 1: Seasonal application of manure, Canada, 2001
0
10
20
30
40
Winter Spring Summer Fall
Manureapplications
Manureproduced
Share (%)
Note: The numbers in a particular season are shown as a proportion of the sum of all responses reported for the whole year in that category. Source: Statistics Canada, 2001 Farm Environmental Management Survey. Application by manure source
Seasonal differences in the proportion of manure applied to land are also related to the different types of animals being produced on farms. These differences are mostly due to the farming practices associated with beef, dairy and hog production.
Nationally, beef farms applied manure mostly in the fall (38.4% of applications) and in the spring (31.4%) (Table 1). Similarly, hog farms applied
manure mostly in these two seasons but in different proportions, with 32.2% of manure applications performed in the fall and 36.0% in the spring. However, 8.6% of manure applications performed by hog farms were in the winter, compared to 5.3% and 5.1% for dairy and beef farms, respectively. Dairy farms performed 35.8% of their manure applications in the spring, followed by 30.0% in the summer and 28.9% in the fall.

Farm Environmental Management in Canada Article 2: Manure Management in Canada, June 2004 Catalogue no. 21-021-MIE
- 12 -
Table 1. Seasonal application of manure, by animal type, Canada, 2001
Beef cattle 5.1 31.4 25.1 38.4
Dairy cattle 5.3 35.8 30.0 28.9
Hog 8.6 36.0 23.2 32.2
Share of manure applications (%)
Winter Spring Summer Fall
Notes: 1. Where no error letter appears by a number the standard error ranges between 0.005% and 12.49%. Results are considered excellent to acceptable. 2. The numbers in a particular season are shown as a proportion of the sum of all responses reported for the whole year in that category. Due to rounding, figures may not add up to totals. Source: Statistics Canada, 2001 Farm Environmental Management Survey.
Beef cattle are produced using a variety of production systems ranging from small, pasture-based cow-calf operations to large intensive feedlots raising cattle in enclosed pens or corrals. Nationally, 43.6% of beef cattle manure was applied to the land in the fall and 29.9% in the spring (Figure 2). These differences could be explained by a number of factors. First, early spring is a busy period on some cattle operations
because of calving and spring seeding operations and farmers may not have time for applying manure. Second, beef producers usually need to empty their storage facilities before winter and must do this in fall if they haven’t had the opportunity to do it before then. More time is usually available after harvest for this task and the farmer does not need to worry about interfering with the progress of growing crops.
Figure 2: Proportion of manure applied, by season of application and animal type, Canada, 2001
0
10
20
30
40
50
Winter Spring Summer Fall
Beef cattleDairy cattleHog
Share (%) of manure produced
Source: Statistics Canada, 2001 Farm Environmental Management Survey.
Farm Environmental Management in Canada Article 2: Manure Management in Canada, June 2004 Catalogue no. 21-021-MIE
- 13 -
Dairy cattle, especially on small- and medium-size enterprises, are usually raised indoors during the winter months and mostly outdoors during the rest of the year. About 40% of dairy cattle manure production was applied to the land in the spring and about one-quarter (24.8%) was applied in the fall. However, this seasonal pattern may change as dairy operations increase in size and more animals are confined indoors all year round.
Hog farms make use of liquid manure storage systems to the greatest extent amongst livestock producers and usually empty their manure storage tanks prior to and after winter. As with dairy producers, farmers raising hogs applied the largest amount of manure (43.6%) to land during the spring. But like beef producers, hog farmers applied relatively less manure to land during the summer (20.8%), with almost one-third (32.7%) of manure produced being applied in fall. Application of liquid manure in the warmer summer months without injection into the soil could result in a significant amount of nutrient evaporation into the air, with the potential of odours affecting neighbouring areas.
Regional characteristics of manure application
Regional differences in the seasonal application of manure to the land are mostly due to variations in local climatic conditions, agronomic environment, types of animals raised, manure storage systems used and environmental regulations. However, winter application is not generally recommended in any region because frozen land cannot absorb nutrients contained in manure. It is important to note that individual farms often apply manure in more than one season. Consequently, a farm can be counted more than once and the share of farms with livestock will sum to more than 100%. In contrast, the quantity of manure applied represents a discrete count. Therefore, the share of manure applied will sum to 100%.
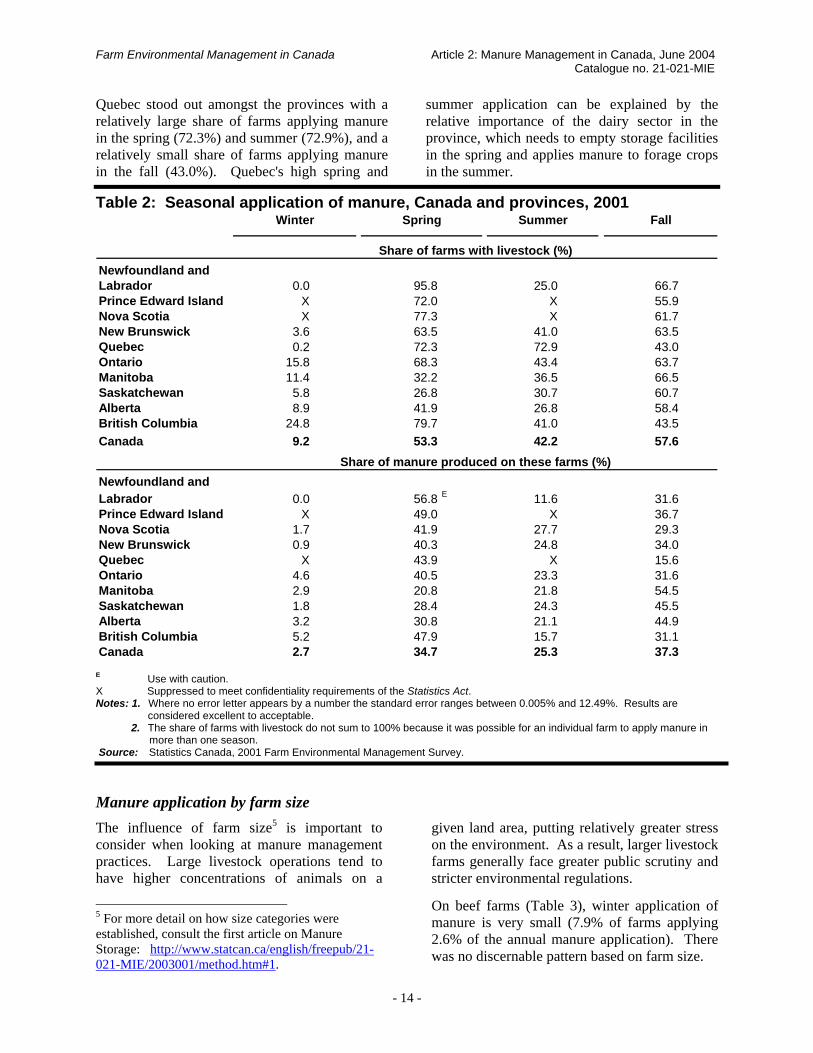
Table 2 shows that one-quarter of livestock farms in British Columbia applied some manure in winter in 2001, however the actual quantity of manure was low (5.2%). In Ontario, 15.8% percent of livestock farms applied manure in winter. In the southern parts of British Columbia and Ontario, relatively mild winters make it
possible to apply some manure in early winter. No farmers reported applying manure during the winter in Newfoundland and Labrador and only 0.2% of farms in Quebec reported winter application. Significant numbers of farms in the Prairie provinces reported applying some manure in winter, but in all cases the quantities applied were small.
In Canada as a whole, the share of farms applying manure in the spring and fall were similar. However, there was a marked regional pattern. In the spring, the share of farms applying manure in Eastern and Central Canada and British Columbia varied between 63.5% and 95.8% while in the Prairie provinces the comparable numbers ranged between 26.8% and 41.9%. In the fall, the share of farms applying manure was fairly constant across all provinces (at around 60%).
In the spring, the share of manure applied in the non-Prairie provinces averaged about one-half of that applied throughout the year, while the share in the Prairie provinces was approximately one-quarter.
In the fall, the non-Prairie provinces applied around one-third of their annual manure application. In contrast, the comparable share of manure applied in the Prairie provinces varied between 44.9% and 54.5%.
In the Prairie provinces, a larger proportion of manure application takes place in the fall because spring is often too busy a time to apply manure while crop growth reduces opportunities to apply manure in the summer. Moreover, manure storage facilities need to be emptied before the prairie winter.
In Canada as a whole, 42.2% of farms applied manure in the summer. The Prairie provinces were somewhat below this average, varying between one-quarter and one-third, while Quebec was considerably higher (72.9%).
With two exceptions, the share of manure applied in the summer was broadly consistent across all the provinces (approximately one-quarter). The two exceptions were Newfoundland and Labrador (only 11.6% of annual manure applied) and British Columbia (15.7% of annual manure applied).
Farm Environmental Management in Canada Article 2: Manure Management in Canada, June 2004 Catalogue no. 21-021-MIE
- 14 -
Quebec stood out amongst the provinces with a relatively large share of farms applying manure in the spring (72.3%) and summer (72.9%), and a relatively small share of farms applying manure in the fall (43.0%). Quebec's high spring and
summer application can be explained by the relative importance of the dairy sector in the province, which needs to empty storage facilities in the spring and applies manure to forage crops in the summer.
Table 2: Seasonal application of manure, Canada and provinces, 2001
Newfoundland and Labrador 0.0 95.8 25.0 66.7Prince Edward Island X 72.0 X 55.9Nova Scotia X 77.3 X 61.7New Brunswick 3.6 63.5 41.0 63.5Quebec 0.2 72.3 72.9 43.0Ontario 15.8 68.3 43.4 63.7Manitoba 11.4 32.2 36.5 66.5Saskatchewan 5.8 26.8 30.7 60.7Alberta 8.9 41.9 26.8 58.4British Columbia 24.8 79.7 41.0 43.5Canada 9.2 53.3 42.2 57.6
Newfoundland andLabrador 0.0 56.8 E 11.6 31.6Prince Edward Island X 49.0 X 36.7Nova Scotia 1.7 41.9 27.7 29.3New Brunswick 0.9 40.3 24.8 34.0Quebec X 43.9 X 15.6Ontario 4.6 40.5 23.3 31.6Manitoba 2.9 20.8 21.8 54.5Saskatchewan 1.8 28.4 24.3 45.5Alberta 3.2 30.8 21.1 44.9British Columbia 5.2 47.9 15.7 31.1Canada 2.7 34.7 25.3 37.3
Share of farms with livestock (%)
Share of manure produced on these farms (%)
Winter Spring Summer Fall
E Use with caution. X Suppressed to meet confidentiality requirements of the Statistics Act. Notes: 1. Where no error letter appears by a number the standard error ranges between 0.005% and 12.49%. Results are considered excellent to acceptable. 2. The share of farms with livestock do not sum to 100% because it was possible for an individual farm to apply manure in more than one season. Source: Statistics Canada, 2001 Farm Environmental Management Survey.
Manure application by farm size The influence of farm size5 is important to consider when looking at manure management practices. Large livestock operations tend to have higher concentrations of animals on a
5 For more detail on how size categories were established, consult the first article on Manure Storage: http://www.statcan.ca/english/freepub/21-021-MIE/2003001/method.htm#1.
given land area, putting relatively greater stress on the environment. As a result, larger livestock farms generally face greater public scrutiny and stricter environmental regulations.
On beef farms (Table 3), winter application of manure is very small (7.9% of farms applying 2.6% of the annual manure application). There was no discernable pattern based on farm size.
Farm Environmental Management in Canada Article 2: Manure Management in Canada, June 2004 Catalogue no. 21-021-MIE
- 15 -
In spring, nearly one-half of beef farms applied manure to the land and the share of manure applied was 29.9%. There was a consistent rise in the share of manure applied according to farm size. The share rose from 27.3% for farms with less than 163 head of beef cattle to 34.8% with farms with more than 425 head.
In the summer, a little more than one-third of beef farms applied manure to the land. The share of manure applied during this season was 24.0%. There was no obvious pattern based on farm size.
In the fall, more beef farms (57.7%) applied manure to the land than in any other season. The share of manure applied was also the highest (43.6%). There was a general pattern of a declining share of manure applied with increasing farm size (from 45.7% of the smallest beef farms to 38.2% of the largest farms).
Amongst dairy farms, one-tenth applied manure to the land in winter. However, this volume represented only 2.6% of the manure applied throughout the year by all dairy farms. There was no pattern based on farm size.
In contrast to beef farms, spring represented the highest share of dairy farms applying manure to the land (approximately three-quarters) and the highest share of manure applied (40.8%). Moreover, there was a general pattern of a rising share of manure applied with increasing farm size (from 34.9% by farms with less than 47 head to 42.9% by farms with more than 131 head).
In summer, nearly two-thirds of dairy farms applied manure to the land, producing 31.7% of the manure applied throughout the year. Unlike the spring, there was a consistent decline in the share of manure applied to the land with increasing farm size (from 36.2% by farms with less than 47 head down to 28.6% by farms with more than 131 head).
In fall, 60.8% of dairy farms applied manure to the land. These farms applied a little under one-
quarter of the total manure applied throughout the year by dairy farms. For farms with less than 132 head there was a consistent decline in the share of manure applied to the land with increasing farm size (from 26.1% to 23.0%). However, the share of manure applied in the fall by the largest dairy farms was the highest for this season (26.2%).
In winter, hog farms had both a larger share of farms applying manure to the land (17.8%), and a larger share of manure applied to the land (2.9%) than either beef farms or dairy farms. The share of manure applied in winter by hog farms also consistently declined with increasing farm size (from 5.1% by farms with less than 566 head to 2.3% by farms with more than 1,594 head). This pattern suggests a lower manure storage capacity on farms with smaller herds. It is more difficult for operators of smaller farms, which often operate under tight margins, to make the capital investments required to increase their manure storage capacity. Consequently, some are forced to empty manure storage systems and to apply it to the land during the frost season.
In spring, almost three-quarters of hog farms applied manure to the land. The share of manure applied in this season was 43.6%. There was no obvious pattern based on farm size.
In summer, a little under one-half of hog farms applied manure to the land and the manure produced accounted for 20.8% of the total manure applied throughout the year. The share of manure applied to the land consistently declined with increasing farm size (from 24.9% by the smallest farms to 19.3% by the largest farms).
A majority (65.9%) of hog farms applied manure to the land in the fall. This was a higher proportion than that seen on both beef farms and dairy farms in this season. The share of manure applied during the fall by hog farms was just under one-third. There was no obvious pattern based on farm size.

Farm Environmental Management in Canada Article 2: Manure Management in Canada, June 2004 Catalogue no. 21-021-MIE
- 16 -
Table 3: Seasonal application of manure, by size of herd, Canada, 2001
Beef cattle1-162 head 7.5 46.5 37.9 57.3163-281 head 11.1 46.3 33.5 63.0282-425 head 6.1 47.2 35.0 58.6426 or more head 16.0 56.1 44.5 55.5All farm sizes 7.9 46.8 37.7 57.7
Dairy cows and heifers1-46 head 10.2 61.7 54.3 54.047-81 head 8.7 77.1 68.2 61.582-131 head 14.7 89.8 69.1 66.5132 or more head 14.9 89.1 71.6 71.1All farm sizes 10.9 75.3 63.9 60.8
Hogs1-565 head 18.5 62.8 42.1 62.7566-981 head 22.6 93.0 60.5 71.2982-1,594 head 15.9 87.0 53.9 65.91,595 or more head 13.8 90.2 53.5 72.3All farm sizes 17.8 74.8 48.0 65.9
Beef cattle1-162 head 2.0 27.3 25.0 45.7163-281 head 3.9 28.9 20.9 46.3282-425 head 1.1 33.8 24.8 40.4426 or more head 3.3 34.8 23.7 38.2All farm sizes 2.6 29.9 24.0 43.6
Dairy cows and heifers1-46 head 2.9 34.9 36.2 26.147-81 head 1.9 39.5 33.9 24.782-131 head 3.7 43.4 29.9 23.0132 or more head 2.3 42.9 28.6 26.2All farm sizes 2.6 40.8 31.7 24.8
Hogs1-565 head 5.1 37.5 24.9 32.5566-981 head 4.2 46.0 24.4 25.5982-1,594 head 3.2 46.9 22.4 27.41,595 or more head 2.3 43.2 19.3 35.2All farm sizes 2.9 43.6 20.8 32.7
Fall
Share of farms with livestock (%)
Share of manure produced on these farms (%)
Herd sizeWinter Spring Summer
Notes: 1. Where no error letter appears by a number the standard error ranges between 0.005% and 12.49%. Results are considered excellent to acceptable. 2. The share of farms with livestock do not sum to 100% because it was possible for an individual farm to apply manure in more than one season. Source: Statistics Canada, 2001 Farm Environmental Management Survey.
Farm Environmental Management in Canada Article 2: Manure Management in Canada, June 2004 Catalogue no. 21-021-MIE
- 17 -
2.2 Manure incorporation into soil Manure incorporation delay Different methods can be used to apply manure to land, including solid spreaders, liquid spreaders, liquid injectors and irrigation systems. If manure is spread on the surface of the soil, BMPs usually recommend that manure be then incorporated into the soil in order to minimize environmental risks and improve nutrient utilization. Injection of liquid manure and incorporation of solid manure without much delay are practices that reduce the amount of ammonia lost into the air. By incorporating manure rapidly into the soil, farmers minimize odours and nutrient loss due to evaporation. Delay in incorporating manure into soil depends on the type of manure (solid, semi-solid or liquid) and the application method.
Injection has the advantage of leaving more crop residue on the soil surface. Greater residue reduces both the risk of soil erosion and the loss of nutrients due to water run-off or evaporation.
However, the incorporation of solid manure is more resource intensive (in terms of labour and fuel) than spreading applications that leave manure on the surface of the field.
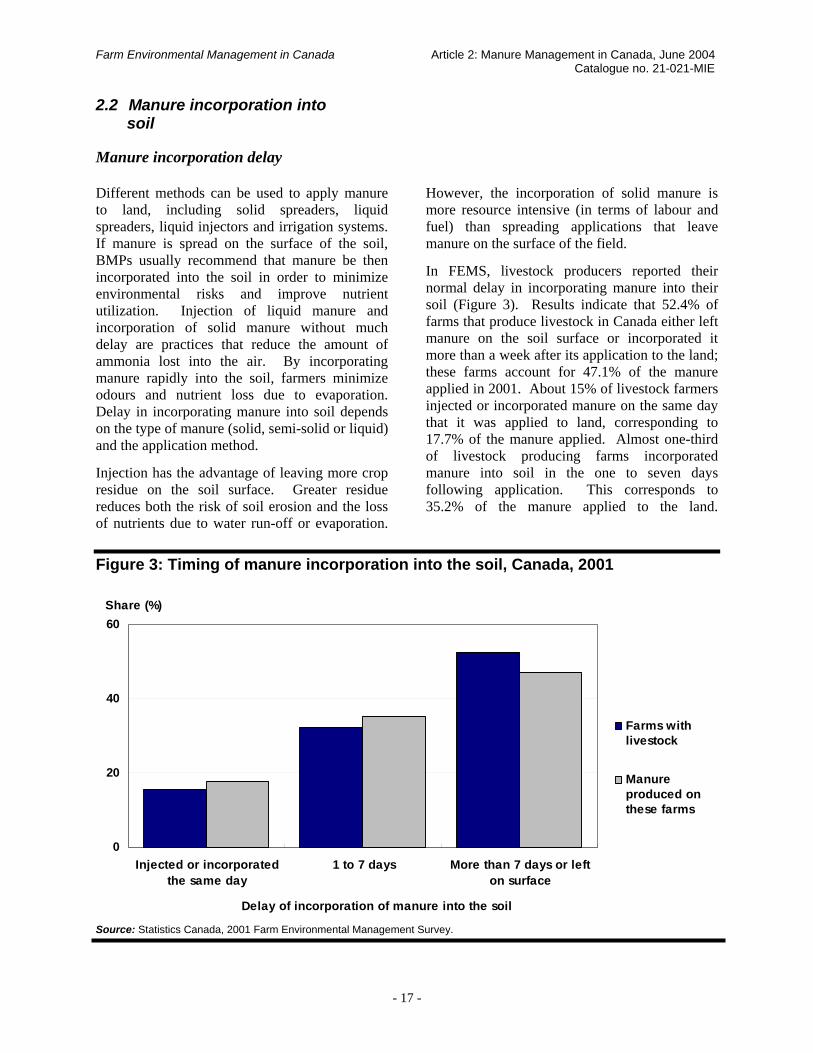
In FEMS, livestock producers reported their normal delay in incorporating manure into their soil (Figure 3). Results indicate that 52.4% of farms that produce livestock in Canada either left manure on the soil surface or incorporated it more than a week after its application to the land; these farms account for 47.1% of the manure applied in 2001. About 15% of livestock farmers injected or incorporated manure on the same day that it was applied to land, corresponding to 17.7% of the manure applied. Almost one-third of livestock producing farms incorporated manure into soil in the one to seven days following application. This corresponds to 35.2% of the manure applied to the land.
Figure 3: Timing of manure incorporation into the soil, Canada, 2001
0
20
40
60
Injected or incorporatedthe same day
1 to 7 days More than 7 days or lefton surface
Farms withlivestock
Manureproduced onthese farms
Delay of incorporation of manure into the soil
Share (%)
Source: Statistics Canada, 2001 Farm Environmental Management Survey.
Farm Environmental Management in Canada Article 2: Manure Management in Canada, June 2004 Catalogue no. 21-021-MIE
- 18 -
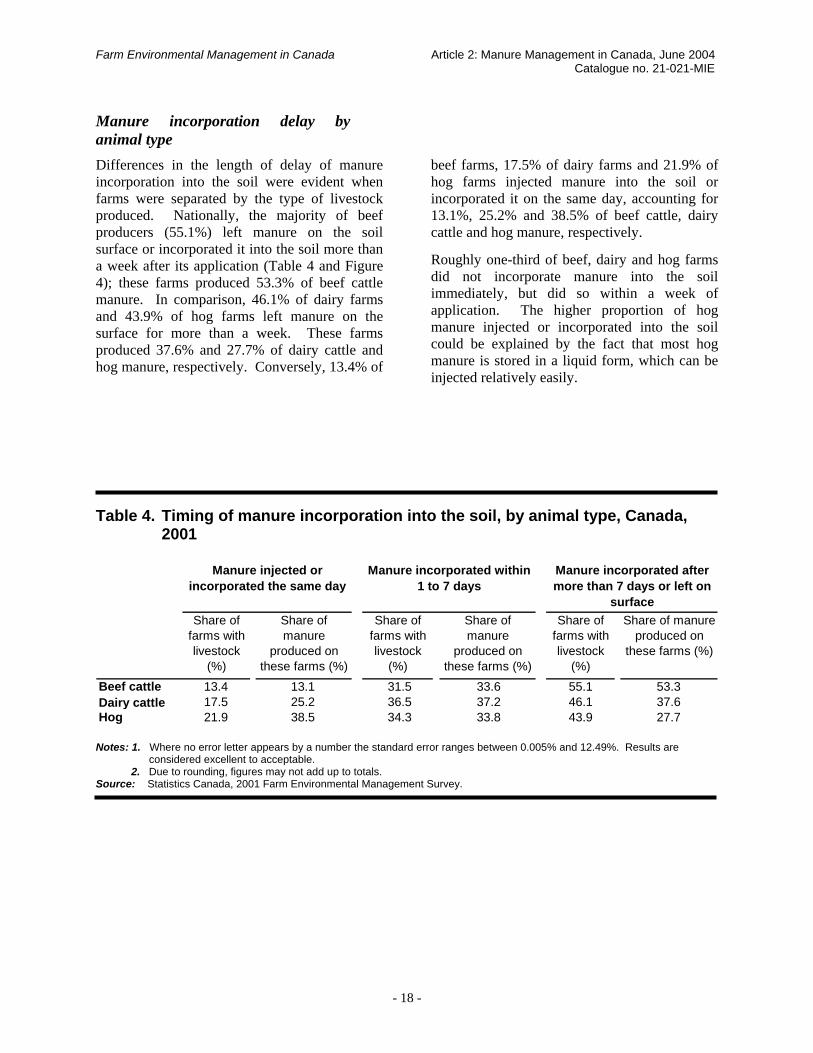
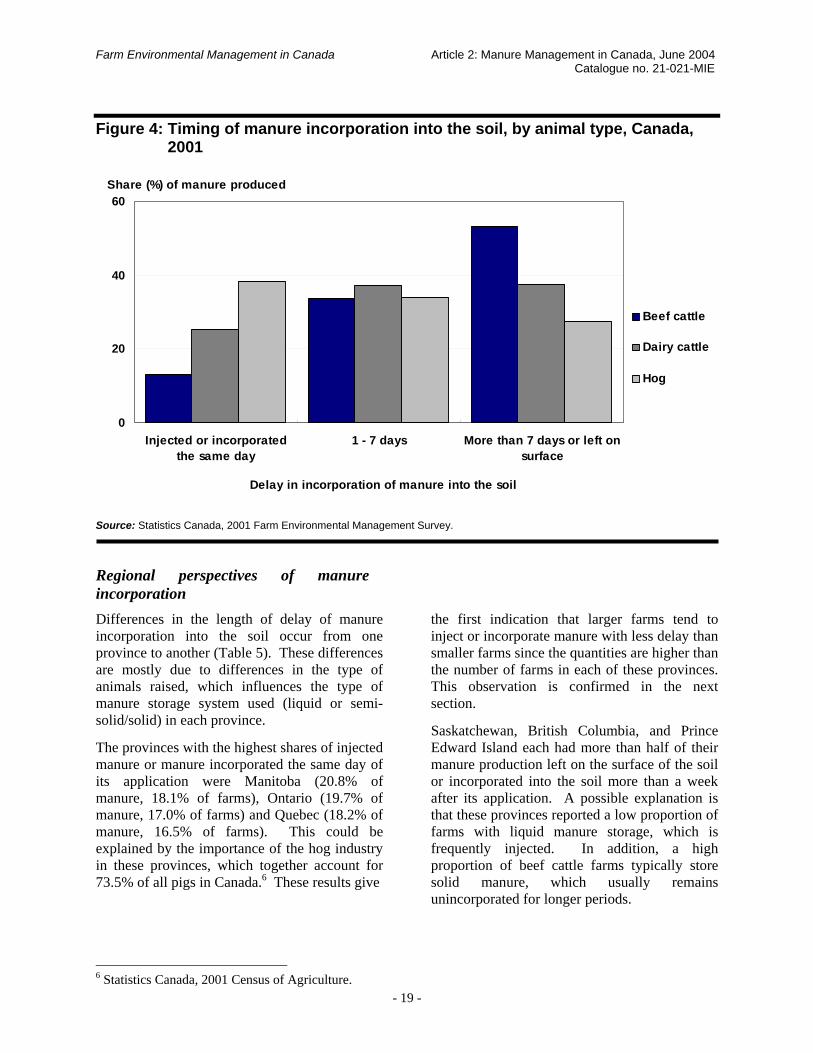
Manure incorporation delay by animal type Differences in the length of delay of manure incorporation into the soil were evident when farms were separated by the type of livestock produced. Nationally, the majority of beef producers (55.1%) left manure on the soil surface or incorporated it into the soil more than a week after its application (Table 4 and Figure 4); these farms produced 53.3% of beef cattle manure. In comparison, 46.1% of dairy farms and 43.9% of hog farms left manure on the surface for more than a week. These farms produced 37.6% and 27.7% of dairy cattle and hog manure, respectively. Conversely, 13.4% of
beef farms, 17.5% of dairy farms and 21.9% of hog farms injected manure into the soil or incorporated it on the same day, accounting for 13.1%, 25.2% and 38.5% of beef cattle, dairy cattle and hog manure, respectively.
Roughly one-third of beef, dairy and hog farms did not incorporate manure into the soil immediately, but did so within a week of application. The higher proportion of hog manure injected or incorporated into the soil could be explained by the fact that most hog manure is stored in a liquid form, which can be injected relatively easily.
Table 4. Timing of manure incorporation into the soil, by animal type, Canada,
2001
Beef cattle 13.4 13.1 31.5 33.6 55.1 53.3Dairy cattle 17.5 25.2 36.5 37.2 46.1 37.6Hog 21.9 38.5 34.3 33.8 43.9 27.7
Manure incorporated after more than 7 days or left on
surfaceShare of
farms with livestock
(%)
Share of manure
produced on these farms (%)
Share of manure produced on
these farms (%)
Share of farms with livestock
(%)
Share of manure
produced on these farms (%)
Share of farms with livestock
(%)
Manure injected or incorporated the same day
Manure incorporated within 1 to 7 days
Notes: 1. Where no error letter appears by a number the standard error ranges between 0.005% and 12.49%. Results are considered excellent to acceptable. 2. Due to rounding, figures may not add up to totals. Source: Statistics Canada, 2001 Farm Environmental Management Survey.
Farm Environmental Management in Canada Article 2: Manure Management in Canada, June 2004 Catalogue no. 21-021-MIE
- 19 -
Figure 4: Timing of manure incorporation into the soil, by animal type, Canada,
2001
0
20
40
60
Injected or incorporatedthe same day
1 - 7 days More than 7 days or left onsurface
Beef cattle
Dairy cattle
Hog
Delay in incorporation of manure into the soil
Share (%) of manure produced
Source: Statistics Canada, 2001 Farm Environmental Management Survey.
Regional perspectives of manure incorporation Differences in the length of delay of manure incorporation into the soil occur from one province to another (Table 5). These differences are mostly due to differences in the type of animals raised, which influences the type of manure storage system used (liquid or semi-solid/solid) in each province.
The provinces with the highest shares of injected manure or manure incorporated the same day of its application were Manitoba (20.8% of manure, 18.1% of farms), Ontario (19.7% of manure, 17.0% of farms) and Quebec (18.2% of manure, 16.5% of farms). This could be explained by the importance of the hog industry in these provinces, which together account for 73.5% of all pigs in Canada.6 These results give
6 Statistics Canada, 2001 Census of Agriculture.
the first indication that larger farms tend to inject or incorporate manure with less delay than smaller farms since the quantities are higher than the number of farms in each of these provinces. This observation is confirmed in the next section.
Saskatchewan, British Columbia, and Prince Edward Island each had more than half of their manure production left on the surface of the soil or incorporated into the soil more than a week after its application. A possible explanation is that these provinces reported a low proportion of farms with liquid manure storage, which is frequently injected. In addition, a high proportion of beef cattle farms typically store solid manure, which usually remains unincorporated for longer periods.

Farm Environmental Management in Canada Article 2: Manure Management in Canada, June 2004 Catalogue no. 21-021-MIE
- 20 -
Table 5: Timing of manure incorporation into the soil, Canada and provinces,
2001
Newfoundland and Labrador X X X F 71.7 FPrince Edward Island X 13.8 X 32.8 60.9 53.5Nova Scotia 9.8 X 20.2 X 69.9 XNew Brunswick 14.7 15.6 31.8 40.7 53.5 43.7Quebec 16.5 18.2 35.7 36.7 47.8 45.1Ontario 17.0 19.7 38.5 42.8 44.6 37.4Manitoba 18.1 20.8 31.5 33.5 50.4 45.7Saskatchewan 9.4 13.9 25.1 29.8 65.5 56.3Alberta 15.9 17.9 27.8 34.0 56.3 48.0British Columbia 11.3 15.6 20.0 29.0 68.7 55.4Canada 15.3 17.7 32.2 35.2 52.4 47.1
Manure incorporated within 1 to 7 days
Manure incorporated after more than 7 days or
left on surface
Share of farms with livestock
(%)
Share of manure
produced on these farms
(%)
Share of farms with livestock
(%)
Share of manure
produced on these farms
(%)
Share of farms with livestock
(%)
Share of manure
produced on these farms
(%)
Manure injected or incorporated the same
day
F Too unreliable to publish. X Suppressed to meet confidentiality requirements of the Statistics Act. Notes: 1. Where no error letter appears by a number the standard error ranges between 0.005% and 12.49%. Results are considered excellent to acceptable. 2. Due to rounding, figures may not add up to totals. Source: Statistics Canada, 2001 Farm Environmental Management Survey.
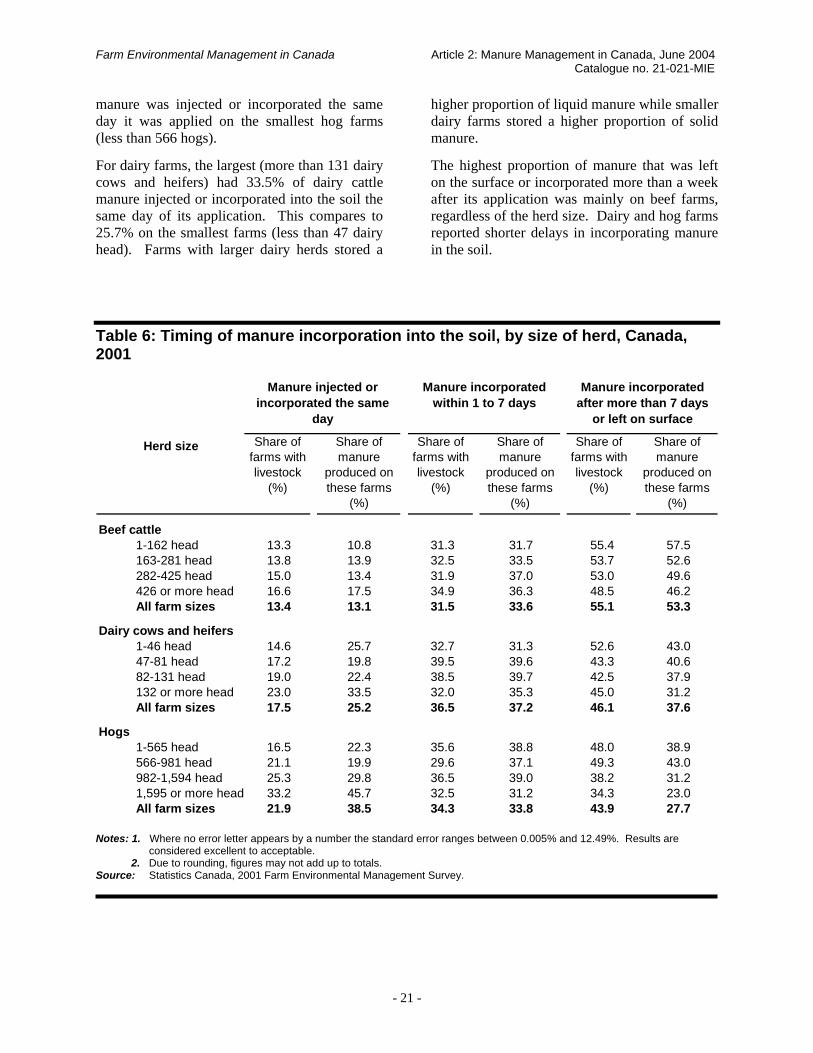
Manure incorporation delay by farm size Table 6 shows that there are differences in the length of delay of incorporating manure into the soil related to herd size. As the size of beef cattle farms increased, manure was more rapidly incorporated, thus leaving less manure on the surface for more than a week. For example, 51.5% of large beef cattle farms (426 or more head), producing 53.8% of beef cattle manure, either injected or incorporated manure within a week of application. In comparison, 44.6% of small beef farms (less than 163 head), which produced 42.5% of beef cattle manure, injected or incorporated manure within a week of application. However, regardless of farm size, beef farms had the highest percentage of manure left on the ground for more than a week.
Similarly, larger dairy and hog farms injected or incorporated manure into the soil to a greater extent than smaller farms. For example, 23.0% of the largest dairy farms (more than 131 dairy cows and heifers), corresponding to 33.5% of dairy cattle manure production, injected or incorporated manure on the same day of application. Similarly, 33.2% of hog farms, producing 45.7% of hog manure, injected or incorporated manure on the same day of application. The largest hog farms injected or incorporated manure without delay to the greatest extent, as one-third of these farms incorporated almost half of the manure they produced on the same day that manure was applied to their land. In comparison, 22.3% of
Farm Environmental Management in Canada Article 2: Manure Management in Canada, June 2004 Catalogue no. 21-021-MIE
- 21 -
manure was injected or incorporated the same day it was applied on the smallest hog farms (less than 566 hogs).
For dairy farms, the largest (more than 131 dairy cows and heifers) had 33.5% of dairy cattle manure injected or incorporated into the soil the same day of its application. This compares to 25.7% on the smallest farms (less than 47 dairy head). Farms with larger dairy herds stored a
higher proportion of liquid manure while smaller dairy farms stored a higher proportion of solid manure.
The highest proportion of manure that was left on the surface or incorporated more than a week after its application was mainly on beef farms, regardless of the herd size. Dairy and hog farms reported shorter delays in incorporating manure in the soil.
Table 6: Timing of manure incorporation into the soil, by size of herd, Canada, 2001
1-162 head 13.3 10.8 31.3 31.7 55.4 57.5163-281 head 13.8 13.9 32.5 33.5 53.7 52.6282-425 head 15.0 13.4 31.9 37.0 53.0 49.6426 or more head 16.6 17.5 34.9 36.3 48.5 46.2All farm sizes 13.4 13.1 31.5 33.6 55.1 53.3
Dairy cows and heifers1-46 head 14.6 25.7 32.7 31.3 52.6 43.047-81 head 17.2 19.8 39.5 39.6 43.3 40.682-131 head 19.0 22.4 38.5 39.7 42.5 37.9132 or more head 23.0 33.5 32.0 35.3 45.0 31.2All farm sizes 17.5 25.2 36.5 37.2 46.1 37.6
Hogs1-565 head 16.5 22.3 35.6 38.8 48.0 38.9566-981 head 21.1 19.9 29.6 37.1 49.3 43.0982-1,594 head 25.3 29.8 36.5 39.0 38.2 31.21,595 or more head 33.2 45.7 32.5 31.2 34.3 23.0All farm sizes 21.9 38.5 34.3 33.8 43.9 27.7
Manure incorporated after more than 7 days
or left on surface
Share of farms with livestock
(%)
Share of manure
produced on these farms
(%)
Share of farms with livestock
(%)
Share of manure
produced on these farms
(%)
Share of farms with livestock
(%)
Share of manure
produced on these farms
(%)
Beef cattle
Herd size
Manure injected or incorporated the same
day
Manure incorporated within 1 to 7 days
Notes: 1. Where no error letter appears by a number the standard error ranges between 0.005% and 12.49%. Results are considered excellent to acceptable. 2. Due to rounding, figures may not add up to totals. Source: Statistics Canada, 2001 Farm Environmental Management Survey.
Farm Environmental Management in Canada Article 2: Manure Management in Canada, June 2004 Catalogue no. 21-021-MIE
- 22 -
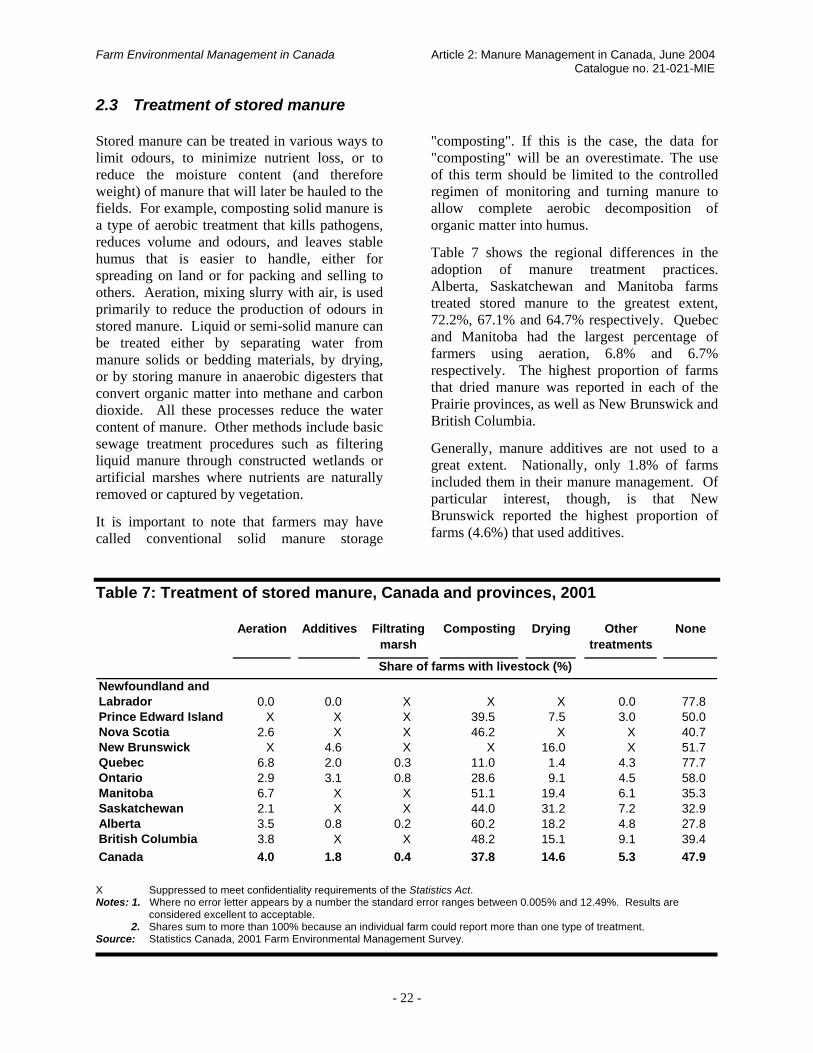
2.3 Treatment of stored manure Stored manure can be treated in various ways to limit odours, to minimize nutrient loss, or to reduce the moisture content (and therefore weight) of manure that will later be hauled to the fields. For example, composting solid manure is a type of aerobic treatment that kills pathogens, reduces volume and odours, and leaves stable humus that is easier to handle, either for spreading on land or for packing and selling to others. Aeration, mixing slurry with air, is used primarily to reduce the production of odours in stored manure. Liquid or semi-solid manure can be treated either by separating water from manure solids or bedding materials, by drying, or by storing manure in anaerobic digesters that convert organic matter into methane and carbon dioxide. All these processes reduce the water content of manure. Other methods include basic sewage treatment procedures such as filtering liquid manure through constructed wetlands or artificial marshes where nutrients are naturally removed or captured by vegetation.
It is important to note that farmers may have called conventional solid manure storage
"composting". If this is the case, the data for "composting" will be an overestimate. The use of this term should be limited to the controlled regimen of monitoring and turning manure to allow complete aerobic decomposition of organic matter into humus.
Table 7 shows the regional differences in the adoption of manure treatment practices. Alberta, Saskatchewan and Manitoba farms treated stored manure to the greatest extent, 72.2%, 67.1% and 64.7% respectively. Quebec and Manitoba had the largest percentage of farmers using aeration, 6.8% and 6.7% respectively. The highest proportion of farms that dried manure was reported in each of the Prairie provinces, as well as New Brunswick and British Columbia.
Generally, manure additives are not used to a great extent. Nationally, only 1.8% of farms included them in their manure management. Of particular interest, though, is that New Brunswick reported the highest proportion of farms (4.6%) that used additives.
Table 7: Treatment of stored manure, Canada and provinces, 2001
Newfoundland and Labrador 0.0 0.0 X X X 0.0 77.8Prince Edward Island X X X 39.5 7.5 3.0 50.0Nova Scotia 2.6 X X 46.2 X X 40.7New Brunswick X 4.6 X X 16.0 X 51.7Quebec 6.8 2.0 0.3 11.0 1.4 4.3 77.7Ontario 2.9 3.1 0.8 28.6 9.1 4.5 58.0Manitoba 6.7 X X 51.1 19.4 6.1 35.3Saskatchewan 2.1 X X 44.0 31.2 7.2 32.9Alberta 3.5 0.8 0.2 60.2 18.2 4.8 27.8British Columbia 3.8 X X 48.2 15.1 9.1 39.4Canada 4.0 1.8 0.4 37.8 14.6 5.3 47.9
Share of farms with livestock (%)
Aeration Additives Filtrating marsh
Composting Drying Other treatments
None
X Suppressed to meet confidentiality requirements of the Statistics Act. Notes: 1. Where no error letter appears by a number the standard error ranges between 0.005% and 12.49%. Results are considered excellent to acceptable. 2. Shares sum to more than 100% because an individual farm could report more than one type of treatment. Source: Statistics Canada, 2001 Farm Environmental Management Survey.
Farm Environmental Management in Canada Article 2: Manure Management in Canada, June 2004 Catalogue no. 21-021-MIE
- 23 -
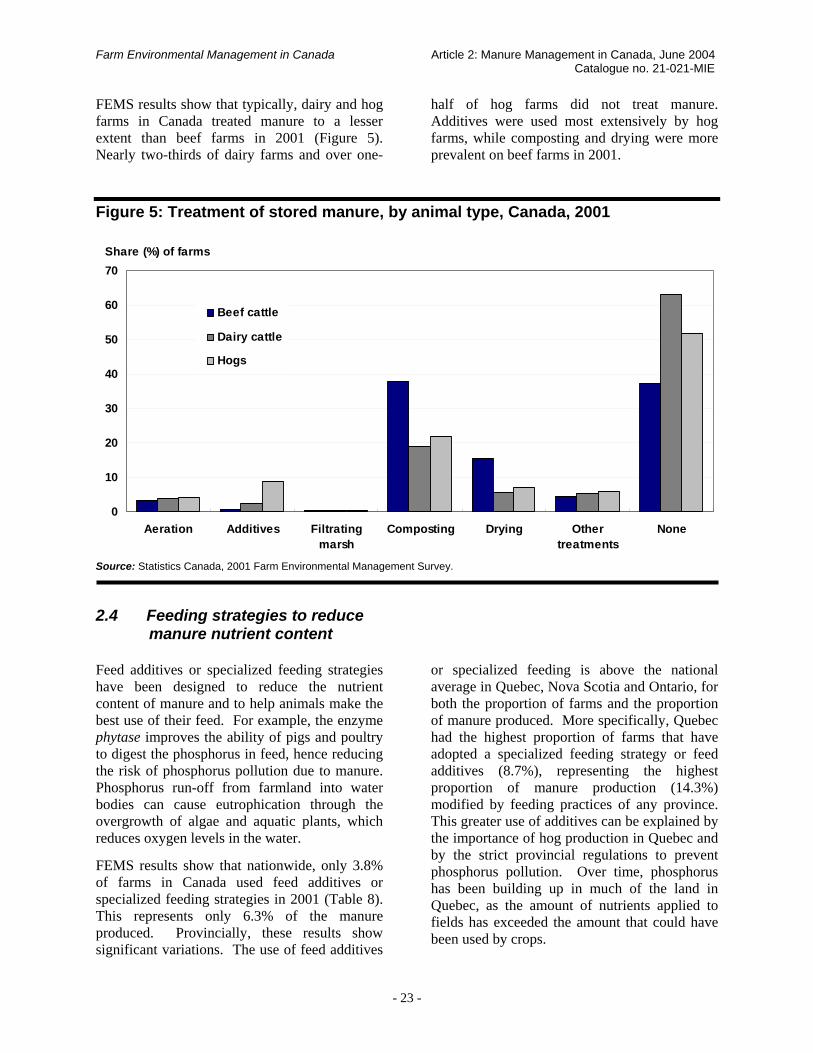
FEMS results show that typically, dairy and hog farms in Canada treated manure to a lesser extent than beef farms in 2001 (Figure 5). Nearly two-thirds of dairy farms and over one-
half of hog farms did not treat manure. Additives were used most extensively by hog farms, while composting and drying were more prevalent on beef farms in 2001.
Figure 5: Treatment of stored manure, by animal type, Canada, 2001
0
10
20
30
40
50
60
70
Aeration Additives Filtratingmarsh
Composting Drying Othertreatments
None
Beef cattle
Dairy cattle
Hogs
Share (%) of farms
Source: Statistics Canada, 2001 Farm Environmental Management Survey. 2.4 Feeding strategies to reduce manure nutrient content Feed additives or specialized feeding strategies have been designed to reduce the nutrient content of manure and to help animals make the best use of their feed. For example, the enzyme phytase improves the ability of pigs and poultry to digest the phosphorus in feed, hence reducing the risk of phosphorus pollution due to manure. Phosphorus run-off from farmland into water bodies can cause eutrophication through the overgrowth of algae and aquatic plants, which reduces oxygen levels in the water.
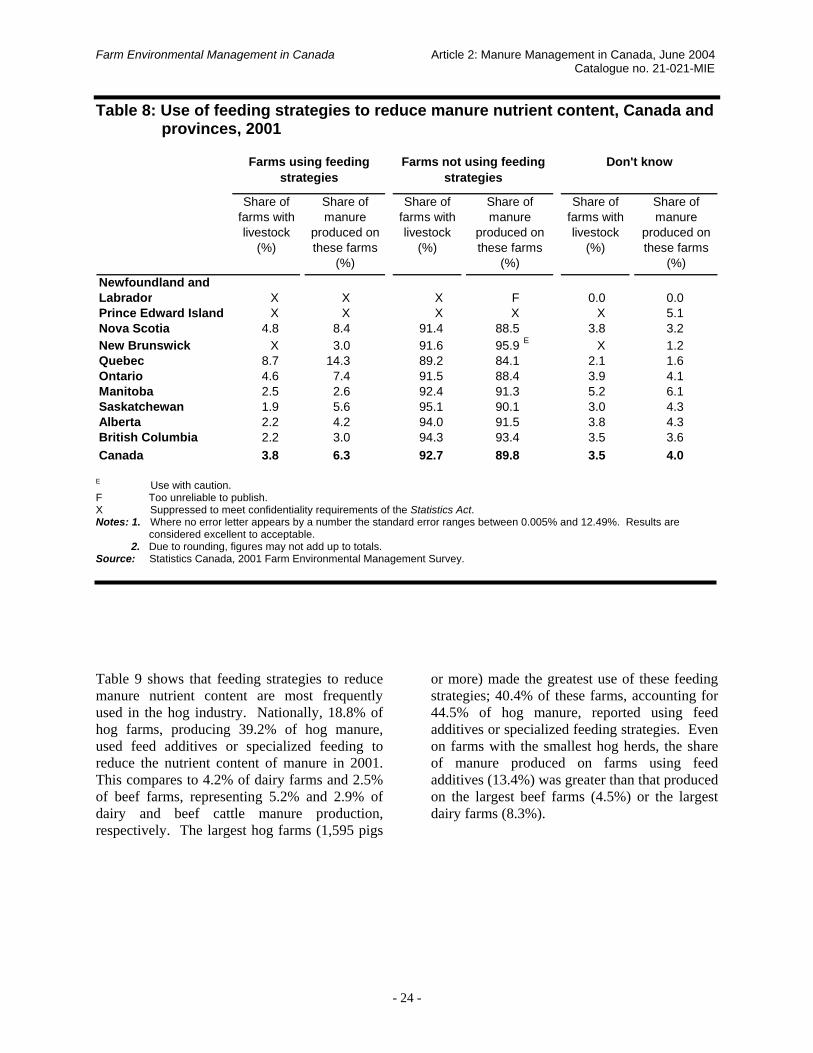
FEMS results show that nationwide, only 3.8% of farms in Canada used feed additives or specialized feeding strategies in 2001 (Table 8). This represents only 6.3% of the manure produced. Provincially, these results show significant variations. The use of feed additives
or specialized feeding is above the national average in Quebec, Nova Scotia and Ontario, for both the proportion of farms and the proportion of manure produced. More specifically, Quebec had the highest proportion of farms that have adopted a specialized feeding strategy or feed additives (8.7%), representing the highest proportion of manure production (14.3%) modified by feeding practices of any province. This greater use of additives can be explained by the importance of hog production in Quebec and by the strict provincial regulations to prevent phosphorus pollution. Over time, phosphorus has been building up in much of the land in Quebec, as the amount of nutrients applied to fields has exceeded the amount that could have been used by crops.
Farm Environmental Management in Canada Article 2: Manure Management in Canada, June 2004 Catalogue no. 21-021-MIE
- 24 -
Table 8: Use of feeding strategies to reduce manure nutrient content, Canada and provinces, 2001
Newfoundland and Labrador X X X F 0.0 0.0Prince Edward Island X X X X X 5.1Nova Scotia 4.8 8.4 91.4 88.5 3.8 3.2New Brunswick X 3.0 91.6 95.9 E X 1.2Quebec 8.7 14.3 89.2 84.1 2.1 1.6Ontario 4.6 7.4 91.5 88.4 3.9 4.1Manitoba 2.5 2.6 92.4 91.3 5.2 6.1Saskatchewan 1.9 5.6 95.1 90.1 3.0 4.3Alberta 2.2 4.2 94.0 91.5 3.8 4.3British Columbia 2.2 3.0 94.3 93.4 3.5 3.6Canada 3.8 6.3 92.7 89.8 3.5 4.0
Farms using feeding strategies
Farms not using feeding strategies
Don't know
Share of farms with livestock
(%)
Share of manure
produced on these farms
(%)
Share of farms with livestock
(%)
Share of manure
produced on these farms
(%)
Share of farms with livestock
(%)
Share of manure
produced on these farms
(%)
E Use with caution. F Too unreliable to publish. X Suppressed to meet confidentiality requirements of the Statistics Act. Notes: 1. Where no error letter appears by a number the standard error ranges between 0.005% and 12.49%. Results are considered excellent to acceptable. 2. Due to rounding, figures may not add up to totals. Source: Statistics Canada, 2001 Farm Environmental Management Survey.
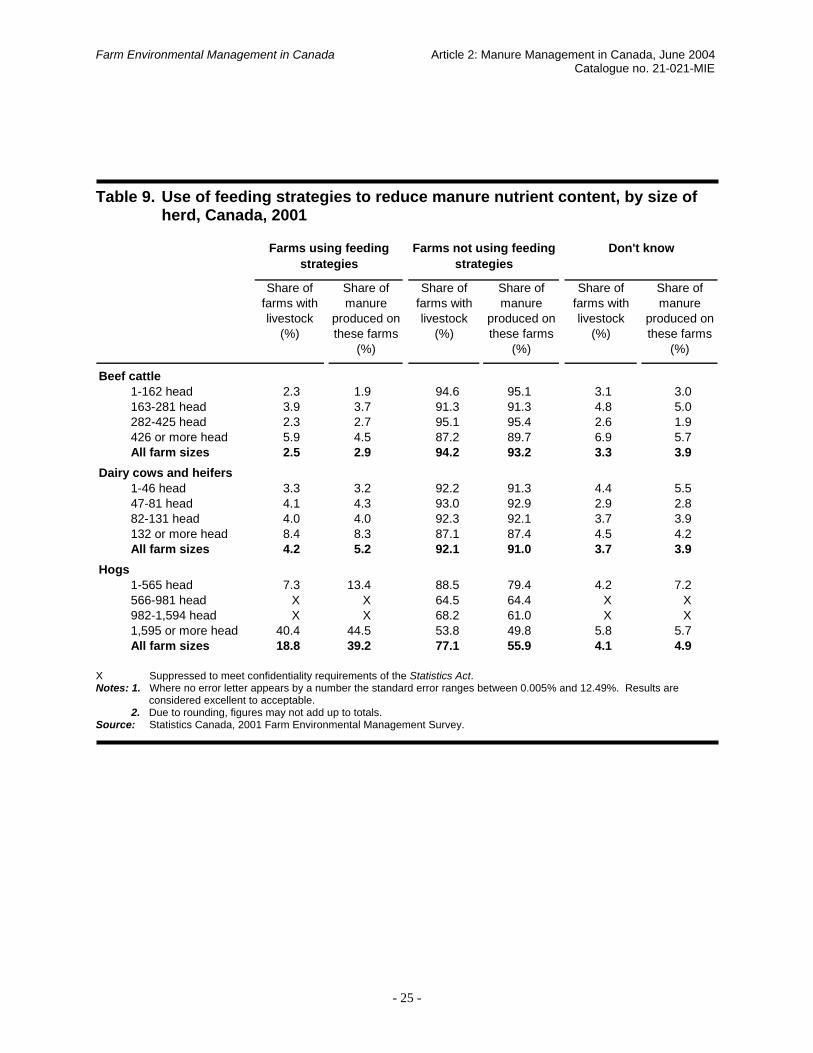
Table 9 shows that feeding strategies to reduce manure nutrient content are most frequently used in the hog industry. Nationally, 18.8% of hog farms, producing 39.2% of hog manure, used feed additives or specialized feeding to reduce the nutrient content of manure in 2001. This compares to 4.2% of dairy farms and 2.5% of beef farms, representing 5.2% and 2.9% of dairy and beef cattle manure production, respectively. The largest hog farms (1,595 pigs
or more) made the greatest use of these feeding strategies; 40.4% of these farms, accounting for 44.5% of hog manure, reported using feed additives or specialized feeding strategies. Even on farms with the smallest hog herds, the share of manure produced on farms using feed additives (13.4%) was greater than that produced on the largest beef farms (4.5%) or the largest dairy farms (8.3%).
Farm Environmental Management in Canada Article 2: Manure Management in Canada, June 2004 Catalogue no. 21-021-MIE
- 25 -
Table 9. Use of feeding strategies to reduce manure nutrient content, by size of
herd, Canada, 2001
1-162 head 2.3 1.9 94.6 95.1 3.1 3.0163-281 head 3.9 3.7 91.3 91.3 4.8 5.0282-425 head 2.3 2.7 95.1 95.4 2.6 1.9426 or more head 5.9 4.5 87.2 89.7 6.9 5.7All farm sizes 2.5 2.9 94.2 93.2 3.3 3.9
Dairy cows and heifers1-46 head 3.3 3.2 92.2 91.3 4.4 5.547-81 head 4.1 4.3 93.0 92.9 2.9 2.882-131 head 4.0 4.0 92.3 92.1 3.7 3.9132 or more head 8.4 8.3 87.1 87.4 4.5 4.2All farm sizes 4.2 5.2 92.1 91.0 3.7 3.9
Hogs1-565 head 7.3 13.4 88.5 79.4 4.2 7.2566-981 head X X 64.5 64.4 X X982-1,594 head X X 68.2 61.0 X X1,595 or more head 40.4 44.5 53.8 49.8 5.8 5.7All farm sizes 18.8 39.2 77.1 55.9 4.1 4.9
Don't know
Share of farms with livestock
(%)
Share of manure
produced on these farms
(%)
Share of manure
produced on these farms
(%)
Beef cattle
Farms using feeding strategies
Farms not using feeding strategies
Share of farms with livestock
(%)
Share of manure
produced on these farms
(%)
Share of farms with livestock
(%)
X Suppressed to meet confidentiality requirements of the Statistics Act. Notes: 1. Where no error letter appears by a number the standard error ranges between 0.005% and 12.49%. Results are considered excellent to acceptable. 2. Due to rounding, figures may not add up to totals. Source: Statistics Canada, 2001 Farm Environmental Management Survey.

Farm Environmental Management in Canada Article 2: Manure Management in Canada, June 2004 Catalogue no. 21-021-MIE
- 26 -
2.5 Control of odours from livestock buildings
Manure odours from livestock buildings, which pose site-specific concerns, can be reduced in different ways. To control odours, farmers can install windbreaks, filters on exhaust fans, and other devices.7 To choose the appropriate odour control method, various factors need to be taken into consideration, including costs of practices, effectiveness of strategies and proximity of livestock facilities to neighbouring communities.
FEMS results show that 18.7% of livestock producing farms in Canada used some method to control livestock odours in 2001 (Table 10). The most popular method of odour control were wind barriers, reported by 10.9% of livestock farms. These relatively low figures reflect the fact that odour control is not necessarily an issue, especially if a livestock farm is relatively small or located far away from communities or neighbours. Furthermore, 9.0% of farms with livestock did not have barns or buildings for livestock; hence the issue is not relevant for these farms.
Provincially, results differed significantly. Manitoba had the highest percentage of farms using some method of odour control (36.9%) while Quebec had the lowest (13.0% of farms). Wind barriers were used to the greatest extent in the Prairie provinces. The use of wind barriers in the Prairie provinces may be encouraged through the availability of the Prairie Farm Rehabilitation Administration (PFRA) Shelterbelt Program. Manitoba had the highest proportion of farms using wind barriers to control odours (28.1% of farms). Finally, filter fans were used to the greatest extent in Nova
7 While this section looks at ways of dealing with odours emanating from livestock facilities, aeration is also used primarily as an odour control method, by mitigating odours in stored manure. Refer to Section 2.3 Treatment of stored manure.
Scotia, Prince Edward Island, and Ontario (respectively 9.9%, 9.3%, and 6.8%).
The majority of livestock producing farms do not use any method to control odours from their livestock buildings. In 2001, almost three-quarters (74.4%) of farms with livestock in Canada reported not having a method to control odours. The largest proportions of farms with livestock that did not report any method to control odours were in Quebec (86.5%) and New Brunswick (79%), though several provinces were not too far behind.
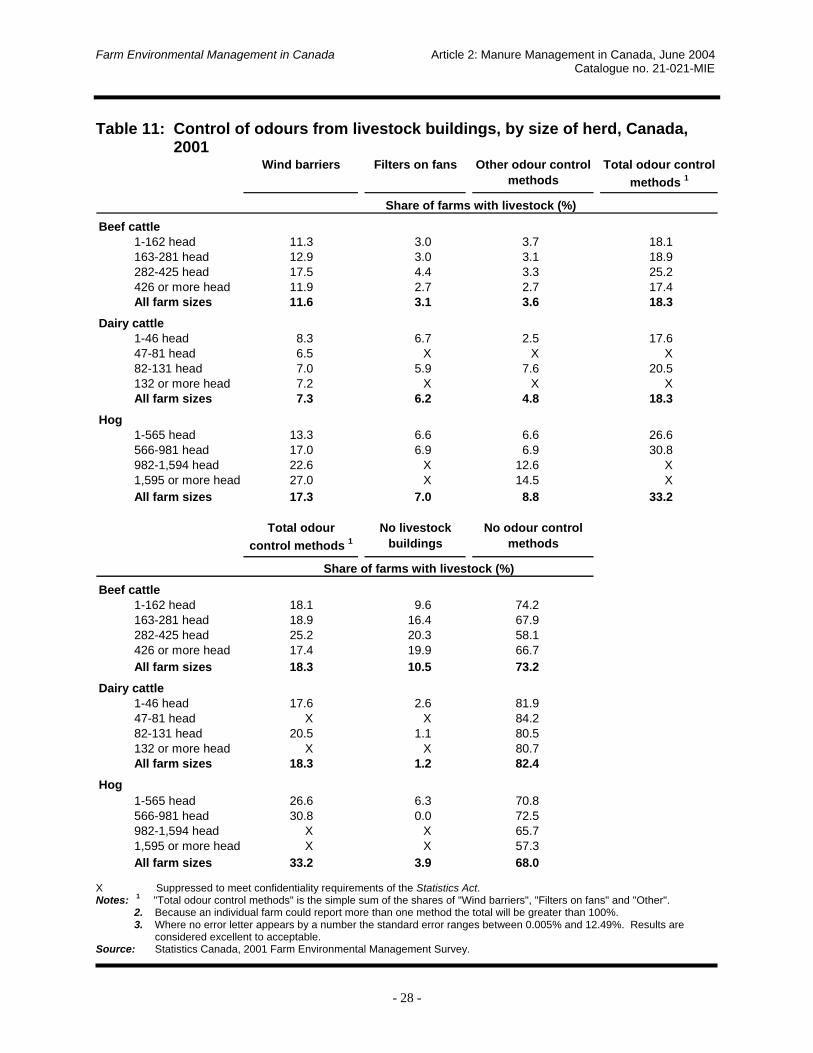
Table 11 shows that 33.2% of hog farms had some method of odour control. This compares to 18.3% for both beef farms and dairy farms. Wind barriers, the most commonly used method, were in place on 17.3% of hog farms.
Methods used to control odours from livestock building also varied by herd size. Larger farms with livestock generally reported more frequent adoption of odour control methods on their livestock buildings. This is especially true in the hog sector. In 2001, the farms with the largest hog herds (1,595 hogs or more) reported a larger share of wind barriers (27.0%) and other methods (14.5%) than smaller hog farms. This is not surprising, as large modern intensive hog operations maintain a high concentration of animals in a confined area and can generate significant odours if not managed properly. Furthermore, odour control methods were more likely to be found even on farms with the smallest hog herds (less than 566 hogs) than on farms with beef and dairy cattle of any herd size.

Farm Environmental Management in Canada Article 2: Manure Management in Canada, June 2004 Catalogue no. 21-021-MIE
- 27 -
Table 10: Control of odours from livestock buildings, Canada and provinces, 2001
Newfoundland and Labrador X X X XPrince Edward Island 7.3 9.3 X XNova Scotia X 9.9 10.6 XNew Brunswick 8.3 X 6.0 XQuebec 7.4 2.2 3.3 13.0Ontario 8.2 6.8 5.5 20.6Manitoba 28.1 3.5 5.3 36.9Saskatchewan 11.0 1.3 3.0 15.3Alberta 10.9 2.4 3.2 16.5British Columbia 6.0 2.7 7.0 15.7Canada 10.9 3.5 4.2 18.7
Newfoundland and Labrador X 0.0 82.1Prince Edward Island X X 80.0Nova Scotia X X 72.0New Brunswick X X 79.0Quebec 13.0 1.1 86.5Ontario 20.6 1.3 79.7Manitoba 36.9 10.3 56.7Saskatchewan 15.3 12.7 75.1Alberta 16.5 18.8 66.8British Columbia 15.7 9.6 76.9Canada 18.7 9.0 74.4
Total odour control methods 1
Total odour control methods 1
No livestock buildings
Share of farms with livestock (%)
No odour control methods
Share of farms with livestock (%)
Wind barriers Filters on fans Other
X Suppressed to meet confidentiality requirements of the Statistics Act. Notes: 1 "Total odour control methods" is the simple sum of the shares of "Wind barriers", "Filters on fans" and "Other". 2. Because an individual farm could report more than one method the total will be greater than 100%. 3. Where no error letter appears by a number the standard error ranges between 0.005% and 12.49%. Results are considered excellent to acceptable. Source: Statistics Canada, 2001 Farm Environmental Management Survey.
Farm Environmental Management in Canada Article 2: Manure Management in Canada, June 2004 Catalogue no. 21-021-MIE
- 28 -
Table 11: Control of odours from livestock buildings, by size of herd, Canada,
2001
Beef cattle1-162 head 11.3 3.0 3.7 18.1163-281 head 12.9 3.0 3.1 18.9282-425 head 17.5 4.4 3.3 25.2426 or more head 11.9 2.7 2.7 17.4All farm sizes 11.6 3.1 3.6 18.3
Dairy cattle1-46 head 8.3 6.7 2.5 17.647-81 head 6.5 X X X82-131 head 7.0 5.9 7.6 20.5132 or more head 7.2 X X XAll farm sizes 7.3 6.2 4.8 18.3
Hog1-565 head 13.3 6.6 6.6 26.6566-981 head 17.0 6.9 6.9 30.8982-1,594 head 22.6 X 12.6 X1,595 or more head 27.0 X 14.5 XAll farm sizes 17.3 7.0 8.8 33.2
Beef cattle1-162 head 18.1 9.6 74.2163-281 head 18.9 16.4 67.9282-425 head 25.2 20.3 58.1426 or more head 17.4 19.9 66.7All farm sizes 18.3 10.5 73.2
Dairy cattle1-46 head 17.6 2.6 81.947-81 head X X 84.282-131 head 20.5 1.1 80.5132 or more head X X 80.7All farm sizes 18.3 1.2 82.4
Hog1-565 head 26.6 6.3 70.8566-981 head 30.8 0.0 72.5982-1,594 head X X 65.71,595 or more head X X 57.3All farm sizes 33.2 3.9 68.0
Total odour control methods 1
Share of farms with livestock (%)
Filters on fansWind barriers Other odour control methods
Share of farms with livestock (%)
Total odour control methods 1
No livestock buildings
No odour control methods
X Suppressed to meet confidentiality requirements of the Statistics Act. Notes: 1 "Total odour control methods" is the simple sum of the shares of "Wind barriers", "Filters on fans" and "Other". 2. Because an individual farm could report more than one method the total will be greater than 100%. 3. Where no error letter appears by a number the standard error ranges between 0.005% and 12.49%. Results are considered excellent to acceptable. Source: Statistics Canada, 2001 Farm Environmental Management Survey.
Farm Environmental Management in Canada Article 2: Manure Management in Canada, June 2004 Catalogue no. 21-021-MIE
- 29 -
2.6 Development of formal manure management plans
Specific manure management plans (MMPs) or broader nutrient management plans (NMPs) usually include records for each of the farm’s fields and information on soil test results, nutrient requirements of crops, crop yields, rotation plans, and of course, nutrient application from manure and commercial fertilizers. The purpose of both MMPs and NMPs is to balance the application of nutrients with crop requirements, thus reducing nutrient losses to the environment.
According to the 2001 FEMS, 17.7% of all livestock producing farms in Canada had developed a formal MMP (Table 12). Overall, 7.8% of the farms (13.1% of manure production) developed their MMP as part of a broader NMP. Another 5.9% of the farms (8.4% of manure production) developed their MMP because it was required by government regulations. An additional 4.0% of the farms (4.8% of manure production) developed their MMP mainly because of farmers’ personal concerns for the environment.
The development of MMPs differ significantly on a provincial basis, mostly due to differences in farmers’ codes of practices, provincial regulations or municipal by-laws. For example, Quebec had the highest proportion of farms (52.3%) that had developed a MMP, accounting
for 67.6% of manure produced in 2001. Also, 29.4% of farms in this province, representing 40.8% of manure production, had developed a MMP to comply with government regulations. In addition, 19.0% of Quebec farms (23.5% of manure) had developed a MMP as part of a broader NMP. This reflects the more stringent provincial regulations introduced in 1998 in Quebec to reduce pollution from agricultural sources.
The rest of Canada, however, had a significantly lower proportion of farms that had prepared a MMP. Regulations in these provinces tend to require such plans only for the very large and intensive livestock operations.
Nationally, the dairy sector had the highest proportion of farms (38.4%) that had developed a MMP, followed closely by the hog sector (35.4% of farms) (Table 13). In contrast, beef farms had the lowest proportion of farms (13.7%) with MMPs. Overall, 17.6% of dairy farms, 14.0% of hog farms and 6.6% of beef farms had developed a MMP as part of a broader NMP. In addition, 15.3% of dairy farms and 16.0% of hog farms had developed a MMP to comply with regulations, compared to 3.2% of beef farms. Moreover, about 5% of both dairy and hog farms developed a MMP because of farmers’ concerns for the environment.

Farm Environmental Management in Canada Article 2: Manure Management in Canada, June 2004 Catalogue no. 21-021-MIE
- 30 -
Table 12: Development of formal manure management plan, Canada and provinces, 2001
Newfoundland and Labrador X X X 79.3Prince Edward Island X X X 86.1Nova Scotia 1.7 7.9 4.8 85.6New Brunswick 4.0 4.0 3.2 88.9Quebec 29.4 19.0 3.9 47.7Ontario 2.5 8.4 7.4 81.7Manitoba 2.8 4.3 3.4 89.5Saskatchewan 0.5 4.3 2.2 93.0Alberta 0.6 4.7 2.5 92.2British Columbia 2.3 4.9 3.4 89.4Canada 5.9 7.8 4.0 82.3
Newfoundland and Labrador X X X FPrince Edward Island 3.9 5.6 5.6 84.9Nova Scotia X X X XNew Brunswick 6.2 5.1 3.4 85.3Quebec 40.8 23.5 3.3 32.4Ontario 4.4 14.0 9.7 72.0Manitoba 8.1 5.6 4.8 81.6Saskatchewan 2.2 9.1 3.7 85.0Alberta 1.7 13.5 3.2 81.6British Columbia 2.1 7.7 6.1 84.1Canada 8.4 13.1 4.8 73.7
No formal plan
Share of farms with livestock (%)
Share of manure produced on these farms (%)
Required by government regulations
Part of nutrient management plan
Concerns for environment
F Too unreliable to publish. X Suppressed to meet confidentiality requirements of the Statistics Act. Notes: 1. Where no error letter appears by a number the standard error ranges between 0.005% and 12.49%. Results are considered excellent to acceptable. 2. Due to rounding, figures may not add up to totals. Source: Statistics Canada, 2001 Farm Environmental Management Survey.

Farm Environmental Management in Canada Article 2: Manure Management in Canada, June 2004 Catalogue no. 21-021-MIE
- 31 -
Table 13: Development of formal manure management plan, by animal type, Canada, 2001
Beef cattle 3.2 6.6 3.9 86.3Dairy cattle 15.3 17.6 5.5 61.6Hog 16.0 14.0 5.4 64.6
Beef cattle 2.4 9.7 4.0 83.8Dairy cattle 17.2 19.9 6.9 56.0Hog 32.7 23.5 5.0 38.8
Share of farms with livestock (%)
Share of manure produced on these farms (%)
Part of nutrient management plan
Concerns for environment
Required by government regulations
No formal plan
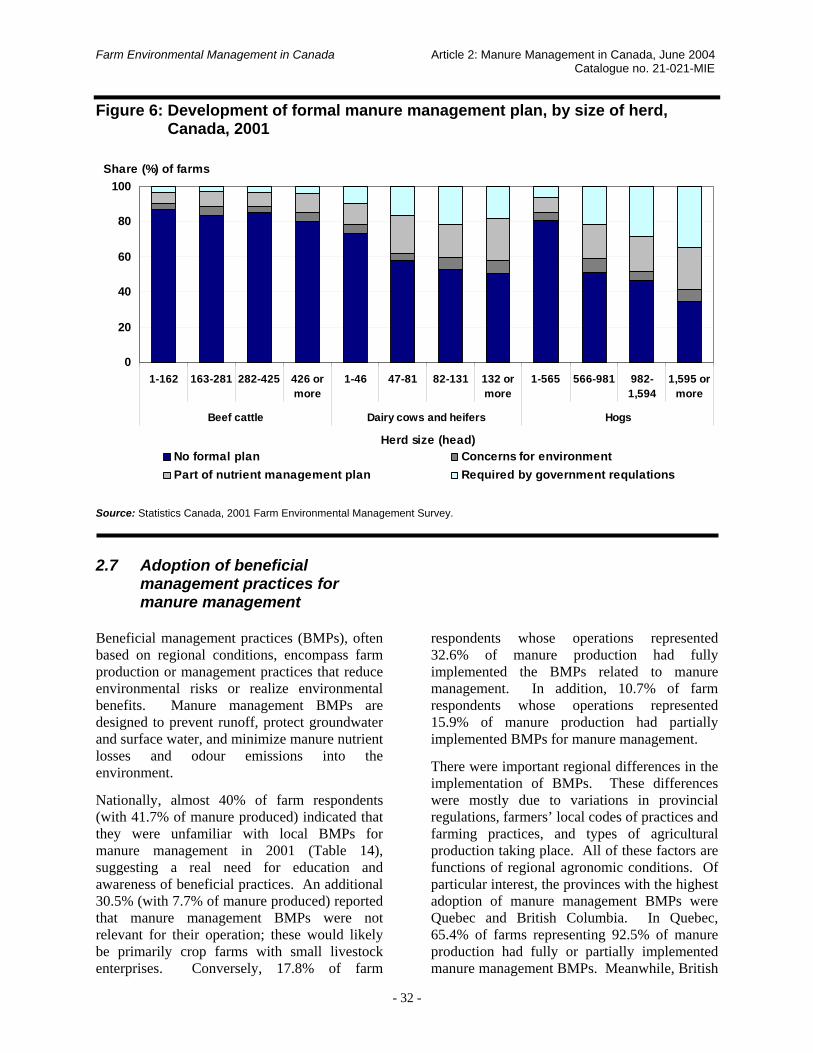
Notes: 1. Where no error letter appears by a number the standard error ranges between 0.005% and 12.49%. Results are considered excellent to acceptable. 2. Due to rounding, figures may not add up to totals. Source: Statistics Canada, 2001 Farm Environmental Management Survey. Figure 6 shows that MMPs were more prevalent on farms with larger herds in 2001. As an example, 49.4% of the largest dairy farms (more than 131 dairy cows and heifers) developed a MMP, compared to 26.6% of the smallest dairy farms (less than 47 dairy cows and heifers). Amongst the largest dairy farms, 24.0% had developed a MMP as part of a NMP, 18.3% to comply with regulations and 7.1% out of concerns for the environment.
MMPs were the most prevalent on large hog farms (more than 981 pigs) where more than one-half of farms had developed a MMP. Of particular note, more than two-thirds of the largest hog farms (more than 1,594) had developed a formal MMP. In addition, more
than one-third of the these largest hog farms had developed a MMP to comply with regulations and about one-quarter of these farms had developed a MMP as part of a NMP.
The largest hog farms had the highest percentage (65.4%) of farms using a MMP. The smallest hog farms (less than 566 animals) had a smaller percentage (6.3%) of farms required to use a MMP; these farms also reported a small share (8.5%) of MMPs developed as part of a broader NMP. These low percentages reduce the overall share of hog farms that employ an MMP. Note that if the smallest hog farm size was removed, the average percentage of hog farms using a MMP climbs to 56.0%.
Farm Environmental Management in Canada Article 2: Manure Management in Canada, June 2004 Catalogue no. 21-021-MIE
- 32 -
Figure 6: Development of formal manure management plan, by size of herd, Canada, 2001
0
20
40
60
80
100
1-162 163-281 282-425 426 ormore
1-46 47-81 82-131 132 ormore
1-565 566-981 982-1,594
1,595 ormore
Beef cattle Dairy cows and heifers Hogs
No formal plan Concerns for environmentPart of nutrient management plan Required by government requlations
Herd size (head)
Share (%) of farms
Source: Statistics Canada, 2001 Farm Environmental Management Survey.
2.7 Adoption of beneficial management practices for manure management Beneficial management practices (BMPs), often based on regional conditions, encompass farm production or management practices that reduce environmental risks or realize environmental benefits. Manure management BMPs are designed to prevent runoff, protect groundwater and surface water, and minimize manure nutrient losses and odour emissions into the environment.
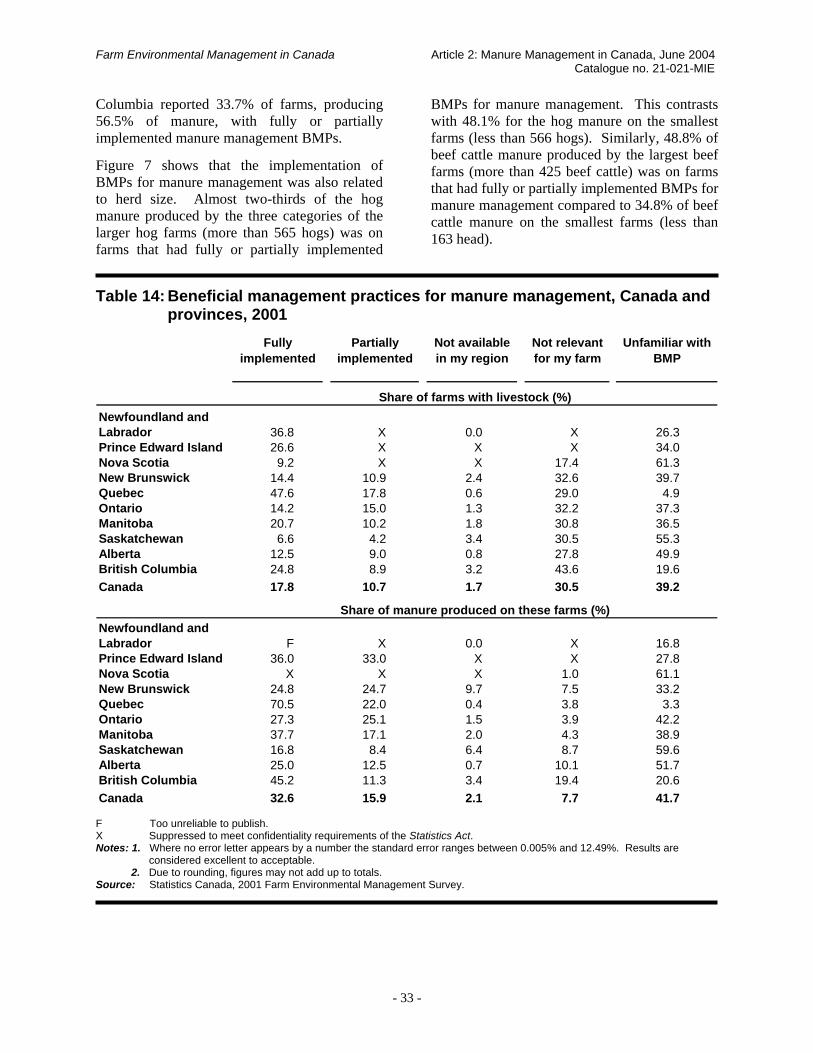
Nationally, almost 40% of farm respondents (with 41.7% of manure produced) indicated that they were unfamiliar with local BMPs for manure management in 2001 (Table 14), suggesting a real need for education and awareness of beneficial practices. An additional 30.5% (with 7.7% of manure produced) reported that manure management BMPs were not relevant for their operation; these would likely be primarily crop farms with small livestock enterprises. Conversely, 17.8% of farm
respondents whose operations represented 32.6% of manure production had fully implemented the BMPs related to manure management. In addition, 10.7% of farm respondents whose operations represented 15.9% of manure production had partially implemented BMPs for manure management.
There were important regional differences in the implementation of BMPs. These differences were mostly due to variations in provincial regulations, farmers’ local codes of practices and farming practices, and types of agricultural production taking place. All of these factors are functions of regional agronomic conditions. Of particular interest, the provinces with the highest adoption of manure management BMPs were Quebec and British Columbia. In Quebec, 65.4% of farms representing 92.5% of manure production had fully or partially implemented manure management BMPs. Meanwhile, British
Farm Environmental Management in Canada Article 2: Manure Management in Canada, June 2004 Catalogue no. 21-021-MIE
- 33 -
Columbia reported 33.7% of farms, producing 56.5% of manure, with fully or partially implemented manure management BMPs.
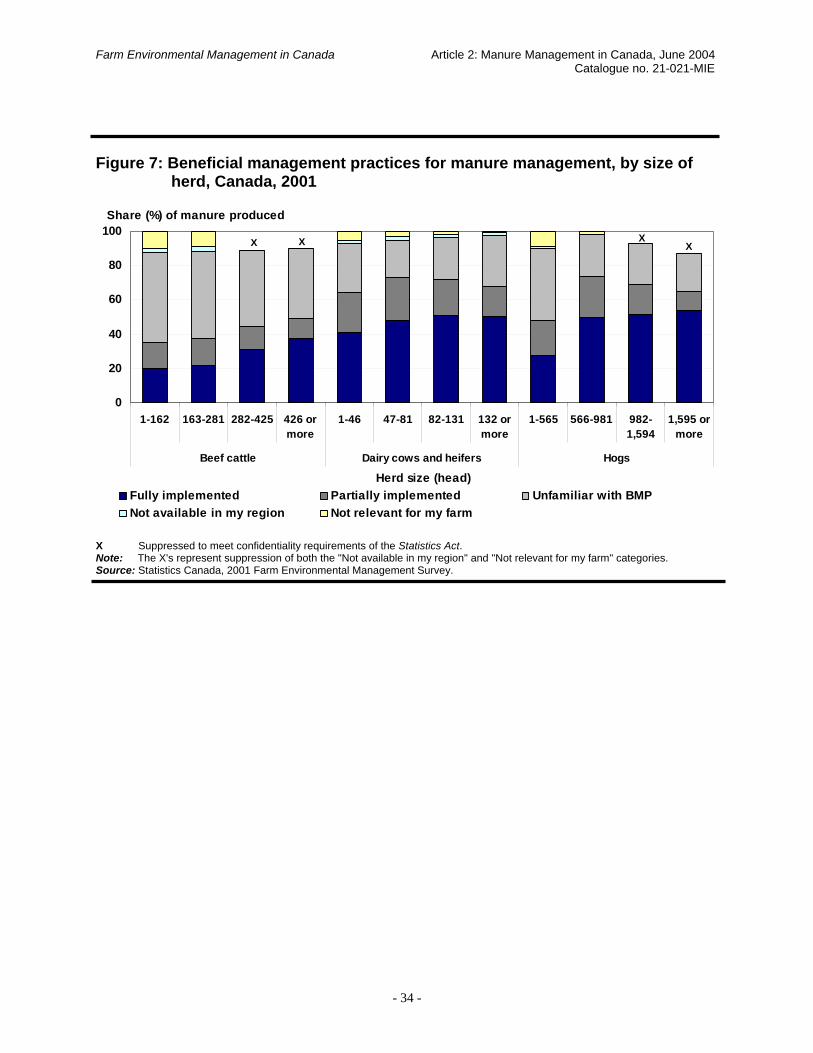
Figure 7 shows that the implementation of BMPs for manure management was also related to herd size. Almost two-thirds of the hog manure produced by the three categories of the larger hog farms (more than 565 hogs) was on farms that had fully or partially implemented
BMPs for manure management. This contrasts with 48.1% for the hog manure on the smallest farms (less than 566 hogs). Similarly, 48.8% of beef cattle manure produced by the largest beef farms (more than 425 beef cattle) was on farms that had fully or partially implemented BMPs for manure management compared to 34.8% of beef cattle manure on the smallest farms (less than 163 head).
Table 14: Beneficial management practices for manure management, Canada and provinces, 2001
Newfoundland and Labrador 36.8 X 0.0 X 26.3Prince Edward Island 26.6 X X X 34.0Nova Scotia 9.2 X X 17.4 61.3New Brunswick 14.4 10.9 2.4 32.6 39.7Quebec 47.6 17.8 0.6 29.0 4.9Ontario 14.2 15.0 1.3 32.2 37.3Manitoba 20.7 10.2 1.8 30.8 36.5Saskatchewan 6.6 4.2 3.4 30.5 55.3Alberta 12.5 9.0 0.8 27.8 49.9British Columbia 24.8 8.9 3.2 43.6 19.6Canada 17.8 10.7 1.7 30.5 39.2
Newfoundland and Labrador F X 0.0 X 16.8Prince Edward Island 36.0 33.0 X X 27.8Nova Scotia X X X 1.0 61.1New Brunswick 24.8 24.7 9.7 7.5 33.2Quebec 70.5 22.0 0.4 3.8 3.3Ontario 27.3 25.1 1.5 3.9 42.2Manitoba 37.7 17.1 2.0 4.3 38.9Saskatchewan 16.8 8.4 6.4 8.7 59.6Alberta 25.0 12.5 0.7 10.1 51.7British Columbia 45.2 11.3 3.4 19.4 20.6Canada 32.6 15.9 2.1 7.7 41.7
Unfamiliar with BMP
Share of farms with livestock (%)
Share of manure produced on these farms (%)
Fully implemented
Partially implemented
Not available in my region
Not relevant for my farm
F Too unreliable to publish. X Suppressed to meet confidentiality requirements of the Statistics Act. Notes: 1. Where no error letter appears by a number the standard error ranges between 0.005% and 12.49%. Results are considered excellent to acceptable. 2. Due to rounding, figures may not add up to totals. Source: Statistics Canada, 2001 Farm Environmental Management Survey.
Farm Environmental Management in Canada Article 2: Manure Management in Canada, June 2004 Catalogue no. 21-021-MIE
- 34 -
Figure 7: Beneficial management practices for manure management, by size of herd, Canada, 2001
0
20
40
60
80
100
1-162 163-281 282-425 426 ormore
1-46 47-81 82-131 132 ormore
1-565 566-981 982-1,594
1,595 ormore
Beef cattle Dairy cows and heifers Hogs
Fully implemented Partially implemented Unfamiliar with BMPNot available in my region Not relevant for my farm
X X XX
Share (%) of manure produced
Herd size (head)
X Suppressed to meet confidentiality requirements of the Statistics Act. Note: The X's represent suppression of both the "Not available in my region" and "Not relevant for my farm" categories. Source: Statistics Canada, 2001 Farm Environmental Management Survey.

Farm Environmental Management in Canada Article 2: Manure Management in Canada, June 2004 Catalogue no. 21-021-MIE
- 35 -
3 Summary Canadian livestock farmers have a wide choice of options for managing the manure produced on their farms and farmers have to find the proper approach to deliver manure to their crops with minimal environmental impact. If manure is not utilized by plants and soil, excess nutrients may accumulate in the soil or seep into groundwater systems.
The 2001 FEMS provides key information about:
• seasonal application of manure to farmland; • how and when manure is incorporated into
the soil after it is spread on fields; • the treatment of stored manure; • feeding strategies farmers use to reduce
nutrient content of manure; • odour control options; • adoption of manure management plans and
nutrient management plans; and • the implementation of beneficial
management practices specific to manure management.
The survey shows that the adoption of manure management practices varies by province, type of animals produced and size of herd. These factors are interrelated as regional variations in climate and agronomic conditions lead to the different types of animals raised, which in turn impacts the type of manure being managed (solid/semi-solid or liquid), the production system used (animal raised under confinement or outdoors) and environmental regulations and issues.
Nationally, FEMS data show that:
• 37.3% of manure was applied to land in the fall, 34.7% in spring and 25.3% in summer. A smaller proportion (2.7%) of manure was applied during the winter;
• most of the beef cattle manure (43.6%) was applied in the fall. In contrast, most of dairy cattle and hog manure (over 40% for both) was applied during the spring;
• there was little difference in the seasonal application of manure to land between farms with smaller or larger herds;
• 47.1% of manure produced in 2001 was left on the surface of the soil or incorporated into the soil more than a week after its application. Meanwhile, 17.7% of manure was injected or incorporated into the soil the same day the manure was applied to the land;
• most beef cattle manure (53.3%) was left on the surface or incorporated into the soil more than a week after its application while 38.5% hog manure was injected or incorporated into the soil the same day it was spread on the field;
• farms with larger herds had the largest proportions of manure injected or incorporated into the soil without delay;
• 3.8% of Canadian livestock farms used feed additives or feeding strategies to reduce manure nutrient content; however, 40.4% of large hog farms (more than 1,594 pigs) operated under a regimen that used feed additives or rations formulated to reduce manure nutrient content;
• About one-quarter of Canadian livestock farms used some method to control manure odours from livestock buildings. The highest share of livestock buildings with odour control methods were found on hog farms;
• 8.4% of manure produced was on farms that had formal manure management plans required by government regulations, 13.1% of manure was on farms that had nutrient management plans and 4.8% of manure was on farms that had manure management plans developed because of concerns for the environment; manure management plans were more predominant on farms with larger herds;

Farm Environmental Management in Canada Article 2: Manure Management in Canada, June 2004 Catalogue no. 21-021-MIE
- 36 -
• 32.6% of manure produced was on farms where respondents reported that they had fully implemented the beneficial management practices related to manure management in their region while 15.9% of manure was on farms
having partially implemented these practices for manure management. Conversely, 41.7% of manure was on farms where the farm operators were unfamiliar with beneficial management practices for manure in their region.

Farm Environmental Management in Canada Article 2: Manure Management in Canada, June 2004 Catalogue no. 21-021-MIE
- 37 -
Appendix A
Manure production coefficients For some questions, information collected on the 2001 FEMS questionnaire is not sufficient on its own in providing a comprehensive explanation of results because very few of the FEMS questions requested information on the number of animals or the number of acres. Most of the FEMS questions were of a categorical type where respondents had to either check a Yes or No box or check boxes indicating specific practices. This type of question is useful for estimating the number and proportion of responses, but alone, does not give a full appreciation of the significance of the adoption of specific practices. For example, it is possible to estimate both the proportion of farms that reported composting manure and the number of farms that composted manure. But the responses provide valuable information only on the extent to which the farming community has adopted farming practices that are environmentally-sound. They do not provide much information on the significance of adoption in terms of potential pressures on the environment. For example, several smaller farms may have adopted a practice that is particularly helpful in protecting the environment, resulting in a high value for
adoption. However, the overall contribution of these farms to the environment (i.e. total acreage or animals under this beneficial practice) may be marginal because the practices of a few very large farms more than offset the contribution of all these small farms.
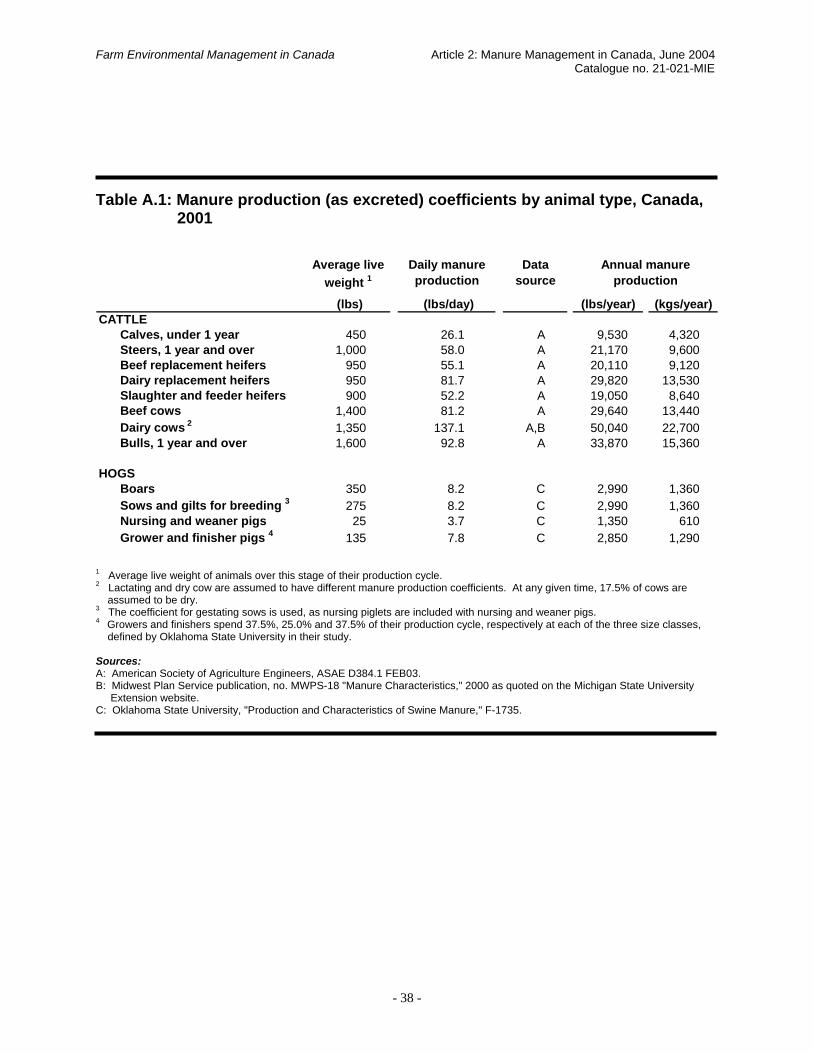
To better assess the importance (to the environment) of manure management practices, results are frequently presented on the basis of the distribution of manure produced on farms using the different practices. It is possible to derive more meaningful estimates, such as the total amount of land on which manure was applied, using the FEMS link with the 2001 Census of Agriculture. The Census of Agriculture provides estimates of the number of animals on farms. Manure production coefficients can then be applied to these animal number estimates to provide an estimate of the total annual amount of manure produced on each farm. This, along with estimates of the number of farms, provides a more complete picture of the adoption of specific practices and the potential impact of these practices on the environment. Coefficients used to calculate manure production are presented in the following table.
Farm Environmental Management in Canada Article 2: Manure Management in Canada, June 2004 Catalogue no. 21-021-MIE
- 38 -
Table A.1: Manure production (as excreted) coefficients by animal type, Canada, 2001
CATTLECalves, under 1 year 450 26.1 A 9,530 4,320Steers, 1 year and over 1,000 58.0 A 21,170 9,600Beef replacement heifers 950 55.1 A 20,110 9,120Dairy replacement heifers 950 81.7 A 29,820 13,530Slaughter and feeder heifers 900 52.2 A 19,050 8,640Beef cows 1,400 81.2 A 29,640 13,440Dairy cows 2 1,350 137.1 A,B 50,040 22,700Bulls, 1 year and over 1,600 92.8 A 33,870 15,360
HOGSBoars 350 8.2 C 2,990 1,360Sows and gilts for breeding 3 275 8.2 C 2,990 1,360Nursing and weaner pigs 25 3.7 C 1,350 610Grower and finisher pigs 4 135 7.8 C 2,850 1,290
(lbs) (lbs/day) (lbs/year) (kgs/year)
Average live weight 1
Daily manure production
Data source
Annual manure production
1 Average live weight of animals over this stage of their production cycle. 2 Lactating and dry cow are assumed to have different manure production coefficients. At any given time, 17.5% of cows are assumed to be dry. 3 The coefficient for gestating sows is used, as nursing piglets are included with nursing and weaner pigs. 4 Growers and finishers spend 37.5%, 25.0% and 37.5% of their production cycle, respectively at each of the three size classes, defined by Oklahoma State University in their study. Sources: A: American Society of Agriculture Engineers, ASAE D384.1 FEB03. B: Midwest Plan Service publication, no. MWPS-18 "Manure Characteristics," 2000 as quoted on the Michigan State University Extension website. C: Oklahoma State University, "Production and Characteristics of Swine Manure," F-1735.
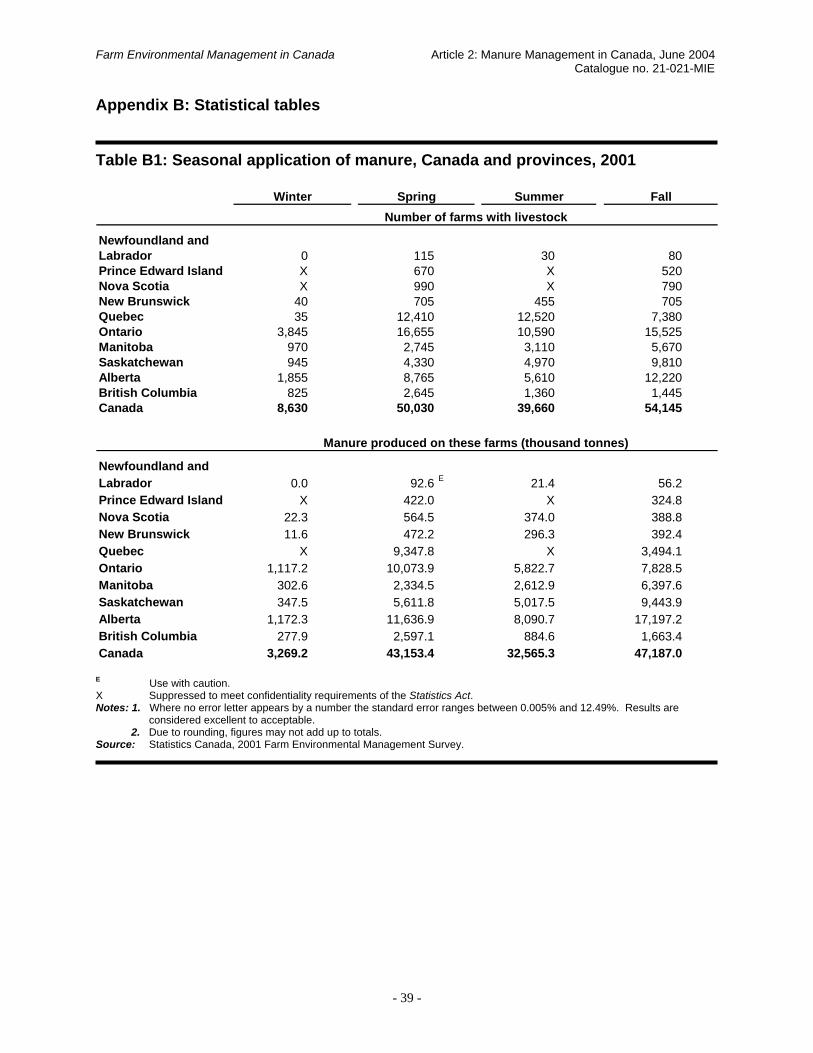
Farm Environmental Management in Canada Article 2: Manure Management in Canada, June 2004 Catalogue no. 21-021-MIE
- 39 -
Appendix B: Statistical tables
Table B1: Seasonal application of manure, Canada and provinces, 2001
Newfoundland and Labrador 0 115 30 80Prince Edward Island X 670 X 520Nova Scotia X 990 X 790New Brunswick 40 705 455 705Quebec 35 12,410 12,520 7,380Ontario 3,845 16,655 10,590 15,525Manitoba 970 2,745 3,110 5,670Saskatchewan 945 4,330 4,970 9,810Alberta 1,855 8,765 5,610 12,220British Columbia 825 2,645 1,360 1,445Canada 8,630 50,030 39,660 54,145
Newfoundland and Labrador 0.0 92.6 E 21.4 56.2Prince Edward Island X 422.0 X 324.8Nova Scotia 22.3 564.5 374.0 388.8New Brunswick 11.6 472.2 296.3 392.4Quebec X 9,347.8 X 3,494.1Ontario 1,117.2 10,073.9 5,822.7 7,828.5Manitoba 302.6 2,334.5 2,612.9 6,397.6Saskatchewan 347.5 5,611.8 5,017.5 9,443.9Alberta 1,172.3 11,636.9 8,090.7 17,197.2British Columbia 277.9 2,597.1 884.6 1,663.4Canada 3,269.2 43,153.4 32,565.3 47,187.0
Number of farms with livestockWinter Spring Summer Fall
Manure produced on these farms (thousand tonnes)
E Use with caution. X Suppressed to meet confidentiality requirements of the Statistics Act. Notes: 1. Where no error letter appears by a number the standard error ranges between 0.005% and 12.49%. Results are considered excellent to acceptable. 2. Due to rounding, figures may not add up to totals. Source: Statistics Canada, 2001 Farm Environmental Management Survey.
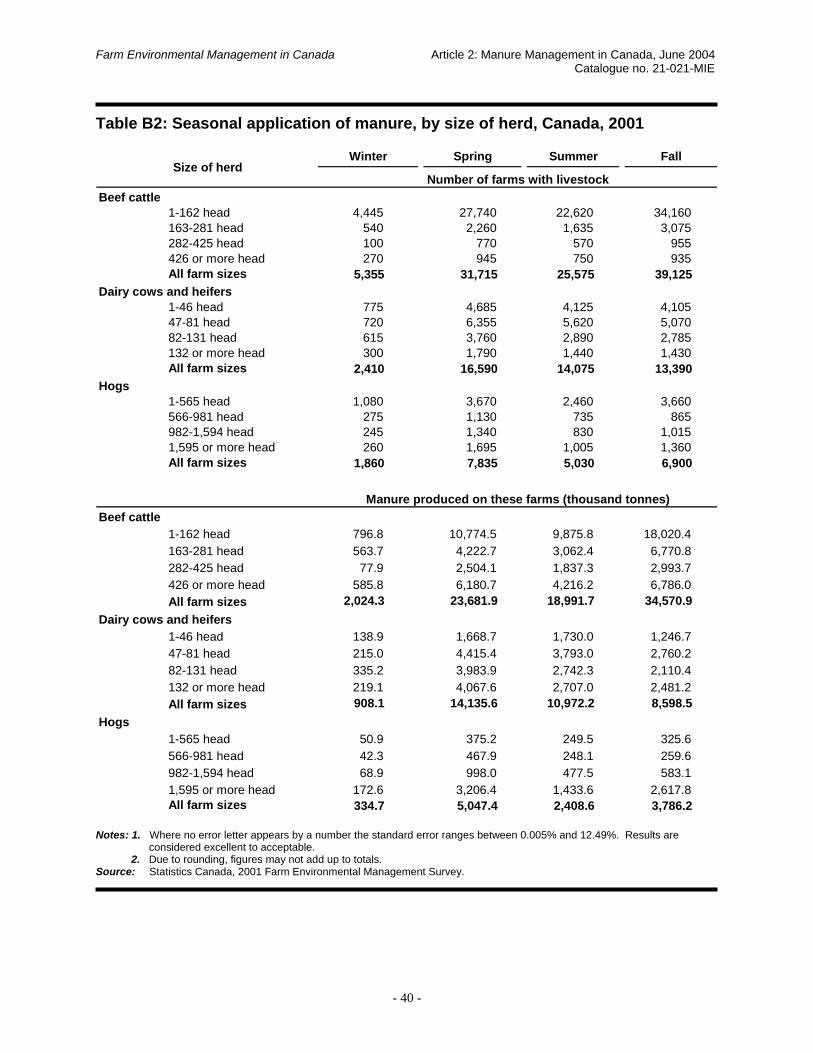
Farm Environmental Management in Canada Article 2: Manure Management in Canada, June 2004 Catalogue no. 21-021-MIE
- 40 -
Table B2: Seasonal application of manure, by size of herd, Canada, 2001
Beef cattle1-162 head 4,445 27,740 22,620 34,160163-281 head 540 2,260 1,635 3,075282-425 head 100 770 570 955426 or more head 270 945 750 935All farm sizes 5,355 31,715 25,575 39,125
Dairy cows and heifers1-46 head 775 4,685 4,125 4,10547-81 head 720 6,355 5,620 5,07082-131 head 615 3,760 2,890 2,785132 or more head 300 1,790 1,440 1,430All farm sizes 2,410 16,590 14,075 13,390
Hogs1-565 head 1,080 3,670 2,460 3,660566-981 head 275 1,130 735 865982-1,594 head 245 1,340 830 1,0151,595 or more head 260 1,695 1,005 1,360All farm sizes 1,860 7,835 5,030 6,900
Beef cattle1-162 head 796.8 10,774.5 9,875.8 18,020.4163-281 head 563.7 4,222.7 3,062.4 6,770.8282-425 head 77.9 2,504.1 1,837.3 2,993.7426 or more head 585.8 6,180.7 4,216.2 6,786.0All farm sizes 2,024.3 23,681.9 18,991.7 34,570.9
Dairy cows and heifers1-46 head 138.9 1,668.7 1,730.0 1,246.747-81 head 215.0 4,415.4 3,793.0 2,760.282-131 head 335.2 3,983.9 2,742.3 2,110.4132 or more head 219.1 4,067.6 2,707.0 2,481.2All farm sizes 908.1 14,135.6 10,972.2 8,598.5
Hogs1-565 head 50.9 375.2 249.5 325.6566-981 head 42.3 467.9 248.1 259.6982-1,594 head 68.9 998.0 477.5 583.11,595 or more head 172.6 3,206.4 1,433.6 2,617.8All farm sizes 334.7 5,047.4 2,408.6 3,786.2
Manure produced on these farms (thousand tonnes)
Size of herdNumber of farms with livestock
Winter Spring Summer Fall
Notes: 1. Where no error letter appears by a number the standard error ranges between 0.005% and 12.49%. Results are considered excellent to acceptable. 2. Due to rounding, figures may not add up to totals. Source: Statistics Canada, 2001 Farm Environmental Management Survey.
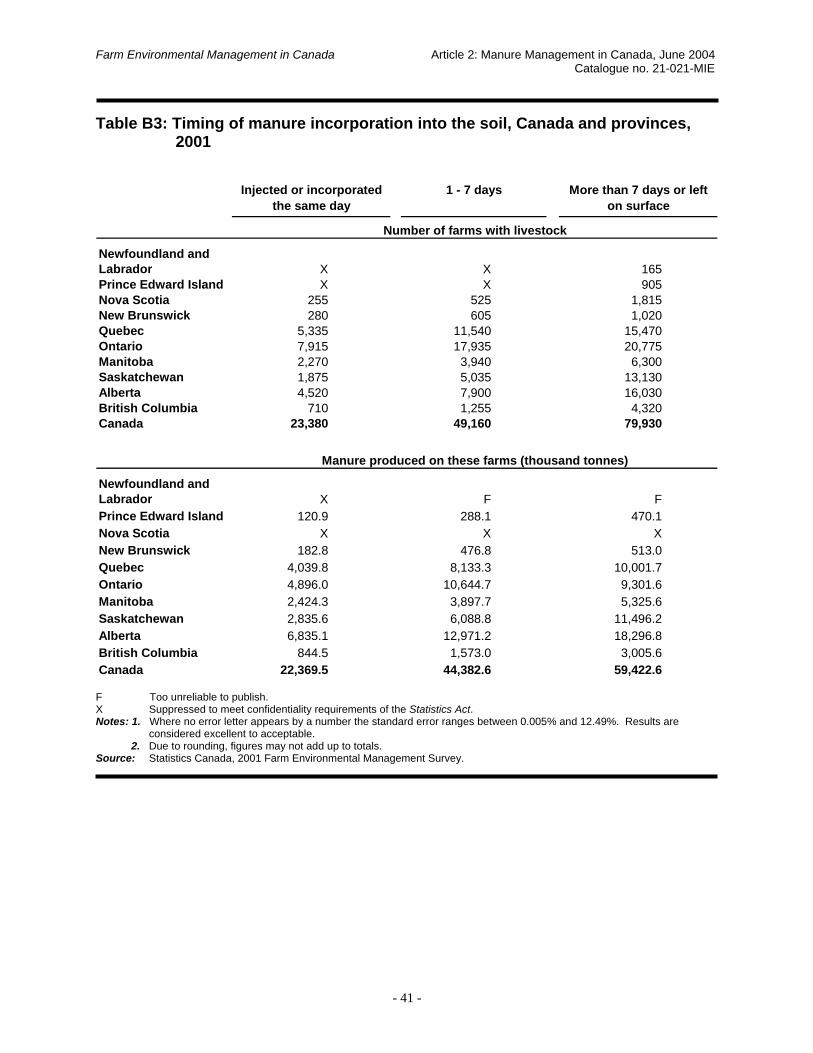
Farm Environmental Management in Canada Article 2: Manure Management in Canada, June 2004 Catalogue no. 21-021-MIE
- 41 -
Table B3: Timing of manure incorporation into the soil, Canada and provinces, 2001
Newfoundland and Labrador X X 165Prince Edward Island X X 905Nova Scotia 255 525 1,815New Brunswick 280 605 1,020Quebec 5,335 11,540 15,470Ontario 7,915 17,935 20,775Manitoba 2,270 3,940 6,300Saskatchewan 1,875 5,035 13,130Alberta 4,520 7,900 16,030British Columbia 710 1,255 4,320Canada 23,380 49,160 79,930
Newfoundland and Labrador X F FPrince Edward Island 120.9 288.1 470.1Nova Scotia X X XNew Brunswick 182.8 476.8 513.0Quebec 4,039.8 8,133.3 10,001.7Ontario 4,896.0 10,644.7 9,301.6Manitoba 2,424.3 3,897.7 5,325.6Saskatchewan 2,835.6 6,088.8 11,496.2Alberta 6,835.1 12,971.2 18,296.8British Columbia 844.5 1,573.0 3,005.6Canada 22,369.5 44,382.6 59,422.6
Manure produced on these farms (thousand tonnes)
Number of farms with livestock
Injected or incorporated the same day
1 - 7 days More than 7 days or left on surface
F Too unreliable to publish. X Suppressed to meet confidentiality requirements of the Statistics Act. Notes: 1. Where no error letter appears by a number the standard error ranges between 0.005% and 12.49%. Results are considered excellent to acceptable. 2. Due to rounding, figures may not add up to totals. Source: Statistics Canada, 2001 Farm Environmental Management Survey.

Farm Environmental Management in Canada Article 2: Manure Management in Canada, June 2004 Catalogue no. 21-021-MIE
- 42 -
Table B4: Timing of manure incorporation into the soil, by size of herd, Canada, 2001
Beef cattle1-162 head 11,795 27,840 49,330163-281 head 1,035 2,440 4,035282-425 head 360 765 1,270426 or more head 480 1,010 1,405All farm sizes 13,670 32,055 56,040
Dairy cows and heifers1-46 head 2,000 4,485 7,21047-81 head 3,055 7,005 7,69082-131 head 1,910 3,870 4,265132 or more head 1,140 1,585 2,227All farm sizes 8,105 16,945 21,392
Hogs1-565 head 1,790 3,865 5,215566-981 head 635 890 1,485982-1,594 head 870 1,255 1,3151,595 or more head 1,435 1,405 1,480All farm sizes 4,730 7,415 9,495
Beef cattle1-162 head 4,263.8 12,521.5 22,682.3163-281 head 2,039.0 4,895.2 7,685.3282-425 head 991.1 2,742.6 3,679.4426 or more head 3,107.1 6,452.9 8,208.8All farm sizes 10,400.9 26,612.3 42,255.7
Dairy cows and heifers1-46 head 1,400.6 1,700.6 2,339.947-81 head 2,249.9 4,488.4 4,599.282-131 head 2,124.3 3,761.3 3,586.0132 or more head 3,428.6 3,609.5 3,187.6All farm sizes 9,203.3 13,559.8 13,712.7
Hogs1-565 head 223.7 388.1 389.3566-981 head 202.8 377.8 437.4982-1,594 head 633.9 829.6 664.01,595 or more head 3,398.9 2,320.2 1,711.3All farm sizes 4,459.3 3,915.6 3,202.0
Manure produced on these farms (thousand tonnes)
Size of herd
Number of farms with livestock
Injected or incorporated the
same day
1 - 7 days More than 7 days or left on surface
Notes: 1. Where no error letter appears by a number the standard error ranges between 0.005% and 12.49%. Results are considered excellent to acceptable. 2. Due to rounding, figures may not add up to totals. Source: Statistics Canada, 2001 Farm Environmental Management Survey.
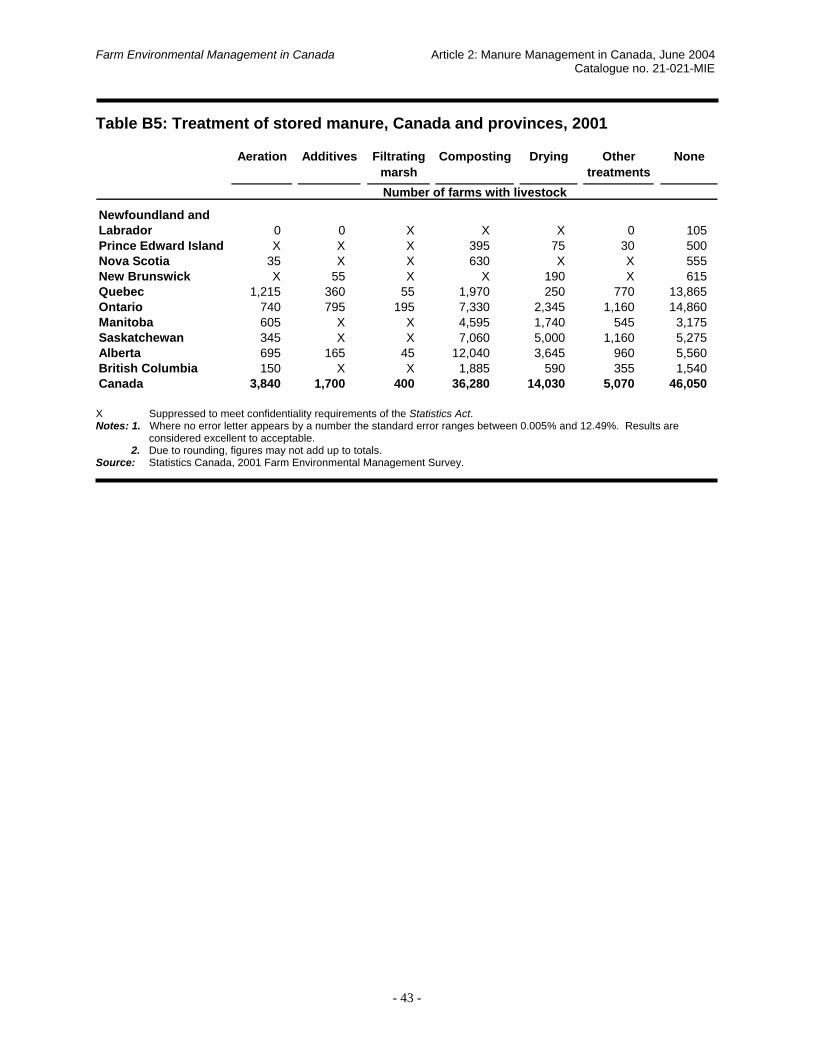
Farm Environmental Management in Canada Article 2: Manure Management in Canada, June 2004 Catalogue no. 21-021-MIE
- 43 -
Table B5: Treatment of stored manure, Canada and provinces, 2001
Newfoundland and Labrador 0 0 X X X 0 105Prince Edward Island X X X 395 75 30 500Nova Scotia 35 X X 630 X X 555New Brunswick X 55 X X 190 X 615Quebec 1,215 360 55 1,970 250 770 13,865Ontario 740 795 195 7,330 2,345 1,160 14,860Manitoba 605 X X 4,595 1,740 545 3,175Saskatchewan 345 X X 7,060 5,000 1,160 5,275Alberta 695 165 45 12,040 3,645 960 5,560British Columbia 150 X X 1,885 590 355 1,540Canada 3,840 1,700 400 36,280 14,030 5,070 46,050
Number of farms with livestock
Drying Other treatments
NoneAeration Additives Filtrating marsh
Composting
X Suppressed to meet confidentiality requirements of the Statistics Act. Notes: 1. Where no error letter appears by a number the standard error ranges between 0.005% and 12.49%. Results are considered excellent to acceptable. 2. Due to rounding, figures may not add up to totals. Source: Statistics Canada, 2001 Farm Environmental Management Survey.

Farm Environmental Management in Canada Article 2: Manure Management in Canada, June 2004 Catalogue no. 21-021-MIE
- 44 -
Table B6: Treatment of stored manure, by size of herd, Canada, 2001
Beef cattle1-162 head 2,285 550 235 25,115 10,035 3,130 25,840163-281 head 245 70 55 2,335 1,090 175 1,540282-425 head X X X 705 345 115 535426 or more head X X X 625 315 75 640All farm sizes 2,605 640 315 28,780 11,785 3,495 28,555
Dairy cows and heifers1-46 head 220 205 50 1,870 475 475 4,93547-81 head 450 115 90 1,480 445 485 5,78582-131 head 185 120 X 805 X 210 2,955132 or more head 110 145 X 350 X 110 1,395All farm sizes 965 585 155 4,505 1,300 1,280 15,070
Hogs1-565 head 260 285 X 2,170 730 X 2,940566-981 head 30 195 X 165 25 X 975982-1,594 head 75 180 X 85 X 115 1,0651,595 or more head 125 360 X 185 X 140 1,190All farm sizes 490 1,020 55 2,605 855 700 6,170
Size of herdAeration Additives Filtrating
marsh
Number of farms with livestock
Composting Drying Other treatments
None
X Suppressed to meet confidentiality requirements of the Statistics Act. Notes: 1. Where no error letter appears by a number the standard error ranges between 0.005% and 12.49%. Results are considered excellent to acceptable. 2. Due to rounding, figures may not add up to totals. Source: Statistics Canada, 2001 Farm Environmental Management Survey.

Farm Environmental Management in Canada Article 2: Manure Management in Canada, June 2004 Catalogue no. 21-021-MIE
- 45 -
Table B7: Use of feeding strategies to reduce manure nutrient content, Canada and provinces, 2001
Newfoundland and Labrador X X 0Prince Edward Island X X XNova Scotia 70 1,330 55New Brunswick X 1,150 XQuebec 1,640 16,775 390Ontario 1,310 25,835 1,105Manitoba 250 9,375 525Saskatchewan 405 20,485 650Alberta 675 28,825 1,165British Columbia 130 5,525 205Canada 4,535 110,425 4,185
Newfoundland and Labrador X F 0.0Prince Edward Island X X 49.5Nova Scotia 116.3 1,230.0 44.0New Brunswick 34.8 1,119.0 E 13.5Quebec 3,077.6 18,159.0 355.5Ontario 1,950.7 23,150.0 1,084.8Manitoba 341.4 12,065.1 802.6Saskatchewan 1,476.3 23,777.0 1,145.0Alberta 2,252.5 48,491.3 2,276.8British Columbia 236.1 7,372.0 288.1Canada 9,512.7 136,407.8 6,059.8
Manure produced on these farms (thousand tonnes)
Number of farms with livestock
Farms using feeding strategies
Farms not using feeding strategies
Don't know
E Use with caution. F Too unreliable to publish. X Suppressed to meet confidentiality requirements of the Statistics Act. Notes: 1. Where no error letter appears by a number the standard error ranges between 0.005% and 12.49%. Results are considered excellent to acceptable. 2. Due to rounding, figures may not add up to totals. Source: Statistics Canada, 2001 Farm Environmental Management Survey.

Farm Environmental Management in Canada Article 2: Manure Management in Canada, June 2004 Catalogue no. 21-021-MIE
- 46 -
Table B8: Use of feeding strategies to reduce manure nutrient content, by size of herd, Canada, 2001
Beef cattle1-162 head 1,685 69,200 2,270163-281 head 240 5,550 290282-425 head 45 1,835 50426 or more head 120 1,770 140All farm sizes 2,090 78,355 2,750
Dairy cows and heifers1-46 head 270 7,475 36047-81 head 345 7,890 24582-131 head 175 4,065 165132 or more head 175 1,825 95All farm sizes 965 21,255 865
Hogs1-565 head 490 5,975 285566-981 head X 890 X982-1,594 head X 1,085 X1,595 or more head 800 1,065 115All farm sizes 2,205 9,015 480
Beef cattle1-162 head 1,004.0 49,154.1 1,530.2163-281 head 704.7 17,312.7 943.7282-425 head 258.4 9,081.9 178.3426 or more head 1,095.3 21,668.1 1,385.4All farm sizes 3,062.4 97,216.9 4,037.6
Dairy cows and heifers1-46 head 153.5 4,436.9 268.947-81 head 479.9 10,323.2 314.082-131 head 367.6 8,545.3 361.2132 or more head 794.2 8,324.3 401.5All farm sizes 1,795.2 31,629.7 1,345.6
Hogs1-565 head 144.6 856.1 77.8566-981 head X 744.5 X982-1,594 head X 1,491.3 X1,595 or more head 3,425.4 3,829.7 439.0All farm sizes 4,846.7 6,921.7 605.7
Manure produced on these farms (thousand tonnes)
Size of herdFarms using feeding
strategiesFarms not using
feeding strategiesDon't know
Number of farms with livestock
X Suppressed to meet confidentiality requirements of the Statistics Act. Notes: 1. Where no error letter appears by a number the standard error ranges between 0.005% and 12.49%. Results are considered excellent to acceptable. 2. Due to rounding, figures may not add up to totals. Source: Statistics Canada, 2001 Farm Environmental Management Survey.
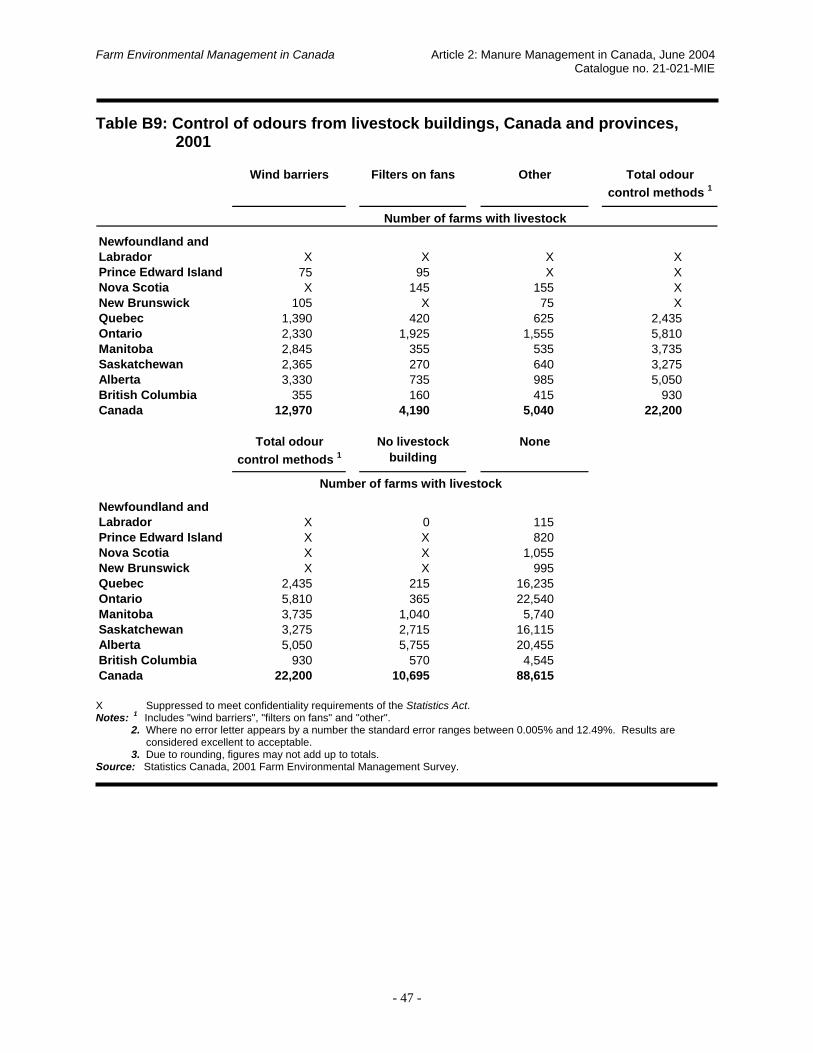
Farm Environmental Management in Canada Article 2: Manure Management in Canada, June 2004 Catalogue no. 21-021-MIE
- 47 -
Table B9: Control of odours from livestock buildings, Canada and provinces, 2001
Newfoundland and Labrador X X X XPrince Edward Island 75 95 X XNova Scotia X 145 155 XNew Brunswick 105 X 75 XQuebec 1,390 420 625 2,435Ontario 2,330 1,925 1,555 5,810Manitoba 2,845 355 535 3,735Saskatchewan 2,365 270 640 3,275Alberta 3,330 735 985 5,050British Columbia 355 160 415 930Canada 12,970 4,190 5,040 22,200
Newfoundland and Labrador X 0 115Prince Edward Island X X 820Nova Scotia X X 1,055New Brunswick X X 995Quebec 2,435 215 16,235Ontario 5,810 365 22,540Manitoba 3,735 1,040 5,740Saskatchewan 3,275 2,715 16,115Alberta 5,050 5,755 20,455British Columbia 930 570 4,545Canada 22,200 10,695 88,615
Total odour control methods 1
No livestock building
None
Number of farms with livestock
Other Total odour control methods 1
Number of farms with livestock
Wind barriers Filters on fans
X Suppressed to meet confidentiality requirements of the Statistics Act. Notes: 1 Includes "wind barriers", "filters on fans" and "other". 2. Where no error letter appears by a number the standard error ranges between 0.005% and 12.49%. Results are considered excellent to acceptable. 3. Due to rounding, figures may not add up to totals. Source: Statistics Canada, 2001 Farm Environmental Management Survey.

Farm Environmental Management in Canada Article 2: Manure Management in Canada, June 2004 Catalogue no. 21-021-MIE
- 48 -
Table B10: Control of odours from livestock buildings, by size of herd, Canada, 2001
Beef cattle1-162 head 8,270 2,220 2,700 13,190163-281 head 780 180 185 1,145282-425 head 340 85 65 490426 or more head 240 55 55 350All farm sizes 9,630 2,540 3,005 15,175
Dairy cows and heifers1-46 head 675 545 205 1,42547-81 head 550 X X X82-131 head 310 260 335 905132 or more head 150 X X XAll farm sizes 1,685 1,440 1,110 4,235
Hogs1-565 head 895 445 445 1,785566-981 head 235 95 95 425982-1,594 head 360 X 200 X1,595 or more head 530 X 285 XAll farm sizes 2,020 820 1,025 3,865
Beef cattle1-162 head 13,190 6,975 54,175163-281 head 1,145 990 4,110282-425 head 490 395 1,130426 or more head 350 400 1,345All farm sizes 15,175 8,760 60,760
Dairy cows and heifers1-46 head 1,425 210 6,63547-81 head X X 7,12582-131 head 905 50 3,545132 or more head X X 1,690All farm sizes 4,235 280 18,995
Hogs1-565 head 1,785 425 4,760566-981 head 425 0 1,000982-1,594 head X X 1,0451,595 or more head X X 1,125All farm sizes 3,865 450 7,930
Number of farms with livestock
Number of farms with livestock
Size of herd
Total odour control methods 1
No livestock building
None
Wind barriers Filters on fans
Other Total odour control methods 1
X Suppressed to meet confidentiality requirements of the Statistics Act. Notes: 1 Includes "wind barriers", "filters on fans" and "other". 2. Where no error letter appears by a number the standard error ranges between 0.005% and 12.49%. Results are considered excellent to acceptable. 3. Due to rounding, figures may not add up to totals. Source: Statistics Canada, 2001 Farm Environmental Management Survey.

Farm Environmental Management in Canada Article 2: Manure Management in Canada, June 2004 Catalogue no. 21-021-MIE
- 49 -
Table B11: Development of formal manure management plan, Canada and provinces, 2001
Newfoundland and Labrador X X X 115Prince Edward Island X X X 870Nova Scotia 25 115 70 1,245New Brunswick 50 50 40 1,120Quebec 5,515 3,575 730 8,970Ontario 720 2,365 2,100 23,090Manitoba 280 435 345 9,060Saskatchewan 105 920 470 19,980Alberta 195 1,435 755 28,285British Columbia 135 290 200 5,265Canada 7,085 9,240 4,760 98,000
Newfoundland and Labrador X X X FPrince Edward Island 37.1 53.0 53.6 809.4Nova Scotia X X X XNew Brunswick 72.2 59.3 39.5 996.3Quebec 8,810.9 5,061.2 720.8 6,985.9Ontario 1,139.0 3,651.6 2,532.0 18,851.5Manitoba 1,068.9 735.4 632.0 10,776.3Saskatchewan 577.0 2,380.9 976.8 22,318.1Alberta 876.6 7,144.9 1,717.5 43,273.3British Columbia 164.4 603.3 480.6 6,612.3Canada 12,813.5 19,946.0 7,218.4 111,807.4
No formal plan
Manure produced on these farms (thousand tonnes)
Number of farms with livestock
Required by government regulations
Part of nutrient management
plan
Concerns for environment
F Too unreliable to publish. X Suppressed to meet confidentiality requirements of the Statistics Act. Notes: 1. Where no error letter appears by a number the standard error ranges between 0.005% and 12.49%. Results are considered excellent to acceptable. 2. Due to rounding, figures may not add up to totals. Source: Statistics Canada, 2001 Farm Environmental Management Survey.

Farm Environmental Management in Canada Article 2: Manure Management in Canada, June 2004 Catalogue no. 21-021-MIE
- 50 -
Table B12: Development of formal manure management plan, by size of herd, Canada, 2001
Beef cattle1-162 head 2,410 4,535 2,740 63,460163-281 head 145 550 305 5,050282-425 head 55 160 60 1,645426 or more head 85 210 105 1,605All farm sizes 2,695 5,455 3,210 71,760
Dairy cows and heifers1-46 head 785 935 430 5,94547-81 head 1,405 1,785 380 4,87582-131 head 965 830 315 2,320132 or more head 385 505 150 1,065All farm sizes 3,540 4,055 1,275 14,205
Hogs1-565 head 425 570 315 5,405566-981 head 300 265 105 700982-1,594 head 450 320 85 7401,595 or more head 695 475 125 685All farm sizes 1,870 1,630 630 7,530
Beef cattle1-162 head 784.9 2,872.9 1,786.5 46,231.6163-281 head 428.5 1,714.8 967.7 15,774.2282-425 head 270.7 788.6 255.7 8,153.0426 or more head 1,060.2 4,747.3 1,188.7 17,102.0All farm sizes 2,544.3 10,123.7 4,198.6 87,260.8
Dairy cows and heifers1-46 head 588.8 651.9 237.9 3,378.447-81 head 1,910.0 2,369.2 517.4 6,303.082-131 head 2,047.7 1,667.8 717.2 4,889.7132 or more head 1,443.5 2,247.1 917.8 4,886.7All farm sizes 5,990.1 6,936.0 2,390.3 19,457.8
Hogs1-565 head 140.5 155.7 62.1 715.4566-981 head 260.3 220.3 91.6 580.3982-1,594 head 642.8 434.5 123.5 999.21,595 or more head 2,924.1 2,037.4 330.7 2,401.9All farm sizes 3,967.8 2,847.8 608.0 4,696.7
Size of herd
Number of farms with livestock
Manure produced on these farms (thousand tonnes)
Required by government regulations
Part of nutrient management
plan
Concerns for environment
No formal plan
Notes: 1. Where no error letter appears by a number the standard error ranges between 0.005% and 12.49%. Results are considered excellent to acceptable. 2. Due to rounding, figures may not add up to totals. Source: Statistics Canada, 2001 Farm Environmental Management Survey.

Farm Environmental Management in Canada Article 2: Manure Management in Canada, June 2004 Catalogue no. 21-021-MIE
- 51 -
Table B13: Beneficial management practices for manure management, Canada and provinces, 2001
Newfoundland and Labrador 105 X 0 X 75Prince Edward Island 340 X X X 435Nova Scotia 205 X X 390 1,370New Brunswick 265 200 45 600 730Quebec 12,435 4,660 155 7,585 1,290Ontario 6,175 6,485 570 13,975 16,170Manitoba 3,180 1,575 270 4,740 5,620Saskatchewan 2,885 1,855 1,500 13,375 24,305Alberta 5,280 3,815 330 11,735 21,085British Columbia 2,235 800 285 3,930 1,765Canada 33,105 19,895 3,205 56,645 72,845
Newfoundland and Labrador F X 0.0 X 30.1Prince Edward Island 316.9 290.3 X X 245.0Nova Scotia X X X 13.7 850.6New Brunswick 292.7 292.0 115.1 88.3 392.4Quebec 15,204.6 4,744.7 92.2 817.9 701.0Ontario 7,163.0 6,573.2 391.4 1,011.9 11,071.6Manitoba 4,929.0 2,233.1 257.6 564.2 5,093.0Saskatchewan 4,426.6 2,211.9 1,697.1 2,301.1 15,721.0Alberta 13,371.6 6,694.3 353.9 5,368.4 27,607.3British Columbia 3,518.2 879.7 267.5 1,510.0 1,606.1Canada 49,584.8 24,164.6 3,245.7 11,699.5 63,318.2
Manure produced on these farms (thousand tonnes)
Number of farms with livestock
Fully implemented
Partially implemented
Not available in my region
Not relevant for my farm
Unfamiliar with BMP
F Too unreliable to publish. X Suppressed to meet confidentiality requirements of the Statistics Act. Notes: 1. Where no error letter appears by a number the standard error ranges between 0.005% and 12.49%. Results are considered excellent to acceptable. 2. Due to rounding, figures may not add up to totals. Source: Statistics Canada, 2001 Farm Environmental Management Survey.

Farm Environmental Management in Canada Article 2: Manure Management in Canada, June 2004 Catalogue no. 21-021-MIE
- 52 -
Table B14: Beneficial management practices for manure management, by size of herd, Canada, 2001
Beef cattle1-162 head 16,410 11,750 1,455 9,395 36,405163-281 head 1,240 935 160 530 3,005282-425 head 590 265 X X 875426 or more head 615 320 X X 840All farm sizes 18,855 13,270 1,710 10,325 41,125
Dairy cows and heifers1-46 head 3,030 1,770 115 615 2,72047-81 head 4,040 2,195 180 265 1,81582-131 head 2,280 955 70 90 1,060132 or more head 1,005 385 30 25 650All farm sizes 10,355 5,305 395 995 6,245
Hogs1-565 head 1,430 1,030 115 900 3,560566-981 head 685 315 0 30 360982-1,594 head 840 280 X X 3501,595 or more head 1,120 270 X X 490All farm sizes 4,075 1,895 140 1,095 4,760
Beef cattle1-162 head 10,314.7 7,870.6 1,105.2 5,243.9 27,747.7163-281 head 3,965.4 2,808.1 465.5 1,685.8 9,397.6282-425 head 2,949.8 1,244.7 X X 4,276.7426 or more head 8,972.3 2,770.5 X X 9,855.9All farm sizes 26,202.2 14,693.9 2,095.5 9,942.0 51,277.9
Dairy cows and heifers1-46 head 1,985.5 1,135.4 69.7 265.4 1,409.947-81 head 5,355.3 2,803.7 240.5 344.7 2,391.682-131 head 4,758.0 2,008.5 134.1 202.0 2,270.8132 or more head 4,766.7 1,684.0 134.7 114.7 2,803.6All farm sizes 16,865.4 7,631.5 579.0 926.8 8,875.9
Hogs1-565 head 307.8 230.2 12.5 102.8 465.6566-981 head 578.9 280.2 0.0 22.3 285.4982-1,594 head 1,150.7 377.1 X X 524.91,595 or more head 4,084.1 826.5 X X 1,719.9All farm sizes 6,121.5 1,714.0 747.4 549.0 2,995.8
Size of herd
Manure produced on these farms (thousand tonnes)
Number of farms with livestock
Fully implemented
Partially implemented
Not available in my region
Not relevant for my farm
Unfamiliar with BMP
X Suppressed to meet confidentiality requirements of the Statistics Act. Notes 1. Where no error letter appears by a number the standard error ranges between 0.005% and 12.49%. Results are considered excellent to acceptable. 2. Due to rounding, figures may not add up to totals. Source: Statistics Canada, 2001 Farm Environmental Management Survey.